Embed Size (px)
Citation preview

Agenda item 4 STAT-EMPOWER-6 September 2009
Expert Consultation on Statistics in Support of Policies to Empower Small Farmers
Bangkok, Thailand, 8 -11 September 2009
SITUATION ASSESSMENT SURVEY
FOR FARM SECTOR POLICY FORMULATION IN INDIA
1

Situation Assessment Survey for farm sector policy formulation*
Rajiv Mehta Additional Director General, Survey Design and Research Division, National Sample Survey Organisation, Ministry of Statistics and Programme Implementation Govt. of India “Mahalanobis Bhawan” 164, G. L. T. Road, Kolkata, India Email: [email protected]
Summary In the recent past, the global agrarian economy experienced volatility in various
dimensions. The symptoms of food shortages have casted apprehensions on food security and efforts of hunger eradication. On the other hand, the economic condition of large number of farmers, mainly the small and marginal ones, continues to be fragile and not insulated to the adverse impacts of natural adversities as well as market uncertainties. The structural constraints associated with the farm sector, particularly in the developing economies, continue to impinge upon the livelihood and well being of its dependent population. Against this background, stability and sustainability of agricultural growth, along with the improvement in living conditions of the farming community is required to be the integral part of development policy. The availability of data and statistics on the diverse agrarian aspects becomes the backbone of such endeavour. This becomes a challenging task for the statistical system since the required data may not be readily available.
In the context of Indian agriculture, the core issues of the farm sector distress and related problems, with focus on small and marginal farmers are addressed in the contemporary development agenda and the first ever National Policy for Farmers was unveiled in the year 2007. As a precursor to this, specific statistical indicators on the socio economic aspects of farming were generated through a first of its kind nation-wide survey, the “Situation Assessment Survey of Farmers” conducted by the National Sample Survey Organisation in its 59th round(Jan – Dec 2003). The survey aimed to generate indicators on status of Indian farming to facilitate the policy synthesis. The paper delves into the distinctive features of Situation Assessment Survey, its genesis and its role in policy formulation.
* : Paper for FAO Expert Consultation on Statistics in Support of Policies to Empower Small Farmers (Bangkok, 8-11 September, 2009). Views expressed in this paper are of author
1. Introduction 1.1 Agriculture is important for very existence of life. Its growth and development is integral to the quest for food and nutrition security. Being an economic activity primarily factored around natural endowments of land and water, its growth needs to be balanced with sustainability and conservation of natural resources. Agriculture is also one of the more vulnerable sectors of the economy, often due to the complex combination of wide ranging factors, both intrinsic as well as extrinsic. However, be it climatic disturbance, stressed resources, sustainability, technological constraints, demographic pressures, shrinking sizes of farm enterprises or market aberrations, at the receiving end of their adverse affect on agriculture is invariably the farmer household. In case
Situation Assessment Survey for farm sector policy formulation- Rajiv Mehta Page 1

of developing countries, where the farm economy is largely of informal entrepreneurship with preponderance of small and marginal farm holdings, such vulnerabilities often breach the very subsistence and livelihood of farming communities. Hence the well being of the farmers, particularly, small and marginal ones, is central to the farm sector policies along with the strategies for sustaining food security.
1.2 Statistics play an important role in this process of policy formulation, planning and management of the sector. The discipline of agricultural statistics has matured to generate systematically an array of statistics and statistical indicators on various aspects of the sector such as land use for crop as well as non crop purposes, crop acreage, production, productivity and corresponding trends, cropping pattern, number and size class of farm entrepreneurs, consumption and corresponding demand supply analysis, price and market related statistics etc. Further detailing in the form of farm management statistics such as inputs, employment, cost of cultivation, institutional interventions and trade are also necessitated to undertake calibrated and more informed policy exercise and decision making.
1.3 Such statistical exercises have been put in place in varying degree of planning and policy requirements. However, there still remain some crucial gaps in such statistical profile, that relating to socio economic conditions of farmer households, interfacing with his farming activities. There are surveys to generate statistics on the aspects of household economy in rural and urban segmentations, with some farming classifications of rural households, but these surveys are not primarily oriented to reveal the socio economic aspects of farmer households in relation to farming and also in relation to their counterparts in rural as well as urban segments. It may be appreciated that there are structural rigidities associated with the farm sector and in the event of accelerated growth of overall economy, accentuation of disparities are apprehended. Further, the domain of farmer households in itself is heterogeneous. To meaningfully address the farm sector issues and the well being of the farmer household, the statistical profile of socio economic conditions of the farmers is a developmental priority, particularly in the predominantly agrarian economies.
1.4 Against this background, the large scale sample survey, “Situation Assessment Survey of Farmers (SAS)”, conducted in India in the year 2003 by the National Sample Survey Organisation (NSSO), was one of the exclusive socio economic surveys aimed at bridging the data gaps and provide statistical indicators for formulating farmer oriented policy. Subsequently, the National Policy for Farmers (NPF) was announced by the government in 2007, addressing issues emerging from the SAS findings. These issues eventually were taken note of while evolving the strategies and programmes of agriculture and rural sector in the 11th Five Year Plan (2007-2012). The following sections summerise the genesis of SAS, its features and key findings and finally the outlines the NPF and planning orientation.
2. Genesis of SAS 2003
2.1 As the cornerstone of country’s economic structure, agriculture remains catalyst in the overall economic and social development in India. Its growth continues to be essential, not only for ensuring food security of billion plus population but also for ensuring livelihood security to two thirds of country’s population that depends on agriculture. Agricultural development is also
Situation Assessment Survey for farm sector policy formulation- Rajiv Mehta Page 2
essential for poverty alleviation, rural employment generation and for stimulating sectoral contribution to the GDP, though this contribution has been steadily shrinking and is now of the order of 17% of the total GDP. 2.2 During the past five decades, the agriculture sector in India has been successful in keeping pace with the rising food demand of a growing population. The planning focus on accelerating food production with induction of technology, interventions and institutional interlay and development of farming infrastructure paid dividends by ushering multifaceted farm sector revolutions. There had been, from time to time, adjustments in the programmatic framework to expand the growth benefits over regions and crops. Specific focus on farming issues has all along remained an essential component of development agenda and farm related policies.
2.3 However, in the decade of nineties, the stress and stagnation in farm economy was becoming evident. The momentum of agricultural growth was slackening and the farm sector growth was found to be not making meaningful change in the economic condition of farmers. Indian agrarian space, that has vastness of 140 million hectares net sown area, of which about 60% being rain-fed, with about 120 million holdings, the average size of operation holdings being 1.3 hectare and 80 % of holdings being small and marginal ones (less than 2 hectares) was showing signs of exposing to various farm sector vulnerabilities. With the realization of accentuating distress in farm sector and the impact experienced by the domestic agriculture in the changing overall economic system in the emerging era of globalization and trade liberalization, a methodical policy synthesis and analysis of farm sector was felt necessary.
2.4 Coinciding with the dawn of new millennium, a comprehensive review of the farm economy was undertaken in three stages. Firstly, each component of the economy was systematically debated and studied by the professionals and experts under the mega project ‘State of the Indian Farmer : A Millennium Study’ sponsored by the Ministry of Agriculture, Govt. of India and these findings were documented in 27 volumes. At the second stage, the “Situation Assessment Survey of Farmers (SAS)”, was conceived to generate the data base on socio economic condition of farmer households, their farming aspects and its interface with their household economy. As stated earlier, such data was necessary to bridge the data gaps in the existing statistical system for providing needed inputs for farmer oriented policy formulation. This national wide survey was entrusted to NSSO by the Ministry of Agriculture. The policy analysis available through the ‘State of the Indian Farmer : A Millennium Study’ and the results of SAS were comprehensively looked into by a National Commission on Farmers, setup by the Ministry of Agriculture under the chairmanship of Prof. M. S. Swaminathan. This detailed exercise eventually culminated with the announcement of National Policy for Farmers (NFP) in 2007.
3. Salient features of SAS
3.1 The NSSO, incepted in 1950, is a premier integrated agency under the Ministry of Statistics and Programme Implementation (MoSPI), Government of India for designing and conducting large scale, nationwide multi-subject integrated sample surveys and subsequently processing, analyzing and reporting the results relating to various aspects of social, economic,
Situation Assessment Survey for farm sector policy formulation- Rajiv Mehta Page 3

demographic, industrial and agricultural statistics. These surveys are conducted in the form of its successive rounds covering specific subjects to meet the vital data needs of the government for its planning, policy formulation and decision making.
3.2 On the request of the Ministry of Agriculture, ‘Situation Assessment Survey of Farmers’, was carried out by the NSSO during January to December, 2003 as part of its 59th round to assess the well-being of farmer households, study their access to various resources, and judge the impact of technological change on Indian farming for meet the specific requirement of policy review. NSS 59th Round was a multi subject survey earmarked for the periodic subject coverage of household land and livestock holdings and all India debt and investment’ survey (AIDIS). The SAS was integrated with the sample design of 59th round and was carried out only in the rural sample since the agricultural activity is pre-dominantly a rural phenomenon and the diversity of farming activities as well as farmers’ situations is more pronounced the rural areas. Further, the SAS was covered through the Central sample of the round, though a couple of states also participated through the respective State sample.
3.3 Survey and reference period: The NSS 59th round survey period was 1st January 2003 to 31st December 2003 and data was collected relating to the fixed reference period of the agricultural year July 2002 – June 2003. In order to reduce the recall error, the total information relating to each sample household was programmed to be collected in two visits. The first visit (January to August) broadly covered the Kharif season of the agricultural year 2002 – 2003 and the second (September to December) the corresponding Rabi season. Further, the survey period of the round was divided into two sub-rounds. Sub-round one consisted of the first half of the survey period of each visit while sub-round two consisted of the remaining period.
3.4 Sample design and sample size: The sampling design of 59th round was the usual multistage stratified one, generally adopted in case of NSS demographic based surveys. Sampling frame for First Stage Units (FSU) for the rural areas was the list of villages (panchayat wards for Kerala) as per Population Census 1991. Districts were the strata for rural sample and in all 6848 villages were allocated to the FSU stratum in PPS to strata population. The rural FSU sampling also adopted the special sub stratification to enable representation of extreme small as well as large villages. In each selected FSU, sample of 8 farmer households, i.e., the second stage units (SSU) were selected for canvassing the SAS schedule 33, following 4 second stage stratification (SSS) to provide size class of land possessed.
3.5 The listing schedules (sch 0.0) was canvassed only in the first visit in the selected villages (first stage unit) and this provided the frame of SSUs. Specially designed SAS schedule - 33 was canvassed in independent sets of sample households. Identification of farmer household during listing as the SSU was one of the distinct feature of the survey. For this purpose, the terms “farmers” and “Farmer Household” were defined for the purpose of SAS.
3.6 In all, 51,770 farmer households spread over 6,638 villages were surveyed in the Central Sample.
3.7 Definition of Farmer and Farmer Household in SAS: A farmer was defined for SAS survey as a person who operated some land (owned or taken on lease or otherwise possessed) and is engaged in agricultural activities in broad sense of the term e.g. cultivation of field crops, horticultural crops, plantation, animal husbandry, poultry, fishery, piggery, bee-keeping,
Situation Assessment Survey for farm sector policy formulation- Rajiv Mehta Page 4

vermiculture, sericulture, etc., on that land during last 365 days. Those engaged in agricultural and allied activities but did not operate a piece of land were not classified as farmer. Thus agricultural labourer, coastal fisherman, rural artisans and persons engaged in agricultural services did not qualify as farmer.
3.8 The purpose of SAS was to probe into the activities and conditions of the farmers. Therefore, if during the reference period of last 365 days, a person had left his entire land as ‘current fallow’ by discretion or due to natural conditions, he was not qualified as farmer, since no meaningful information could be obtained in from such farmers who have kept their entire land as ‘current fallow’ during the reference period, such farmers were excluded from the coverage of the present SAS. This was a deliberate departure from conventional agricultural concepts followed generally in agricultural census. Thus, for a person to be considered as a farmer in SAS, he would have possessed some land and had engaged in agricultural activities on that land during the reference period. Further, agricultural activities of insignificant nature or agricultural activities done at a nominal scale were also not treated as agricultural activity for the purpose of this survey. 3.9 Farmer Households were those households with any its member was a farmer. This was also termed as households with farming activity. Farm business consisted of cultivation including orchards and plantation, and farming of animals such as dairy, rearing of sheep and goats, piggery, poultry, duckery, fishery, beekeeping
3.10 Logical framework of SAS and its Schedule 331: SAS was taken up for the first time in the NSS survey programme to serve as a benchmark database on Indian farmers and to meet specific requirements of farm policy formulation. As the purpose of SAS was a comprehensive assessment of the situation of farmers in the country, in several respect, it was a unique and distinct survey. It was focused to assess the well-being of farmer households, studying their access to various resources, and judge the impact of technological change on Indian farming. The SAS also sought to know the feelings of the farming communities on their profession of farming in different regions of the country, if they are satisfied or not with their profession. Statistics on such aspects had not been explored in the past. Besides, the SAS also focused on awareness, access and response of the farmers to various institutional interventions and initiatives in vogue for the development of agriculture sector. 3.11 Thus, the designing of survey instruments for SAS required evolving concepts and definitions and integration of diverse aspects of household economy, farm economy, endowments, institutional access and perceptions of farmers on farming etc. in a logical sequence. The derivatives from the SAS were in five broad aspects, the lines on which the reports of the survey were planned. This is given in the table below.
1 The SAS Schedule 33, concepts and definition used in the survey, details of sample design and estimation procedure are given in the NSS Reports. These reports are freely downloadable on registration from the NSSO – MoSPI website: www.mospi.gov.in
Situation Assessment Survey for farm sector policy formulation- Rajiv Mehta Page 5
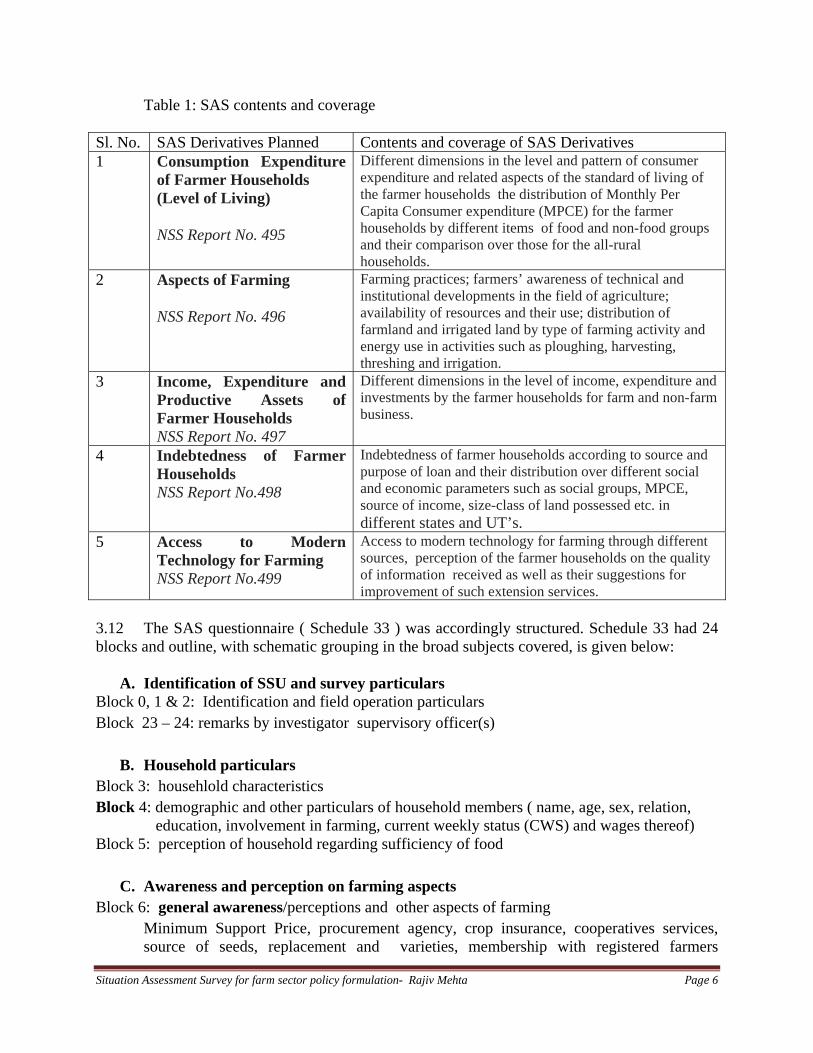
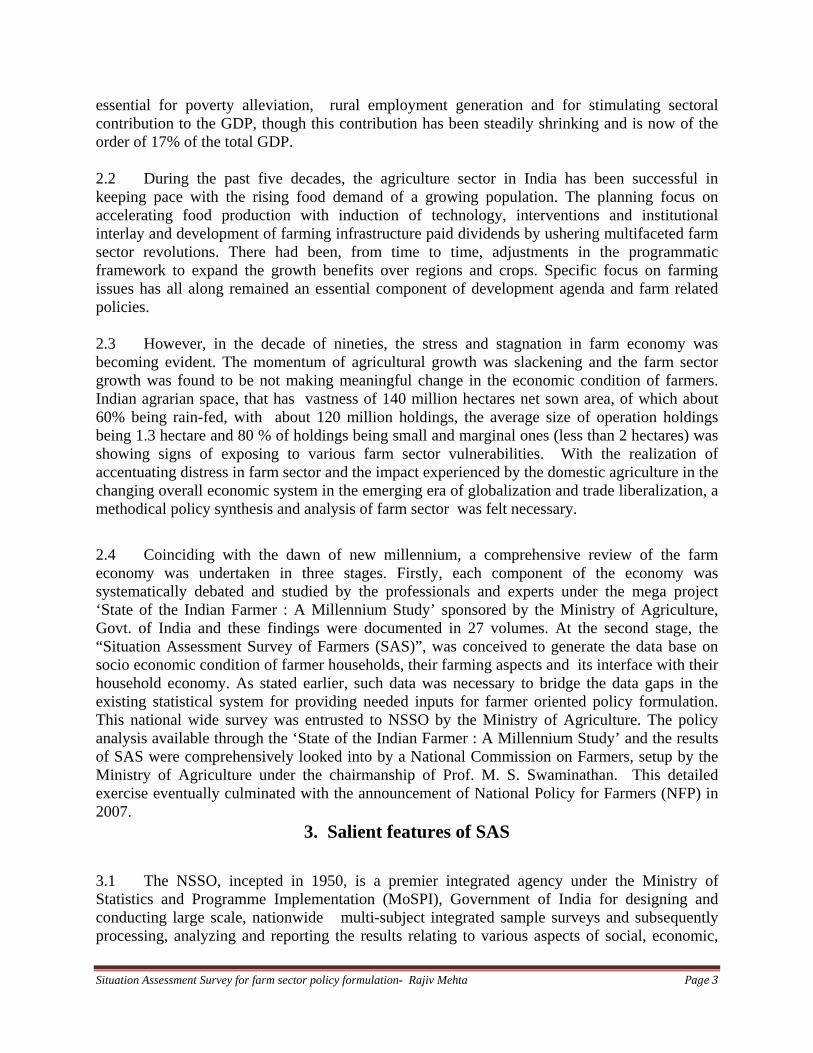
Table 1: SAS contents and coverage
Sl. No. SAS Derivatives Planned Contents and coverage of SAS Derivatives 1 Consumption Expenditure
of Farmer Households (Level of Living) NSS Report No. 495
Different dimensions in the level and pattern of consumer expenditure and related aspects of the standard of living of the farmer households the distribution of Monthly Per Capita Consumer expenditure (MPCE) for the farmer households by different items of food and non-food groups and their comparison over those for the all-rural households.
2 Aspects of Farming NSS Report No. 496
Farming practices; farmers’ awareness of technical and institutional developments in the field of agriculture; availability of resources and their use; distribution of farmland and irrigated land by type of farming activity and energy use in activities such as ploughing, harvesting, threshing and irrigation.
3 Income, Expenditure and Productive Assets of Farmer Households NSS Report No. 497
Different dimensions in the level of income, expenditure and investments by the farmer households for farm and non-farm business.
4 Indebtedness of Farmer Households NSS Report No.498
Indebtedness of farmer households according to source and purpose of loan and their distribution over different social and economic parameters such as social groups, MPCE, source of income, size-class of land possessed etc. in different states and UT’s.
5 Access to Modern Technology for Farming NSS Report No.499
Access to modern technology for farming through different sources, perception of the farmer households on the quality of information received as well as their suggestions for improvement of such extension services.
3.12 The SAS questionnaire ( Schedule 33 ) was accordingly structured. Schedule 33 had 24 blocks and outline, with schematic grouping in the broad subjects covered, is given below:
A. Identification of SSU and survey particulars Block 0, 1 & 2: Identification and field operation particulars Block 23 – 24: remarks by investigator supervisory officer(s)
B. Household particulars Block 3: househlold characteristics Block 4: demographic and other particulars of household members ( name, age, sex, relation,
education, involvement in farming, current weekly status (CWS) and wages thereof) Block 5: perception of household regarding sufficiency of food
C. Awareness and perception on farming aspects Block 6: general awareness/perceptions and other aspects of farming
Minimum Support Price, procurement agency, crop insurance, cooperatives services, source of seeds, replacement and varieties, membership with registered farmers
Situation Assessment Survey for farm sector policy formulation- Rajiv Mehta Page 6

organisation and self help group, awareness of World Trade Organisation (WTO) and liking farming profession.
D. Farming Resources and use
Block 7 to 9 : particulars of land possessed and used, and irrigation, farming resources used for cultivation
Block 10: use of energy during last 365 days Block 12: access to modern agricultural technology
E. Farmer Household Assets and Liabilities Block 11: loans and other payable liabilities , type of security, period, source, purpose, Block 13: purchase and sale of productive assets : Land , livestock and poultry, agricultural
machinery and implements, for non-farm business
F. Economics of farming and non farm bussiness Block 14 to 16: expenses and receipts for cultivation, farming of animals, non-farm business
G. Household level of living Block 18, to 22: consumption and expenditure of food, clothing and footwear, education and
medical (institutional) goods and services , miscellaneous goods and services including medical (non-institutional), rents and taxes, purchase and construction (including repair and maintenance) of durable goods for domestic use
4. Key Findings of SAS 2003
4.1 The results of the Situation Assessment Survey were brought out in five NSS reports:
Report No.495: Consumption Expenditure of Farmer Households Report No.496: Some Aspects of Farming Report No.497: Income, Expenditure and Productive Assets of Farmer Households Report No.498: Indebtedness of Farmer Households Report No.499: Access to Modern Technology for Farming
Some of those findings of SAS, which are generally not available from the general system of agricultural statistics and had policy implications are summarized as under: NSS Report No.495 Consumption Expenditure of Farmer Households
4.2 The NSSO is the prime data source for the level of living indicators in India, generated through the household consumer expenditure (HCE) surveys regularly conducted by it. The quinquennial HCE forms the basis for poverty estimation and it has comprehensive HCE schedule 1.0 with detailed breakup of commodities and services consumed by the household. However, in several socio economic enquiries such as SAS, the HCE as the classificatory characteristic is measured through the abridged worksheets.
Situation Assessment Survey for farm sector policy formulation- Rajiv Mehta Page 7

The main parameter estimated through HCE is monthly per capita consumer expenditure (MPCE). According to the latest quinquennial HCE surveys (NSS 61st Rd.), there is substantial divergence between the rural and urban MPCE and the former is about 40% lower than the later.
4.3 The SAS revealed that the average MPCE for farmer households at all India level during the year 2003 was Rs. 502.83 and was lower than the MPCE for all rural households by 9.3%. Though the difference in MPCE and all rural household MPCE is not very large (unlike the rural urban differentiation) there some distinct pattern in the consumption pattern (Table 2). Compared to all rural households, the farmer household consumption is lower in most of the consumption groups (market based goods and services) except in case of cereals and cereals substitutes and milk and milk products, which are often their own production.
Table 2: Break-up of MPCE for farmer households and all rural households by item groups: all-India. MPCE (Rs.) MPCE (Rs.)
Sl. no. item group farmer
hhds all
rural hhds
Sl. no. item group farmer
hhds all
rural hhds
1. cereals & cereal substitutes 101.27 99.17 2. fuel and light 46.58 51.20
2. pulses & their products 16.57 18.06 3. clothing & footwear 42.94 44.43 3. milk & milk products 48.71 44.76 4. education 16.83 16.26 4. edible oil 23.00 24.62 5. medical 34.40 38.87 5. egg, fish & meat 15.70 17.93 6. misc. consumer
goods 24.02 30.82 6. vegetables 30.60 35.29 7. misc. consumer
services 25.54 37.98 7. fruits 6.60 9.98 8. rent 0.40 2.38 8. sugar, salt and spices 21.42 24.30 9. taxes and cesses 0.99 1.11 9. beverages,
refreshments & processed food 14.87 24.45
10. durable goods 18.57
18.24
food total 278.74 298.57 non-food total 224.09 255.59 1. pan, tobacco &
intoxicants 13.83 14.28 all items 502.83 554.15
4.4 There were regional differentiations in the level of MPCE amongst the farmer households. This, though needs to be seen with the price differential in the domain, nevertheless, highest MPCE (Rs. 900) was in case of Kerala State and lowest (Rs. 353) was in Jharkhand, a tribal state in central India.
4.5 The results of SAS can be juxtaposed with other studies of rural societies for better understanding of differential in levels of living. From the point of view of land marginalization in farming communities, Kerala has lowest average land holding size, yet it has highest average MPCE. It had also been observed that Kerala has highest propensity of rural economic diversification (Mehta 2009) and amongst the lowest rural poverty. Thus the farming communities are heterogeneous, not only on account of their farming endowments and but also due to other socio economic factors.
Situation Assessment Survey for farm sector policy formulation- Rajiv Mehta Page 8
NSS Report No.496: Some Aspects of Farming
4.6 One of the most disquieting facts emerged out of the findings of SAS, corroborating the very genesis of SAS was that about 27% of farmers reported that they did not like the profession of farming because it was not profitable (Figure 1). In all, 40% of these felt that, given a choice, they would take up some other career.
Figure1: Percentage of farmers liking and disliking farming
like farming60%
not profitable27%
lacking social status
2%
risky8%
other reasons
3%
Source: Report No.496: Some Aspects of Farming
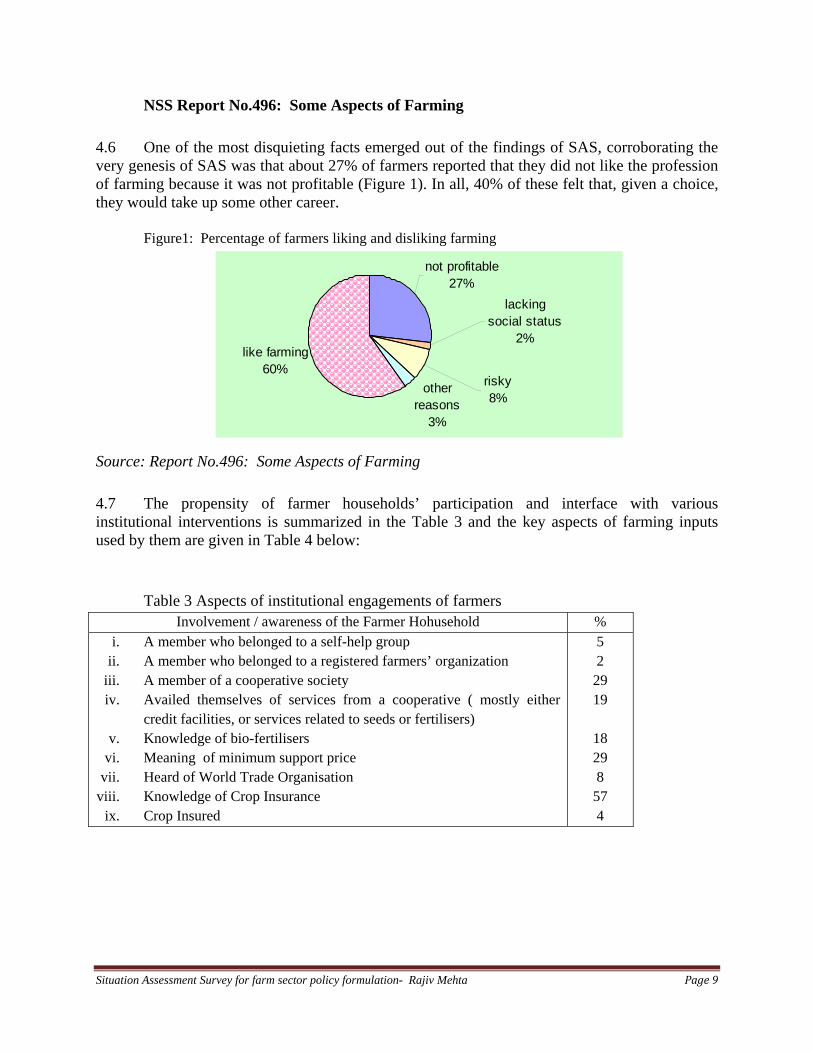
4.7 The propensity of farmer households’ participation and interface with various institutional interventions is summarized in the Table 3 and the key aspects of farming inputs used by them are given in Table 4 below:
Table 3 Aspects of institutional engagements of farmers
Involvement / awareness of the Farmer Hohusehold % i. A member who belonged to a self-help group
ii. A member who belonged to a registered farmers’ organization iii. A member of a cooperative society iv. Availed themselves of services from a cooperative ( mostly either
credit facilities, or services related to seeds or fertilisers) v. Knowledge of bio-fertilisers
vi. Meaning of minimum support price vii. Heard of World Trade Organisation
viii. Knowledge of Crop Insurance ix. Crop Insured
5 2
29 19
18 29 8
57 4
Situation Assessment Survey for farm sector policy formulation- Rajiv Mehta Page 9
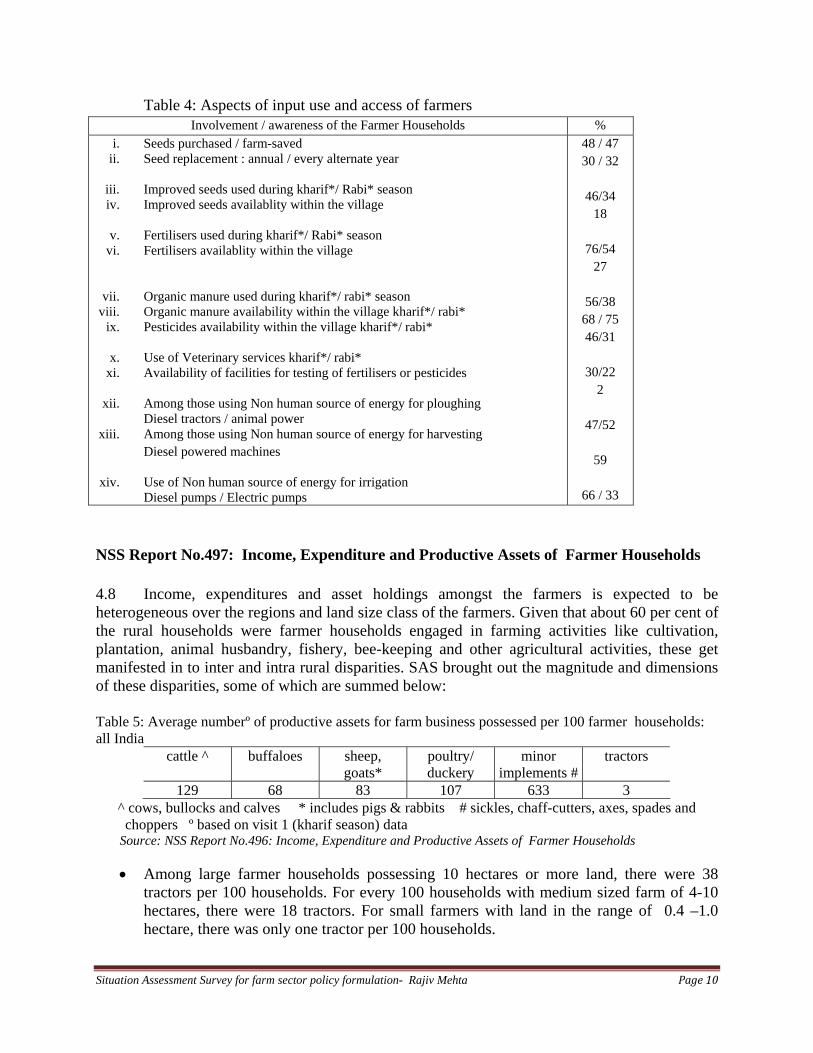
Table 4: Aspects of input use and access of farmers Involvement / awareness of the Farmer Households %
i. Seeds purchased / farm-saved ii. Seed replacement : annual / every alternate year
iii. Improved seeds used during kharif*/ Rabi* season iv. Improved seeds availablity within the village
v. Fertilisers used during kharif*/ Rabi* season
vi. Fertilisers availablity within the village
vii. Organic manure used during kharif*/ rabi* season viii. Organic manure availability within the village kharif*/ rabi*
ix. Pesticides availability within the village kharif*/ rabi*
x. Use of Veterinary services kharif*/ rabi* xi. Availability of facilities for testing of fertilisers or pesticides
xii. Among those using Non human source of energy for ploughing
Diesel tractors / animal power xiii. Among those using Non human source of energy for harvesting
Diesel powered machines
xiv. Use of Non human source of energy for irrigation Diesel pumps / Electric pumps
48 / 47 30 / 32
46/34
18
76/54 27
56/38
68 / 75 46/31
30/22
2
47/52
59
66 / 33
NSS Report No.497: Income, Expenditure and Productive Assets of Farmer Households 4.8 Income, expenditures and asset holdings amongst the farmers is expected to be heterogeneous over the regions and land size class of the farmers. Given that about 60 per cent of the rural households were farmer households engaged in farming activities like cultivation, plantation, animal husbandry, fishery, bee-keeping and other agricultural activities, these get manifested in to inter and intra rural disparities. SAS brought out the magnitude and dimensions of these disparities, some of which are summed below: Table 5: Average numberº of productive assets for farm business possessed per 100 farmer households: all India
cattle ^ buffaloes sheep, goats*
poultry/ duckery
minor implements #
tractors
129 68 83 107 633 3 ^ cows, bullocks and calves * includes pigs & rabbits # sickles, chaff-cutters, axes, spades and choppers º based on visit 1 (kharif season) data
Source: NSS Report No.496: Income, Expenditure and Productive Assets of Farmer Households • Among large farmer households possessing 10 hectares or more land, there were 38
tractors per 100 households. For every 100 households with medium sized farm of 4-10 hectares, there were 18 tractors. For small farmers with land in the range of 0.4 –1.0 hectare, there was only one tractor per 100 households.
Situation Assessment Survey for farm sector policy formulation- Rajiv Mehta Page 10

• Tribal farmer households possessed larger number of cattle heads compared to farmer households of other categories. There were 173 heads of cattle per 100 Tribal farmer households.
• Farmer households in the lowest monthly expenditure class or the poorest category had
31 buffaloes per 100 households, whereas the highest monthly expenditure class had 113 buffaloes per 100 households.
4.9 Breakup of farmer household income: Survey data on income are known to suffer from reporting biases and these seem to have affected at least some of the estimates, especially where very low and, sometimes, negative income estimates appear. However, one can have the idea of wage and non wage income of the households. According to SAS, the average monthly income of a farmer household (excl. rent, interest, dividend etc.) was estimated at Rs. 2115 of which major share accrued from from cultivation and wage earning. The non-farm business income was about 11% of total income (Figure-2).
Average monthly income of farmer households from different sources (Rs.)
0
200
400
600
800
1000
1200
819 969 91 236
Wages Cultivation Farming of animals
Non-farm business
Figure 2
Source: NSS Report No.497: Income, Expenditure and Productive Assets of Farmer Households 4.9 The income disparity, particularly in case of small and marginal farmers is evident in the table 6 below: Table 6 : Average monthly income from wages, farm business and non- farm business
per farmer household by land possessed during the agricultural year 2002-03
State average monthly income*(Rs.) from wages, farm business and non- farm business
Situation Assessment Survey for farm sector policy formulation- Rajiv Mehta Page 11

Source: NSS Report No.497: Income, Expenditure and Productive Assets of Farmer Households
size class of land possessed (hectares) < 0.01 0.01 -
0.40 0.41 –
1.00 1.01 –
2.00 2.01 –
4.00 4.01 –
10.00 >10.00 all sizes
(1) (2) (3) (4) (5) (6) (7) (8) (9) All-India 1380 1633 1809 2493 3589 5681 9667 2115
4.10 Of the average monthly expenditure incurred by farmer households in purchase and maintenance of productive assets, 81 percent went for farm related assets, 13 percent for residential building and 6 percent for non-farm business. About 58 percent of the farmers kept some kind of farm animals. Households engaged in dairying spent on an average Rs.814 per month on dairy farming. Farmer households who kept poultry spent on an average Rs.129 per month on poultry farming. 4.11 The break-up of the total annual cultivation expenses showed that 23 percent of the expenditure went for fertilizers and manure, 22 percent towards labour charges, 16 percent for seeds and 12 percent for irrigation (Figure 3).
Figure 3: Expenses on cultivation in rural India
Expenses on cultivation in rural India
seeds16%
pesticides7%
fertiliser/ manure
23%
irrigation12%
lease rent5%
other expenses
15%
labour22%
Source: NSS Report No.497: Income, Expenditure and Productive Assets of Farmer Households
NSS Report No 498: Indebtedness of Farmer Households
4.12 The findings of indebtedness of farmer households were very important for addressing the the prevailing perception of rural distress, particularly due to agrarian issues. The SAS found that 43.4 million out of 89.35 million farmer households (48.6%) were reported to be indebted, one third of
Situation Assessment Survey for farm sector policy formulation- Rajiv Mehta Page 12

them were found to be in three states, Uttar Pradesh (6.9 million), followed by Andhra Pradesh (4.9 million) and Maharashtra (3.6 million). Estimated prevalence of indebtedness among farmer households was highest in Andhra Pradesh (82.0%), followed by Tamil Nadu (74.5%) and Punjab (65.4%). Going by principal source of income, 57% farmer households were cultivators and among them 48% were indebted. 4.13 However, the prevalence of indebtedness was less in case of marginal farmers (Table: 7 ). Households with 1 hectare or less land accounted for 66% of all farmer households. About 45% of them were indebted.
Table 7 : Estimated number of total and indebted farmer households in each land possessed
size class of land
possessed
estimated number of
farmer households
(’00)
percentage of farmer
households
estimated number of indebted
farmer households (’00)
percentage of indebted
farmer households
prevalence rate of
indebtedness (percentage)
(1) (2) (3) (4) (5) (6) < 0.01 12594 1.4 5708 1.3 45.3
0.01 - 0.40 292867 32.8 130112 30.0 44.4 0.41 - 1.00 283610 31.7 129211 29.8 45.6 1.01 – 2.00 160600 18.0 81920 18.8 51.0 2.01 – 4.00 93504 10.5 54409 12.5 58.2 4.01 – 10.00 42581 4.8 27734 6.4 65.1
10.00 + 7748 0.8 5148 1.2 66.4 all sizes 893504 100.0 434242 100.0 48.6
4.14 More than 50% of indebted farmer households had taken loan for the purpose of capital or current expenditure in farm business. Such loans accounted for 584 rupees out of every 1000 rupees of outstanding loan. Marriages and ceremonies accounted for 111 rupees per 1000 rupees of outstanding loans of farmer households. Among the states the proportion was highest in Bihar (229 rupees per 1000 rupees), followed by Rajasthan (176 rupees per 1000 rupees).
4.15 The most important source of loan in terms of percentage of outstanding loan amount was banks (36%), followed by moneylenders (26%). However, the access of credit from money lenders / non institutional financers was relatively higher in case of small and marginal farmers. The flow of institutional credit, on the other hand was more for medium and large farmers. NSS Report No 499 Access to Modern Technology for Farming, 2003 4.16 ‘Access to Modern Technology for Farming’ covered three aspects of access: access to source of information, effectiveness of the source in terms of adoption and subjective assessment of the source in terms of quality. The sources themselves can be divided according to (a) whether it is multi-purpose or specialised one and (b) whether it involves one-way or two-way
Situation Assessment Survey for farm sector policy formulation- Rajiv Mehta Page 13

interactions. Thus, Radio, TV and Newspaper are multi-purpose, one-way communication sources; Village fairs are two-way but multi-purpose sources; Participation in training, Krishi Vigyan Kendra, Government demonstration and Farmers’ study tours again provide specialised two-way interactive sources while Extension worker and Para-technician/ private agency /NGO provide two-way, specialised and farmer-specific services. So are Input dealers, Other progressive farmers, Credit agencies, Primary cooperative societies and output buyers/food processors.
i. At all-India level, 40% of farmer households accessed various sources of information for Modern Technology for Farming.
ii. Of the sixteen different sources canvassed for accessing information for Modern
Technology for Farming, the most popular was ‘other progressive farmers’ with percentage of farmer households accessing information through the source as 16.7%, followed by input dealer (13.1%) and radio (13.0%).
iii. There was regional differentiation in accessing information. Highest percentage of farmer
households accessing information through ‘other progressive farmers’ was in Andhra Pradesh (34%), followed by Gujarat (30%) and West Bengal (25%) while the percentage of farmer households accessing information through ‘input dealers’ was highest in West Bengal (36%), followed by Andhra Pradesh (30%) and Gujarat (24%). Percentage of farmer households accessing information through ‘radio’ was highest in Jammu & Kashmir (36%), followed by Kerala (31%) and Assam (29%).
iv. The two most popular sources, namely ‘other progressive farmers’ and ‘input dealer’
were contacted by the farmer households mainly on ‘need basis’ or ‘seasonally’.
v. Among the farmer households accessing information for cultivation from ‘other progressive farmers’, 40% received information on ‘improved seed variety’, 31% on ‘fertiliser application’, 15% on ‘plant protection’ and 14% on ‘others’.
5. Special issues concerning small and marginal farmers 5.1 The farm sector has internal disparities due to which economic conditions within the sector itself are uneven. These disparities are in varying cross sections of agrarian structure. Horizontally, the endowments and resources such as land quality, irrigation, agro- climatic and socio economic conditions provide differentiated opportunities to farmers in different regions. Vertically, there is highly skewed distribution of land, leading to marginalization of farm holdings. Preponderance of small farm holdings is a distinct characteristic of Indian agriculture. Average size of operational holding in Indian agriculture has been gradually falling due to population pressure and fragmentation of holdings. According to the agriculture census, the total number of operation holdings have increased from 116 million in 199-96 to 121 million in 2000-01 and the average holding size has shrunk from 1.41 hectare to only 1.32 hectare (Table-8). The marginal holdings (less than 1 hectare) and small holdings (1.0 to 2.0 hectares) are 63.5% and 19% respectively. The skewed distribution of land amongst the land classes is also evident.
Situation Assessment Survey for farm sector policy formulation- Rajiv Mehta Page 14
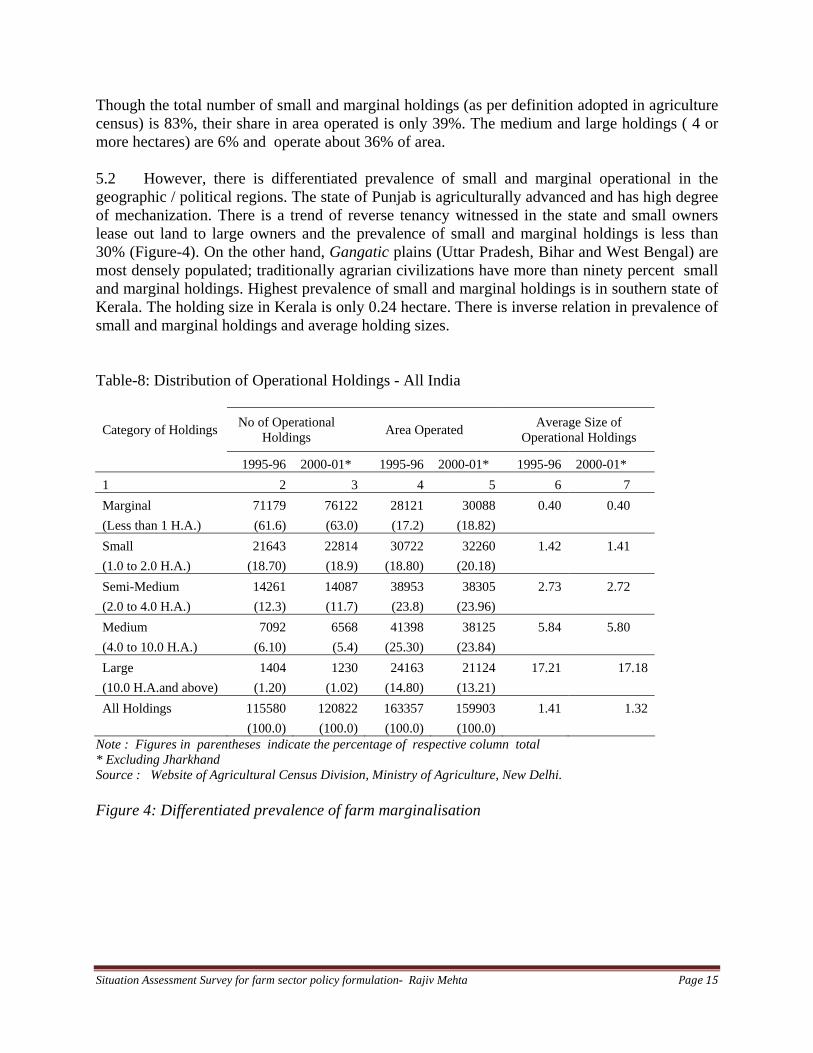
Though the total number of small and marginal holdings (as per definition adopted in agriculture census) is 83%, their share in area operated is only 39%. The medium and large holdings ( 4 or more hectares) are 6% and operate about 36% of area.
5.2 However, there is differentiated prevalence of small and marginal operational in the geographic / political regions. The state of Punjab is agriculturally advanced and has high degree of mechanization. There is a trend of reverse tenancy witnessed in the state and small owners lease out land to large owners and the prevalence of small and marginal holdings is less than 30% (Figure-4). On the other hand, Gangatic plains (Uttar Pradesh, Bihar and West Bengal) are most densely populated; traditionally agrarian civilizations have more than ninety percent small and marginal holdings. Highest prevalence of small and marginal holdings is in southern state of Kerala. The holding size in Kerala is only 0.24 hectare. There is inverse relation in prevalence of small and marginal holdings and average holding sizes.
Table-8: Distribution of Operational Holdings - All India
Category of Holdings No of Operational Holdings Area Operated Average Size of
Operational Holdings
1995-96 2000-01* 1995-96 2000-01* 1995-96 2000-01* 1 2 3 4 5 6 7 Marginal 71179 76122 28121 30088 0.40 0.40 (Less than 1 H.A.) (61.6) (63.0) (17.2) (18.82) Small 21643 22814 30722 32260 1.42 1.41 (1.0 to 2.0 H.A.) (18.70) (18.9) (18.80) (20.18) Semi-Medium 14261 14087 38953 38305 2.73 2.72 (2.0 to 4.0 H.A.) (12.3) (11.7) (23.8) (23.96) Medium 7092 6568 41398 38125 5.84 5.80 (4.0 to 10.0 H.A.) (6.10) (5.4) (25.30) (23.84) Large 1404 1230 24163 21124 17.21 17.18 (10.0 H.A.and above) (1.20) (1.02) (14.80) (13.21) All Holdings 115580 120822 163357 159903 1.41 1.32 (100.0) (100.0) (100.0) (100.0)
Note : Figures in parentheses indicate the percentage of respective column total * Excluding Jharkhand Source : Website of Agricultural Census Division, Ministry of Agriculture, New Delhi. Figure 4: Differentiated prevalence of farm marginalisation
Situation Assessment Survey for farm sector policy formulation- Rajiv Mehta Page 15

5.3 The marginalization of operational holdings has uneven impact in the household economy of farmers. As seen from the Table 4 in the previous section, the SAS revealed that the average monthly income of the farmer households with marginal land possession (less than 1 hectare) was only Rs. 1809 or less, lower than overall average of Rs 2115. For large holding households (10 hectare or more) the income was estimated at about Rs 10,000. Total farmer households with less than 2 hectare land possession, according to SAS, was 90.4. Their share in total aggregate income of all the farmer household was only 68.4%. The residual medium and large land possessing households, though, were only 9.6%, they accounted for 31.6 % of total income accrued to all the farmer household. This skewed distribution of income in the farm household economy, when viewed in conjunction with the income disparity between farm and non farm sector; i.e. two third population dependent on agriculture with less than one fifth share in GDP, the income and economic condition disparity in the total domain assumes alarming proportion and heightens the extreme marginalization of small and marginal farmers. 5.4 It is also to be considered here that marginalization in farmers domain is beyond the measures of land holding. It should be seen more in the context of household income. Small / marginal holding farmers can have better income than their counterparts due to several factors. As seen from Figure 4, Punjab and Kerala are two extremes in the average size of holdings and percentage of small and marginal holdings. Punjab has 29.7 % holdings in small and marginal classification with average land holding size 4.03 hectare, while Kerala has 98% land holdings of small and marginal nature with average holding of only 0.24 hectare. However, an interesting fact has emerged from SAS in case of these two extreme states. Average farmers household income was not highest in case of Punjab but for Jammu & Kashmir (Rs. 5488 & avg. holding size 0.67 hectare) and Punjab is second in terms of household income (Rs. 4960) followed by Kerala (Rs 4004). Thus two of the first three highest household income states are amongst the highest prevalence of small and marginal land holdings. 5. 5 One of the catalysts for such a phenomenon is the degree of rural livelihood diversification that sets aside the economic disadvantage of land distribution in the farm economy. The direct impact of such diversification on addressing the rural poverty has been studied and inferred (Mehta 2009). While in Kerala, the rural diversification is in conjunction with high literacy and development of service sector and its reach in rural area, elsewhere, the it is the push factor that prompts rural nonfarm employment (RNFE) amongst the marginal
Situation Assessment Survey for farm sector policy formulation- Rajiv Mehta Page 16

farmers. Secondly, if the farmers are growing high value crops, even with small holdings, they may be better off. These aspect also are relevant to measure marginalization in farm economy and to address the issues for small and marginal farmers in policy framework.
6. Post SAS, Farm Sector Policy Reorientation 6.1 The SAS met its objective of generating indicators on various socio-economic aspects of farm sector, involving farmer households. One of the main goals of farm sector policies is to ensure sustainability of food security, keeping pace with the growing population and their consumption dynamics. For this, besides resource and endowment management, technological support and institutional delivery system, paramount is the entrepreneurship of farming communities. The disorientation of farming community towards their profession, as reflected by SAS that 40% of them inclined to switchover their profession, given a choice and 27% not liking the profession as it was not profitable, is a matter of concern for strategic framework the for development and growth of agricultural sector. 6.2 The SAS probed deeply the specific aspects of farming and access to technology. These are the areas having direct bearing on production gains expected from the sector. The ground realities on use of inputs such as seeds and its replacement by farmers, their less promising interaction and engagement with institutions including NGOs and resultant continued slackness in their economic condition, and prevalence of indebtedness in farming communities corroborated the reported distress in their domain. Prof. G.S. Bhalla (2006), the noted agricultural economist had aptly summarized the outcome of SAS, stating “the Situation Assessment Survey of the farmers has clearly brought out the rather dismal state of affairs regarding knowledge and awareness of farmers. It has also brought out that the agricultural sector is in a serious crisis and that diring 2003 a vast majority of small and marginal farmer households in most of the states were hardly able to make both ends meet.” 6.3 In this background of “wakeup call”, as termed by the National Commission on Farmers, a new paradigm was evolved in the farm sector policy formulation in India. Hitherto, the policy and programmae were oriented to sectoral growth, production, productivity, resource augmentation and backward and forward linkages with focus on food security. The National Policy for Farmers (NPF), announced by the Government of India in 2007 gave the farm sector policy formulation a distinct dimension, keeping wellbeing of farmers as one of its central theme. On the need for such reorientation, the policy stated “there is a need to focus more on the economic well-being of the farmers, rather than just on production. Socio-economic well-being must be a prime consideration of agricultural policy, besides production and growth. The aim of the Policy is, therefore, to stimulate attitudes and actions which should result in assessing agricultural progress in terms of improvement in the income of farm families, not only to meet their consumption requirements but also to enhance their capacity to invest in farm related activities.” Major goals of the NPE are:
(i) To improve economic viability of farming by substantially increasing the net income of
farmers and to ensure that agricultural progress is measured by advances made in this income.
Situation Assessment Survey for farm sector policy formulation- Rajiv Mehta Page 17

(ii) To protect and improve land, water, bio-diversity and genetic resources essential for
sustained increase in the productivity, profitability and stability of major farming systems by creating an economic stake in conservation.
(iii) To develop support services including provision for seeds, irrigation, power, machinery
and implements, fertilizers and credit at affordable prices in adequate quantity for farmers. (iv) To strengthen the bio-security of crops, farm animals, fish and forest trees for
safeguarding the livelihood and income security of farmer families and the health and trade security of the nation.
(v) To provide appropriate price and trade policy mechanisms to enhance farmers’ income. (vi) To provide for suitable risk management measures for adequate and timely compensation
to farmers. (vii) To complete the unfinished agenda in land reforms and to initiate comprehensive asset
and aquarian reforms. (viii) To mainstream the human and gender dimension in all farm policies and programmes. (ix) To pay explicit attention to sustainable rural livelihoods. (x) To foster community-centred food, water and energy security systems in rural India and
to ensure nutrition security at the level of every child, woman and man. (xi) To introduce measures which can help attract and retain youths in farming and
processing of farm products for higher value addition by making it intellectually stimulating and economically rewarding.
(xii) To make India a global outsourcing hub in the production and supply of the inputs needed
for sustainable agriculture, products and processes developed through biotechnology and Information and Communication Technology (ICT).
(xiii) To restructure the agricultural curriculum and pedagogic methodologies for enabling
every farm and home science graduate to become an entrepreneur and to make agricultural education gender sensitive.
(xiv) To develop and introduce a social security system for farmers. (xv) To provide appropriate opportunities in adequate measure for non-farm employment for
the farm households. 6.4 In consonance with the goals in the NPF, the focus of 11th Five Year Plan (2007-12) is for achieving accelerated, broad based and inclusive growth, aiming to faster reduction in
Situation Assessment Survey for farm sector policy formulation- Rajiv Mehta Page 18

poverty and helping to bridge the divide in the economic conditions amongst different segments of population. Towards this end, several initiatives have been taken to have broad based sustainable growth in agriculture. The initiatives such a National Agricultural Development Plan (Rashtriya Krishi Vikas Yojana – RKVY), National Food Secure Mission, National Rural Employment Guarantee Scheme (NREGS), National Horticulture Mission, Rural Health Mission, Skill Development etc. are aimed at multidimensional agricultural and rural social development. The emphasis on seed replacement and seed treatment has shown encouraging production response. Institutional role in the areas have been revamped and their delivery has been simplified. The marketing and price mechanism has been strengthened for ensuring better returns to the farmers. 6.5 The comprehensive strategy for inclusive development, building on the strengths and addressing weaknesses has been inbuilt in the planning process and in this endeavour, SAS played the important role by providing the socio economic statistical profile of farmers and their responses to various farming issues household to address the specific areas of concerns in the agrarian and rural economy.
**** References
Bhalla G. S. (2006) , Condition of Indian Peasantry, National Book Trust, India
Government of India (2005) Situation Assessment Survey of Farmers - Consumption Expenditure of Farmer Households , NSS report 495 National Sample Survey Organization, Ministry of Statistics and Program Implementation, New Delhi.
Government of India (2005) Situation Assessment Survey of Farmers - Some Aspects of Farming, NSS report 496 National Sample Survey Organization, Ministry of Statistics and Program Implementation, New Delhi.
Government of India (2005) Situation Assessment Survey of Farmers - Income, Expenditure and Productive Assets of Farmer Households, NSS report 497 National Sample Survey Organization, Ministry of Statistics and Program Implementation, New Delhi.
Government of India (2005) Situation Assessment Survey of Farmers - Indebtedness of Farmer Households , NSS report 498 National Sample Survey Organization, Ministry of Statistics and Program Implementation, New Delhi.
Government of India (2005) Situation Assessment Survey of Farmers - Access to Modern Technology for Farming, NSS report 499 National Sample Survey Organization, Ministry of Statistics and Program Implementation, New Delhi
Government of India (2007) Serving Farmers and Saving Farming- Towards Faster and More Inclusive Growth of Farmers’ Welfare, Reports of the National Commission on Farmers, Ministry of Agriculture, Govt. of India
Situation Assessment Survey for farm sector policy formulation- Rajiv Mehta Page 19

Government of India (2007), National Policy for Farmers, Ministry of Agriculture, Govt. of India
Government of India (2008), 11th Five Year Plan (2007-12), Planning Commission
Mehta Rajiv (2009) Rural Livelihood Diversification and its Measurement Issues: Focus India Wye City Group on Rural Statistics and Agricultural Household Income, Second Meeting, 11-12 June 2009, FAO, Rome.
-------
Situation Assessment Survey for farm sector policy formulation- Rajiv Mehta Page 20