Embed Size (px)
Citation preview
RESEARCH ARTICLE
Site-specific gene expression profiling as a
novel strategy for unravelling keloid disease
pathobiology
N. Jumper1, T. Hodgkinson1,2, R. Paus3, A. Bayat1,3*
1 Plastic and Reconstructive Surgery Research, University of Manchester, Oxford Rd, Manchester, United
Kingdom, 2 Centre for Tissue Injury and Repair, University of Manchester, and MAHSC, Manchester, United
Kingdom, 3 Centre for Dermatology Research, University of Manchester, and MAHSC, Manchester, United
Kingdom
Abstract
Keloid disease (KD) is a fibroproliferative cutaneous tumour characterised by heterogeneity,
excess collagen deposition and aggressive local invasion. Lack of a validated animal model
and resistance to a multitude of current therapies has resulted in unsatisfactory clinical out-
comes of KD management. In order to address KD from a new perspective, we applied for
the first time a site-specific in situ microdissection and gene expression profiling approach,
through combined laser capture microdissection and transcriptomic array. The aim here
was to analyse the utility of this approach compared with established methods of investiga-
tion, including whole tissue biopsy and monolayer cell culture techniques. This study was
designed to approach KD from a hypothesis-free and compartment-specific angle, using
state-of-the-art microdissection and gene expression profiling technology. We sought to
characterise expression differences between specific keloid lesional sites and elucidate
potential contributions of significantly dysregulated genes to mechanisms underlying keloid
pathobiology, thus informing future explorative research into KD. Here, we highlight the
advantages of our in situ microdissection strategy in generating expression data with
improved sensitivity and accuracy over traditional methods. This methodological approach
supports an active role for the epidermis in the pathogenesis of KD through identification of
genes and upstream regulators implicated in epithelial-mesenchymal transition, inflamma-
tion and immune modulation. We describe dermal expression patterns crucial to collagen
deposition that are associated with TGFβ-mediated signalling, which have not previously
been examined in KD. Additionally, this study supports the previously proposed presence of
a cancer-like stem cell population in KD and explores the possible contribution of gene dys-
regulation to the resistance of KD to conventional therapy. Through this innovative in situ
microdissection gene profiling approach, we provide better-defined gene signatures of dis-
tinct KD regions, thereby addressing KD heterogeneity, facilitating differential diagnosis with
other cutaneous fibroses via transcriptional fingerprinting, and highlighting key areas for
future KD research.
PLOS ONE | DOI:10.1371/journal.pone.0172955 March 3, 2017 1 / 33
a1111111111
a1111111111
a1111111111
a1111111111
a1111111111
OPENACCESS
Citation: Jumper N, Hodgkinson T, Paus R, Bayat
A (2017) Site-specific gene expression profiling as
a novel strategy for unravelling keloid disease
pathobiology. PLoS ONE 12(3): e0172955.
doi:10.1371/journal.pone.0172955
Editor: Michael A. Tangrea, Sinai Hospital, UNITED
STATES
Received: August 1, 2016
Accepted: February 13, 2017
Published: March 3, 2017
Copyright: © 2017 Jumper et al. This is an open
access article distributed under the terms of the
Creative Commons Attribution License, which
permits unrestricted use, distribution, and
reproduction in any medium, provided the original
author and source are credited.
Data Availability Statement: All microarray files
are available from the ArrayExpress database
(accession number(s) E-MTAB-4945 (identifier)).
Funding: Industry funded (GlaxoSmithKline). The
funders had no role in study design, data collection
and analysis, decision to publish, or preparation of
the manuscript.
Competing interests: GlaxoSmithKline partially
funded this research but there are no financial
competing interests, non-financial, personal or
professional competing interests and does not alter
Introduction
Keloid disease (KD) is a fibroproliferative cutaneous tumour of ill-defined pathogenesis
characterised by clinical, behavioural and histological heterogeneity [1]. Keloid scars, con-
sisting mostly of hyalinised collagen bundles, spread beyond the boundaries of the original
wound resulting in “claw-like” or “cheloide” invasions into adjacent normal skin. KD
research has been hindered by lack of a validated animal model, a paucity of tissue for
experimentation secondary to ethical concerns over high rates of recurrence following
excision [2] and both inter-patient and inter-lesional heterogeneity [3]. The multitude of
available therapies, including first-line non-invasive treatments (compression garments,
physiotherapy, camouflage), second-line treatments such as corticosteroid injection or
cryotherapy and more extreme experimental agents including chemotherapy and radio-
therapy, indicate the lack a gold standard effective treatment option for KD [4]. In an effort
to overcome this, our previous studies including others have considered KD in terms of
different lesional sites within the keloid scar: intralesional (centre), perilesional (margin)
and extralesional (adjacent normal skin) [5].
The evidence for site-specific KD is threefold. Macroscopically, the centre is often pale soft
and shrunken when compared with the raised erythematous margin. Microscopically, there
are differences with respect to epidermal thickness, inflammatory infiltrate, collagen ratios and
cellularity [6, 7]. Finally, on a molecular level, these sites have been shown to differ with regard
to cell cycle phase and apoptotic factor expression [8]. While this site-specific approach has
highlighted the diversity within KD, the use of whole tissue biopsy and monolayer culture fail
to accurately reflect the in situ expression of this unique 3D microenvironment.
Therefore, in addition to site-specific, the second aspect of our approach was to examine insitu signalling. We achieved this by combining laser capture microdissection (LCM) and tran-
scriptomic array profiling (Fig 1A). To date, LCM has played a limited role in cutaneous
wound healing but given its success both in other areas of fibrosis research as well as benign
and malignant dermatological conditions [9–11], we felt it was an ideal methodological plat-
form for application to KD. This approach also allowed us to focus on individual expression in
different regions of the keloid scar without the need for “averaging out” of signals commonly
consequential to whole tissue biopsy analysis or the altered expression that can result from the
in vitro environment of monolayer cell culture [12].
The overall aim of this study was not to validate specific theories but to apply an innovative
hypothesis-free and compartment-specific approach to KD. Thus, the first aim was to compare
this combined LCM and microarray (in situ) approach to both whole tissue biopsy and mono-
layer culture methods of analysing gene expression (Fig 1B). The second aim was to enrich the
data in terms of gene ontology, in an effort to explore the biological processes within different
lesional sites of the keloid scar. Finally, we aimed to examine differentially expressed genes
(DEG) from each site of both epidermis and dermis compared with micro-dissected normal
skin (NS), to identify pathways for potential diagnostic and therapeutic exploitation.
We show that our in situ approach most accurately reflects the in vivo environment without
missing functionally important DEG through dilution and averaging out. These DEG indicate
an activated epidermis with a potential for epithelial-mesenchymal transition (EMT) and
expose dermal collagen-promoting molecules of which TGFβ is an integral component but
which remain overlooked in KD. The sensitivity of this technique allowed us to unveil another
piece of the complex inflammatory network contributing to KD, unravel some of the elements
contributing to therapeutic resistance and strengthen the argument for a stem cell population
in KD [13].
Site-specific analysis of keloid disease
PLOS ONE | DOI:10.1371/journal.pone.0172955 March 3, 2017 2 / 33
our adherence to all PLOS ONE policies on sharing
data and materials.
Abbreviations: DEG, differentially expressed
genes; ECM, extracellular matrix; EMI, epithelial-
mesenchymal interactions; EMT, epithelial-
mesenchymal transition; IL, interleukin; KD, keloid;
Kd, keloid dermis; KE, keloid epidermis; LCM, laser
capture microdissection; MET, mesenchymal-
epithelial transition; NS, normal skin; disease; TGF,
transforming growth factor; UV, ultraviolet; 2D, 2-
dimensional.

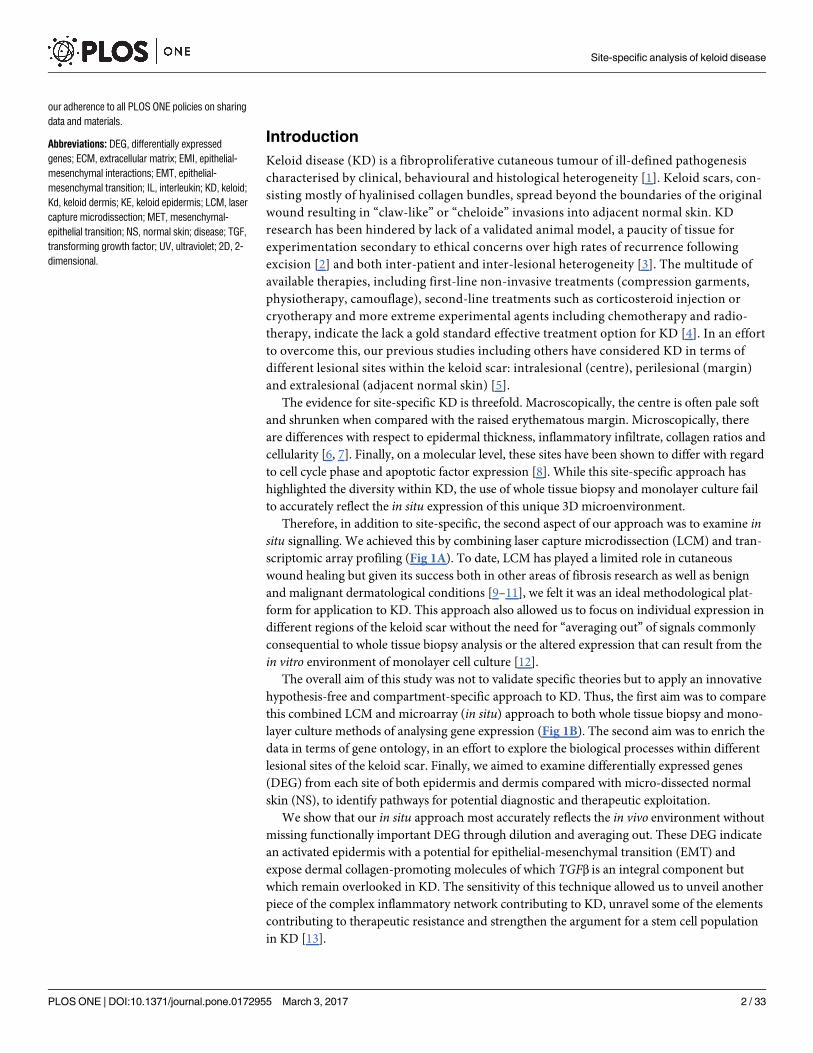
Fig 1. Experimental approaches for the comparison of site-specific keloid disease with normal skin.
A) Schematic diagram demonstrating laser capture microdissection (LCM) of epidermis and dermis for each
of the shown keloid biopsy sites, centre (intralesional), margin (perilesional) and keloid-adjacent normal skin
(extralesional). LCM was performed for keloid sites and normal skin. As shown, the elements pertaining to
portions of each compartment (epidermis separate to dermis) were delineated, cut using ultraviolet (UV) laser
and catapulted into the cap of an overhanging tube, where images confirmed their presence. This was then
immersed in lysis buffer and stored at -80˚C. B) The three methods of experimental technique used to
Site-specific analysis of keloid disease
PLOS ONE | DOI:10.1371/journal.pone.0172955 March 3, 2017 3 / 33
Materials and methods
Study approval
Keloid and NS tissue were harvested at the time of surgery following full verbal and written
consent obtained in accordance with the Declaration of Helsinki. The North West Research
Ethics Committee (NorthWest of England, UK) approved this specific study (ethical Reference
number. 11/NW/0683). In total there were 8 of each NS and keloid tissue donors used for
microarray, with additional samples included for supporting data (S1 Table). The scar was
considered to be keloid if it fulfilled the following criteria: growth beyond the boundaries of
the original wound, failure to regress with time, present for at least one year and lesions that
would recur with excision alone [14, 15].
Tissue processing
Tissue biopsies were taken from keloid scar centre, margin and extralesional sites (Fig 1A). NS
biopsies were from patients undergoing routine non-oncologic elective surgery. Biopsies were
immediately preserved in either RNA stabilisation solution (RNAlater1, Life technologies
Ltd, Paisley, UK) or 10% (v/v) neutral buffered formalin (Sigma-Aldrich, UK). The RNA stabi-
lised samples were OCT (optimum cutting temperature)-embedded (CellPath, UK) and snap
frozen before being stored at -80˚C.
Laser capture microdissection
Serial 8μm cryosections (Leica CM3050S, UK) of OCT-embedded keloid and NS samples were
cut onto specialised polyethylene naphthalate (PEN) membrane slides (Carl Zeiss, UK). To differ-
entiate epidermis from dermis, whilst preserving tissue RNA integrity, a rapid staining protocol
was performed (LCM Staining Kit, Ambion, Austin TX, USA) according to the manufacturer’s
instructions [16, 17]. Using a P.A.L.M. LCM microscope (Carl Zeiss MicroBeam 4.2, Germany)
epidermis and dermis of each sample was laser cut and catapulted away from the slide into sepa-
rate overhanging microtube caps (AdhesiveCap 200 Opaque, Carl Zeiss Microscopy Ltd, Cam-
bridge, UK). Multiple ‘elements’ were captured from each tissue section of least three sequential
sections from each patient, ensuring adequate biological representation. The captured tissue was
mixed with lysis buffer (Buffer RLT with 1% 2-mercaptoethanol, RNeasy Micro Kit, Qiagen, UK)
and stored at -80˚C until extraction according to manufacturer’s instructions (RNeasy Micro Kit,
Qiagen, UK). Following extraction, the samples were again stored at -80˚C [18].
RNA amplification and microarray
Extracted RNA was amplified using the Ovation1 Pico WTA system v2 kit (NuGen Technol-
ogies, USA) and purified with QIAquick PCR purification kit (Qiagen, UK), according to
manufacturer’s instructions. Prior to microarray, RNA quantity was estimated using a micro-
volume spectrophotometer (ThermoScientific NanoDrop 2000 UV-vis, USA). Agilent SureTag
DNA labelling and hybridisation kit were used according to manufacturer’s instructions and
slides (SurePrint G3 Human GE 8x60K V2, Agilent Technologies, USA) scanned using an Agi-
lent Microarray Scanner G2505c [19–21].
compare keloid with normal skin: LCM, whole tissue biopsy and 2D monolayer cell culture. C) Principal
component analysis (PCA) plot for the gene expression derived from experimental approaches described
above. The epidermal and dermal samples are evident as separate clusters as are the laser captured material
and the monolayer culture samples.
doi:10.1371/journal.pone.0172955.g001
Site-specific analysis of keloid disease
PLOS ONE | DOI:10.1371/journal.pone.0172955 March 3, 2017 4 / 33
Quantitative Real-Time Polymerase Chain Reaction (qRT-PCR)
qRT-PCR was performed using the Lightcycler1 480 II platform (Roche Diagnostics, UK) as
previously described [22]. A final reaction volume of 10μl contained normalised cDNA, Light-
Cycler1480 probes master mix, forward and reverse primers, nuclease-free water (Qiagen,
UK) and the associated probe from the Universal Probe Library (Roche, UK). Reactions were
performed in triplicate with two house-keeping genes (RPL32 and GAPDH) for relative quan-
tification. Amplified targets were analysed using the Lightcycler1 II software (1.5.0 SP3,
Roche, UK).
Cell culture
Primary keratinocytes and fibroblasts were established as previously described [22, 23]. In
brief, tissue was cut and incubated in Dispase II (10mg/ml; Roche Diagnostics, UK) at 37˚C.
The epidermis was stripped, diced and incubated in TrypLE™Express (ThermoFisher Scien-
tific, USA) with serum-free keratinocyte medium (Epilife1, Invitrogen Life Technologies,
ThermoFisher Scientific, USA) for one hour before neutralising, centrifugation and dispersion
into T25 flasks. The dermis was further incubated in collagenase before adding to complete
DMEM and grown in flasks. Medium was changed every 48hrs until confluent. Passages 1–3
were used. Cells were lysed and RNA extracted using Qiagen RNeasy Micro Kit, according to
manufacturer’s instructions.
Statistical analysis
Data was extracted from the raw files and initial microarray analysis performed using Array
studio v7.2 (OmicSoft Corporation, USA) and the data quantile normalised. A linear model
was then fitted to the log2 transformed data for which both p-value and False Discovery
Rate (FDR), controlled for using Benjamini-Hochberg method, were calculated for each
group comparison [24]. Least squared means (LS means) and 95% confidence interval
(where n>1) were outputted for each group. The data was then filtered using the following
criteria: maximum median signal intensity >8 (leaving 46802 probe sets), p-value <0.05,
fold change >2 and for individual genes of interest, q-value < 0.05 (S3 and S4 Figs). Lists of
DEG were loaded into Ingenuity Pathway Analysis (IPA, Qiagen). IPA was chosen as the
primary mode of enrichment analysis as all pathways, ontologies and interactions are man-
ually curated and have supporting literature data behind them, thus providing a very robust
and standardised platform for interpreting differential gene lists from transcriptomic stud-
ies. A full table of expanded gene names for each symbol discussed below can be found in
S2 Table.
For qRT-PCR, expression was normalised against internal controls and ΔΔCT calculated.
Statistical analysis was performed using Student’s t-test and one way ANOVA with Tukey
post-hoc correction (SPSS, IBM), where p-value <0.05 was considered significant [25]. Data
are represented as mean ± SEM.
Results & discussion
Microarray analysis reveals variable differential gene expression based
on experimental approach
Initial analysis was conducted to define site-specific gene expression, determine relationships
between experimental approaches and establish networks based on correlation clustering. We
compared gene expression for both epidermis and dermis between different sites within the
keloid lesion, based on their expression difference over their NS epidermal and dermal
Site-specific analysis of keloid disease
PLOS ONE | DOI:10.1371/journal.pone.0172955 March 3, 2017 5 / 33

counterpart. Additionally, we analysed whole tissue biopsy and monolayer culture (keratino-
cyte and fibroblast) expression for both KD and NS. The number of significant DEG within
these comparative groups as well as their direction of change is shown in Table 1.
Principal component analysis (PCA) was used to assess technical variability in the
microarray QC metrics; the expected 5% of samples (2/40) lay outside the 95% confidence
interval but were from two separate donors and therefore not excluded. Following quantile
normalisation [26], probe sets were filtered by calculating maximum group median and
removed if minimum signal intensity was < 8 (on log2 scale), leaving 24,228 probes (appro-
ximately 40%). PCA was employed to ascertain relationships between sample groups and
compare variability between replicate arrays and experimental conditions [27].
This plot indicated the most significant variability existed between different cell types, that
is epidermis and dermis or keratinocyte and fibroblast, which fell into separate clusters (X-
axis) but variability was also found between the in situmicro-dissected cell layer and it’s invitromonolayer culture equivalent i.e. epidermis and keratinocyte (Y-axis) (Fig 1C). Some of
this variability could be attributed to the differentiation state of keratinocytes. Additionally,
while keratinocytes and fibroblasts constitute the major cell type in the epidermis and dermis
respectively, the in situ tissue layer will comprise additional cells that contribute to expression.
Therefore, as expected, the epidermal layer and dermal layer, as well as their constituent cells,
differed in their expression profiles. Interestingly however, this analysis also indicated there
was differential gene expression dependent on the experimental approach, such that keratino-
cyte expression (derived from monolayer cell culture) differed from that of the laser-captured
in situ epidermal expression. The same was true for the culture-derived fibroblasts and micro-
dissected dermis.
Using weight gene correlation network analysis (WGCNA), a soft threshold was established
and the microarray data was clustered into an eigengene networks, thereby allowing gene
ontology enrichment based on consensus modules. This identified three key modules where
KD expression diverged most significantly from that of NS. Transforming growth factor beta
(TGFβ),Wnt, Phosphoinositide 3-kinase (PI3K/AKT) and Focal adhesion kinase (FAK) signal-
ling were preserved across the three modules as were remodelling and cell adhesion processes
(S1 Fig). This analysis overview resonated with the current literature on mechanisms underly-
ing keloid pathobiology, thus validating our data.
Table 1. Number of significant differentially expressed genes within each comparative microarray group (filtered for fold change > 2 and p-
value < 0.05).
Harvest method Comparison Total sig. changes Up Down FDR-corrected (q < 0.5)
LCM Keloid centre vs normal epidermis 1165 591 574 18
LCM Keloid margin vs normal epidermis 911 562 349 11
LCM Keloid extralesional vs normal epidermis 1425 608 817 28
LCM Keloid centre vs normal dermis 3640 1795 1845 1085
LCM Keloid margin vs normal dermis 3818 1852 1966 882
LCM Keloid extralesional vs normal dermis 3313 1549 1765 423
Monolayer Keloid vs normal keratinocytes* 356 207 149 21
Monolayer Keloid vs normal fibroblasts 247 146 101 3
Whole tissue Keloid vs normal skin* 12527 7583 4944 9076
FDR, false discovery rate; LCM, laser capture microdissection.
*keloid keratinocyte and whole tissue normal skin biopsy n = 1.
doi:10.1371/journal.pone.0172955.t001
Site-specific analysis of keloid disease
PLOS ONE | DOI:10.1371/journal.pone.0172955 March 3, 2017 6 / 33

An in situ microdissection approach leads to improved accuracy and
sensitivity of differential gene expression over monolayer culture and
whole tissue biopsy dissection
We compared differential gene expression of KD with NS samples from whole tissue biopsy,
monolayer culture and in situ LCM, in order to determine both experimental approach most
representative of the keloid microenvironment and also the method most likely to identify
important or novel biomarkers/pathways.
This was achieved by first comparing the DEG produced by each approach to establish any
overlap or disparity. As seen from Venn diagrams [28] (Fig 2A and 2B) only 0.2% and 0.5% of
DEG were common to all three approaches in epidermis and dermis respectively. Given that
whole tissue biopsy incorporates both epidermis and dermis, it’s clear the microdissection
approach produces the highest number of DEG specific to either layer. This data was uploaded
to Ingenuity Pathway Analysis (IPA) Software (Ingenuity1 Systems, www.ingenuity.com),
which organised the DEG into known canonical pathways, biological functions, upstream reg-
ulators and interactive networks. For both epidermis and dermis, while all three groups cap-
tured the predominant epidermal (PI3K,MAPK/ERK) and dermal (TGFβ) expression, the
microdissection approach incorporated the essential elements of both whole tissue and mono-
layer expression, providing a more complete picture of overall expression. Also, there were a
significant number of DEG in the microdissection group alone that were not identified with
monolayer or were averaged out in whole tissue analysis. This is due to the dilution effect of
looking at whole tissue as transcriptomes from different cell types that are pooled together,
which reduces the sensitivity.
In addition to comparing DEG between approaches, we examined the difference in degree
of expression. For this, we compared expression between in situmicro-dissected dermis, cap-
tured by LCM and 2D in vitro cultured fibroblasts for genes known to be dysregulated in KD.
Representative graphs are shown in Fig 3A, which demonstrate significantly increased expres-
sion of both TGFβ1 and CTGFwith in vitromonolayer fibroblasts compared with micro-dis-
sected tissue, for both KD and NS. This was also true for the rest of the genes analysed (S2
Fig). This might be somewhat expected considering 2D culture is a static physical environ-
ment, maintained with exogenous often undefined (foetal bovine serum) medium that lacks
stimuli from other cell types and can alter cell morphology/polarity and phenotype [29]. These
factors affect expression, with monolayer often resulting in higher-magnitude changes [12]. In
this case, the overexpression seen with monolayer culture vs in situmicrodissection approach
falsely minimises the degree of gene upregulation in keloid compared with NS dermis. Given
the sensitivity and accuracy of degree of expression, we concluded our in situ LCM approach
would be the most fruitful going forward.
In situ microdissection reveals keloid sites contribute disproportionately
to differential gene expression
Given the advantages of LCM in situ tissue capture, we then sought to use this technique to
define the contribution of different sites within the keloid lesion to specific gene expression as
well as distinguish epidermal from dermal signalling. To achieve this, we performed qRT-PCR
for a number of genes known to be dysregulated in KD (S2 Fig), of which two are represented
in Fig 3B. We demonstrated that TGFβ1 signalling is largely attributed the keloid centre as
compared to the margin or extralesional dermis and identified IL-8 upregulation as localised
largely to keloid centre epidermis. By examining the keloid as separate components we were
able to attribute specific expression to key sites, with the precision necessary for therapeutic
targeting.
Site-specific analysis of keloid disease
PLOS ONE | DOI:10.1371/journal.pone.0172955 March 3, 2017 7 / 33

Fig 2. Comparison of in situ microdissection KD expression to whole tissue biopsy and monolayer
culture expression. (A) Venn diagram comparing microdissected keloid epidermal expression to whole tissue
and keratinocyte culture expression. The red arrow and text indicates where all 3 methods overlap and the
results of enrichment using Ingenuity Pathway Analysis (IPA) for this group. The blue arrows and text indicate
where either alternative method overlaps with in situ expression and the associated enrichment for that group.
The green arrow and text indicates the enrichment analysis result for the 1388 genes that were identified in the
microdissection group alone. (B) Venn diagram comparing micro-dissected keloid dermal expression to whole
Site-specific analysis of keloid disease
PLOS ONE | DOI:10.1371/journal.pone.0172955 March 3, 2017 8 / 33
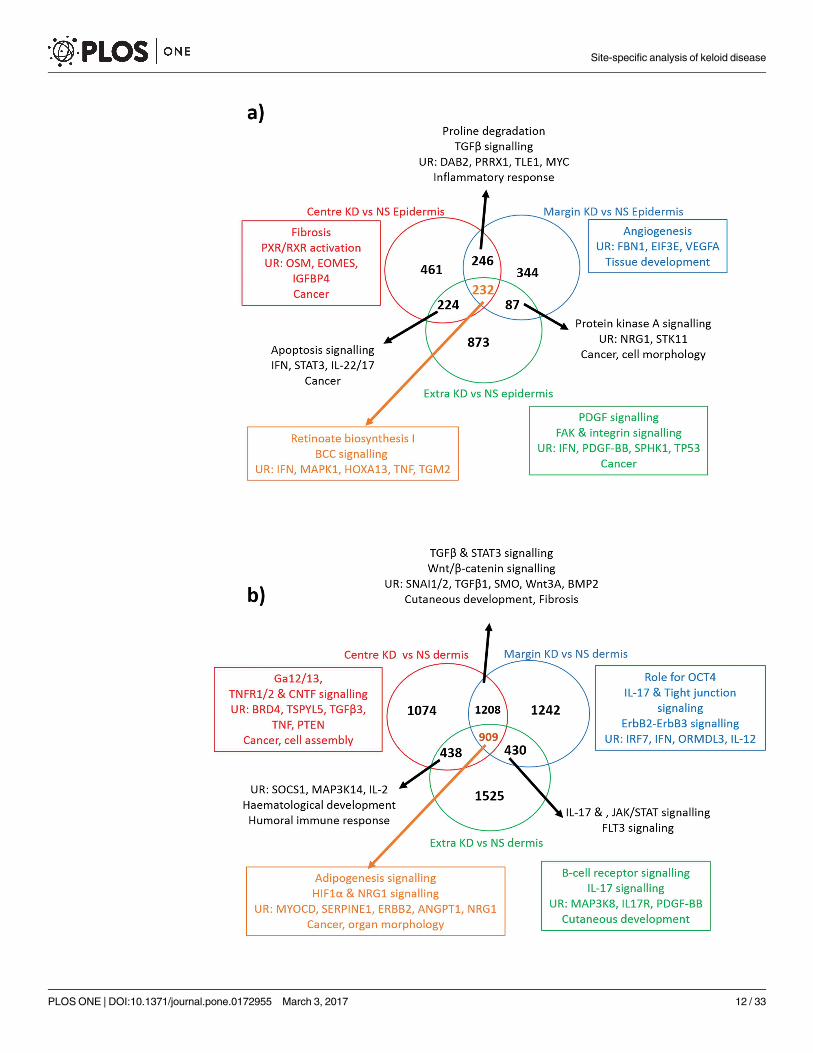
Enrichment of the site-specific microdissected keloid epidermis suggests
an active role in the pathogenesis of keloid disease
We employed LCM to look at the epidermis as a separate entity from the dermis, which
highlighted a number of DEG that have previously been overlooked with alternative methods
of dissection. Generally for the epidermis, the margin and centre shared more upregulated
genes than either did with the extralesional tissue, however, the centre and extralesional sites
had more downregulated genes in common than either did with the margin. To interpret the
expression differences and similarities between epidermal sites, the data was uploaded to IPA
(Fig 4A). The centre keloid epidermis (KE) alone was characterised by fibrosis, inflammation
and apoptosis. When taken together with the margin KE, collagen turnover and inflammation
were distinguished as key events. The upstream regulators TGFβ, PRRX1 and DAB2 supported
an EMT hypothesis. The identification of angiogenesis and cell-cell signalling networks as well
as VEGF as an upstream regulator upheld the margin as the active site of keloid and empha-
sised the role of the epidermis in this process [7]. There were 232 DEG common to all three
sites of the KE compared with NS epidermis (NSE). Interestingly, retinoate biosynthesis was
revealed to be the top canonical pathway in this group with key molecules including IFN, TNF,
HOXA13 andMAPK1 proposed as upstream regulators.
Enrichment of the site-specific micro-dissected keloid dermis supports
the presence of epithelial-mesenchymal transition, immune modulation
and keloid margin-related migration
With regard to the keloid dermis (Kd), there was a significant increase in shared expression
between centre and margin than with extralesional tissue, for both up and downregulated
genes (Fig 4B). Compared with NS dermis (NSD), there were 1208 DEG common to centre
and margin Kd, where TGFβ signalling was identified by IPA as a top canonical pathway,
as might be expected in KD. The proposed upstream regulators in this group included
SNAI1, SNAI2, SMO,Wnt3A and BMP2, which not only influence cell growth, prolifera-
tion and fibrosis but are also all involved in EMT [30–33]. When we examined all three
sites of the microdissected Kd together, we identified angiogenic factors (HIF1α, ANGPT2)
and migration regulators (ErbB, SERPINE1) to be in common. Enrichment of the margin
Kd highlighted migration regulators (ErbB & tight junction signalling), the potential exis-
tence of embryonic stem cell markers (OCT4), which were previously identified in the
microvessels of keloid associated lymphoid tissue [34] and immune response modulators
(IL-17, IL-12 & IRF7 [35]), much of which were shared at its overlap with extralesional der-
mis expression. These processes are consistent with the signature expected of an invading
tumour margin [36].
tissue and fibroblast culture expression. The red arrow and text indicates where all 3 methods overlap and the
results of enrichment using IPA for this group. The blue arrows and text indicate where either alternative method
overlaps with in situ expression and the associated enrichment for that group. The green arrow and text
indicates the enrichment analysis result for the 3749 genes that were identified in the microdissection group
alone. ACKR3, atypical chemokine receptor 3; ATM, ataxia telangiectasia mutated; DACH1, dachshund family
transcription factor 1; EGF, epidermal growth factor; EPHB4, ephrin (EPH) receptor B4; FOXF2, forkhead
box F2; GNB, guanine nucleotide binding protein (G protein); IL, interleukin; IRAK4, interleukin-1 receptor
associated kinase-4; KMT2A, lysine (K)-specific methyltransferase 2A; MAPK/ERK, mitogen-activated protein
kinase; MEN1, menin; OSM, oncostatin M; PAX8, paired box 8; PDGF, platelet-derived growth factor; PI3K,
phosphoinositide 3-kinase; PKNOX1, PBX/knotted 1 homeobox 1; PTEN, phosphatase and tensin homolog;
TGFβ, transforming growth factor beta; TNF, tumour necrosis factor; TNFR2, tumour necrosis factor receptor 2;
TP53, tumour protein 53; UR, upstream regulators; VEGF, vascular endothelial growth factor.
doi:10.1371/journal.pone.0172955.g002
Site-specific analysis of keloid disease
PLOS ONE | DOI:10.1371/journal.pone.0172955 March 3, 2017 9 / 33

Site-specific analysis of keloid disease
PLOS ONE | DOI:10.1371/journal.pone.0172955 March 3, 2017 10 / 33

The microdissected keloid epidermis expresses an activated, pro-
inflammatory profile with the potential for epithelial-mesenchymal
transition
In addition to expression overview and enrichment, we investigated the individual DEG of
micro-dissected sites for both KE and Kd compared with NS. A full list of the top 100 upregu-
lated and 50 downregulated genes is available for each site in S5–S16 Figs. Additionally, a
detailed table of expanded genes for each of the symbols below can be found in S2 Table.
For the epidermis, the most significantly dysregulated genes were common to all three sites
and indicated an activated, hyper-proliferative, pro-inflammatory and mesenchymally-poised
epithelium. Keratin 6α and 6β were both significantly upregulated in all three epidermal sites,
supporting the hyper-proliferation seen on keloid histology [1]. K6 is induced in keratinocytes
following injury where it is associated with migration through Src regulation [37, 38]. This
activated epidermal expression [39] is reversible on wound closure and NSE (except the hair
follicle) does not express K6 [40]. Mucin-like 1 (MUCL1) was also significantly overexpressed
in the micro-dissected epidermis and has been associated with aggressive breast tumorigenesis
and recurrence [41]. Interestingly, it was demonstrated thatMUCL1may be required for pro-
liferation of ErbB2-overexpressing breast cells [41], which was identified as overexpressed here
in margin Kd. The inflammation-associated scavenger receptor CD36 is also a marker of epi-
dermal activation and not present in NS keratinocytes without specific stimuli [42]. It has been
shown to disappear from hypertrophic scars with age whereas keloid scars maintained their
CD36 expression [43, 44], which is supported here by CD36 upregulation in all 3 sites of the
KE. The role of CD36 in signal transduction suggests it may contribute to epithelial-mesenchy-
mal signalling and it has been shown to affect the secretion of TGFβ1 [45], which is dysregu-
lated in KD [46, 47].
The presence of EMT in KD, is supported by our finding of S100A8,WDR66 and AKR1B10overexpression in all 3 micro-dissected epidermal sites. The knockdown of keratinocyte
S100A8, recently shown to be upregulated in both keloid and hypertrophic scar epidermis,
resulted in a failure to activate co-cultured fibroblasts and reduction in dermal fibrosis [48]. As
a mediator of neutrophil migration [49, 50], S100A8 is found in the supra-basal epidermis fol-
lowing injury, but gradually returns to baseline in a normally healed wound [51]. The role of
S100A8 in conversion of wounded keratinocytes to a migratory phenotype may represent a
potential link to EMT and contribution to tumorigenesis [51]. Also implicated in EMT is the
protein WDR66, which in oesophageal carcinoma has been shown to affect vimentin and
occludin expression where its knockdown attenuated both cell proliferation and motility [52].
While we did not find altered vimentin expression, we did identify upregulation of fibronectin
(FN1) (p = 0.06) and α-SMA/ACTA2 (p = 0.033) in the micro-dissected centre KE. Our data
also identified a significant upregulation of AKR1B10 (as well as AKR1B1 and AKR1B15) in all
three sites of the KE. This enzyme has a key role in the metabolism of retinoic acid (RA) and
our recent study found the induced overexpression of AKR1B10 in NS keratinocytes resulted
in significant downregulation of E-cadherin [23]. Additionally, the treatment of keloid fibro-
blasts with AKR1B10-overexpressing keratinocyte medium resulted in upregulation of TGFβ1,
Fig 3. Site-specific contribution to differential gene expression in KD. (A) Comparison of gene expression
between laser-captured dermal tissue (in situ) and fibroblasts for both keloid and normal skin. qRT-PCR graph
for both TGFβ1 and CTGF (additional examples found in S2A Fig). All data are mean ±SEM for at least three
independent experiments. B) qRT-PCR for TGFβ1 and interleukin-8 (IL-8) showing relative contributions of
different keloid sites to overall expression and comparison with normal skin (additional genes available in S2B
Fig). Data are mean ±SEM where * p-value <0.05 using Student’s t test and ANOVA with Tukey post hoc
correction. CTGF, connective tissue growth factor; TGFβ, transforming growth factor beta.
doi:10.1371/journal.pone.0172955.g003
Site-specific analysis of keloid disease
PLOS ONE | DOI:10.1371/journal.pone.0172955 March 3, 2017 11 / 33
Site-specific analysis of keloid disease
PLOS ONE | DOI:10.1371/journal.pone.0172955 March 3, 2017 12 / 33

Collagen I and collagen III, supporting a role for pathological epithelial-mesenchymal interac-
tions (EMI) in keloid pathogenesis.
EMI encompass the essential cross-talk that governs the epidermal-dermal relationship in
the skin and in addition to a multitude of essential organ development and physiologic pro-
cesses, are essential for successful wound healing. Dysregulation of the processes involved in
EMI (e.g. malfunction of negative feedback loops) can lead to abnormal wound healing and
fibrosis or contribute to tumorigenesis [53, 54]. Previous exploration into the contribution of
these EMI to KD, have highlighted the significance of the epidermis in the formation and
maintenance of this fibrotic scar [55, 56].
BMP2, a member of the TGFβ superfamily, was downregulated in our microarray data and
has been shown to attenuate renal fibrosis, by reversing TGFβ1-induced EMT and cellular
fibrotic markers [32]. Similarly, the loss of claudin-4 (CLDN4) and CLDN23, integral compo-
nents of the tight junctions that maintain epithelial cell contacts [57] and downregulated here
in the micro-dissected KE, are strongly implicated in EMT, potentially through E-cadherin
modulation and thought to be negatively regulated by TGFβ [58–60]. We also identified signif-
icant upregulation of NOTCH4 in all 3 epidermal sites and centre and margin Kd, which is
linked with cancer stem cell activity and interestingly has very recently been associated with
mesenchymal-epithelial transition (MET) [61, 62].
A role for EMT has previously been implicated in the pathogenesis of KD [63, 64]. EMT is a
potentially reversible process whereby epithelial cells lose adhesion properties (downregulation
E-cadherin, CLDN4 and CLDN23) and gain migratory and invasive characteristics, transform-
ing into mesenchymal cells (upregulation FN1 and ACTA2) [65]. Here, we present DEG that
in combination support a role for EMT or at least “partial EMT” in KD (Fig 5A).
Microdissected keloid dermis expression reinforces the significance of
TGFβ in KD pathogenesis through its regulation of the collagen network
Collagen is the major structural protein of the ECM and fibrillar collagens (type I & III) are
present in abundance in KD [1]. Fibroblasts are the most common producers of collagen and
are subject to complex autocrine and paracrine cytokine signals to regulate its formation, of
which TGFβ is crucial [66, 67]. In combination with these cytokines there are a number of
enzymes and proteins that through cleavage or binding can affect collagen turnover [68].
Fig 4. Gene enrichment analysis of microdissected site-specific keloid disease. Venn diagram of keloid disease (KD)
centre, margin and extralesional expression vs normal skin (NS), where A) refers to the epidermis and B) refers to the
dermis. The red circle and text refer to the centre vs NS alone, the blue to margin vs NS and the green to extralesional keloid
site alone vs NS. The black arrows and text refer to the enrichment results of where the expression of the indicated sites
overlap. The orange arrow and text refers to the enrichment analysis of the indicated number of genes in common to all
three keloid sites over NS. In both A) and B) enrichment analysis was performed with Ingenuity Pathway Analysis (IPA) and
included canonical pathways, diseases & functions, networks and upstream regulators of interest. ANGPT2, angiopoietin 2;
BCO1, beta-carotene oxygenase 1; BMP2, bone morphogenetic protein 2; BRD4, bromodomain containing 4; DAB2, Dab,
mitogen-responsive phosphoprotein, homolog 2 (drosophila); EGF, epidermal growth factor; EIF3E, eukaryotic translation
initiation factor 3 subunit E; EOMES, eomesodermin; FBN1, fibrillin 1; FLT3, fms related tyrosine kinase 3; GSTP1,
glutathione s-transferase pi 1; HIF, hypoxia-inducible factor; HOXA13, homeobox A13; IFN, interferon; IGFBP, insulin-like
growth factor binding protein; IL, interleukin; IRF, interferon regulatory factor; JAK, janus kinase; MAPK, mitogen-activated
protein kinase; MYC, c-Myc; MYOCD, myocardin; NRG1, neuregulin-1; OCT4, octamer-binding transcription factor 4;
ORMDL3, orosomucoid like 3; OSM, oncostatin M; PDGF, platelet-derived growth factor; PTEN, phosphatase and tensin
homolog; PXR, pregnane X receptor; PRRX1, paired related homeobox 1RXR, retinoid X receptor; SERPINE1(PAI-1),
serpin peptidase inhibitor. Clade E (plasminogen activator inhibitor 1); SMO, smoothened; SNAI1, snail family zinc finger 1;
SOCS, suppressor of cytokine signalling; SPHK, sphingosine kinase; STAT, signal transducer and activator of transcription;
STK11, serine/threonine kinase 11; TGF, transforming growth factor; TGM2, transglutaminase 2; TLE1, transducin like
enhancer of split 1; TNF(R), tumour necrosis factor (receptor); TP53, tumour protein 53; TSPYL5, testis-specific protein Y
encoded like 5; UR, upstream regulators; VEGF, vascular endothelial growth factor.
doi:10.1371/journal.pone.0172955.g004
Site-specific analysis of keloid disease
PLOS ONE | DOI:10.1371/journal.pone.0172955 March 3, 2017 13 / 33

Site-specific analysis of keloid disease
PLOS ONE | DOI:10.1371/journal.pone.0172955 March 3, 2017 14 / 33

Within the microdissected centre and margin Kd, we identified dysregulation of a number
of members of the ADAMTS family of enzymes, which are associated with tissue morphogene-
sis, remodelling, inflammation and angiogenesis [69]. Of these, ADAMTS14 and ADAMTS2were the most significantly upregulated and are both pro-collagen N peptidases (pNP), respon-
sible for the cleavage of type I and II pro-collagen necessary for fibril assembly and collagen
biosynthesis (Fig 5B) [70, 71]. Interestingly, BMP1, responsible for the cleavage of the C-pro-
teinase is also upregulated in centre and margin Kd (Fig 5B) [72]. The ADAMTS enzymes are
associated with Dupuytren’s disease [73], craniofacial fibrosis [74], Ehlers Danlos [75] and
cancer [76, 77], with ADAMTS2-knockout mice demonstrating skin fragility [78] and reduced
liver fibrosis in vivo [79].More recently, studies have argued for ADAMTS involvement in a
positive TGFβ feedback loop, whereby ADAMTS2 is induced by but also targets TGFβ [80, 81].
To date the best-described inhibitor of ADAMTS is TIMP3 [70, 82, 83], which we found to be
significantly downregulated in our microarray data in both centre (p = 0.026) and margin
(p = 0.037) Kd. Interestingly, we identified upregulation of disintegrin and metalloproteinase
ADAM12, the member of a family closely related to the ADAMTS group of proteins and
which was also suggested to be involved in a positive feedback loop with TGFβ, resulting in
continuous collagen production [84]. This proteinase is upregulated in several cancers and
fibroses and was previously identified as upregulated in the keloid centre, where it was thought
contribute to tissue remodelling [5, 85, 86]. Through its association with TGFβ,ADAM12 has
been implicated in EMT [87].
Also involved in collagen fibril assembly, is cartilage oligomeric matrix protein (COMP),
which was significantly upregulated in both centre and margin Kd. COMP binds with affinity
to collagens, especially collagen I, and has been previously identified in KD [88], where similar
to ADAMTS it may be involved in a positive TGFβ feedback loop [89, 90]. Another member of
the collagen matrix regulators and also previously investigated in KD is collagen triple helix
repeat containing 1 (CTHRC1), which was demonstrated to decrease TGFβ-induced keloid
fibroblast collagen I expression [91]. However, despite the seemingly contradictory descrip-
tions of the negative effect of CTHRC on collagen I expression [92, 93], it has been widely cor-
related with tissue invasion and migration, where its expression was induced by TGFβ [94, 95].
Here, we found CTHRC1 significantly upregulated in microdissected centre and margin Kd.
This may represent the result of a feedback mechanism to counteract the expression of TGFβ,
ADAMTS and COMP but without further investigation the mechanism underlying CTHRC1overexpression in keloid scars remains to be fully elucidated. In addition to ADAMTS,ADAM12,COMP and CTHRC1, we identified asporin (ASPN) and Wnt1-inducible-signaling
pathway protein 1 (WISP1) as upregulated in both centre and margin Kd, which are also
Fig 5. In situ microdissection expression contributing to epithelial-mesenchymal transition (EMT)
and collagen production in KD. A) Schematic diagram of the differentially expressed genes (DEG) in KD
that contribute to an activated, hyper-proliferative and inflammatory epidermis. Also depicted are DEG from
our microarray data hypothesised to contribute to EMT through upregulation (green arrow) or downregulation
(red arrow), which are described along with the upstream regulators identified on enrichment analysis of our
microarray data and which have been previously implicated in the EMT process. B) Schematic diagram
depicting where ADAMTS and BMP cleave the procollagen peptides to form tropo-collagen and allow
collagen fibril assembly necessary for collagen turnover. Once a collagen monomer, it may bind COMP.
Collagen production in KD may be increased by the potential existence of positive feedback loops between
ADAMTS2/COMP/ADAM12 and TGFβ. ADAM, a disintegrin and metalloproteinase; ADAMTS, a disintegrin
and metalloproteinase with thrombospondin motifs; AKR1B10, aldo-keto reductase family 1, member 10;
BMP, bone morphogenetic protein; CLDN, claudin; COMP, cartilage oligomeric protein; FGF, fibroblast
growth factor; HOX, homeotic gene subset; IL, interleukin; K, keratin; LIMS2, LIM zinc finger domain
containing 2; MAPK, mitogen-activated protein kinase; MUCL1, mucin-like 1; S100A8, S100 calcium-binding
protein A8; TGFβ, transforming growth factor beta; WDR66, WD repeat domain 66; ZEB, zinc finger E-box-
binding proteins.
doi:10.1371/journal.pone.0172955.g005
Site-specific analysis of keloid disease
PLOS ONE | DOI:10.1371/journal.pone.0172955 March 3, 2017 15 / 33
correlated with TGFβ expression. ASPN, a small leucine-rich proteoglycan though to regulate
tumour microenvironment, is known to bind TGFβ [96, 97] and has previously been found to
be upregulated in the margin of KD [98]. The pro-proliferativeWISP1, a member of the matri-
cellular CCN family, was detected in Dupuytren’s disease [99] and is strongly associated with
liver [100] and lung fibrosis, where it was induced by TGFβ1 [101] and implicated in EMT.
TGFβ is considered a master regulator in KD, involved in several positive and negative feed-
back loops that culminate in the net production of excess ECM through angiogenesis, prolifer-
ation, inflammation, differentiation processes and as indicated here, collagen deposition (Fig
5B) [102, 103]. TGFβ is also a major player in EMT, where it effects change at transcriptional
and translational levels through both Smad and non-Smad pathway signalling [104–108].
While TGFβ3was significantly upregulated in the keloid centre and margin on microarray,
TGFβ1 was confirmed as upregulated in Kd compared with normal skin dermis using
qRT-PCR (Fig 3A).
In situ microdissection expression indicates the potential contribution of
IL-13, IL-17 and IL-37 to the inflammatory process underlying keloid
disease
The inflammatory phase of wound healing is a spatially and temporally precise process, essen-
tial to the supply of growth factor, chemokine and cytokine signalling necessary for repair.
However, prolonged inflammation can result in impaired wound healing, leading to chronic
wounds or excess scarring [109, 110]. KD is associated with an exaggerated inflammatory
response [6, 111]. Prolongation of the inflammatory phase with extended residency of these
factors promotes proliferation, angiogenesis and increased deposition of ECM [112]. Interleu-
kins are a group of secreted cytokines central to the inflammatory process that have an incom-
pletely understood role in KD and may represent potential therapeutic targets.
IL-13, a potent fibrosis-promoting cytokine secreted by activated TH2 T-cells [113, 114],
has been shown to increase collagen I & III production in keloid fibroblasts in vitro [115]. We
found significant upregulation of IL13RA1 in KE, epidermal and dermal upregulation of IL-4R
and downregulation of IL13RA2 in the microdissected Kd (Table 2). Together, IL-13RA1 and
IL-4R bind both IL-13 and IL-4 with high affinity to activate JAK/STAT6 signalling (Fig 6)
[116]. IL-13RA2 is largely considered a high affinity decoy receptor thought to inhibit IL-13signalling in vivo and protect against fibrosis [117, 118]. Although this has been disputed
[116], IL-13 inhibition attenuated fibrosis and IL-13RA2-knockout mice have demonstrated
enhanced IL-13-mediated responses in vivo [119–121]. Our current microarray findings, com-
bined with previous evidence of KD containing an inflammatory niche populated by M2 mac-
rophages [6], known to be IL-13 recruited, supports an overexpression of IL-13 in KD.
In addition to IL-13 dysregulation, in all 3 KE sites compared with NS epidermis we identi-
fied loss of IL-37, a relatively new member of the interleukin-1 (IL-1) family, which described
as anti-inflammatory has been shown to decrease the expression of IL-6, IL-1β, TNFα and IL-17 [122], all of which are associated with KD [13, 112]. It is thought IL-37 is involved in a nega-
tive feedback loop to control excess inflammation, whereby IL-37 induction by TNFα or toll-
like receptors (TLR) results in suppression of TNFα and inhibition of pro-inflammatory cyto-
kine release (Fig 6) [123]. While IL-37 itself has not previously been investigated in KD, this
finding is supported by altered expression of IL-17, IL-1β and TNFα in our microarray data.
IL-17 signalling was dysregulated in common to both margin and extralesional Kd sites on
enrichment analysis (Fig 4B). The pro-inflammatory IL-17 is produced by a subset of activated
CD4+ T-cells, namely TH17 and a subset of innate lymphoid cells termed ILC3s, whose differ-
entiation and cytokine production is regulated by a complex interplay of molecules [124–126].
Site-specific analysis of keloid disease
PLOS ONE | DOI:10.1371/journal.pone.0172955 March 3, 2017 16 / 33

Studies have shown that IL-6 and TGFβ initiate TH17 differentiation, IL-23 in an autoregulatory
feedback loop with IL-1β is responsible for the maintenance of IL-17 and that IL-2, IL-27, IL-4and IFNU are negative regulators [124, 127]. While we know KD shows an increased T-cell infil-
trate in the dermis and that there is an inflammatory niche driven by the IL-17/IL-6 axis, the
complex interplay of this signalling mechanism remains incompletely understood [6, 13, 128].
Here, we identify an imbalance in inflammatory cytokine signalling, which alters between the
three KE and Kd sites compares to NS (Table 2). Within the literature the association between
these cytokines and their regulators/substrates is described with some variability and Fig 6
depicts an interpretation of these relationships and how they may interact in KD. The IL-17 envi-
ronment is both cell-type and context-type dependent in contribution to neutrophil recruitment,
angiogenesis and invasion [129, 130]. IL-17 is known to be involved in other fibrotic conditions
[131–133] and in KD it may be that IL-17 expression differs between different sites within the
keloid scar and that ongoing paracrine signalling produces the dynamic expression seen here.
The dysregulation of IL13, IL-37 and IL-17 in KD from our microarray data are likely inter-
connected (Table 2) and the mechanisms underlying modulation of KD by these interleukins
requires further elucidation to determine their contribution to its pathogenesis and potential
for therapeutic exploitation (Fig 6).
In situ microdissection analysis identifies loss of tumour suppression
genes that combined with an expression profile promoting therapeutic
resistance may account for currently ineffective keloid management
The failure to switch on essential genes responsible for the attenuation of processes central to
fibrosis can lead to exponential growth. The loss of expression of these genes can be as
Table 2. Dysregulation of cytokines in site-specific KD microarray relating to IL-13, IL-37 and IL-17. All have p-value < 0.05. See Fig 6 for
relationships.
Molecule Keloid site Centre: direction & fold change Margin: direction & fold change Extralesional: direction & fold change
IL-13RA1 Epidermis " 8.45 " 4.8 " 3
IL-13RA2 Dermis # 10.8 # 8.67 # 9.66
IL-37 Epidermis # 6.51 # 4.85 # 10.66
IL-17RA Epidermis - - # 2.6
IL-17RA Dermis # 2.9 # 2.35 " 3.36
IL-1β Dermis - " 3.83 " 4.61
IL-23A Dermis - - " 2.73
IL-6R Epidermis - " 4.06 -
IL-21R Dermis - " 2.64 " 2.01
IL-2RA Dermis - " 2.95 -
IL-4R Epidermis " 2.31 - -
IL-4R Dermis " 5.97 " 11.41 # 4.65
IL-27 Dermis " 2.34 " 1.84 " 2.15
STAT3 Dermis - # 2.02 # 2.1
SOCS3 Epidermis - - " 3.64
SOCS3 Dermis " 4.32 " 5.68 " 5.69
IL-8 Dermis - - " 12.27
RORc Dermis # 4.92 - -
IL, interleukin; R, receptor; RA, receptor alpha; A, alpha; STAT, signal transducer and activator of transcription; SOCS, suppressor of cytokine signalling;
ROR, retinoid-related orphan receptor.
doi:10.1371/journal.pone.0172955.t002
Site-specific analysis of keloid disease
PLOS ONE | DOI:10.1371/journal.pone.0172955 March 3, 2017 17 / 33

Fig 6. Cytokine relationship with potential inflammatory effects in KD. Schematic diagram of the possible relationships existing between a number
of cytokines and growth factors identified as dysregulated in KD microdissected epidermis and dermis in our microarray data. This figure should be
correlated with Table 2 where the direction and fold change for each of these molecules can be found for each site within keloid epidermis and dermis.
AP-1, activating protein 1; IL, interleukin; INF, interferon; JAK, janus kinase; MMP, matrix metalloproteinase; NFκB, nuclear factor kappa B; ROR,
retinoic acid-related orphan receptor c; STAT, signal transducer and activator of transcription; TGFβ, transforming growth factor beta; TNF, tumour
necrosis factor.
doi:10.1371/journal.pone.0172955.g006
Site-specific analysis of keloid disease
PLOS ONE | DOI:10.1371/journal.pone.0172955 March 3, 2017 18 / 33
significant in the pathogenesis of KD as the overexpression of others. In this study, we identi-
fied a number of DEG previously associated with tumour suppression and drug resistance but
not fully explored in KD.
Looking at the dermis, both CEACAM1 and SOX9 were found to be downregulated in
keloid centre and margin compared with NSD. CEACAM1, a glycoprotein that mediates cell
adhesion and immunity, is dysregulated in a number of cancers and considered a tumour sup-
pressor gene [134–136]. Loss of CEACAM1 has been implicated in the switch from superficial
to pro-angiogenic, invasive tumour [137]. The concomitant downregulation of SOX9 is likely
to be linked given the correlation to CEACAM1 in the literature to date [138–140].
We identified downregulation of ATF3 in both centre and margin KE compared with
microdissected NSE. Although not previously investigated in KD, this CREB family protein is
downregulated in a number of cancers [141] and considered an adaptive-response gene with
tumour-suppressing effects that to date, demonstrate dual-role cell-type dependency [142,
143]. ATF3 promotion of apoptosis, a key process in prevention of growth and invasion, may
result from KLF6 induction of ATF3 [144] or through its activation of p53 [145]. We found a
significant downregulation of KLF6 in the centre KE (p = 0.02) and interestingly, ATF3 has
been shown to mediate apoptosis by anti-cancer therapies [146–148]. Also in the microdis-
sected KE, UGT3A2, a member of the UDP-glycosyltransferase superfamily that plays a role in
drug metabolism and which may affect detoxification of therapeutic drugs, was found to be
strongly under-expressed [149, 150].
Our recent publication on the upregulation of AKR1B10 in KE, where we hypothesised its
ability to catalyse the reduction of carbonyls and xenobiotics may render keloid susceptible
to chemotherapeutic resistance and thus explain some of the difficulties associated with man-
agement of KD to date [23, 151]. Both ALDH1A1 and the aforementioned upregulation of
NOTCH4 in KE are also associated with drug resistance [152, 153]. The upregulation of these
molecules and multi-drug resistant nature of keloid scars may indicate the presence of a cancer
stem cell-like population within the scar, which has been touched on but not fully explored in
the literature [154, 155]. Tubulin β3, class III (TUBB3), a cytoskeletal microtubule protein pre-
viously identified in solid tumours and extraocular fibrosis [156, 157], was also significantly
upregulated in both centre and margin microdissected KE and Kd. This molecule has been
linked to both overexpression of ErbB2 [158, 159], which we found upregulated in margin Kd
(p = 0.0031) and loss of PTEN [160, 161], which was also significantly downregulated in the
margin Kd in our microarray data (p = 2.86 x 10⁻⁵). TUBB3 is associated with aggressive
tumorigenesis in hypoxic environments [162], where it has been linked with chemoresistance,
particularly taxanes [163–165]. This may be relevant to KD where there is evidence of a simi-
larly hypoxic environment [63, 166, 167].
KD is notoriously difficult to manage in the clinical setting, with several available treat-
ments but no one absolutely effective therapy [168–170]. Drug resistance has formed a major
part of this failure [171]. In identifying DEG that may contribute to this seemingly multi-drug-
resistant disease, it may be possible to tailor management by targeting these molecules with
adjuvant therapies.
Microarray data was validated through qRT-PCR of interesting targets
We chose four candidate genes from each of the KE and Kd for qRT-PCR validation of the
microarray findings. For the epidermis, the dysregulation of AKR1B10 and associated
AKR1B1,AKR1B15 and ALDH1A1 all related to the retinoic acid pathway and as such were
previously validated [23]. Also in the KE, we wanted to validate genes representing different
areas of interest including epidermal activation and inflammation (CD36), EMT (WDR66 and
Site-specific analysis of keloid disease
PLOS ONE | DOI:10.1371/journal.pone.0172955 March 3, 2017 19 / 33
BMP2) and the possible existence of a cancer-like stem cell population (NOTCH4). As the
most abundant protein in keloid ECM, collagen has long been investigated as a potential thera-
peutic target. Our identification of ADAMTS14,ADAMTS2,COMP and ADAM12 represent
significant alternative targets to TGFβ and as such were chosen for validation in the dermis.
qRT-PCR for these genes not only reflected the microarray findings but also preserved the
site-specific differences in expression, thus validating our data (Fig 7).
Conclusions and perspectives
In this study, we have combined LCM and microarray to examine KD by looking at the lesion
as separate components; epidermis and dermis as well as centre, margin and extralesional
sites. First, we showed this in situmicrodissection approach was both more accurate and more
sensitive than either whole tissue biopsy or monolayer cell culture methods in the dissection of
the heterogeneous lesion that is keloid scar.
Through this strategy, we have distinguished several genes that are either novel or support-
ive of emerging literature with respect to KD pathobiology. In this study, expression patterns
indicate the possible residence of a cancer-like stem cell population in KD, an area that is sur-
prisingly under-researched in this field given the association with both EMT and drug resis-
tance [171, 172]. The plausible presence of such a cell population in KD, which to date has
been associated with an inflammatory infiltrate [13, 34, 128], provides a reasonable explana-
tion for the persistent growth, recurrence and multi-drug resistance that are characteristic of
this disorder. The LCM strategy detailed in this study could benefit the isolation and character-
isation of these cancer-like stem cells from within the keloid tissue and therefore constitutes an
interesting focus for future work.
The multi-level ECM regulators, ADAMTS14 and ADAMTS2, make attractive KD thera-
peutic targets. The potential redundancy of both these proteins with ADAMTS3, which we did
not find to be upregulated in KD, indicates possible attenuation of their effect without the con-
sequences of complete abrogation. IL-37 overexpression in vivo in transgenic mice has resulted
in dampened IL-6, IL-1β and IL-17 [173], which are all previously shown to be upregulated in
KD [13]. This suggests therapeutic induction of IL-37 expression in KE, in order to dampen
the pathologic inflammatory response, may be a prospective management strategy. Interest-
ingly, there is differential gene expression between extralesional keloid and NS tissue. This
may represent a field cancerisation effect whereby keloid tumour invasive growth is mediated
by paracrine signalling with the adjacent NS and that within this extralesional perimeter the
risk of keloid recurrence following treatment is greatest. Therefore, establishment of the extent
of this extralesional expression divergence from that of NS may have clinical implications for
future management of KD.
Given the clinically distinct keloid phenotypes and the morphological heterogeneity within
the keloid scar, which is fully reflected here by the isolated gene expression profile of defined
KD-associated lesion compartments, it is most likely a gene signature rather than a single bio-
marker that will prove valuable as a diagnostic tool when distinguishing KD from other cutane-
ous fibroses. Improved differential diagnosis prevents the morbidity and mortality associated
with inappropriate management of clinically comparable conditions, some of which may have
more serious consequences if improperly treated (for example; dermatofibrosarcoma protuber-
ans and systemic sclerosis). The heterogeneity of KD has been addressed through the innovative
microdissection gene expression profiling approach in this study, which has provided a better-
defined gene signature of distinct regions of keloid tissue pathobiology (Fig 8).
It is likely that the complex nature of KD results from an interplay of simultaneously occur-
ring processes, such that injury to the epidermis results in inflammation which then through
Site-specific analysis of keloid disease
PLOS ONE | DOI:10.1371/journal.pone.0172955 March 3, 2017 20 / 33

Site-specific analysis of keloid disease
PLOS ONE | DOI:10.1371/journal.pone.0172955 March 3, 2017 21 / 33

autocrine and paracrine signalling recruits factors that trigger EMT, which in turn can trigger
cellular reversion to a stem cell-like state and thus exacerbate drug resistance and recurrence
[174]. While TGFβ is an attractive therapeutic target, the pleiotropic nature of this molecule
makes a simplistic TGFβ-neutralisation strategy imprudent. Therefore, it would be useful if
alternative molecular mechanisms that are important in KD pathobiology but more specific to
it, could be selectively targeted therapeutically. Several novel, potentially important molecular
targets and KD pathobiology candidate mechanisms have been dissected here that invite and
facilitate further studies. To this end, the use of LCM in this study is in keeping with previous
research that highlighted the superiority of this technique with regard to identification of oth-
erwise overlooked genes using traditional methods as well as an increased number of genes
reaching significance [175–178]. Our approach therefore offers a competitive alternative to
established methods of experimentation and may be of potential benefit not only to KD but
also other heterogeneous conditions.
Fig 7. qRT-PCR validation of candidate genes. Four candidate genes were chosen from each of the
epidermis and dermis for validation by qRT-PCR. The bar graphs represent the qRT-PCR data for the
microdissected keloid sites and normal skin and the line graph represents the associated microarray fold
change in gene expression. In all cases the line graph follows the trend of the bar graph indicating the PCR
reflects the microarray, thus validating the data. Data are presented as mean ±SEM and are from at least three
independent experiments. For some of the genes there was no expression in normal skin and therefore for
those genes no fold change for the qRT-PCR could be generated. In the interest of standardisation of all of the
graphs they were then presented with the two axes. ADAM, a disintegrin and metalloproteinase; ADAMTS, a
disintegrin and metalloproteinase with thrombospondin motifs; BMP2, bone morphogenetic protein 2; CD36,
cluster of differentiation 36; COMP, cartilage oligomeric protein; NOTCH4, notch 4; WDR66, WD repeat
domain 66.
doi:10.1371/journal.pone.0172955.g007
Fig 8. Summary figure of proposed processes and mechanisms contributing to keloid disease based on identification of DEG and subsequent
analysis.
doi:10.1371/journal.pone.0172955.g008
Site-specific analysis of keloid disease
PLOS ONE | DOI:10.1371/journal.pone.0172955 March 3, 2017 22 / 33

Supporting information
S1 Table. Demographic data for the samples used in this study.
(DOCX)
S2 Table. Expanded names for each of the gene symbols used throughout the manuscript
text and figures.
(DOCX)
S1 Fig. Correlated modules based on assessment of eigengene plots.
(DOCX)
S2 Fig. qRT-PCR comparing LCM and monolayer and defining site-specific contribution
to gene expression.
(DOCX)
S3 Fig. Top upregulated genes in keloid vs normal skin epidermis.
(DOCX)
S4 Fig. Top downregulated genes in keloid vs normal skin epidermis.
(DOCX)
S5 Fig. Top 100 upregulated genes in keloid centre vs normal skin epidermis.
(DOCX)
S6 Fig. Top 50 downregulated genes in keloid centre vs normal skin epidermis.
(DOCX)
S7 Fig. Top 100 upregulated genes in keloid margin vs normal skin epidermis.
(DOCX)
S8 Fig. Top 50 downregulated genes in keloid margin vs normal skin epidermis.
(DOCX)
S9 Fig. Top 100 upregulated genes in keloid extralesional vs normal skin epidermis.
(DOCX)
S10 Fig. Top 50 downregulated genes in keloid extralesional vs normal skin epidermis.
(DOCX)
S11 Fig. Top 100 upregulated genes in keloid centre vs normal skin dermis.
(DOCX)
S12 Fig. Top 50 downregulated genes in keloid centre vs normal skin dermis.
(DOCX)
S13 Fig. Top 100 upregulated genes in keloid margin vs normal skin dermis.
(DOCX)
S14 Fig. Top 50 downregulated genes in keloid margin vs normal skin dermis.
(DOCX)
S15 Fig. Top 100 upregulated genes in keloid extralesional vs normal skin dermis.
(DOCX)
S16 Fig. Top 50 downregulated genes in keloid extralesional vs normal skin dermis.
(DOCX)
Site-specific analysis of keloid disease
PLOS ONE | DOI:10.1371/journal.pone.0172955 March 3, 2017 23 / 33
Acknowledgments
The authors are grateful to Yaron Har-Shai and Guyan Arscott for their assistance with tissue
sample provision and particularly to Adam Taylor for his contribution to the microarray anal-
ysis. We thank Leo Zeef of the Bioinformatics and Genomic Technologies Core Facilities at
the University of Manchester for providing support with regard to microarray accession.
Author Contributions
Conceptualization: NJ RP AB.
Data curation: NJ AB.
Formal analysis: NJ.
Funding acquisition: AB.
Investigation: NJ TH.
Methodology: NJ TH RP AB.
Project administration: NJ AB.
Resources: NJ AB.
Supervision: RP AB.
Validation: NJ TH.
Visualization: NJ TH RP AB.
Writing – original draft: NJ AB.
Writing – review & editing: NJ TH RP AB.
References1. Jumper N, Paus R, Bayat A. Functional histopathology of keloid disease. Histol Histopathol. 2015; 30:
1033–57. doi: 10.14670/HH-11-624 PMID: 25900252
2. Berman B, Kaufman J. Pilot study of the effect of postoperative imiquimod 5% cream on the recurrence
rate of excised keloids. Journal of the American Academy of Dermatology. 2002; 47: S209–11. PMID:
12271279
3. Marttala J, Andrews JP, Rosenbloom J, Uitto J. Keloids: Animal models and pathologic equivalents to
study tissue fibrosis. Matrix Biol. 2016.
4. Butler PD, Longaker MT, Yang GP. Current progress in keloid research and treatment. J Am Coll
Surg. 2008; 206: 731–41. doi: 10.1016/j.jamcollsurg.2007.12.001 PMID: 18387480
5. Seifert O, Bayat A, Geffers R, Dienus K, Buer J, Lofgren S, et al. Identification of unique gene expres-
sion patterns within different lesional sites of keloids. Wound repair and regeneration: official publica-
tion of the Wound Healing Society [and] the European Tissue Repair Society. 2008; 16: 254–65.
6. Bagabir R, Byers RJ, Chaudhry IH, Muller W, Paus R, Bayat A. Site-specific immunophenotyping of
keloid disease demonstrates immune upregulation and the presence of lymphoid aggregates. Br J
Dermatol. 2012; 167: 1053–66. doi: 10.1111/j.1365-2133.2012.11190.x PMID: 23106354
7. Syed F, Ahmadi E, Iqbal SA, Singh S, McGrouther DA, Bayat A. Fibroblasts from the growing margin
of keloid scars produce higher levels of collagen I and III compared with intralesional and extralesional
sites: clinical implications for lesional site-directed therapy. Br J Dermatol. 2011; 164: 83–96. doi: 10.
1111/j.1365-2133.2010.10048.x PMID: 20849516
8. Lu F, Gao J, Ogawa R, Hyakusoku H, Ou C. Biological differences between fibroblasts derived from
peripheral and central areas of keloid tissues. Plast Reconstr Surg. 2007; 120: 625–30. doi: 10.1097/
01.prs.0000270293.93612.7b PMID: 17700113
9. Mitsui H, Suarez-Farinas M, Belkin DA, Levenkova N, Fuentes-Duculan J, Coats I, et al. Combined
use of laser capture microdissection and cDNA microarray analysis identifies locally expressed
Site-specific analysis of keloid disease
PLOS ONE | DOI:10.1371/journal.pone.0172955 March 3, 2017 24 / 33

disease-related genes in focal regions of psoriasis vulgaris skin lesions. The Journal of investigative
dermatology. 2012; 132: 1615–26. doi: 10.1038/jid.2012.33 PMID: 22402443
10. Marmai C, Sutherland RE, Kim KK, Dolganov GM, Fang X, Kim SS, et al. Alveolar epithelial cells
express mesenchymal proteins in patients with idiopathic pulmonary fibrosis. Am J Physiol Lung Cell
Mol Physiol. 2011; 301: L71–8. doi: 10.1152/ajplung.00212.2010 PMID: 21498628
11. Makhzami S, Rambow F, Delmas V, Larue L. Efficient gene expression profiling of laser-microdis-
sected melanoma metastases. Pigment Cell Melanoma Res. 2012; 25: 783–91. doi: 10.1111/pcmr.
12013 PMID: 22934821
12. Mabry KM, Payne SZ, Anseth KS. Microarray analyses to quantify advantages of 2D and 3D hydrogel
culture systems in maintaining the native valvular interstitial cell phenotype. Biomaterials. 2016; 74:
31–41. doi: 10.1016/j.biomaterials.2015.09.035 PMID: 26433490
13. Zhang Q, Yamaza T, Kelly AP, Shi S, Wang S, Brown J, et al. Tumor-like stem cells derived from
human keloid are governed by the inflammatory niche driven by IL-17/IL-6 axis. PLoS One. 2009; 4:
e7798. doi: 10.1371/journal.pone.0007798 PMID: 19907660
14. Lee JY, Yang CC, Chao SC, Wong TW. Histopathological differential diagnosis of keloid and hypertro-
phic scar. Am J Dermatopathol. 2004; 26: 379–84. PMID: 15365369
15. Bayat A, Arscott G, Ollier WE, McGrouther DA, Ferguson MW. Keloid disease: clinical relevance of
single versus multiple site scars. British journal of plastic surgery. 2005; 58: 28–37. doi: 10.1016/j.bjps.
2004.04.024 PMID: 15629164
16. Clement-Ziza M, Munnich A, Lyonnet S, Jaubert F, Besmond C. Stabilization of RNA during laser cap-
ture microdissection by performing experiments under argon atmosphere or using ethanol as a solvent
in staining solutions. RNA. 2008; 14: 2698–704. doi: 10.1261/rna.1261708 PMID: 18945804
17. Kolijn K, van Leenders GJ. Comparison of RNA extraction kits and histological stains for laser capture
microdissected prostate tissue. BMC research notes. 2016; 9: 1–6.
18. Harries MJ, Meyer K, Chaudhry I, J EK, Poblet E, Griffiths CE, et al. Lichen planopilaris is character-
ized by immune privilege collapse of the hair follicle’s epithelial stem cell niche. J Pathol. 2013; 231:
236–47. doi: 10.1002/path.4233 PMID: 23788005
19. Kameda T, Shide K, Yamaji T, Kamiunten A, Sekine M, Hidaka T, et al. Gene expression profiling of
loss of TET2 and/or JAK2V617F mutant hematopoietic stem cells from mouse models of myeloprolif-
erative neoplasms. Genomics data. 2015; 4: 102–8. doi: 10.1016/j.gdata.2015.04.002 PMID:
26484191
20. Masuda A, Katoh N, Nakabayashi K, Kato K, Sonoda K, Kitade M, et al. An improved method for isola-
tion of epithelial and stromal cells from the human endometrium. The Journal of reproduction and
development. 2016; 62: 213. doi: 10.1262/jrd.2015-137 PMID: 26853786
21. Leguen I, Le Cam A, Montfort J, Peron S, Fautrel A. Transcriptomic Analysis of Trout Gill Ionocytes in
Fresh Water and Sea Water Using Laser Capture Microdissection Combined with Microarray Analysis.
PloS one. 2015; 10: e0139938. doi: 10.1371/journal.pone.0139938 PMID: 26439495
22. Ashcroft KJ, Syed F, Bayat A. Site-specific keloid fibroblasts alter the behaviour of normal skin and
normal scar fibroblasts through paracrine signalling. PLoS One. 2013; 8: e75600. doi: 10.1371/journal.
pone.0075600 PMID: 24348987
23. Jumper N, Hodgkinson T, Arscott G, Har-Shai Y, Paus R, Bayat A. The aldo-keto reductase AKR1B10
is upregulated in keloid epidermis, implicating retinoic acid pathway dysregulation in the pathogenesis
of keloid disease. The Journal of investigative dermatology. 2016 Jul; 136(7):1500–12. doi: 10.1016/j.
jid.2016.03.022 PMID: 27025872
24. Benjamini Y, Hochberg Y. Controlling the false discovery rate: a practical and powerful approach to
multiple testing. Journal of the royal statistical society Series B (Methodological). 1995: 289–300.
25. Sidgwick GP, McGeorge D, Bayat A. Functional testing of topical skin formulations using an optimised
ex vivo skin organ culture model. Arch Dermatol Res. 2016; 308: 297–308. doi: 10.1007/s00403-016-
1645-8 PMID: 27086034
26. Bolstad BM, Irizarry RA, Åstrand M, Speed TP. A comparison of normalization methods for high den-
sity oligonucleotide array data based on variance and bias. Bioinformatics. 2003; 19: 185–93. PMID:
12538238
27. Ringner M. What is principal component analysis? Nature biotechnology. 2008; 26: 303–4. doi: 10.
1038/nbt0308-303 PMID: 18327243
28. Oliveros J. Venny. An interactive tool for comparing lists with Venn’s diagrams.(2007–2015).
29. Baker BM, Chen CS. Deconstructing the third dimension: how 3D culture microenvironments alter cel-
lular cues. J Cell Sci. 2012; 125: 3015–24. doi: 10.1242/jcs.079509 PMID: 22797912
Site-specific analysis of keloid disease
PLOS ONE | DOI:10.1371/journal.pone.0172955 March 3, 2017 25 / 33

30. Lee WJ, Park JH, Shin JU, Noh H, Lew DH, Yang WI, et al. Endothelial-to-mesenchymal transition
induced by Wnt 3a in keloid pathogenesis. Wound repair and regeneration: official publication of the
Wound Healing Society [and] the European Tissue Repair Society. 2015; 23: 435–42.
31. Lamouille S, Xu J, Derynck R. Molecular mechanisms of epithelial-mesenchymal transition. Nat Rev
Mol Cell Biol. 2014; 15: 178–96. doi: 10.1038/nrm3758 PMID: 24556840
32. Yang YL, Ju HZ, Liu SF, Lee TC, Shih YW, Chuang LY, et al. BMP-2 suppresses renal interstitial fibro-
sis by regulating epithelial-mesenchymal transition. J Cell Biochem. 2011; 112: 2558–65. doi: 10.
1002/jcb.23180 PMID: 21590708
33. Pratap A, Singh S, Mundra V, Yang N, Panakanti R, Eason JD, et al. Attenuation of early liver fibrosis
by pharmacological inhibition of smoothened receptor signaling. J Drug Target. 2012; 20: 770–82. doi:
10.3109/1061186X.2012.719900 PMID: 22994359
34. Grant C, Chudakova DA, Itinteang T, Chibnall AM, Brasch HD, Davis PF, et al. Expression of embry-
onic stem cell markers in keloid-associated lymphoid tissue. J Clin Pathol. 2016.
35. Honda K, Yanai H, Negishi H, Asagiri M, Sato M, Mizutani T, et al. IRF-7 is the master regulator of
type-I interferon-dependent immune responses. Nature. 2005; 434: 772–7. doi: 10.1038/nature03464
PMID: 15800576
36. Lu P, Weaver VM, Werb Z. The extracellular matrix: a dynamic niche in cancer progression. J Cell
Biol. 2012; 196: 395–406. doi: 10.1083/jcb.201102147 PMID: 22351925
37. Pan X, Hobbs RP, Coulombe PA. The expanding significance of keratin intermediate filaments in nor-
mal and diseased epithelia. Curr Opin Cell Biol. 2013; 25: 47–56. doi: 10.1016/j.ceb.2012.10.018
PMID: 23270662
38. Rotty JD, Coulombe PA. A wound-induced keratin inhibits Src activity during keratinocyte migration
and tissue repair. J Cell Biol. 2012; 197: 381–9. doi: 10.1083/jcb.201107078 PMID: 22529101
39. Luo S, Yufit T, Carson P, Fiore D, Falanga J, Lin X, et al. Differential keratin expression during epiboly
in a wound model of bioengineered skin and in human chronic wounds. Int J Low Extrem Wounds.
2011; 10: 122–9. doi: 10.1177/1534734611418157 PMID: 21856973
40. Leigh IM, Navsaria H, Purkis PE, McKay IA, Bowden PE, Riddle PN. Keratins (K16 and K17) as mark-
ers of keratinocyte hyperproliferation in psoriasis in vivo and in vitro. Br J Dermatol. 1995; 133: 501–
11. PMID: 7577575
41. Conley SJ, Bosco EE, Tice DA, Hollingsworth RE, Herbst R, Xiao Z. HER2 drives Mucin-like 1 to con-
trol proliferation in breast cancer cells. Oncogene. 2016.
42. Hakvoort TE, Altun V, Ramrattan RS, van der Kwast TH, Benner R, van Zuijlen PP, et al. Epidermal
participation in post-burn hypertrophic scar development. Virchows Arch. 1999; 434: 221–6. PMID:
10190301
43. Santucci M, Borgognoni L, Reali UM, Gabbiani G. Keloids and hypertrophic scars of Caucasians show
distinctive morphologic and immunophenotypic profiles. Virchows Arch. 2001; 438: 457–63. PMID:
11407473
44. Alessio M, Gruarin P, Castagnoli C, Trombotto C, Stella M. Primary ex vivo culture of keratinocytes iso-
lated from hypertrophic scars as a means of biochemical characterization of CD36. Int J Clin Lab Res.
1998; 28: 47–54. PMID: 9594363
45. Xiong W, Frasch SC, Thomas SM, Bratton DL, Henson PM. Induction of TGF-beta1 synthesis by mac-
rophages in response to apoptotic cells requires activation of the scavenger receptor CD36. PLoS
One. 2013; 8: e72772. doi: 10.1371/journal.pone.0072772 PMID: 23936544
46. He S, Liu X, Yang Y, Huang W, Xu S, Yang S, et al. Mechanisms of transforming growth factor beta(1)/
Smad signalling mediated by mitogen-activated protein kinase pathways in keloid fibroblasts. Br J Der-
matol. 2010; 162: 538–46. doi: 10.1111/j.1365-2133.2009.09511.x PMID: 19772524
47. Zhou P, Shi L, Li Q, Lu D. Overexpression of RACK1 inhibits collagen synthesis in keloid fibroblasts
via inhibition of transforming growth factor-beta1/Smad signaling pathway. Int J Clin Exp Med. 2015; 8:
15262–8. PMID: 26629012
48. Zhong A, Xu W, Zhao J, Xie P, Jia S, Sun J, et al. S100A8 and S100A9 Are Induced by Decreased
Hydration in the Epidermis and Promote Fibroblast Activation and Fibrosis in the Dermis. Am J Pathol.
2016; 186: 109–22. doi: 10.1016/j.ajpath.2015.09.005 PMID: 26597884
49. Ryckman C, Vandal K, Rouleau P, Talbot M, Tessier PA. Proinflammatory activities of S100: proteins
S100A8, S100A9, and S100A8/A9 induce neutrophil chemotaxis and adhesion. The Journal of Immu-
nology. 2003; 170: 3233–42. PMID: 12626582
50. Ong C, Khoo Y, Mukhopadhyay A, Masilamani J, Do D, Lim I, et al. Comparative proteomic analysis
between normal skin and keloid scar. British Journal of Dermatology. 2010; 162: 1302–15. doi: 10.
1111/j.1365-2133.2010.09660.x PMID: 20128793
Site-specific analysis of keloid disease
PLOS ONE | DOI:10.1371/journal.pone.0172955 March 3, 2017 26 / 33
51. Kerkhoff C, Voss A, Scholzen TE, Averill MM, Zanker KS, Bornfeldt KE. Novel insights into the role of
S100A8/A9 in skin biology. Experimental dermatology. 2012; 21: 822–6. doi: 10.1111/j.1600-0625.
2012.01571.x PMID: 22882537
52. Wang Q, Ma C, Kemmner W. Wdr66 is a novel marker for risk stratification and involved in epithelial-
mesenchymal transition of esophageal squamous cell carcinoma. BMC Cancer. 2013; 13: 137. doi:
10.1186/1471-2407-13-137 PMID: 23514407
53. Kalluri R, Neilson EG. Epithelial-mesenchymal transition and its implications for fibrosis. J Clin Invest.
2003; 112: 1776–84. doi: 10.1172/JCI20530 PMID: 14679171
54. Thiery JP, Sleeman JP. Complex networks orchestrate epithelial-mesenchymal transitions. Nat Rev
Mol Cell Biol. 2006; 7: 131–42. doi: 10.1038/nrm1835 PMID: 16493418
55. Hahn JM, Glaser K, McFarland KL, Aronow BJ, Boyce ST, Supp DM. Keloid-derived keratinocytes
exhibit an abnormal gene expression profile consistent with a distinct causal role in keloid pathology.
Wound repair and regeneration: official publication of the Wound Healing Society [and] the European
Tissue Repair Society. 2013; 21: 530–44.
56. Do DV, Ong CT, Khoo YT, Carbone A, Lim CP, Wang S, et al. Interleukin-18 system plays an impor-
tant role in keloid pathogenesis via epithelial-mesenchymal interactions. Br J Dermatol. 2012; 166:
1275–88. doi: 10.1111/j.1365-2133.2011.10721.x PMID: 22050194
57. Shang X, Lin X, Alvarez E, Manorek G, Howell SB. Tight junction proteins claudin-3 and claudin-4 con-
trol tumor growth and metastases. Neoplasia. 2012; 14: 974–IN22. PMID: 23097631
58. Lin X, Shang X, Manorek G, Howell SB. Regulation of the Epithelial-Mesenchymal Transition by Clau-
din-3 and Claudin-4. PLoS One. 2013; 8: e67496. doi: 10.1371/journal.pone.0067496 PMID:
23805314
59. Michl P, Barth C, Buchholz M, Lerch MM, Rolke M, Holzmann KH, et al. Claudin-4 expression
decreases invasiveness and metastatic potential of pancreatic cancer. Cancer Res. 2003; 63: 6265–
71. PMID: 14559813
60. Bujko M, Kober P, Mikula M, Ligaj M, Ostrowski J, Siedlecki JA. Expression changes of cell-cell adhe-
sion-related genes in colorectal tumors. Oncol Lett. 2015; 9: 2463–70. doi: 10.3892/ol.2015.3107
PMID: 26137091
61. Harrison H, Farnie G, Howell SJ, Rock RE, Stylianou S, Brennan KR, et al. Regulation of breast cancer
stem cell activity by signaling through the Notch4 receptor. Cancer Res. 2010; 70: 709–18. doi: 10.
1158/0008-5472.CAN-09-1681 PMID: 20068161
62. Bonyadi Rad E, Hammerlindl H, Wels C, Popper U, Ravindran Menon D, Breiteneder H, et al. Notch4
Signaling Induces a Mesenchymal-Epithelial-like Transition in Melanoma Cells to Suppress Malignant
Behaviors. Cancer Res. 2016.
63. Ma X, Chen J, Xu B, Long X, Qin H, Zhao RC, et al. Keloid-derived keratinocytes acquire a fibroblast-
like appearance and an enhanced invasive capacity in a hypoxic microenvironment in vitro. Int J Mol
Med. 2015; 35: 1246–56. doi: 10.3892/ijmm.2015.2135 PMID: 25777304
64. Yan L, Cao R, Wang L, Liu Y, Pan B, Yin Y, et al. Epithelial-mesenchymal transition in keloid tissues
and TGF-beta1-induced hair follicle outer root sheath keratinocytes. Wound repair and regeneration:
official publication of the Wound Healing Society [and] the European Tissue Repair Society. 2015; 23:
601–10.
65. Kalluri R, Weinberg RA. The basics of epithelial-mesenchymal transition. The Journal of clinical inves-
tigation. 2009; 119: 1420–8. doi: 10.1172/JCI39104 PMID: 19487818
66. Verrecchia F, Mauviel A. Transforming growth factor-beta and fibrosis. World J Gastroenterol. 2007;
13: 3056–62. doi: 10.3748/wjg.v13.i22.3056 PMID: 17589920
67. Lan CC, Fang AH, Wu PH, Wu CS. Tacrolimus abrogates TGF-beta1-induced type I collagen produc-
tion in normal human fibroblasts through suppressing p38MAPK signalling pathway: implications on
treatment of chronic atopic dermatitis lesions. J Eur Acad Dermatol Venereol. 2014; 28: 204–15. doi:
10.1111/jdv.12086 PMID: 23301526
68. Steplewski A, Fertala A. Inhibition of collagen fibril formation. Fibrogenesis Tissue Repair. 2012; 5:
S29. doi: 10.1186/1755-1536-5-S1-S29 PMID: 23259659
69. Kelwick R, Desanlis I, Wheeler GN, Edwards DR. The ADAMTS (A Disintegrin and Metalloproteinase
with Thrombospondin motifs) family. Genome Biol. 2015; 16: 113. doi: 10.1186/s13059-015-0676-3
PMID: 26025392
70. Bekhouche M, Colige A. The procollagen N-proteinases ADAMTS2, 3 and 14 in pathophysiology.
Matrix Biol. 2015; 44–46: 46–53. doi: 10.1016/j.matbio.2015.04.001 PMID: 25863161
71. Colige A, Vandenberghe I, Thiry M, Lambert CA, Van Beeumen J, Li SW, et al. Cloning and characteri-
zation of ADAMTS-14, a novel ADAMTS displaying high homology with ADAMTS-2 and ADAMTS-3.
Site-specific analysis of keloid disease
PLOS ONE | DOI:10.1371/journal.pone.0172955 March 3, 2017 27 / 33
The Journal of biological chemistry. 2002; 277: 5756–66. doi: 10.1074/jbc.M105601200 PMID:
11741898
72. Broder C, Arnold P, Vadon-Le Goff S, Konerding MA, Bahr K, Muller S, et al. Metalloproteases meprin
alpha and meprin beta are C- and N-procollagen proteinases important for collagen assembly and ten-
sile strength. Proc Natl Acad Sci U S A. 2013; 110: 14219–24. doi: 10.1073/pnas.1305464110 PMID:
23940311
73. Johnston P, Chojnowski AJ, Davidson RK, Riley GP, Donell ST, Clark IM. A complete expression pro-
file of matrix-degrading metalloproteinases in Dupuytren’s disease. J Hand Surg Am. 2007; 32: 343–
51. doi: 10.1016/j.jhsa.2006.12.010 PMID: 17336841
74. Zhou SH, Yang WJ, Liu SW, Li J, Zhang CY, Zhu Y, et al. Gene expression profiling of craniofacial
fibrous dysplasia reveals ADAMTS2 overexpression as a potential marker. Int J Clin Exp Pathol. 2014;
7: 8532–41. PMID: 25674217
75. Colige A, Nuytinck L, Hausser I, van Essen AJ, Thiry M, Herens C, et al. Novel types of mutation
responsible for the dermatosparactic type of Ehlers-Danlos syndrome (Type VIIC) and common poly-
morphisms in the ADAMTS2 gene. The Journal of investigative dermatology. 2004; 123: 656–63. doi:
10.1111/j.0022-202X.2004.23406.x PMID: 15373769
76. Kumar S, Rao N, Ge R. Emerging Roles of ADAMTSs in Angiogenesis and Cancer. Cancers (Basel).
2012; 4: 1252–99.
77. Cal S, Lopez-Otin C. ADAMTS proteases and cancer. Matrix Biol. 2015; 44–46: 77–85. doi: 10.1016/j.
matbio.2015.01.013 PMID: 25636539
78. Li SW, Arita M, Fertala A, Bao Y, Kopen GC, Langsjo TK, et al. Transgenic mice with inactive alleles
for procollagen N-proteinase (ADAMTS-2) develop fragile skin and male sterility. Biochem J. 2001;
355: 271–8. PMID: 11284712
79. Kesteloot F, Desmouliere A, Leclercq I, Thiry M, Arrese JE, Prockop DJ, et al. ADAM metallopeptidase
with thrombospondin type 1 motif 2 inactivation reduces the extent and stability of carbon tetrachlo-
ride-induced hepatic fibrosis in mice. Hepatology. 2007; 46: 1620–31. doi: 10.1002/hep.21868 PMID:
17929299
80. Wang WM, Lee S, Steiglitz BM, Scott IC, Lebares CC, Allen ML, et al. Transforming growth factor-beta
induces secretion of activated ADAMTS-2. A procollagen III N-proteinase. The Journal of biological
chemistry. 2003; 278: 19549–57. doi: 10.1074/jbc.M300767200 PMID: 12646579
81. Bekhouche M, Leduc C, Dupont L, Janssen L, Delolme F, Vadon-Le Goff S, et al. Determination of the
substrate repertoire of ADAMTS2, 3, and 14 significantly broadens their functions and identifies extra-
cellular matrix organization and TGF-beta signaling as primary targets. FASEB J. 2016.
82. Jones GC, Riley GP. ADAMTS proteinases: a multi-domain, multi-functional family with roles in extra-
cellular matrix turnover and arthritis. Arthritis Res Ther. 2005; 7: 160–9. doi: 10.1186/ar1783 PMID:
15987500
83. Wang WM, Ge G, Lim NH, Nagase H, Greenspan DS. TIMP-3 inhibits the procollagen N-proteinase
ADAMTS-2. Biochem J. 2006; 398: 515–9. doi: 10.1042/BJ20060630 PMID: 16771712
84. Dulauroy S, Di Carlo SE, Langa F, Eberl G, Peduto L. Lineage tracing and genetic ablation of ADAM12
(+) perivascular cells identify a major source of profibrotic cells during acute tissue injury. Nat Med.
2012; 18: 1262–70. doi: 10.1038/nm.2848 PMID: 22842476
85. Shih B, Wijeratne D, Armstrong DJ, Lindau T, Day P, Bayat A. Identification of biomarkers in Dupuy-
tren’s disease by comparative analysis of fibroblasts versus tissue biopsies in disease-specific pheno-
types. J Hand Surg Am. 2009; 34: 124–36. doi: 10.1016/j.jhsa.2008.09.017 PMID: 19121738
86. Kveiborg M, Albrechtsen R, Couchman JR, Wewer UM. Cellular roles of ADAM12 in health and dis-
ease. The international journal of biochemistry & cell biology. 2008; 40: 1685–702.
87. Ruff M, Leyme A, Le Cann F, Bonnier D, Le Seyec J, Chesnel F, et al. The Disintegrin and Metallopro-
tease ADAM12 Is Associated with TGF-beta-Induced Epithelial to Mesenchymal Transition. PLoS
One. 2015; 10: e0139179. doi: 10.1371/journal.pone.0139179 PMID: 26407179
88. Naitoh M, Kubota H, Ikeda M, Tanaka T, Shirane H, Suzuki S, et al. Gene expression in human keloids
is altered from dermal to chondrocytic and osteogenic lineage. Genes Cells. 2005; 10: 1081–91. doi:
10.1111/j.1365-2443.2005.00902.x PMID: 16236136
89. Inui S, Shono F, Nakajima T, Hosokawa K, Itami S. Identification and characterization of cartilage olig-
omeric matrix protein as a novel pathogenic factor in keloids. Am J Pathol. 2011; 179: 1951–60. doi:
10.1016/j.ajpath.2011.06.034 PMID: 21872564
90. Agarwal P, Schulz JN, Blumbach K, Andreasson K, Heinegard D, Paulsson M, et al. Enhanced deposi-
tion of cartilage oligomeric matrix protein is a common feature in fibrotic skin pathologies. Matrix Biol.
2013; 32: 325–31. doi: 10.1016/j.matbio.2013.02.010 PMID: 23507196
Site-specific analysis of keloid disease
PLOS ONE | DOI:10.1371/journal.pone.0172955 March 3, 2017 28 / 33

91. Li J, Cao J, Li M, Yu Y, Yang Y, Xiao X, et al. Collagen triple helix repeat containing-1 inhibits trans-
forming growth factor-b1-induced collagen type I expression in keloid. Br J Dermatol. 2011; 164:
1030–6. PMID: 21667528
92. Bauer Y, Tedrow J, de Bernard S, Birker-Robaczewska M, Gibson KF, Guardela BJ, et al. A novel
genomic signature with translational significance for human idiopathic pulmonary fibrosis. Am J Respir
Cell Mol Biol. 2015; 52: 217–31. doi: 10.1165/rcmb.2013-0310OC PMID: 25029475
93. LeClair R, Lindner V. The role of collagen triple helix repeat containing 1 in injured arteries, collagen
expression, and transforming growth factor beta signaling. Trends Cardiovasc Med. 2007; 17: 202–5.
doi: 10.1016/j.tcm.2007.05.004 PMID: 17662915
94. Eriksson J, Le Joncour V, Nummela P, Jahkola T, Virolainen S, Laakkonen P, et al. Gene expression
analyses of primary melanomas reveal CTHRC1 as an important player in melanoma progression.
Oncotarget. 2016.
95. Wang CY, Zhang JJ, Hua L, Yao KH, Chen JT, Ren XQ. MicroRNA-98 suppresses cell proliferation,
migration and invasion by targeting collagen triple helix repeat containing 1 in hepatocellular carci-
noma. Mol Med Rep. 2016; 13: 2639–44. doi: 10.3892/mmr.2016.4833 PMID: 26846175
96. Ding Q, Zhang M, Liu C. Asporin participates in gastric cancer cell growth and migration by influencing
EGF receptor signaling. Oncol Rep. 2015; 33: 1783–90. doi: 10.3892/or.2015.3791 PMID: 25673058
97. Hurley PJ, Sundi D, Shinder B, Simons BW, Hughes RM, Miller RM, et al. Germline Variants in Asporin
Vary by Race, Modulate the Tumor Microenvironment, and Are Differentially Associated with Meta-
static Prostate Cancer. Clin Cancer Res. 2016; 22: 448–58. doi: 10.1158/1078-0432.CCR-15-0256
PMID: 26446945
98. Shih B, McGrouther DA, Bayat A. Identification of novel keloid biomarkers through profiling of tissue
biopsies versus cell cultures in keloid margin specimens compared to adjacent normal skin. Eplasty.
2010; 10: e24. PMID: 20418938
99. van Beuge MM, Ten Dam EJ, Werker PM, Bank RA. Wnt pathway in Dupuytren disease: connecting
profibrotic signals. Transl Res. 2015; 166: 762–71 e3. doi: 10.1016/j.trsl.2015.09.006 PMID:
26470681
100. Jian YC, Wang JJ, Dong S, Hu JW, Hu LJ, Yang GM, et al. Wnt-induced secreted protein 1/CCN4 in
liver fibrosis both in vitro and in vivo. Clin Lab. 2014; 60: 29–35. PMID: 24600972
101. Berschneider B, Ellwanger DC, Baarsma HA, Thiel C, Shimbori C, White ES, et al. miR-92a regulates
TGF-beta1-induced WISP1 expression in pulmonary fibrosis. The international journal of biochemistry
& cell biology. 2014; 53: 432–41.
102. Andrews JP, Marttala J, Macarak E, Rosenbloom J, Uitto J. Keloids: The paradigm of skin fibrosis—
Pathomechanisms and treatment. Matrix Biol. 2016.
103. Wu CS, Wu PH, Fang AH, Lan CC. FK506 inhibits the enhancing effects of transforming growth factor
(TGF)-beta1 on collagen expression and TGF-beta/Smad signalling in keloid fibroblasts: implication
for new therapeutic approach. Br J Dermatol. 2012; 167: 532–41. doi: 10.1111/j.1365-2133.2012.
11023.x PMID: 22540338
104. Katsuno Y, Lamouille S, Derynck R. TGF-beta signaling and epithelial-mesenchymal transition in can-
cer progression. Curr Opin Oncol. 2013; 25: 76–84. doi: 10.1097/CCO.0b013e32835b6371 PMID:
23197193
105. Derynck R, Muthusamy BP, Saeteurn KY. Signaling pathway cooperation in TGF-beta-induced epithe-
lial-mesenchymal transition. Curr Opin Cell Biol. 2014; 31: 56–66. doi: 10.1016/j.ceb.2014.09.001
PMID: 25240174
106. Strzyz P. Cancer biology: TGF [beta] and EMT as double agents. Nature Reviews Molecular Cell Biol-
ogy. 2016.
107. David CJ, Huang Y-H, Chen M, Su J, Zou Y, Bardeesy N, et al. TGF-β Tumor Suppression through a
Lethal EMT. Cell. 2016; 164: 1015–30. doi: 10.1016/j.cell.2016.01.009 PMID: 26898331
108. Valcourt U, Carthy J, Okita Y, Alcaraz L, Kato M, Thuault S, et al. Analysis of Epithelial–Mesenchymal
Transition Induced by Transforming Growth Factor β. TGF-βSignaling: Methods and Protocols. 2016:
147–81.
109. Eming SA, Krieg T, Davidson JM. Inflammation in wound repair: molecular and cellular mechanisms.
The Journal of investigative dermatology. 2007; 127: 514–25. doi: 10.1038/sj.jid.5700701 PMID:
17299434
110. Qian LW, Fourcaudot AB, Yamane K, You T, Chan RK, Leung KP. Exacerbated and prolonged inflam-
mation impairs wound healing and increases scarring. Wound repair and regeneration: official publica-
tion of the Wound Healing Society [and] the European Tissue Repair Society. 2016; 24: 26–34.
Site-specific analysis of keloid disease
PLOS ONE | DOI:10.1371/journal.pone.0172955 March 3, 2017 29 / 33

111. Zhang M, Xu Y, Liu Y, Cheng Y, Zhao P, Liu H, et al. Chemokine-Like Factor 1 (CKLF-1) is Overex-
pressed in Keloid Patients: A Potential Indicating Factor for Keloid-Predisposed Individuals. Medicine
(Baltimore). 2016; 95: e3082.
112. Dong X, Mao S, Wen H. Upregulation of proinflammatory genes in skin lesions may be the cause of
keloid formation (Review). Biomed Rep. 2013; 1: 833–6. doi: 10.3892/br.2013.169 PMID: 24649037
113. Borthwick LA, Wynn TA. IL-13 and TGF-β1: Core Mediators of Fibrosis. Current Pathobiology Reports.
2015; 3: 273–82.
114. Baraut J, Farge D, Jean-Louis F, Masse I, Grigore EI, Arruda LC, et al. Transforming growth factor-
beta increases interleukin-13 synthesis via GATA-3 transcription factor in T-lymphocytes from patients
with systemic sclerosis. Arthritis Res Ther. 2015; 17: 196. doi: 10.1186/s13075-015-0708-0 PMID:
26227022
115. Oriente A, Fedarko NS, Pacocha SE, Huang SK, Lichtenstein LM, Essayan DM. Interleukin-13 modu-
lates collagen homeostasis in human skin and keloid fibroblasts. J Pharmacol Exp Ther. 2000; 292:
988–94. PMID: 10688614
116. McCormick SM, Heller NM. Commentary: IL-4 and IL-13 receptors and signaling. Cytokine. 2015; 75:
38–50. doi: 10.1016/j.cyto.2015.05.023 PMID: 26187331
117. Granel B, Allanore Y, Chevillard C, Arnaud V, Marquet S, Weiller PJ, et al. IL13RA2 gene polymor-
phisms are associated with systemic sclerosis. J Rheumatol. 2006; 33: 2015–9. PMID: 16981293
118. Chiaramonte MG, Mentink-Kane M, Jacobson BA, Cheever AW, Whitters MJ, Goad ME, et al. Regula-
tion and function of the interleukin 13 receptor alpha 2 during a T helper cell type 2-dominant immune
response. J Exp Med. 2003; 197: 687–701. doi: 10.1084/jem.20020903 PMID: 12642601
119. Wood N, Whitters MJ, Jacobson BA, Witek J, Sypek JP, Kasaian M, et al. Enhanced interleukin (IL)-13
responses in mice lacking IL-13 receptor alpha 2. J Exp Med. 2003; 197: 703–9. doi: 10.1084/jem.
20020906 PMID: 12642602
120. Keane MP, Gomperts BN, Weigt S, Xue YY, Burdick MD, Nakamura H, et al. IL-13 is pivotal in the
fibro-obliterative process of bronchiolitis obliterans syndrome. J Immunol. 2007; 178: 511–9. PMID:
17182591
121. Kolodsick JE, Toews GB, Jakubzick C, Hogaboam C, Moore TA, McKenzie A, et al. Protection from
fluorescein isothiocyanate-induced fibrosis in IL-13-deficient, but not IL-4-deficient, mice results from
impaired collagen synthesis by fibroblasts. J Immunol. 2004; 172: 4068–76. PMID: 15034018
122. Charrad R, Berraies A, Hamdi B, Ammar J, Hamzaoui K, Hamzaoui A. Anti-inflammatory activity of IL-
37 in asthmatic children: Correlation with inflammatory cytokines TNF-alpha, IL-beta, IL-6 and IL-17A.
Immunobiology. 2016; 221: 182–7. doi: 10.1016/j.imbio.2015.09.009 PMID: 26454413
123. Imaeda H, Takahashi K, Fujimoto T, Kasumi E, Ban H, Bamba S, et al. Epithelial expression of inter-
leukin-37b in inflammatory bowel disease. Clin Exp Immunol. 2013; 172: 410–6. doi: 10.1111/cei.
12061 PMID: 23600829
124. Chen Z, O’Shea JJ. Regulation of IL-17 production in human lymphocytes. Cytokine. 2008; 41: 71–8.
doi: 10.1016/j.cyto.2007.09.009 PMID: 17981475
125. Benevides L, da Fonseca DM, Donate PB, Tiezzi DG, De Carvalho DD, de Andrade JM, et al. IL17
Promotes Mammary Tumor Progression by Changing the Behavior of Tumor Cells and Eliciting
Tumorigenic Neutrophils Recruitment. Cancer Res. 2015; 75: 3788–99. doi: 10.1158/0008-5472.
CAN-15-0054 PMID: 26208902
126. Isailovic N, Daigo K, Mantovani A, Selmi C. Interleukin-17 and innate immunity in infections and
chronic inflammation. J Autoimmun. 2015; 60: 1–11. doi: 10.1016/j.jaut.2015.04.006 PMID: 25998834
127. Loubaki L, Hadj-Salem I, Fakhfakh R, Jacques E, Plante S, Boisvert M, et al. Co-culture of human
bronchial fibroblasts and CD4+ T cells increases Th17 cytokine signature. PloS one. 2013; 8: e81983.
doi: 10.1371/journal.pone.0081983 PMID: 24349168
128. Qu M, Song N, Chai G, Wu X, Liu W. Pathological niche environment transforms dermal stem cells to
keloid stem cells: a hypothesis of keloid formation and development. Med Hypotheses. 2013; 81: 807–
12. doi: 10.1016/j.mehy.2013.08.033 PMID: 24074897
129. Gu FM, Li QL, Gao Q, Jiang JH, Zhu K, Huang XY, et al. IL-17 induces AKT-dependent IL-6/JAK2/
STAT3 activation and tumor progression in hepatocellular carcinoma. Mol Cancer. 2011; 10: 150. doi:
10.1186/1476-4598-10-150 PMID: 22171994
130. Jadidi-Niaragh F, Ghalamfarsa G, Memarian A, Asgarian-Omran H, Razavi SM, Sarrafnejad A, et al.
Downregulation of IL-17-producing T cells is associated with regulatory T cell expansion and disease
progression in chronic lymphocytic leukemia. Tumour Biol. 2013; 34: 929–40. doi: 10.1007/s13277-
012-0628-4 PMID: 23269607
Site-specific analysis of keloid disease
PLOS ONE | DOI:10.1371/journal.pone.0172955 March 3, 2017 30 / 33
131. Francois A, Gombault A, Villeret B, Alsaleh G, Fanny M, Gasse P, et al. B cell activating factor is cen-
tral to bleomycin- and IL-17-mediated experimental pulmonary fibrosis. J Autoimmun. 2015; 56: 1–11.
doi: 10.1016/j.jaut.2014.08.003 PMID: 25441030
132. Wang L, Chen S, Xu K. IL-17 expression is correlated with hepatitis Brelated liver diseases and fibro-
sis. Int J Mol Med. 2011; 27: 385–92. doi: 10.3892/ijmm.2011.594 PMID: 21225222
133. Okamoto Y, Hasegawa M, Matsushita T, Hamaguchi Y, Huu DL, Iwakura Y, et al. Potential roles of
interleukin-17A in the development of skin fibrosis in mice. Arthritis & Rheumatism. 2012; 64: 3726–
35.
134. Nittka S, Gunther J, Ebisch C, Erbersdobler A, Neumaier M. The human tumor suppressor CEACAM1
modulates apoptosis and is implicated in early colorectal tumorigenesis. Oncogene. 2004; 23: 9306–
13. doi: 10.1038/sj.onc.1208259 PMID: 15568039
135. Cruz PV, Wakai T, Shirai Y, Yokoyama N, Hatakeyama K. Loss of carcinoembryonic antigen-related
cell adhesion molecule 1 expression is an adverse prognostic factor in hepatocellular carcinoma. Can-
cer. 2005; 104: 354–60. doi: 10.1002/cncr.21159 PMID: 15952183
136. Busch C, Hanssen TA, Wagener C, B OB. Down-regulation of CEACAM1 in human prostate cancer:
correlation with loss of cell polarity, increased proliferation rate, and Gleason grade 3 to 4 transition.
Hum Pathol. 2002; 33: 290–8. PMID: 11979369
137. Oliveira-Ferrer L, Tilki D, Ziegeler G, Hauschild J, Loges S, Irmak S, et al. Dual role of carcinoembry-
onic antigen-related cell adhesion molecule 1 in angiogenesis and invasion of human urinary bladder
cancer. Cancer Res. 2004; 64: 8932–8. doi: 10.1158/0008-5472.CAN-04-0505 PMID: 15604255
138. Ashkenazi S, Ortenberg R, Besser M, Schachter J, Markel G. SOX9 indirectly regulates CEACAM1
expression and immune resistance in melanoma cells. Oncotarget. 2016.
139. Zalzali H, Naudin C, Bastide P, Quittau-Prevostel C, Yaghi C, Poulat F, et al. CEACAM1, a SOX9
direct transcriptional target identified in the colon epithelium. Oncogene. 2008; 27: 7131–8. doi: 10.
1038/onc.2008.331 PMID: 18794798
140. Roda G, Dahan S, Mezzanotte L, Caponi A, Roth-Walter F, Pinn D, et al. Defect in CEACAM family
member expression in Crohn’s disease IECs is regulated by the transcription factor SOX9. Inflamm
Bowel Dis. 2009; 15: 1775–83. doi: 10.1002/ibd.21023 PMID: 19637360
141. Yan C, Boyd DD. ATF3 regulates the stability of p53: a link to cancer. Cell Cycle. 2006; 5: 926–9. doi:
10.4161/cc.5.9.2714 PMID: 16628010
142. Hackl C, Lang SA, Moser C, Mori A, Fichtner-Feigl S, Hellerbrand C, et al. Activating transcription fac-
tor-3 (ATF3) functions as a tumor suppressor in colon cancer and is up-regulated upon heat-shock pro-
tein 90 (Hsp90) inhibition. BMC Cancer. 2010; 10: 668. doi: 10.1186/1471-2407-10-668 PMID:
21129190
143. Zhou H, Yuan Y, Ni J, Guo H, Deng W, Bian ZY, et al. Pleiotropic and puzzling effects of ATF3 in mal-
adaptive cardiac remodeling. Int J Cardiol. 2016; 206: 87–8. doi: 10.1016/j.ijcard.2016.01.143 PMID:
26780683
144. Huang X, Li X, Guo B. KLF6 induces apoptosis in prostate cancer cells through up-regulation of ATF3.
The Journal of biological chemistry. 2008; 283: 29795–801. doi: 10.1074/jbc.M802515200 PMID:
18755691
145. Xie JJ, Xie YM, Chen B, Pan F, Guo JC, Zhao Q, et al. ATF3 functions as a novel tumor suppressor
with prognostic significance in esophageal squamous cell carcinoma. Oncotarget. 2014; 5: 8569–82.
doi: 10.18632/oncotarget.2322 PMID: 25149542
146. Eo HJ, Kwon TH, Park GH, Song HM, Lee SJ, Park NH, et al. In Vitro Anticancer Activity of Phlorofuco-
furoeckol A via Upregulation of Activating Transcription Factor 3 against Human Colorectal Cancer
Cells. Mar Drugs. 2016;14.
147. Jiliang S, Hui L, Gonghui L, Renan J, Liang S, Mingming C, et al. TR4 nuclear receptor enhances the
cisplatin chemo-sensitivity via altering the ATF3 expression to better suppress HCC cell growth. Onco-
target. 2016.
148. Song HM, Park GH, Eo HJ, Jeong JB. Naringenin-Mediated ATF3 Expression Contributes to Apopto-
sis in Human Colon Cancer. Biomol Ther (Seoul). 2016; 24: 140–6.
149. Meech R, Rogers A, Zhuang L, Lewis BC, Miners JO, Mackenzie PI. Identification of residues that con-
fer sugar selectivity to UDP-glycosyltransferase 3A (UGT3A) enzymes. The Journal of biological
chemistry. 2012; 287: 24122–30. doi: 10.1074/jbc.M112.343608 PMID: 22621930
150. MacKenzie PI, Rogers A, Elliot DJ, Chau N, Hulin JA, Miners JO, et al. The novel UDP glycosyltrans-
ferase 3A2: cloning, catalytic properties, and tissue distribution. Mol Pharmacol. 2011; 79: 472–8. doi:
10.1124/mol.110.069336 PMID: 21088224
151. Morikawa Y, Kezuka C, Endo S, Ikari A, Soda M, Yamamura K, et al. Acquisition of doxorubicin resis-
tance facilitates migrating and invasive potentials of gastric cancer MKN45 cells through up-regulating
Site-specific analysis of keloid disease
PLOS ONE | DOI:10.1371/journal.pone.0172955 March 3, 2017 31 / 33
aldo-keto reductase 1B10. Chem Biol Interact. 2015; 230: 30–9. doi: 10.1016/j.cbi.2015.02.005 PMID:
25686905
152. Januchowski R, Wojtowicz K, Zabel M. The role of aldehyde dehydrogenase (ALDH) in cancer drug
resistance. Biomed Pharmacother. 2013; 67: 669–80. doi: 10.1016/j.biopha.2013.04.005 PMID:
23721823
153. Nwabo Kamdje AH, Bassi G, Pacelli L, Malpeli G, Amati E, Nichele I, et al. Role of stromal cell-medi-
ated Notch signaling in CLL resistance to chemotherapy. Blood Cancer J. 2012; 2: e73. doi: 10.1038/
bcj.2012.17 PMID: 22829975
154. Simoes BM, O’Brien CS, Eyre R, Silva A, Yu L, Sarmiento-Castro A, et al. Anti-estrogen Resistance in
Human Breast Tumors Is Driven by JAG1-NOTCH4-Dependent Cancer Stem Cell Activity. Cell Rep.
2015; 12: 1968–77. doi: 10.1016/j.celrep.2015.08.050 PMID: 26387946
155. Honoki K, Fujii H, Kubo A, Kido A, Mori T, Tanaka Y, et al. Possible involvement of stem-like popula-
tions with elevated ALDH1 in sarcomas for chemotherapeutic drug resistance. Oncol Rep. 2010; 24:
501–5. PMID: 20596639
156. Whitman M, Hunter DG, Engle EC. Congenital Fibrosis of the Extraocular Muscles. In: Pagon RA,
Adam MP, Ardinger HH, Wallace SE, Amemiya A, Bean LJH, et al., editors. GeneReviews(R). Seattle
(WA)1993.
157. Leandro-Garcia LJ, Leskela S, Landa I, Montero-Conde C, Lopez-Jimenez E, Leton R, et al. Tumoral
and tissue-specific expression of the major human beta-tubulin isotypes. Cytoskeleton (Hoboken).
2010; 67: 214–23.
158. Lebok P, Ozturk M, Heilenkotter U, Jaenicke F, Muller V, Paluchowski P, et al. High levels of class III
beta-tubulin expression are associated with aggressive tumor features in breast cancer. Oncol Lett.
2016; 11: 1987–94. doi: 10.3892/ol.2016.4206 PMID: 26998111
159. Miyamoto A, Akasaka K, Oikawa H, Akasaka T, Masuda T, Maesawa C. Immunohistochemical study
of HER2 and TUBB3 proteins in extramammary Paget disease. Am J Dermatopathol. 2010; 32: 578–
85. doi: 10.1097/DAD.0b013e3181cd35e0 PMID: 20534991
160. McCarroll JA, Gan PP, Erlich RB, Liu M, Dwarte T, Sagnella SS, et al. TUBB3/betaIII-tubulin acts
through the PTEN/AKT signaling axis to promote tumorigenesis and anoikis resistance in non-small
cell lung cancer. Cancer Res. 2015; 75: 415–25. doi: 10.1158/0008-5472.CAN-14-2740 PMID:
25414139
161. Tsourlakis MC, Weigand P, Grupp K, Kluth M, Steurer S, Schlomm T, et al. betaIII-tubulin overexpres-
sion is an independent predictor of prostate cancer progression tightly linked to ERG fusion status and
PTEN deletion. Am J Pathol. 2014; 184: 609–17. doi: 10.1016/j.ajpath.2013.11.007 PMID: 24378408
162. Raspaglio G, Petrillo M, Martinelli E, Puma DDL, Mariani M, De Donato M, et al. Sox9 and Hif-2α regu-
late TUBB3 gene expression and affect ovarian cancer aggressiveness. Gene. 2014; 542: 173–81.
doi: 10.1016/j.gene.2014.03.037 PMID: 24661907
163. Duran GE, Wang YC, Francisco EB, Rose JC, Martinez FJ, Coller J, et al. Mechanisms of resistance
to cabazitaxel. Mol Cancer Ther. 2015; 14: 193–201. doi: 10.1158/1535-7163.MCT-14-0155 PMID:
25416788
164. Ferrandina G, Zannoni GF, Martinelli E, Paglia A, Gallotta V, Mozzetti S, et al. Class III beta-tubulin
overexpression is a marker of poor clinical outcome in advanced ovarian cancer patients. Clin Cancer
Res. 2006; 12: 2774–9. doi: 10.1158/1078-0432.CCR-05-2715 PMID: 16675570
165. Mariani M, Shahabi S, Sieber S, Scambia G, Ferlini C. Class III β-tubulin (TUBB3): more than a bio-
marker in solid tumors? Current molecular medicine. 2011; 11: 726–31. PMID: 21999149
166. Zhang Z, Nie F, Kang C, Chen B, Qin Z, Ma J, et al. Increased periostin expression affects the prolifer-
ation, collagen synthesis, migration and invasion of keloid fibroblasts under hypoxic conditions. Int J
Mol Med. 2014; 34: 253–61. doi: 10.3892/ijmm.2014.1760 PMID: 24788198
167. Touchi R, Ueda K, Kurokawa N, Tsuji M. Central regions of keloids are severely ischaemic. Journal of
plastic, reconstructive & aesthetic surgery: JPRAS. 2016; 69: e35–41.
168. Jones CD, Guiot L, Samy M, Gorman M, Tehrani H. The Use of Chemotherapeutics for the Treatment
of Keloid Scars. Dermatol Reports. 2015; 7: 5880. doi: 10.4081/dr.2015.5880 PMID: 26236447
169. van Leeuwen MC, Stokmans SC, Bulstra AE, Meijer OW, Heymans MW, Ket JC, et al. Surgical Exci-
sion with Adjuvant Irradiation for Treatment of Keloid Scars: A Systematic Review. Plast Reconstr
Surg Glob Open. 2015; 3: e440. doi: 10.1097/GOX.0000000000000357 PMID: 26301129
170. Arno AI, Gauglitz GG, Barret JP, Jeschke MG. Up-to-date approach to manage keloids and hypertro-
phic scars: a useful guide. Burns. 2014; 40: 1255–66. doi: 10.1016/j.burns.2014.02.011 PMID:
24767715
Site-specific analysis of keloid disease
PLOS ONE | DOI:10.1371/journal.pone.0172955 March 3, 2017 32 / 33

171. Song N, Wu X, Gao Z, Zhou G, Zhang WJ, Liu W. Enhanced expression of membrane transporter and
drug resistance in keloid fibroblasts. Hum Pathol. 2012; 43: 2024–32. doi: 10.1016/j.humpath.2011.12.
026 PMID: 22617232
172. Moon J-H, Kwak SS, Park G, Jung H-Y, Yoon BS, Park J, et al. Isolation and characterization of multi-
potent human keloid-derived mesenchymal-like stem cells. Stem cells and development. 2008; 17:
713–24. doi: 10.1089/scd.2007.0210 PMID: 18710345
173. Clavel G, Thiolat A, Boissier MC. Interleukin newcomers creating new numbers in rheumatology: IL-34
to IL-38. Joint Bone Spine. 2013; 80: 449–53. doi: 10.1016/j.jbspin.2013.04.014 PMID: 23849463
174. Singh A, Settleman J. EMT, cancer stem cells and drug resistance: an emerging axis of evil in the war
on cancer. Oncogene. 2010; 29: 4741–51. doi: 10.1038/onc.2010.215 PMID: 20531305
175. El-Serag H.B., et al., Gene expression in Barrett’s esophagus: laser capture versus whole tissue.
Scand J Gastroenterol, 2009. 44(7): p. 787–95. doi: 10.1080/00365520902898127 PMID: 19391063
176. De Marchi T., et al., The advantage of laser-capture microdissection over whole tissue analysis in
proteomic profiling studies. Proteomics, 2016. 16(10): p. 1474–85. doi: 10.1002/pmic.201600004
PMID: 27030549
177. Zheng J., et al., Laser capture microdissected mucosa versus whole tissue specimens for assessment
of radiation-induced dynamic molecular and pathway changes in the small intestine. PLoS One, 2013.
8(1): p. e53711. doi: 10.1371/journal.pone.0053711 PMID: 23341980
178. Shekouh A.R., et al., Application of laser capture microdissection combined with two-dimensional elec-
trophoresis for the discovery of differentially regulated proteins in pancreatic ductal adenocarcinoma.
Proteomics, 2003. 3(10): p. 1988–2001. doi: 10.1002/pmic.200300466 PMID: 14625861
Site-specific analysis of keloid disease
PLOS ONE | DOI:10.1371/journal.pone.0172955 March 3, 2017 33 / 33