Embed Size (px)
Citation preview

SITE RESPONSE ANALYSIS USING FORCED VIBRATIONTESTS ON HYDRAULIC-FILLED SOIL DEPOSIT
One of the most important and most commonlyencountered problems in geotechnical earthquakeengineering is the evaluation of a site responseduring an earthquake. The estimation of site
response during an earthquake has been performed by usinganalytic and numerical site response analyses (SHAKE Anal-ysis).1 The natural frequency (resonant period) of a site is themost influential parameter in the estimation of site responseduring an earthquake.2 The natural frequency of a site isusually estimated by numerical analysis or a simplified wavepropagation equation. Engineering soil parameters used forthe site response analysis (numerical analysis and simplifiedwave propagation equation) are acquired by in situ and labo-ratory tests; however, uncertainties in using the aboveparameters always exist. The uncertainties can be classifiedas follows: (1) disturbance of the soil specimen during thesampling procedure; (2) inherent experimental errors; and(3) obstacles in the in situ tests. Due to these uncertainties,if the natural frequency of the site can be estimated directlyfrom in situ tests, it would be more reliable than numericalsite response analysis results. However, over the past deca-des, surprisingly few attempts have been made to artificiallyrepresent an earthquake’s motion by using such methods asa rotating mass or explosion.3,4 Thus, in this article, a spectralanalysis method for direct estimation of the natural frequencyof a site is executed at the experimental site by forced vibra-tion tests. It uses the combination of a hydraulic hammer anddynamic compaction. Detailed site characterizations werealso performed by using such in situ tests as a standard pen-etration test (SPT), a cone penetration test (CPT), and testsfor shear wave velocity measurements. Soil particle motions,which were measured in a downhole receiver array as well ason the ground surface during the forced vibration tests, wereused for estimating the natural frequencies of the experimen-tal site, and they were compared with the results estimated bythe analytic and the numerical analyses.
TEST SITE
The geotechnical experimental site was on Yong-Jong Islandwhere the Inchon International Airport was constructed(Fig. 1).
The site consisted of a hydraulic fill sand layer of 4 m, siltysand of about 13 m, soft clay layer of 2 m, an upper silty claylayer of 7 m, lower stiff clay layer of 11 m, a lower sand layer ofabout 10 m, and a weathered soil layer of 3 m over bedrock(Fig. 2).
The strength of the reclaimed layer, which was formed byhydraulic fill, had to be improved in order to construct pave-ment structures such as a runway, taxiway, and apron on top
of the layer. Hydraulic hammer compaction with a tamperweight of 10 tons and a drop height of 1.2 m was employedto improve the reclaimed layer. The seismic tests, spectralanalysis of surface waves (SASW) and downhole tests, wereperformed to acquire a shear wave velocity (Vs) profile of thesite. The seismic tests’ results indicated increasing values ofVs with depth, from 100 to 200 m/s in the reclaimed and theclayey silt layers. In the stiff clay layer, the shear wave veloc-ity was about 250–350 m/s. An SPT with an energy ratio cor-rection and a CPT were also performed to acquire the subsoilprofile and to verify the Vs profile by obtaining disturbedsamples and strength parameters. The tests’ results areshown in Fig. 2 by the N value, which represents total blowsrequired from a hammer, over an interval 150–450 mm (6–18inches), and by the friction resistance (fs) and cone tip resis-tance (qs), which represent the bearing capacity of the soil.The test results show that the N value and bearing capacitydescribe the shear wave velocity profile. The stiff layer, whichhas a large N value and bearing capacity, shows large shearwave velocity.
FORCED VIBRATION TEST
In order to represent an earthquake’s motion artificially,various forced vibration techniques have been employed.3,4
The vibratory motions, induced by a rotating mass foot-ing, usually have a narrow frequency bandwidth, and it isusually a time-consuming process with a prohibitivelyexpensive installation cost. The vibratory motions generatedby an explosion most closely resemble earthquake groundmotions; however, the explosion is somewhat dangerous,and a significant charge weight (about 10,000 kg) is neededto simulate earthquake ground motions. In order to over-come the shortcomings of the above experimental methods,a combination of hydraulic hammer compaction anddynamic compaction was adopted for the vibratory sources(Fig. 3).
They were performed either simultaneously or separately atthe ground surface of the experimental site. They are verysimple to execute and cost effective for generating vibratorymotions in the field; however, the generated ground motionsare somewhat different from the actual earthquake groundmotions. The stress waves, generated by hydraulic hammercompaction and dynamic compaction, mainly consist of bodyand surface waves rather than shear waves, and the mainenergy is propagated by surface waves.5
Hydraulic hammer compaction is a type of dynamic compac-tion. Generally, a hydraulic hammer for pile driving is modi-fied into a hydraulic compaction hammer by adoptinga tamper at the end of the hydraulic cylinder (Suzuki PMJ-200, Hamamatsu, Japan). The hydraulic cylinder is able toblow 16–50 times/min, and a stroke of the ram is 0.2–1.7 m.The process of dynamic compaction is achieved by continu-ously compacting the sandy soil surface with a heavy weight
TECHNIQUES by J.-S. Lee, and D.-S. Kim
J.-S. Lee ([email protected]) is a deputy director in the Disaster PreventionStandard Team at the National Emergency Management Agency, Seoul, Korea.D.-S. Kim ([email protected]) is a professor in the Department of Civil and Envi-ronmental Engineering at the Korea Advanced Institute of Science and Technology,Taejon, Korea
doi: 10.1111/j.1747-1567.2009.00377.x56 EXPERIMENTAL TECHNIQUES September/October 2009 © 2009, Society for Experimental Mechanics

Fig. 1: An overview of the experimental site
0 20 40 60
SPT (N)
0
10
20
30
40
50
Dep
th (
m)
0
10
20
30
40
50
Dep
th (
m)
Hydraulic FillSand
Silty Sand
Soft Clay
Silty Clay
Stiff Clay
Sand
Weathered Soil
0 200 400
Vs(m/sec)
SPT NVs
0 100 200 300
Tip Resistance(kg/cm2)
0 2 4
Friction Resistance(kg/cm2)
fs
qs
Fig. 2: Subsoil profile: SPT N value and CPT results
SITE RESPONSE ANALYSIS
September/October 2009 EXPERIMENTAL TECHNIQUES 57

(pounder) dropped from specified drop heights. The certifiedpounders, typically 8–16 tons, are hoisted and dropped usinga crawler or truck. The tamper weight and drop heights usedin this study are presented in Table 1.
The vibratory motions generated by the above methods(forced vibration tests) were monitored and measured bythree-component velocity transducers (three-dimensional [3-D] geophones), which were installed in an NX size (f 76 mm)borehole as well as on the ground surface. The 3-D geophonewas developed by molding three well-calibrated geophones(L-15B; Mark Products, now Sercel, Houston, TX) with a nat-ural frequency of 4.5 Hz in an aluminum casing in the verti-cal, longitudinal, and transverse directions. It was designed tobe attached tightly on the inside of a borehole by inflating therubber bag. The direction of each transducer can be confirmedon the ground surface by checking the direction of the orien-tation rod. A schematic diagram of the 3-D geophone is pre-sented in Fig. 4.
For a reliable in situ vibration measurement, the first stepis to calibrate the vibration-monitoring transducer. Theresponse of the 3-D geophone becomes nonlinear at lowfrequencies and has a natural frequency since it is a single-degree-of-freedom system. It is, therefore, necessary to cali-brate the exact voltage output of the 3-D geophone withfrequency.5 The calibration was executed by comparing theoutput voltage of the geophone with the integral amplitudeof the basis acceleration transducer (No. 8038; Bruel & Kjær,Nærum, Denmark), which shows flat output voltages regard-less of frequency. The excitation frequency was varied from1 Hz to 1 kHz by the function generator. The calibrationsystem is shown in Fig. 5.
The calibration system was composed of an exciter type 4804manufactured by Bruel & Kjær, a function generator 33120Amanufactured by Hewlett Packard (now Agilent Technolo-gies, Palo Alto, CA), and a dynamic signal analyzer 35665Amanufactured by Hewlett Packard. The calibration curve forthe 3-D geophone (with open shunt damping) is presented inFig. 6. The calibration factor was constant in the frequenciesranging from approximately 10 to 500 Hz, and the reliable
Fig. 3: Dynamic compaction and hydraulic hammercompaction
Table 1—Specification of the forced vibratorysources
TYPE OF SOURCE DROP HEIGHT (m) TAMPER WEIGHT (ton)
Hydraulic hammer 1.2 10
Dynamic compaction 7–9 7
20
180
50
201500
Rod Connector
OrientationRod
RodConnector
CableRod Connector
Rubber Pad
Air Pressure inlet
Vertical
Transverse
Longitudinal
unit : mm
50
Fig. 4: Schematic diagram of 3-D geophone
Geophone
Accelerometer(Reference)
Amplifier Function Generator
Signal Analyzer
Shaker
For horizontal calibration
Fig. 5: Schematic diagram of the calibration system
1 10 100 1000
Frequency (Hz)
0.01
0.10
1.00
Cal
ibra
tion
Fac
tor
(Vol
t/(cm
/sec
))
Vertical
Transverse
Longitudinal
Fig. 6: Calibration curve for three-component velocitytransducer
SITE RESPONSE ANALYSIS
58 EXPERIMENTAL TECHNIQUES September/October 2009

range of vibration measurements when using this transducerwas 4 Hz and above. The calibration result of the 3-D geo-phone showed good agreement with the manufacturer’s cali-bration chart of individual geophones with a 3-D geophonecomponent.
In order to measure shearing strain as well as particle veloc-ities at in-depth layers, three 3-D geophones, connected inseries by the orientation rods with a vertical spacing of 1.5and 6.5 m, were used to complete the downhole array. Theupper 3-D geophone was located at a depth of 0.5–4.5 m, themiddle 3-D geophone was located at a depth of 2.0–6.0 m, andthe lower 3-D geophone was located at a depth of 8.5–12.5 m.The installation depth was selected to measure shearingstrain, and the 3-D particle reclaimed soil motion in the claysilt layers. Forced vibration tests were performed using thefollowing combinations in three ways: (1) dynamic compaction
only; (2) hydraulic hammer compaction only; and (3) bothhydraulic hammer compaction and dynamic compaction(Fig. 7). The horizontal distance of the two hammers fromthe 3-D geophones was varied from 3.0 to 30 m with a circum-ferential spacing measuring 3.0–6.0 m.
Representative time records and power spectral densities(PSDs) of the measured vibratory motions are presented inFig. 8.
The maximum particle velocities of the longitudinal compo-nent, which were measured at a depth of 4 m with a horizontaldistance of 3 m from the impact sources, were about 3–6 and6–7 cm/s for hydraulic hammer compaction and dynamic com-paction, respectively. Most of the energies induced by hydrau-lic hammer compaction and dynamic compaction existed atfrequencies between 4 and 20 Hz.
(a) Plan View
(b) Section View
Dynamic compaction
30m3m
Down hole array
Dynamic compaction
Dynamic compaction
Hydraulic hammercompaction
Hydraulic hammercompaction
Hydraulic Hammer
7ton
10ton
7m ∼ 9m
3m∼
6m
Orientation rod 1.2m
3 ∼ 30m
Inflating rubber pad
Compaction Point
3D–Geophone8 ∼ 12.5m
2 ∼ 6.0m
0.5 ∼ 4.5m
Fig. 7: Schematic diagram of experiments. (a) Plan view and (b) section view
SITE RESPONSE ANALYSIS
September/October 2009 EXPERIMENTAL TECHNIQUES 59

The maximum particle velocities of the longitudinal compo-nent, which were measured at a depth of 12 m with a horizon-tal distance of 3 m from the impact sources, were about 2–4and 6–7 cm/s for hydraulic hammer compaction and dynamiccompaction, respectively. The rest of the measurements weresimilar to the above results.
SITE RESPONSE CHARACTERISTICS
The natural frequencies of the site provide the tools for con-ducting simplified seismic response analyses.2 The estimationof natural frequencies of the soil deposit can be used to deter-mine the ‘‘design response spectrum.’’ Spectral analyses,
(a) Horizontal Distance from the Source: 3m, Depth : 4m
(b) Horizontal Distance from the Source: 3m, Depth : 12m
Par
ticle
Vel
ocity
(cm
/sec
)
10
5
0
-5
-10
Par
ticle
Vel
ocity
(cm
/sec
)
10
5
0
-5
-10
Par
ticle
Vel
ocity
(cm
/sec
)
10
5
0
-5
-10 0
Par
ticle
Vel
ocity
(cm
/sec
)
10
5
0
-5
-10
Time (sec) Frequency (Hz)
Time (sec) Frequency (Hz)
0 4 8
Hydraulic Hammer Compaction
Hydraulic Hammer Compaction
Hydraulic Hammer Compaction
Hydraulic Hammer Compaction
Dynamic Hammer Compaction
Dynamic Hammer Compaction
Dynamic Hammer Compaction
Dynamic Hammer Compaction
Pow
er S
pect
ral
Den
sity
(cm
/sec
)2
30
20
10
0
Pow
er S
pect
ral
Den
sity
(cm
/sec
)2
30
20
10
0
Pow
er S
pect
ral
Den
sity
(cm
/sec
)2
30
20
10
0
Pow
er S
pect
ral
Den
sity
(cm
/sec
)2
30
20
10
1 10 100
0 4 8 1 10 100
(a)
(b)
Fig. 8: Representative time records and PSD. (a) Horizontal distance from the source: 3 m and depth: 4 m and(b) horizontal distance from the source: 3 m and depth: 12 m
SITE RESPONSE ANALYSIS
60 EXPERIMENTAL TECHNIQUES September/October 2009
based on the particle velocities recorded at the downholearray, were performed to estimate the natural frequencies ofthe experimental site. The cross-power spectrum, Svivj
ðf Þ, ofparticle velocity records of vi(t) and vj(t) can be estimated asfollows6:
Svivjðf Þ5 V�i ðf ÞV�j ðf Þ; ð1Þ
where f 5 frequency, V�i ðf Þ 5 complex conjugate of the finite
Fourier transform of vi(t), and V�j ðf Þ 5 complex conjugate ofthe finite Fourier transform of vj(t).
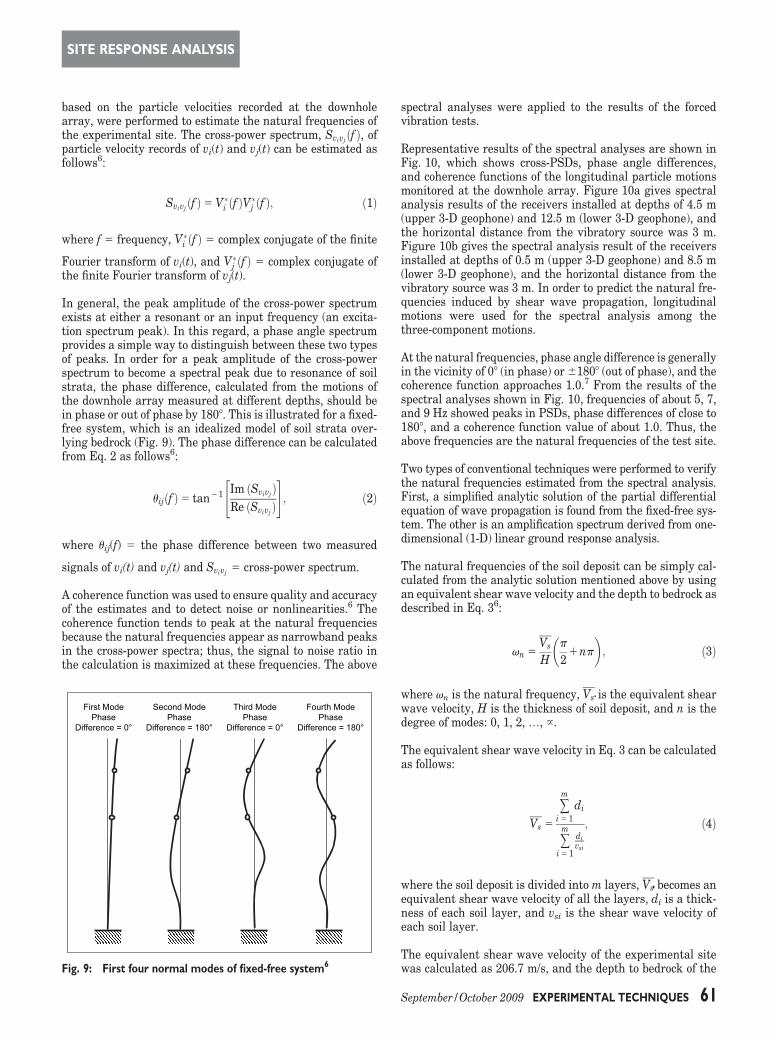
In general, the peak amplitude of the cross-power spectrumexists at either a resonant or an input frequency (an excita-tion spectrum peak). In this regard, a phase angle spectrumprovides a simple way to distinguish between these two typesof peaks. In order for a peak amplitude of the cross-powerspectrum to become a spectral peak due to resonance of soilstrata, the phase difference, calculated from the motions ofthe downhole array measured at different depths, should bein phase or out of phase by 1808. This is illustrated for a fixed-free system, which is an idealized model of soil strata over-lying bedrock (Fig. 9). The phase difference can be calculatedfrom Eq. 2 as follows6:
uijðf Þ5 tan21
"Im ðSvivj
ÞRe ðSvivj
Þ
#; ð2Þ
where uij(f) 5 the phase difference between two measured
signals of vi(t) and vj(t) and Svivj5 cross-power spectrum.
A coherence function was used to ensure quality and accuracyof the estimates and to detect noise or nonlinearities.6 Thecoherence function tends to peak at the natural frequenciesbecause the natural frequencies appear as narrowband peaksin the cross-power spectra; thus, the signal to noise ratio inthe calculation is maximized at these frequencies. The above
spectral analyses were applied to the results of the forcedvibration tests.
Representative results of the spectral analyses are shown inFig. 10, which shows cross-PSDs, phase angle differences,and coherence functions of the longitudinal particle motionsmonitored at the downhole array. Figure 10a gives spectralanalysis results of the receivers installed at depths of 4.5 m(upper 3-D geophone) and 12.5 m (lower 3-D geophone), andthe horizontal distance from the vibratory source was 3 m.Figure 10b gives the spectral analysis result of the receiversinstalled at depths of 0.5 m (upper 3-D geophone) and 8.5 m(lower 3-D geophone), and the horizontal distance from thevibratory source was 3 m. In order to predict the natural fre-quencies induced by shear wave propagation, longitudinalmotions were used for the spectral analysis among thethree-component motions.
At the natural frequencies, phase angle difference is generallyin the vicinity of 08 (in phase) or 61808 (out of phase), and thecoherence function approaches 1.0.7 From the results of thespectral analyses shown in Fig. 10, frequencies of about 5, 7,and 9 Hz showed peaks in PSDs, phase differences of close to1808, and a coherence function value of about 1.0. Thus, theabove frequencies are the natural frequencies of the test site.
Two types of conventional techniques were performed to verifythe natural frequencies estimated from the spectral analysis.First, a simplified analytic solution of the partial differentialequation of wave propagation is found from the fixed-free sys-tem. The other is an amplification spectrum derived from one-dimensional (1-D) linear ground response analysis.
The natural frequencies of the soil deposit can be simply cal-culated from the analytic solution mentioned above by usingan equivalent shear wave velocity and the depth to bedrock asdescribed in Eq. 36:
vn 5Vs
H
�p
21np
�; ð3Þ
where vn is the natural frequency, Vs is the equivalent shearwave velocity, H is the thickness of soil deposit, and n is thedegree of modes: 0, 1, 2, ., }.
The equivalent shear wave velocity in Eq. 3 can be calculatedas follows:
Vs 5
+m
i 5 1
di
+m
i 5 1
di
vsi
; ð4Þ
where the soil deposit is divided into m layers, Vs becomes anequivalent shear wave velocity of all the layers, di is a thick-ness of each soil layer, and vsi is the shear wave velocity ofeach soil layer.
The equivalent shear wave velocity of the experimental sitewas calculated as 206.7 m/s, and the depth to bedrock of the
First ModePhase
Difference = 0°
Second ModePhase
Difference = 180°
Third ModePhase
Difference = 0°
Fourth ModePhase
Difference = 180°
Fig. 9: First four normal modes of fixed-free system6
SITE RESPONSE ANALYSIS
September/October 2009 EXPERIMENTAL TECHNIQUES 61

site was 50 m. Therefore, we can estimate the natural fre-quencies of the site as 1.0, 3.1, 5.2, 7.2, and 9.3 Hz. The esti-mated natural frequencies of 5.2, 7.2, and 9.3 Hz match wellwith the natural frequencies estimated from the spectralanalyses; however, the fundamental and the second naturalfrequencies of 1.0 and 3.1 Hz were not found in the spectralanalyses.
One-dimensional linear site response analysis was also per-formed using the hypothesis that the soil deposit is layeredand damped on elastic rock.1 The shear wave velocity profile
used in the analysis was based on the downhole test results atdepths above 30 m, while it was estimated based on the SASWtest at depths below 30 m (Fig. 2). The soil deposit wasdivided into 2-m-thick layers for the response analysis. Thiswas done based on the subsoil profile, which is determinedfrom the samples of the SPT. Figure 11 shows the amplifica-tion spectrum of the test site that was obtained from the 1-Dlinear site response analysis. The peaks in the amplificationspectrum represent the natural frequencies of the test site.The peaks near 5.0, 7.0, and 9.0 Hz in the amplification spec-trum match well with the estimated natural frequencies from
(a) Hydraulic Hammer Compaction (Horizontal Dist. : 3m, Depths of 3D–geophones :4.5 and 12.5m)
(Horizontal Dist. : 3m, Depths of 3D–geophones :0.5 and 8.5m)
(b) Hydraulic Hammer Compaction and Dynamic Compaction
Coh
eren
cefu
nctio
nP
hase
Diff
eren
ce(D
egre
e)P
SD
(cm
/sec
)2
PS
D(c
m/s
ec)2
1.00
0.50
0.00
Coh
eren
cefu
nctio
n
1.00
0.50
0.00180
90
0
-90
-180 Pha
se D
iffer
ence
(Deg
ree)
180
90
0
-90
-180
0.08
0.04
0
Coh
eren
cefu
nctio
n
Coh
eren
cefu
nctio
n
Pha
se D
iffer
ence
(Deg
ree)
Pha
se D
iffer
ence
(Deg
ree)
PS
D(c
m/s
ec)2
PS
D(c
m/s
ec)2
1.00
0.50
0.00
1.00
0.50
0.00180
90
0
-90
-180
180
90
0
-90
-1800.04
0.02
0
0.02
0.01
0
0 4 8 12 0 4 8 12
0.02
0.01
0
Frequency (Hz)
0 4 8 12Frequency (Hz)
0 4 8 12Frequency (Hz)
Frequency (Hz)
Fig. 10: Representative test results: cross-power spectrum, phase angle difference, and coherence function. (a) Hydraulic hammercompaction (horizontal distance: 3 m and depths of 3-D geophones: 4.5 and 12.5 m) and (b) hydraulic hammer compaction and dynamiccompaction (horizontal distance: 3 m and depths of 3-D geophones: 0.5 and 8.5 m)
SITE RESPONSE ANALYSIS
62 EXPERIMENTAL TECHNIQUES September/October 2009
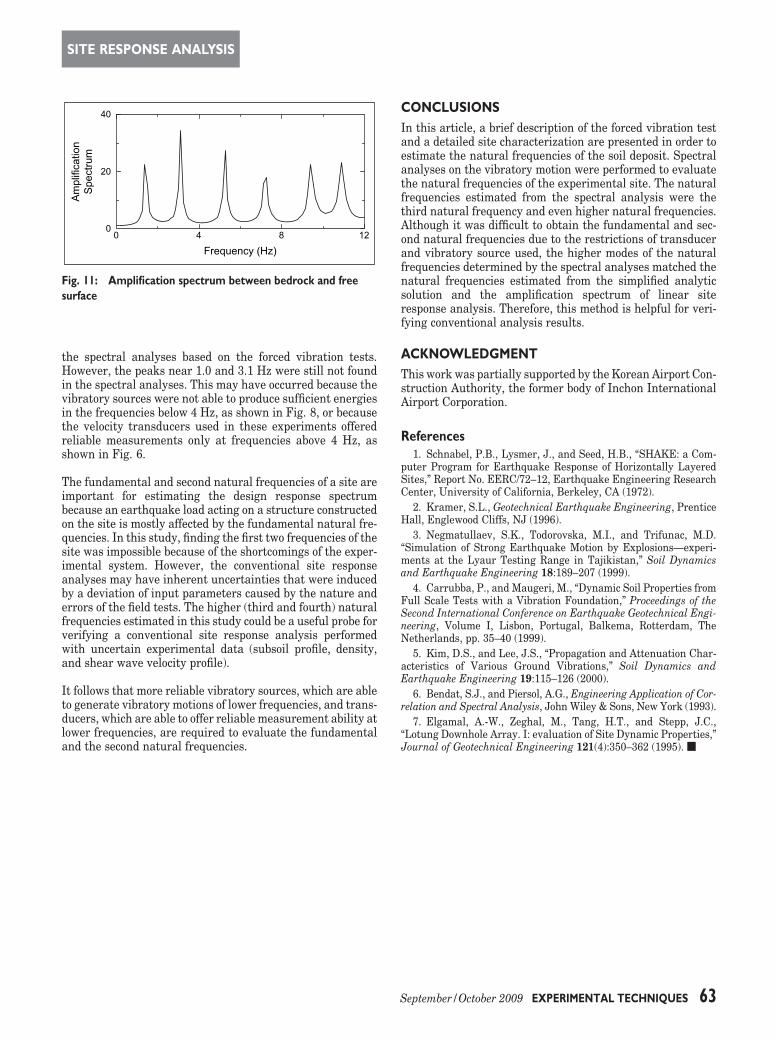
the spectral analyses based on the forced vibration tests.However, the peaks near 1.0 and 3.1 Hz were still not foundin the spectral analyses. This may have occurred because thevibratory sources were not able to produce sufficient energiesin the frequencies below 4 Hz, as shown in Fig. 8, or becausethe velocity transducers used in these experiments offeredreliable measurements only at frequencies above 4 Hz, asshown in Fig. 6.
The fundamental and second natural frequencies of a site areimportant for estimating the design response spectrumbecause an earthquake load acting on a structure constructedon the site is mostly affected by the fundamental natural fre-quencies. In this study, finding the first two frequencies of thesite was impossible because of the shortcomings of the exper-imental system. However, the conventional site responseanalyses may have inherent uncertainties that were inducedby a deviation of input parameters caused by the nature anderrors of the field tests. The higher (third and fourth) naturalfrequencies estimated in this study could be a useful probe forverifying a conventional site response analysis performedwith uncertain experimental data (subsoil profile, density,and shear wave velocity profile).
It follows that more reliable vibratory sources, which are ableto generate vibratory motions of lower frequencies, and trans-ducers, which are able to offer reliable measurement ability atlower frequencies, are required to evaluate the fundamentaland the second natural frequencies.
CONCLUSIONS
In this article, a brief description of the forced vibration testand a detailed site characterization are presented in order toestimate the natural frequencies of the soil deposit. Spectralanalyses on the vibratory motion were performed to evaluatethe natural frequencies of the experimental site. The naturalfrequencies estimated from the spectral analysis were thethird natural frequency and even higher natural frequencies.Although it was difficult to obtain the fundamental and sec-ond natural frequencies due to the restrictions of transducerand vibratory source used, the higher modes of the naturalfrequencies determined by the spectral analyses matched thenatural frequencies estimated from the simplified analyticsolution and the amplification spectrum of linear siteresponse analysis. Therefore, this method is helpful for veri-fying conventional analysis results.
ACKNOWLEDGMENT
This work was partially supported by the Korean Airport Con-struction Authority, the former body of Inchon InternationalAirport Corporation.
References1. Schnabel, P.B., Lysmer, J., and Seed, H.B., ‘‘SHAKE: a Com-
puter Program for Earthquake Response of Horizontally LayeredSites,’’ Report No. EERC/72–12, Earthquake Engineering ResearchCenter, University of California, Berkeley, CA (1972).
2. Kramer, S.L., Geotechnical Earthquake Engineering, PrenticeHall, Englewood Cliffs, NJ (1996).
3. Negmatullaev, S.K., Todorovska, M.I., and Trifunac, M.D.‘‘Simulation of Strong Earthquake Motion by Explosions—experi-ments at the Lyaur Testing Range in Tajikistan,’’ Soil Dynamicsand Earthquake Engineering 18:189–207 (1999).
4. Carrubba, P., and Maugeri, M., ‘‘Dynamic Soil Properties fromFull Scale Tests with a Vibration Foundation,’’ Proceedings of theSecond International Conference on Earthquake Geotechnical Engi-neering, Volume I, Lisbon, Portugal, Balkema, Rotterdam, TheNetherlands, pp. 35–40 (1999).
5. Kim, D.S., and Lee, J.S., ‘‘Propagation and Attenuation Char-acteristics of Various Ground Vibrations,’’ Soil Dynamics andEarthquake Engineering 19:115–126 (2000).
6. Bendat, S.J., and Piersol, A.G., Engineering Application of Cor-relation and Spectral Analysis, John Wiley & Sons, New York (1993).
7. Elgamal, A.-W., Zeghal, M., Tang, H.T., and Stepp, J.C.,‘‘Lotung Downhole Array. I: evaluation of Site Dynamic Properties,’’Journal of Geotechnical Engineering 121(4):350–362 (1995). n
Ampl
ifica
tion
Spec
trum
40
20
00 4 8 12
Frequency (Hz)
Fig. 11: Amplification spectrum between bedrock and freesurface
SITE RESPONSE ANALYSIS
September/October 2009 EXPERIMENTAL TECHNIQUES 63