Embed Size (px)
Citation preview
Page 1 of 12
SitePrepvsReleaseforWoodyCompetitionControlinLoblollyPine:10-YearGrowth
andProjectedFinancialReturns
Research Report 130 December 2016
Jerre Creighton, Virginia Department of Forestry Research Program Manager
Abstract
A study of the effects on loblolly pine growth of seven herbicide competition control alternatives was installed at the Appomattox-Buckingham State Forest between July 2005 and August 2007. After 10 years, analysis of variance indicates that hardwood competition control has had a significant (P<0.01) positive effect on pine growth (basal area and volume). The plots receiving site prep treatments applied September 3 and October 1 contain an average of 99 ft.2/acre of basal area and 1,748 ft.3/acre of total volume compared to 85 ft.2/acre and 1,384 ft.3/acre on plots released from competition after the second growing season and 56 ft.2/acre and 895 ft.3/acre on untreated plots. Projecting the current diameter distributions to a 40-year rotation indicates that maximum productivity (mean annual increment) would reach 4.0, 5.8 and 6.8 green tons per acre per year on the untreated, released and site-prepared plots, respectively. Applying commonly accepted financial formulae to calculate present values (PV) indicates that the maximum per-acre financial return (without thinning) from untreated, released and site-prepared scenarios would be $388 (at age 24), $576 (at age 23) and $686 (at age 22), respectively, under current market pricing.
Methods
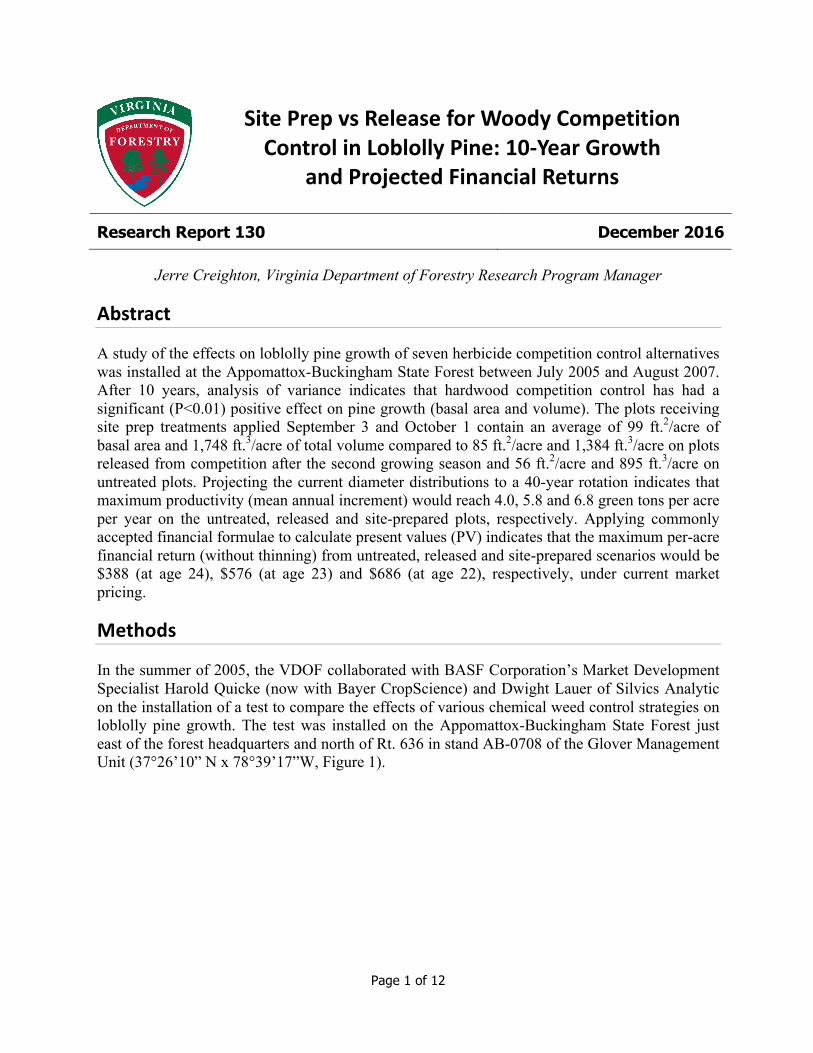
In the summer of 2005, the VDOF collaborated with BASF Corporation’s Market Development Specialist Harold Quicke (now with Bayer CropScience) and Dwight Lauer of Silvics Analytic on the installation of a test to compare the effects of various chemical weed control strategies on loblolly pine growth. The test was installed on the Appomattox-Buckingham State Forest just east of the forest headquarters and north of Rt. 636 in stand AB-0708 of the Glover Management Unit (37°26’10” N x 78°39’17”W, Figure 1).

Virginia Department of Forestry Research Report 130
Page 2 of 12
Figure1.Locationofthe2005competingvegetationcontrolstudy.
The study was installed in a randomized completed block design with three replications. Treatments were applied using a split plot approach. The eight whole-plot treatments included:
� an untreated check;
� two herbicide site preparation tank mixes - imazapyr (Chopper at 40 oz./acre) alone and with sulfometuron methyl (Sulfometuron Max at 3 oz./acre) – applied on three different dates (July 23, September 3 and October 1)] for a total of six treatments, and
� one herbicide release treatment [imazapyr (Arsenal at 12 oz./acre) applied Sept. 12, 2007 at the end of the second growing season after planting.
Second-generation orchard mix loblolly pine seedlings from the Virginia Department of Forestry Garland Gray Forestry Center were planted at an average density of 475 (ranging from 439 and 493 on individual plots) trees per acre in March of 2006. Half of each whole plot was treated April 14, 2006 for first-season herbaceous weed control with imazapyr + sulfometuron methyl (Arsenal at 4 oz./acre plus Oust at 2 oz./acre) and the other half received no additional treatment.
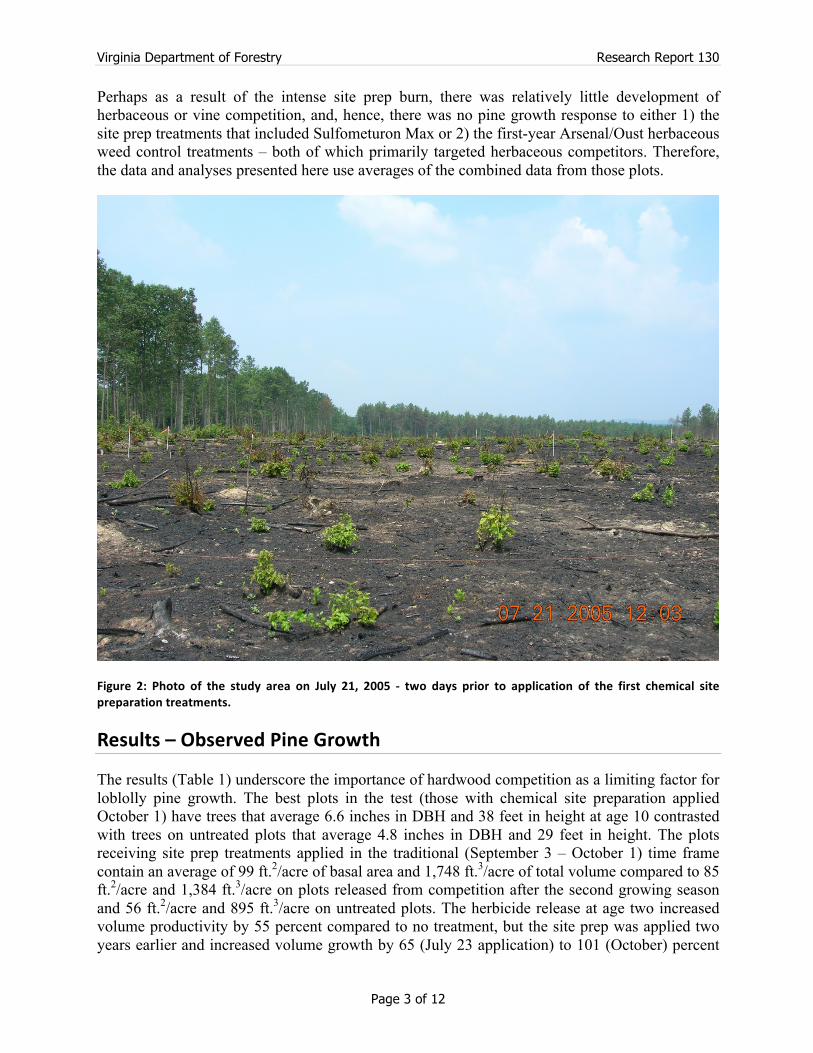
The test site was burned very thoroughly June 15, 2005. There was very little resprouted hardwood leaf area present at the first (July 23) application date (Figure 2). Pine survival, diameter at breast height (DBH) and height have been measured three, four, five, seven and 10 years after planting. Hardwood competition was assessed by rating pine free-to-grow (FTG) status (a reflection of completion intensity) at the last three measurement dates.
Virginia Department of Forestry Research Report 130
Page 3 of 12
Perhaps as a result of the intense site prep burn, there was relatively little development of herbaceous or vine competition, and, hence, there was no pine growth response to either 1) the site prep treatments that included Sulfometuron Max or 2) the first-year Arsenal/Oust herbaceous weed control treatments – both of which primarily targeted herbaceous competitors. Therefore, the data and analyses presented here use averages of the combined data from those plots.
Figure 2: Photo of the study area on July 21, 2005 - two days prior to application of the first chemical sitepreparationtreatments.
Results–ObservedPineGrowth
The results (Table 1) underscore the importance of hardwood competition as a limiting factor for loblolly pine growth. The best plots in the test (those with chemical site preparation applied October 1) have trees that average 6.6 inches in DBH and 38 feet in height at age 10 contrasted with trees on untreated plots that average 4.8 inches in DBH and 29 feet in height. The plots receiving site prep treatments applied in the traditional (September 3 – October 1) time frame contain an average of 99 ft.2/acre of basal area and 1,748 ft.3/acre of total volume compared to 85 ft.2/acre and 1,384 ft.3/acre on plots released from competition after the second growing season and 56 ft.2/acre and 895 ft.3/acre on untreated plots. The herbicide release at age two increased volume productivity by 55 percent compared to no treatment, but the site prep was applied two years earlier and increased volume growth by 65 (July 23 application) to 101 (October) percent

Virginia Department of Forestry Research Report 130
Page 4 of 12
compared to no treatment. October site preparation generated 30 percent more volume growth than the age two release (Figure 3).
The average DBH growth between ages five and 10 is plotted in Figure 4. There are essentially three groups: the untreated trees, the release and early (July 23) site prep plots and the more traditional September 3 – October 1 site prep plots. The early site prep plots may lag behind the later application dates because of a) minimal leaf area development at the time of treatment or b) a loss of efficacy of imazapyr when applied earlier in the growing season.
Table1.Age10growthsummary.
Treatment DBH(in.)
Height(ft.)
SurvivingStemsper
Acre
BasalArea(ft.2/acre)
Volume(ft.3/acre)*
VolumeResponse(ft.3/acre)
VolumeResponse
(%)
Untreated 4.8 29 399 56 895 N/A N/A
Oct1SitePrep 6.6 38 468 101 1,798 903 101
Sep3SitePrep 6.6 37 441 96 1,698 803 90
Jul23SitePrep 6.1 36 459 86 1,477 582 65
Age2Release 6.1 34 441 85 1,384 489 55*Treevolumecalculatedas0.21949+(DBH2*Height*0.00238)–fromVPIForestModelingResearchCooperativeequation(Tasissa,Burkhart&Amateis.1997.SJAF21(3):146-152).
Figure3:Age10loblollypinevolumecomparison.

Virginia Department of Forestry Research Report 130
Page 5 of 12
Figure4:Averagediameter(DBH,in)betweenages5and10.
The impact of competing vegetation can also be viewed in terms of the change in diameter distribution among the different regimes. Table 2 lists the number of trees by diameter class at age 10 for each site preparation treatment, and Figure 5 displays the data in a line chart. The noteworthy feature is the significant shift toward larger- diameter trees with the site preparation treatments. Compared to the age two release, on average, the best site preparation treatments (September 3 and October 1) contain 57 percent more stems in the largest two diameter classes (262 compared to 167).

Virginia Department of Forestry Research Report 130
Page 6 of 12
Table2.Age10diameterdistribution(treesperacrebydiameterclass).
DBHClass(in)* Check
Oct1SitePrep
Sep3SitePrep
Jul23SitePrep
Age2Release
Sep-OctSPAverage
0 5 0 0 0 0 01 32 0 0 5 0 02 19 5 0 0 0 23 32 0 0 9 9 04 42 9 5 9 23 75 130 32 19 60 79 266 93 144 172 209 162 1587 42 227 204 125 144 2168 5 51 42 42 23 46
Total 399 468 441 459 441 455*0=0-0.5,1=0.5-1.5,2=1.5-2.5,etc.
Figure 5: Age 10 diameter distribution of loblolly pine without hardwood control (check) and after age tworeleaseandpre-plantingchemicalsitepreparation.
Virginia Department of Forestry Research Report 130
Page 7 of 12
Results–CompetingHardwoods
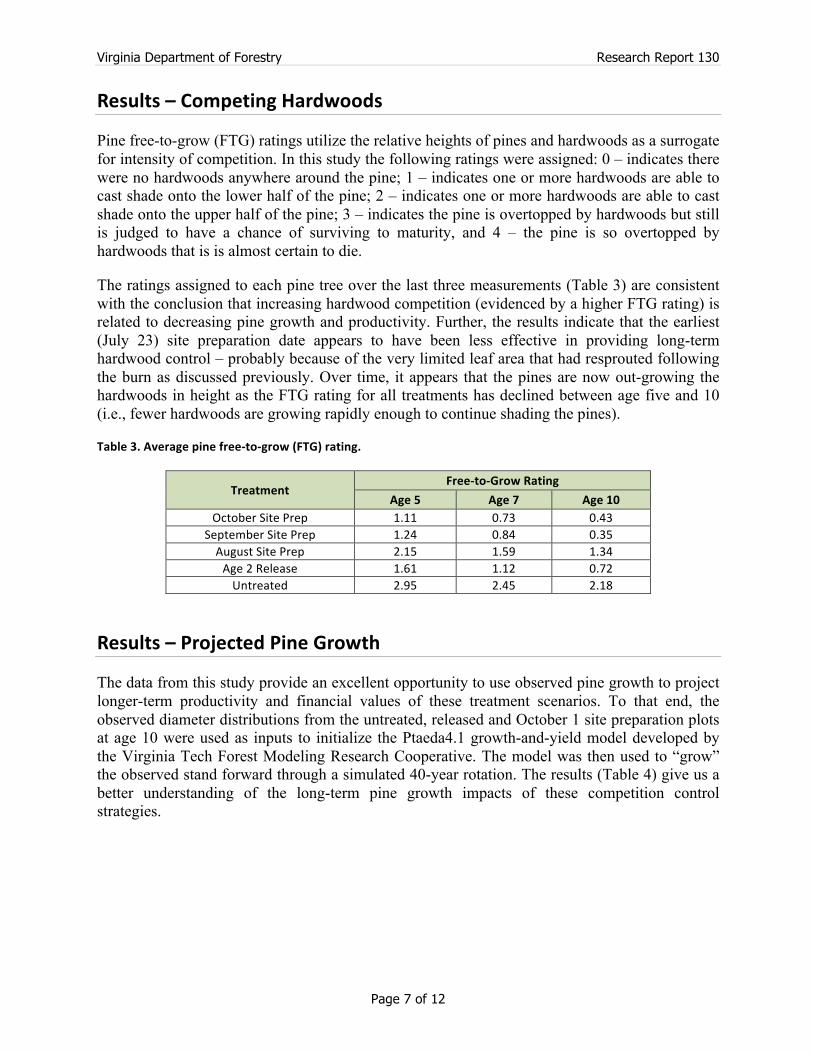
Pine free-to-grow (FTG) ratings utilize the relative heights of pines and hardwoods as a surrogate for intensity of competition. In this study the following ratings were assigned: 0 – indicates there were no hardwoods anywhere around the pine; 1 – indicates one or more hardwoods are able to cast shade onto the lower half of the pine; 2 – indicates one or more hardwoods are able to cast shade onto the upper half of the pine; 3 – indicates the pine is overtopped by hardwoods but still is judged to have a chance of surviving to maturity, and 4 – the pine is so overtopped by hardwoods that is is almost certain to die.
The ratings assigned to each pine tree over the last three measurements (Table 3) are consistent with the conclusion that increasing hardwood competition (evidenced by a higher FTG rating) is related to decreasing pine growth and productivity. Further, the results indicate that the earliest (July 23) site preparation date appears to have been less effective in providing long-term hardwood control – probably because of the very limited leaf area that had resprouted following the burn as discussed previously. Over time, it appears that the pines are now out-growing the hardwoods in height as the FTG rating for all treatments has declined between age five and 10 (i.e., fewer hardwoods are growing rapidly enough to continue shading the pines).
Table3.Averagepinefree-to-grow(FTG)rating.
TreatmentFree-to-GrowRating
Age5 Age7 Age10OctoberSitePrep 1.11 0.73 0.43
SeptemberSitePrep 1.24 0.84 0.35AugustSitePrep 2.15 1.59 1.34Age2Release 1.61 1.12 0.72Untreated 2.95 2.45 2.18
Results–ProjectedPineGrowth
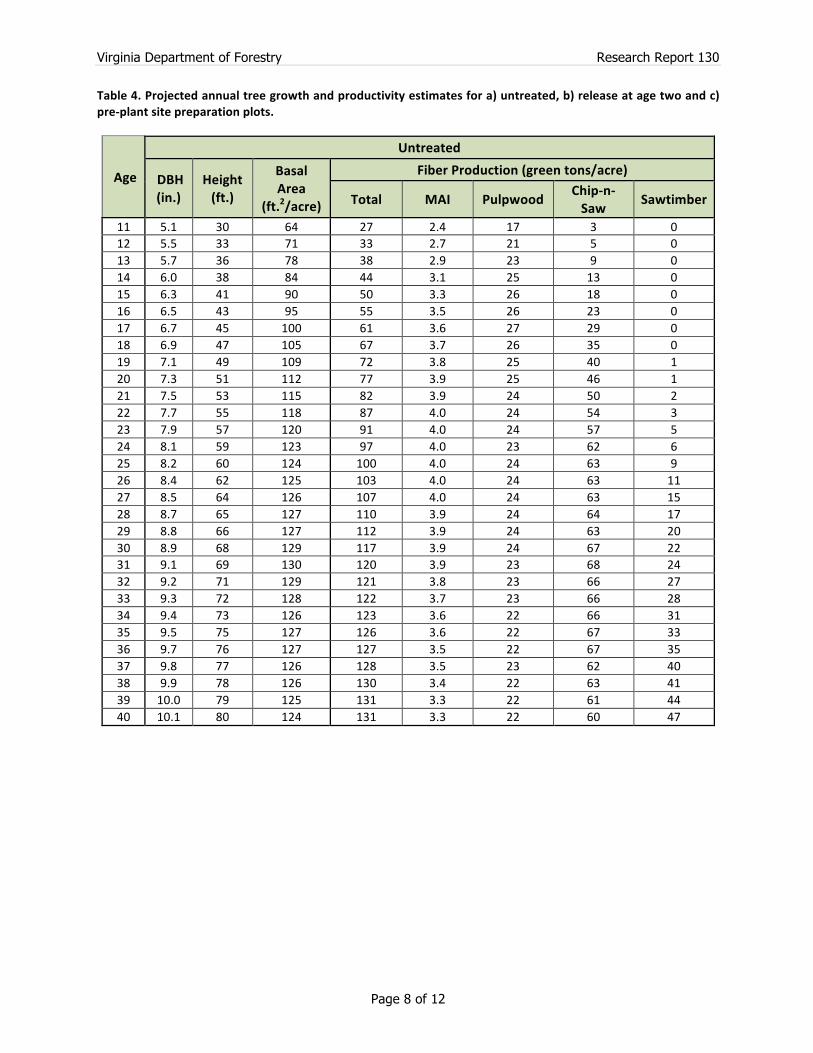
The data from this study provide an excellent opportunity to use observed pine growth to project longer-term productivity and financial values of these treatment scenarios. To that end, the observed diameter distributions from the untreated, released and October 1 site preparation plots at age 10 were used as inputs to initialize the Ptaeda4.1 growth-and-yield model developed by the Virginia Tech Forest Modeling Research Cooperative. The model was then used to “grow” the observed stand forward through a simulated 40-year rotation. The results (Table 4) give us a better understanding of the long-term pine growth impacts of these competition control strategies.
Virginia Department of Forestry Research Report 130
Page 8 of 12
Table4.Projectedannualtreegrowthandproductivityestimatesfora)untreated,b)releaseatagetwoandc)pre-plantsitepreparationplots.
Age
Untreated
DBH(in.)
Height(ft.)
BasalArea
(ft.2/acre)
FiberProduction(greentons/acre)
Total MAI Pulpwood Chip-n-Saw Sawtimber
11 5.1 30 64 27 2.4 17 3 012 5.5 33 71 33 2.7 21 5 013 5.7 36 78 38 2.9 23 9 014 6.0 38 84 44 3.1 25 13 015 6.3 41 90 50 3.3 26 18 016 6.5 43 95 55 3.5 26 23 017 6.7 45 100 61 3.6 27 29 018 6.9 47 105 67 3.7 26 35 019 7.1 49 109 72 3.8 25 40 120 7.3 51 112 77 3.9 25 46 121 7.5 53 115 82 3.9 24 50 222 7.7 55 118 87 4.0 24 54 323 7.9 57 120 91 4.0 24 57 524 8.1 59 123 97 4.0 23 62 625 8.2 60 124 100 4.0 24 63 926 8.4 62 125 103 4.0 24 63 1127 8.5 64 126 107 4.0 24 63 1528 8.7 65 127 110 3.9 24 64 1729 8.8 66 127 112 3.9 24 63 2030 8.9 68 129 117 3.9 24 67 2231 9.1 69 130 120 3.9 23 68 2432 9.2 71 129 121 3.8 23 66 2733 9.3 72 128 122 3.7 23 66 2834 9.4 73 126 123 3.6 22 66 3135 9.5 75 127 126 3.6 22 67 3336 9.7 76 127 127 3.5 22 67 3537 9.8 77 126 128 3.5 23 62 4038 9.9 78 126 130 3.4 22 63 4139 10.0 79 125 131 3.3 22 61 4440 10.1 80 124 131 3.3 22 60 47

Virginia Department of Forestry Research Report 130
Page 9 of 12
Age
ReleaseatAgeTwo
DBH(in.)
Height(ft.)
BasalArea
(ft.2/acre)
FiberProduction(greentons/acre)
Total MAI Pulpwood Chip-n-Saw Sawtimber
11 6.4 34 103 45 4.1 30 9 012 6.7 37 112 53 4.4 31 15 013 7.0 39 121 61 4.7 32 23 014 7.2 42 129 69 4.9 33 30 015 7.4 44 136 77 5.1 33 38 016 7.6 46 142 84 5.3 33 45 017 7.8 48 149 93 5.5 33 54 018 8.0 50 154 100 5.6 32 62 019 8.1 52 159 107 5.6 31 69 020 8.3 54 164 115 5.7 30 77 121 8.4 56 167 121 5.7 30 83 122 8.6 58 170 127 5.8 29 90 223 8.8 59 174 134 5.8 30 96 324 8.9 61 175 138 5.8 29 99 425 9.0 63 179 145 5.8 29 104 726 9.1 64 182 151 5.8 30 106 1027 9.3 66 183 155 5.8 30 107 1328 9.4 67 184 160 5.7 29 110 1529 9.5 68 187 166 5.7 30 110 2130 9.6 70 186 168 5.6 30 105 2731 9.7 71 187 172 5.6 30 105 3232 9.8 72 185 174 5.4 30 103 3633 9.9 74 184 176 5.3 30 100 4234 10.1 75 185 180 5.3 31 95 4935 10.2 76 183 181 5.2 31 93 5336 10.3 77 183 184 5.1 30 91 5937 10.4 78 182 185 5.0 30 88 6238 10.4 79 183 188 5.0 31 86 6839 10.5 80 179 188 4.8 30 84 7040 10.6 81 176 187 4.7 30 79 74

Virginia Department of Forestry Research Report 130
Page 10 of 12
Age
Pre-PlantSitePrep-October1
DBH(in.)
Height(ft.)
BasalArea
(ft.2/acre)
FiberProduction(greentons/acre)
Total MAI Pulpwood Chip-n-Saw Sawtimber
11 6.9 35 124 56 5.0 35 14 012 7.2 38 134 65 5.4 35 24 013 7.4 40 143 74 5.7 33 34 014 7.7 42 152 83 5.9 33 44 015 7.9 45 160 92 6.1 32 53 016 8.0 47 167 100 6.3 32 62 017 8.2 49 173 109 6.4 31 72 018 8.4 51 179 117 6.5 30 81 019 8.5 53 183 125 6.6 30 88 020 8.7 55 190 134 6.7 30 96 121 8.8 56 194 141 6.7 30 102 322 8.9 58 198 149 6.8 30 108 523 9.1 60 201 155 6.8 29 113 724 9.2 61 204 162 6.7 28 120 825 9.3 63 206 168 6.7 29 123 1026 9.4 64 208 173 6.7 28 127 1327 9.5 66 208 178 6.6 29 126 1728 9.6 67 209 182 6.5 29 126 2129 9.7 68 211 187 6.5 30 125 2730 9.9 70 213 194 6.5 30 127 3131 10.0 71 212 197 6.3 31 121 4032 10.1 73 211 199 6.2 31 119 4433 10.2 74 210 201 6.1 31 116 4934 10.3 75 209 203 6.0 31 114 5335 10.4 76 206 204 5.8 31 110 5936 10.5 77 202 203 5.6 30 107 6237 10.6 78 203 206 5.6 30 106 6638 10.7 79 200 206 5.4 30 103 6939 10.8 80 202 211 5.4 31 100 7640 10.8 81 199 210 5.3 30 98 78
These results indicate that by age 40 the trees in the untreated, released and site-prepared regimes would attain an average height of 80, 81 and 81 feet and an average DBH of 10.0, 10.6 and 10.8 inches, respectively. On a stand level, these areas would attain maximum basal areas of 130 (at age 31), 187 (also at age 31) and 213 (at age 30) ft.2/acre and achieve peak total volumes of 131 (at age 40), 188 (at age 38) and 211 (at age 39) green tons per acre, respectively. Maximum productivity as measured by mean annual increment (MAI) reached 4.0, 5.8 and 6.8 tons per acre per year on the untreated, released and site-prepared plots, respectively – all at age 22.
Virginia Department of Forestry Research Report 130
Page 11 of 12
Results–ProjectedFinancialImplications
Timber Mart South product pricing for the third quarter of 2016 in the Virginia Piedmont was applied to the projected pulpwood, chip-n-saw and sawtimber tons per acre for the untreated, released and site-prepared plots. These projected revenues were discounted to the year of stand establishment to arrive at a present value (PV). Assumptions for these analyses included: the site index was assumed to be 65; percent of hardwood in the stand was 15 for the untreated, eight for the release and two for the site prep plots; improved genetics were planted; soils were well-drained; alternate rate of return (interest rate) was six percent; product prices per green ton were $14.35 for pulpwood, $18.02 for chip-n-saw and $20.31 for sawtimber. The costs of planting, release and site preparation were assumed to be $60, $65 and $80 per acre, respectively. No other cash flows are included in these calculations. Cost share or incentive payments, management fees, thinning or harvest costs, taxes, hunting leases, etc., would all have to be considered in a full discounted cash flow analysis.
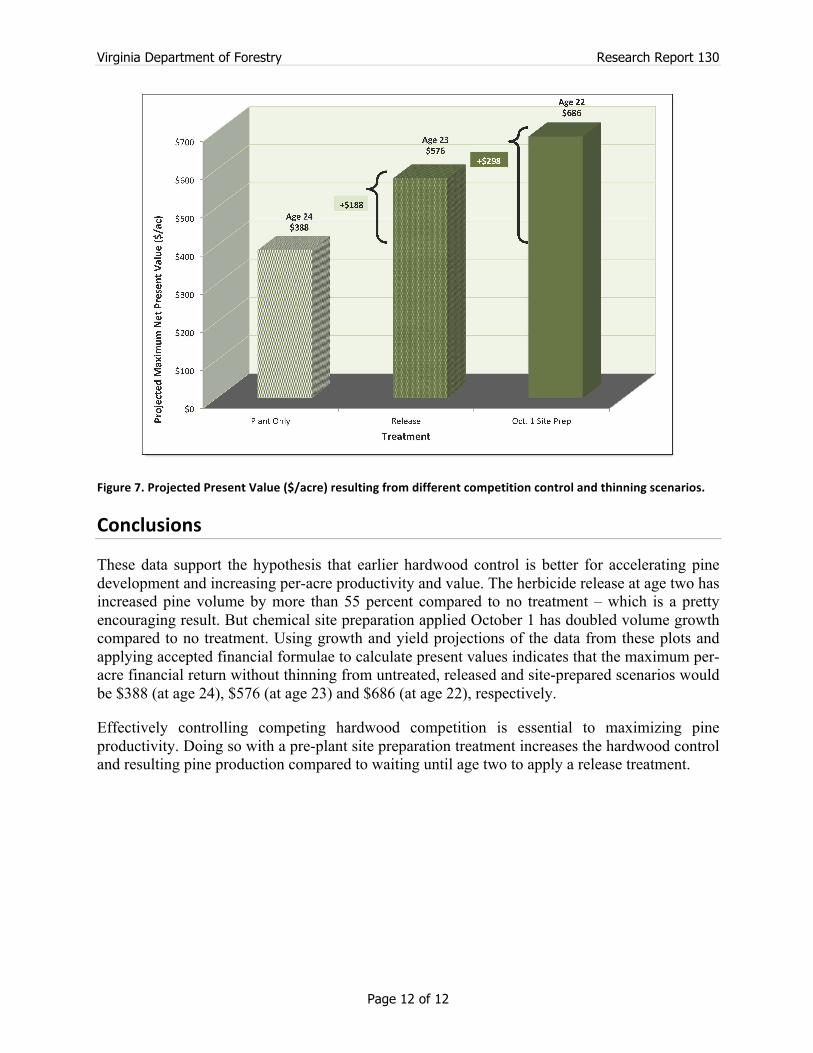
The results are presented in Figure 7. The maximum value for the three scenarios occurs at different stand ages. With no competition control, the stand would be worth a maximum of $388 at an age of 24. Following a release at age two, this would increase by $188 per acre to $576, and would occur a year earlier – at age 23. With the October 1 site preparation, the gain over no treatment would be $298 ($110 per acre more than the release) and the maximum PV of $686 would be achieved at age 22. Subtracting the estimated costs of planting and competition control would reduce the present values to $328, $451 and $546 per acre for the untreated, released and site-prepared stands, respectively. Adding a cost of $60 per acre for release increased the value of the stand by $188, and adding $15 more to move to the site prep option further increased it by another $110. And adding a thinning operation at the appropriate stage of stand development would provide an additional cash flow that would further increase these values, regardless of the competition control scenario chosen.
Important Disclaimer: This is not a complete discounted cash flow analysis. The results presented here are only examples and are useful for comparing long-term outputs. Although these results are based on observed growth data through age 10, the wide range of conditions and natural occurences that impact individual sites, the many assumptions that go into financial calculations and the inexact nature of growth models make it certain that individual landowners’ results will vary – possibly significantly – from the estimates derived here. For example, just changing the cost estimates by a few dollars or the alternate rate of return in the discounting formula by one or two percentage points will drastically change the resulting values. Therefore, these should be used as decision-making aids and food for thought, but should never be taken as a guarantee of any particular outcome biologically or financially.
Virginia Department of Forestry Research Report 130
Page 12 of 12
Figure7.ProjectedPresentValue($/acre)resultingfromdifferentcompetitioncontrolandthinningscenarios.
Conclusions
These data support the hypothesis that earlier hardwood control is better for accelerating pine development and increasing per-acre productivity and value. The herbicide release at age two has increased pine volume by more than 55 percent compared to no treatment – which is a pretty encouraging result. But chemical site preparation applied October 1 has doubled volume growth compared to no treatment. Using growth and yield projections of the data from these plots and applying accepted financial formulae to calculate present values indicates that the maximum per-acre financial return without thinning from untreated, released and site-prepared scenarios would be $388 (at age 24), $576 (at age 23) and $686 (at age 22), respectively.
Effectively controlling competing hardwood competition is essential to maximizing pine productivity. Doing so with a pre-plant site preparation treatment increases the hardwood control and resulting pine production compared to waiting until age two to apply a release treatment.