Embed Size (px)
Citation preview

1 23
Natural HazardsJournal of the International Societyfor the Prevention and Mitigation ofNatural Hazards ISSN 0921-030X Nat HazardsDOI 10.1007/s11069-015-1870-z
Site- and rainfall-specific runoff coefficientsand critical rainfall for mega-gullydevelopment in Kinshasa (DR Congo)
Jan Moeyersons, Fils MakanzuImwangana & Olivier Dewitte

1 23
Your article is protected by copyright and all
rights are held exclusively by Springer Science
+Business Media Dordrecht. This e-offprint
is for personal use only and shall not be self-
archived in electronic repositories. If you wish
to self-archive your article, please use the
accepted manuscript version for posting on
your own website. You may further deposit
the accepted manuscript version in any
repository, provided it is only made publicly
available 12 months after official publication
or later and provided acknowledgement is
given to the original source of publication
and a link is inserted to the published article
on Springer's website. The link must be
accompanied by the following text: "The final
publication is available at link.springer.com”.
ORIGINAL PAPER
Site- and rainfall-specific runoff coefficients and criticalrainfall for mega-gully development in Kinshasa (DRCongo)
Jan Moeyersons1 • Fils Makanzu Imwangana2,3 •
Olivier Dewitte1
Received: 22 January 2015 / Accepted: 9 June 2015� Springer Science+Business Media Dordrecht 2015
Abstract This article presents a field-based method to assess site- and rainfall-specific
runoff coefficients to be expected for a given period of the year. The method is applied to
recognize soil uses/covers leading to reduced runoff water supply of gullies in Kinshasa.
The computation of the runoff coefficient needs an infiltration envelope, established on site
during a period of interest, and a local pluviogram decomposed in pluviophases. Rainfall
simulation is carried out in 35 representative urban sites located in gully runon areas to
establish a site-specific infiltration envelope. The runoff coefficient of the 35 sites is
calculated for 25 geomorphologically active rains recorded between 1975 and 2012. The
results show that several site-specific characteristics control runoff coefficient. The first
factor is the over-compaction of the soil. Earthen roads show a runoff coefficient of
96.0 %. The second factor is the presence of a lichen seal. Bare loose soil only colonized
by a lichen seal shows a runoff coefficient of 40.7 %. For the other sites, the runoff
coefficient is inversely proportional to the percentage of vegetation soil cover, a normally
compacted bare soil having a runoff coefficient of up to 30 %, parcels with high grass or
cultures providing complete coverage showing no runoff at all. However, mowed lawns
develop an impervious root mat close to the surface and, therefore, do not follow this rule:
They quickly produce runoff similar to the bare and compacted surfaces. Finally, the factor
slope gradient is involved. The differences due to vegetation cover disappear gradually
with decreasing slope. Below a slope gradient of 0.08 m m-1, the runoff coefficient is null
on a bare surface. Currently, the critical rainfall for gullying in the high town of Kinshasa is
24.9 mm with a mean intensity of 21.8 mm h-1. Roads generate by far most runoff and,
therefore, are considered as the primary reason for gullying. The other soil uses lead most
& Jan [email protected]
1 Department of Earth Sciences, Royal Museum for Central Africa, Tervuren, Belgium
2 Laboratoire de Geomorphologie et Teledetection, Centre de Recherches Geologiques et Minieres(CRGM), Kinshasa, Democratic Republic of the Congo
3 Departement des Sciences de la Terre (Geographie-Geologie), Faculte des Sciences, Universite deKinshasa, Kinshasa, Democratic Republic of the Congo
123
Nat HazardsDOI 10.1007/s11069-015-1870-z
Author's personal copy

of the time to much smaller runoff coefficients, but their relative contribution to the supply
of gullies grows with rainfall increase in height and intensity. The results provide material
for gully management and adaptation strategies and open perspectives for the development
of an early warning system in the region of Kinshasa. The method shows potential for
being applied in other urbanized environments.
Keywords Gullying � Infiltration envelope � Rainfall simulation � Runoff coefficient �Soil use � Kinshasa
AbbreviationsIfE Infiltration envelope
IfC Infiltration capacity
RC Runoff coefficient
RH Rainfall height
RI Rainfall intensity
SIfC Saturated infiltration capacity
SRI Simulated rainfall intensity
TP Time to ponding
TR Time to runoff
1 Introduction
Land-use/land-cover changes due to urban extension lead to changes in hydrological
processes (Ferreira et al. 2012) and are the most important factors influencing gully erosion
(Garcia-Ruiz 2010; Nadal-Romero et al. 2013). This is particularly true in the high town of
Kinshasa (Fig. 1), where gullying poses a major economic and environmental problem
(Makanzu Imwangana et al. 2012). Mega-gullies ([5 m wide) (Fig. 2) develop within the
urbanized perimeter of the high town of Kinshasa 5–10 years after incipient urbanization
(Makanzu Imwangana et al. 2014a, b).
Van Caillie (1983) indicated that gullying in Kinshasa could be prevented by taking
runoff reducing measures in the gully runon area so that runoff discharges, critical to gully
head incision, would not develop. His idea was to prevent or at least to delay headward
gully growth by reducing or even annihilating runoff production in the areas draining to the
gully heads. In this way, gullies should not reach their natural equilibrium state governed
by the decreasing size of the runon area during headward retreat (Graf 1977). Van Caillie
(1983) considered the house roofs and the hard surfaces of the courtyards critical runoff
producers. But the studies of Makanzu Imwangana et al. (2014a, b) show that 91 % of the
mega-gullies are not linked to houses or courtyards but to urban structures: In the first
place, roads, tarred or not, with or without side-road trenches, further gutters in all forms
and materials from concrete to sand but not linked to a road, also foot paths and all other
artificial runoff drainage lines. Forty-four percent of the mega-gullies, fed by these
structures, are axial gullies (Makanzu Imwangana et al. 2014b), which develop right upon
these structures and destroy them in the same time. Makanzu Imwangana et al. (2013)
conclude that every mega-gully is directly or indirectly induced by human activities. In
Kinshasa, gully mitigation techniques, including biological slope protection (based on, e.g.,
Prosser and Slade 1994) and huge engineering constructions, have proved to be successful
Nat Hazards
123
Author's personal copy
to a certain degree (Makanzu Imwangana 2010; Makanzu Imwangana et al. 2013, 2014a,
b). But nevertheless, gully occurrence remains difficult to predict in space and time.
Makanzu Imwangana et al. (2014b) show that most gullies are not ‘valley’-gullies.
Therefore, digital terrain models, based on topographical water flow convergence (Prosser
and Dietrich 1995; Dewitte et al. 2015), cannot be used to predict the location of future
channel heads.
The aim of this work is to find out more about the absolute and relative contribution of
the most characteristic soil uses/covers in Kinshasa to the runoff supply of the mega-
gullies. In this way, critical runoff contributor sites to gullying can be better discriminated.
To achieve this goal, we need to assess the runoff coefficient in a sector with homo-
geneous soil, vegetation and slope gradient characteristics. It is, however, logistically
nearly impossible to install in the middle of Kinshasa several permanent field setups to
measure Horton runoff (Horton 1945; Ben-Asher and Humborg 1992). To our knowledge,
no method exists to assess the site- and rainfall-specific runoff coefficient (RC) at an
arbitrary place so that the amount of runoff delivered by one place can be compared with
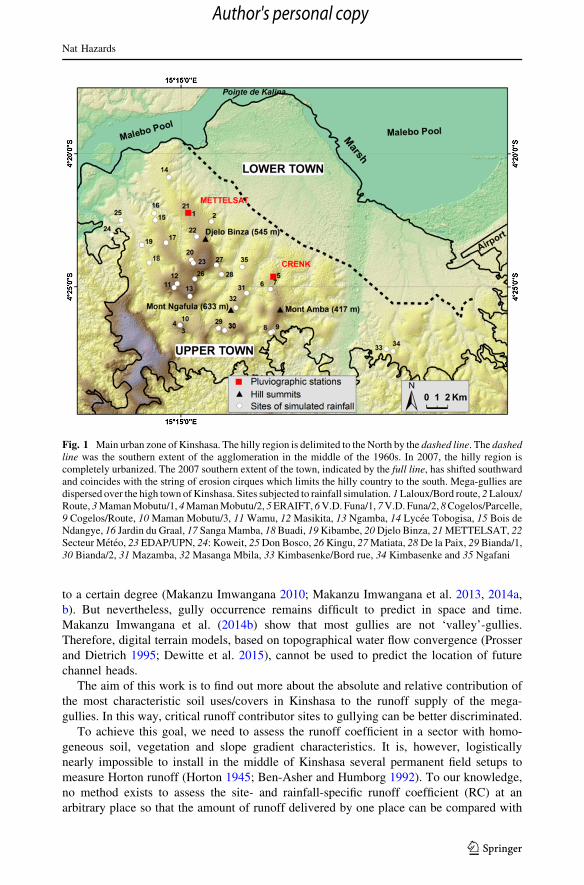
Fig. 1 Main urban zone of Kinshasa. The hilly region is delimited to the North by the dashed line. The dashedline was the southern extent of the agglomeration in the middle of the 1960s. In 2007, the hilly region iscompletely urbanized. The 2007 southern extent of the town, indicated by the full line, has shifted southwardand coincides with the string of erosion cirques which limits the hilly country to the south. Mega-gullies aredispersed over the high town ofKinshasa. Sites subjected to rainfall simulation. 1Laloux/Bord route, 2Laloux/Route, 3MamanMobutu/1, 4MamanMobutu/2, 5ERAIFT, 6V.D. Funa/1, 7V.D. Funa/2,8Cogelos/Parcelle,9 Cogelos/Route, 10 Maman Mobutu/3, 11 Wamu, 12Masikita, 13 Ngamba, 14 Lycee Tobogisa, 15 Bois deNdangye, 16 Jardin du Graal, 17 SangaMamba, 18Buadi, 19Kibambe, 20Djelo Binza, 21METTELSAT, 22Secteur Meteo, 23 EDAP/UPN, 24: Koweit, 25Don Bosco, 26Kingu, 27Matiata, 28De la Paix, 29 Bianda/1,30 Bianda/2, 31Mazamba, 32Masanga Mbila, 33 Kimbasenke/Bord rue, 34 Kimbasenke and 35 Ngafani
Nat Hazards
123
Author's personal copy

the amount of runoff by another place for the same rain. Therefore, to meet the aim of this
work, we propose a new method of site- and rainfall-specific assessment of RC. Literature
provides a wealth of studies, most by means of rainfall simulation (e.g., Casenave and
Valentin 1992; Dunne et al. 1991; Roth 2004). These studies focus on soil surface char-
acteristics and vegetation as factors governing infiltration capacity (IfC) and have inspired
us to use rainfall simulation technology to provide data to the mathematical model of IfC
by Smith (1972). In this way, we are able to evaluate rainfall characteristics as another
factor governing IfC.
2 Study area
The town of Kinshasa knew its first development in the rather flat plain (280–300 m ASL)
along the shore and the marshes of the Malebo Pool (Fig. 1). At the end of the 1960s, the
whole plain from Pointe de Kalina to the west and the Tshangu basin close to the airport to
the east was occupied. The southern limit of the city at that time (Fig. 1) coincides with the
northern edge of an undulating and widely dissected plateau, whose summits culminate
between 350 and 710 m ASL (De Maximy 1978; De Maximy and Van Caillie 1978). The
plateau extends over 240 km2 and is delimited to the south by a continuous sequence of
spring amphitheaters as indicated in Fig. 1. This explains the irregular and curved plan-
form of the southern plateau border. The northern edge of the plateau is believed to be an
ancient cliff or bluff of the Malebo Pool (De Maximy 1978). Both the plateau and adjacent
northern and southern plains are underlain by a sub-horizontal series of reddish shale and
soft sandstone of questionable Mesozoic age (Egoroff 1955). On the plateau, this series is
overlain by a 50- to 100-m-thick layer of sands belonging to the series of ochrous sands,
dating either to the end of the Cretaceous or to mid-Tertiary times (Cahen 1954) and
considered by De Ploey (1963) as a Kalahari sand type. The hills show a typical convex
form and are etched out in these sands. The valleys between the hills correspond more or
less to the top of the underlying shale-soft sandstone series, which acts as an aquitard
Fig. 2 Mega-gully ‘Laloux’ has incised Avenue Bolivar over a distance of 2129 km, is about 90 m wideand 30 m deep. The houses, formerly at a certain distance from the street, will slide into the mega-gully as itdeepens and widens. In the close foreground, a metallic construction meant to stop headward retreat of thegully head
Nat Hazards
123
Author's personal copy
compared to the porous overlying sands. Therefore, all the hills of the plateau contain a
perched water table with corresponding perennial springs at their foot (Van Caillie 1983).
The gully problem in Kinshasa started with the urbanization of the plateau at the end of
the sixties of the twentieth century (Makanzu Imwangana et al. 2014b). In 2007, the whole
plateau was built up. Today the town is extending further southward beyond the belt of
spring amphitheaters into the lower lying plain to the south. The gullies in the high town
(e.g., Fig. 2) are the result of vertical incision by concentrated wash. The incisions
sometimes reach and hence drain the water table. Some of these gullies are very large (e.g.,
Mataba 1: 960 m long, up to 150 m wide and up to 50 m deep), damage infrastructure and
develop within a few hours.
A relationship between gully shape and hydro-geological conditions in the high town
seems to exist. Gullies in Kinshasa have a V-like cross section as long as they remain
above the perched water table (Fig. 2). In some instances, they widen and show a flat floor
when they reach the latter in their lower course. Aggradation and water problems related to
gully incision can impact kilometers downslope in the city.
Kinshasa has a tropical wet and dry climate (Peel et al. 2007). The rainy season spans
from September/October to May (Bultot 1971). At the weather station of Kinshasa/Binza
(Fig. 1), the mean annual precipitation amounts to *1400 mm (Makanzu Imwangana
2010). Ntombi et al. (2004, 2009) indicate by statistics that the global change in the
Kinshasa region may be expressed in the future by increased rainfall, both in height and in
intensity.
The natural vegetation of the Kinshasa region is composed of dry dense forest,
savannahs and semi-aquatic and aquatic formations in the valleys and around the Malebo
Pool (Pain 1984; Kikufi and Lukoki 2008). In town, nothing remains from this luxurious
vegetation besides a few grasses like Laudetia demeusi and Schyzochysium semiberle
(Tshibangu et al. 1997). This change from natural vegetation conditions did, however, not
trigger gullying processes.
The population of Kinshasa increased by a factor of 20 in the last 50 years (Hotel de
Ville de Kinshasa 2007) and is now over nine million. In the meantime, the surface of the
urbanized area grew by a factor four and is now over 440 km2 (Makanzu Imwangana et al.
2012).
3 Materials and methods
The RC assessment method is based on Smith (1972) who presents a mathematical sim-
ulation of the infiltration envelope (IfE) and the time decay curve of the infiltration
capacity (IfC) of loose soils. IfE encompasses all IfC graphs for all initial rainfall inten-
sities higher than the saturated infiltration capacity (SIfC) (Fig. 3) and is expressed by the
power equation:
IfE ¼ SIfCþ a Tð Þ�b ð1Þ
where a and b are to be defined in function of time T. SIfC is a site-specific value.
According to Smith (1972), the time decay curve of the IfC obeys to the equation:
IfC ¼ SIfCþ m Tð Þ�n ð2Þ
where m and n are to be defined in function of time T.
Nat Hazards
123
Author's personal copy

Contrary to Smith (1972) who uses mathematical simulation to provide IfE data, data
input in this work is derived from field and laboratory observations by means of a rainfall
simulator and site-specific IfE estimations, representing the most current soil uses/covers.
Further, the RC is calculated for geomorphologically active rainstorms, being recorded
since 1989 in Kinshasa.
This work illustrates another possibility of rain simulator use in hydrological, pedo-
logical and geomorphic research (Martinez-Murillo et al. 2013). Rain simulation is applied
for the direct measurement of runoff and erosion (Lasanta et al. 2000; Romkens et al. 2001;
Hamed et al. 2002; Arnaez et al. 2004) and for the empirical study of processes under
conditions as close as possible to the natural ones. Rainfall simulation is also used to assess
the total infiltration capacity during a simulated rainstorm and to define indirectly the total
RC for the totality of the event (Esteves et al. 2000; Duiker et al. 2001; Poulenard et al.
2001; Li et al. 2011). But these experiments do not consider the time dependency of the
infiltration capacity in capillary soils as already defined by Horton (1933). In this study, a
rain simulator is used as an infiltrometer. Moeyersons (1989) defined in Rwanda for the
first time a field IfE by means of a drip screen rainfall simulator, but he only classified sites
in function of their time to ponding (TP), supposing an inverse relation between TP and
RC. This study goes a step forward and assesses directly site- and rainfall-specific RC.
3.1 Computation method of a site- and rainfall-specific RC
A rainstorm is decomposed in pluviophases, i.e., small packages of the same precipitation
volume or rainfall height (RH) (Fig. 4). According to Smith (1972), a natural rainstorm
with one runoff producing rainfall intensity (RI) peak can be subdivided into three parts.
The first part concerns the wetting phase of the soil between the start of rainfall and the
moment when water ponds (time to ponding: TP) at the soil surface (Fig. 4). Soil wetting is
Fig. 3 Full line represents the infiltration capacity (IfC) by Horton (1933) versus time for the case thatrainfall intensity (RI) is so high that ponding occurs at Time = 0. Horton infiltration capacity is composedof capillarity infiltration capacity, decaying with time and saturated infiltration, remaining constant. Smalldashed lines represent the full line, displaced to the right to cross the respective points of ponding (TP) atsimulated rainfall intensity (SRI). The dashed line is called the infiltration envelope (IfE). It is composed ofall possible TP points
Nat Hazards
123
Author's personal copy

due to capillary suction and no runoff occurs. According to Smith (1972), ponding and
subsequent decay of the infiltration capacity (IfC) start at very nearly the time when
accumulated volume of infiltrated water reaches a value which is associated with the
particular rainfall intensity at the time of ponding (TP), as given by the site-specific IfE.
This volume, or rainfall height, needed to produce runoff (expressed in mm), can be
calculated on the basis of the IfE by multiplying TP by its respective RI.
The second part of the rainstorm generates runoff and starts at TP (Fig. 4). From the top
of the pluviophase leading to an excess between RI and infiltration, the time decay curve of
the infiltration capacity (IfC) can be constructed. This curve is represented by the full line
in Figs. 2 and 3. The TP is arbitrarily set at the end of the first pluviophase leading to
runoff (Fig. 4). The second part is the runoff generating phase of the rainstorm. The total
amount of runoff generated during a rainstorm is theoretically given by the cumulated
difference between RI and IfC for all the pluviophases where RI C IfC.
The third part of the rainstorm concerns the pluviophases where RI B IfC. No more
runoff is produced on the site, although remnant axial runoff can be present in the land-
scape. The runoff coefficient (RC) is the total runoff produced during part two of the storm
divided by the total rainstorm rainfall height (RH) and varies between 0 and 1 or between 0
and 100 %.
A natural rainstorm can show several subsequent peaks where RI C SIfC, leading to
alternative periods of runoff and no runoff production. There is no reason to reconstruct the
time decay curve of the IfC at the consecutive moments of runoff appearance, because it is
supposed that during the same rainstorm, the soil does not significantly dry out and that
capillary tension remains at the level of the former runoff producing RI peak. Therefore,
Fig. 4 Illustration of thecomputation of the site-specificrunoff coefficient (RC) for agiven rainstorm, decomposed inpluviophases of the same rainfallheight (RH). Construction of theIfC decay curve at the moment ofTP/TR. The IfE decay curverepresented by the dashed line isused as a proxy for the IfC decaycurve. Explanation in text
Nat Hazards
123
Author's personal copy
the computation of the RC for a rainstorm with consecutive alternations of periods with
and without runoff generation is done in reference to the IfC time decay curve, constructed
from the top of the first runoff producing pluviophase of the rainstorm.
3.2 Rainfall simulator
The rainfall simulator used in Kinshasa is manufactured at the Laboratory of experimental
geomorphology at the KU Leuven, Belgium (Fig. 5). The instrument is of the sprinkler
type and functions by means of three valves: Two valves produce a SRI of 35 mm h-1
each, whereas the third generates a SRI of 70 mm h-1. The circular impluvium of the
apparatus has a diameter of ±3 m resulting in an area of *7 m2. A water reserve of 500 l
is taken into the field. An electric generator Honda EC2000 drives the pump. At the time of
construction, the simulator produces effectively SRI values of respectively 35, 70, 105 and
140 mm h-1. But, in the field, the SRI values are sometimes aberrant and unstable in time.
Therefore, the SRI has to be measured during every rain simulation test. Otherwise,
marked differences of SRI inside the *7 m2 impluvium cannot be observed.
3.3 Tested sites, procedures and additional data collection
Thirty-five sites have been selected for simulated rainfall tests (Fig. 1). In doing so, the
sites represent the most common soil uses/covers in the high town of Kinshasa. Included
are different types of earthen roads, courtyards, cultivated parcels, not cultivated spaces,
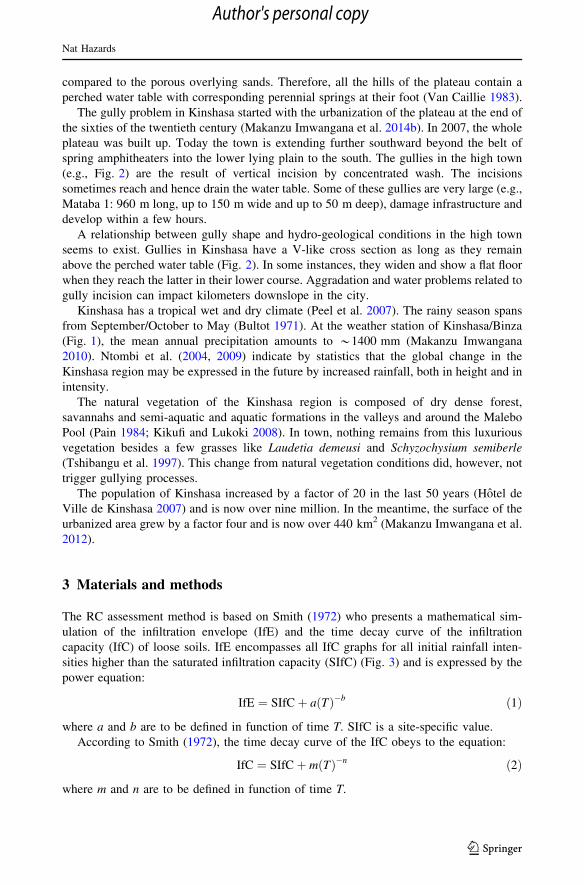
Fig. 5 KU Leuven rain simulator deployed in the ERAIFT site. The wetted impluvium is visible in theforeground
Nat Hazards
123
Author's personal copy

Table 1 Characteristics of sites subjected to rainfall simulation
Siteno.
Site name Site description Soilcover(%)
Type of vegetation
1 Laloux/Bord route Road side with sparsevegetation
5 Boerrhavia diffusa, Digitaria longiflora
2 Laloux/Route Unpaved road, bare soil 0
3 Maman Mobutu/1 Grass in garden 40 Digitaria horizontalis, Eragrostisciliaris, Tridax procumbeus
4 Maman Mobutu/2 Tall grass in fallow land 60 Digitaria horizontalis
5 ERAIFT Cultural area withLichens on soilsurface
14 Hibiscus sabdarrifa, Hibiscus acetocella
6 V.D. Funa/1 Land inhabited 1 Croton hirtus, Cyperus sp.
7 V.D. Funa/2 Grassy field (Tall grass) 50 Hyparrhenia familiaris, Digitariahorizontalis, Pennisetumpolystaschyon
8 Cogelos/Parcelle Houseyard 50 Cynodon dactylon
9 Cogelos/Route Unpaved road, bare soil 0
10 Maman Mobutu/3 Dense Grass in garden 90 Paspalum notatum, Digitariahorizontalis, Mariscus aletrnifolius,Cyperus distans
11 Wamu Sparse vegetation inland inhabited
50 Paspalum notatum, Eleusine indica,Cynodon dactylon
12 Masikita Street with grass 50 Panicum maximum, Eleusine indica
13 Ngamaba Road side with grass 30 Cynodon dactylon, Cyperus sp.
14 Lycee Tobongisa Sparse vegetation, landinhabited
5 Cynodon dactylon, Panicum repens
15 Bois de Ndangye Road side with sparsevegetation
8 Heterotis rotundifolia, Schweinckiaamericana
16 Jardin du Graal Grass in garden 30 Digitaria horizontalis, Scweinckiaamericana
17 Sanga Mamba Grass in land inhabited 55 Cynodon dactylon
18 Buadi Tall grass in landuninhabited
30 Eragrostis tremula, Croton hirtus
19 Kibambe Sparse vegetation, landinhabited
15 Cynodon dactylon
20 Djelo Binza Garden with grass 90 Eleusine indica, Cynodon dactylon,Paspalum notatum
21 Mettelsat Sparse vegetation ingarden
10 Schweinckia americana
22 Secteur Meteo Garden with grass 100 Paspalum notatum, Eleusine indica
23 EDAP/UPN Bare soil 0
24 Koweit Field lying fallow 15 Cynodon dactylon, Digitaria horizontalis
25 Don Bosco Dense grass inplayground
90 Cynodon dactylon, Eleusine indica
26 Kingu Tall grass inuninhabited land
60 Eleusine indica
27 Madiata Cultural area 2 Manihot esculenta
Nat Hazards
123
Author's personal copy
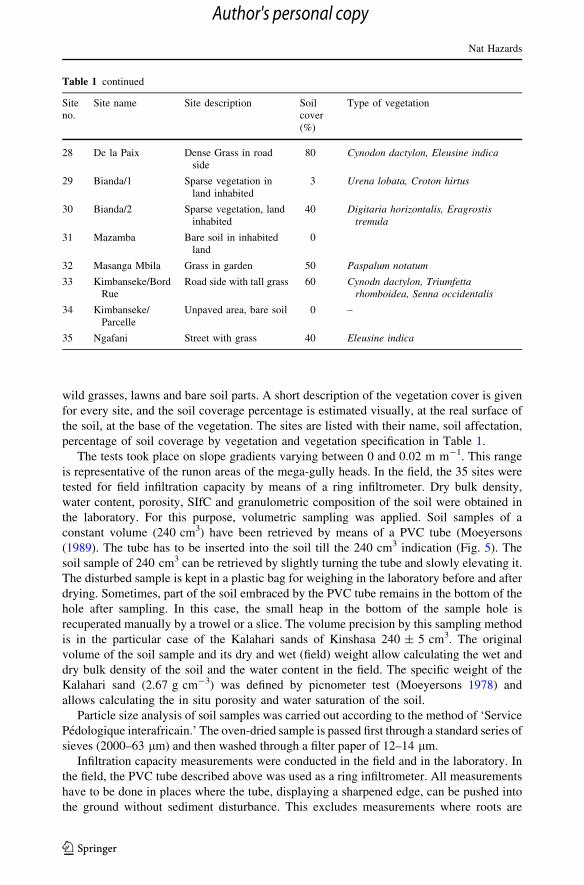
wild grasses, lawns and bare soil parts. A short description of the vegetation cover is given
for every site, and the soil coverage percentage is estimated visually, at the real surface of
the soil, at the base of the vegetation. The sites are listed with their name, soil affectation,
percentage of soil coverage by vegetation and vegetation specification in Table 1.
The tests took place on slope gradients varying between 0 and 0.02 m m-1. This range
is representative of the runon areas of the mega-gully heads. In the field, the 35 sites were
tested for field infiltration capacity by means of a ring infiltrometer. Dry bulk density,
water content, porosity, SIfC and granulometric composition of the soil were obtained in
the laboratory. For this purpose, volumetric sampling was applied. Soil samples of a
constant volume (240 cm3) have been retrieved by means of a PVC tube (Moeyersons
(1989). The tube has to be inserted into the soil till the 240 cm3 indication (Fig. 5). The
soil sample of 240 cm3 can be retrieved by slightly turning the tube and slowly elevating it.
The disturbed sample is kept in a plastic bag for weighing in the laboratory before and after
drying. Sometimes, part of the soil embraced by the PVC tube remains in the bottom of the
hole after sampling. In this case, the small heap in the bottom of the sample hole is
recuperated manually by a trowel or a slice. The volume precision by this sampling method
is in the particular case of the Kalahari sands of Kinshasa 240 ± 5 cm3. The original
volume of the soil sample and its dry and wet (field) weight allow calculating the wet and
dry bulk density of the soil and the water content in the field. The specific weight of the
Kalahari sand (2.67 g cm-3) was defined by picnometer test (Moeyersons 1978) and
allows calculating the in situ porosity and water saturation of the soil.
Particle size analysis of soil samples was carried out according to the method of ‘Service
Pedologique interafricain.’ The oven-dried sample is passed first through a standard series of
sieves (2000–63 lm) and then washed through a filter paper of 12–14 lm.
Infiltration capacity measurements were conducted in the field and in the laboratory. In
the field, the PVC tube described above was used as a ring infiltrometer. All measurements
have to be done in places where the tube, displaying a sharpened edge, can be pushed into
the ground without sediment disturbance. This excludes measurements where roots are
Table 1 continued
Siteno.
Site name Site description Soilcover(%)
Type of vegetation
28 De la Paix Dense Grass in roadside
80 Cynodon dactylon, Eleusine indica
29 Bianda/1 Sparse vegetation inland inhabited
3 Urena lobata, Croton hirtus
30 Bianda/2 Sparse vegetation, landinhabited
40 Digitaria horizontalis, Eragrostistremula
31 Mazamba Bare soil in inhabitedland
0
32 Masanga Mbila Grass in garden 50 Paspalum notatum
33 Kimbanseke/BordRue
Road side with tall grass 60 Cynodn dactylon, Triumfettarhomboidea, Senna occidentalis
34 Kimbanseke/Parcelle
Unpaved area, bare soil 0 –
35 Ngafani Street with grass 40 Eleusine indica
Nat Hazards
123
Author's personal copy
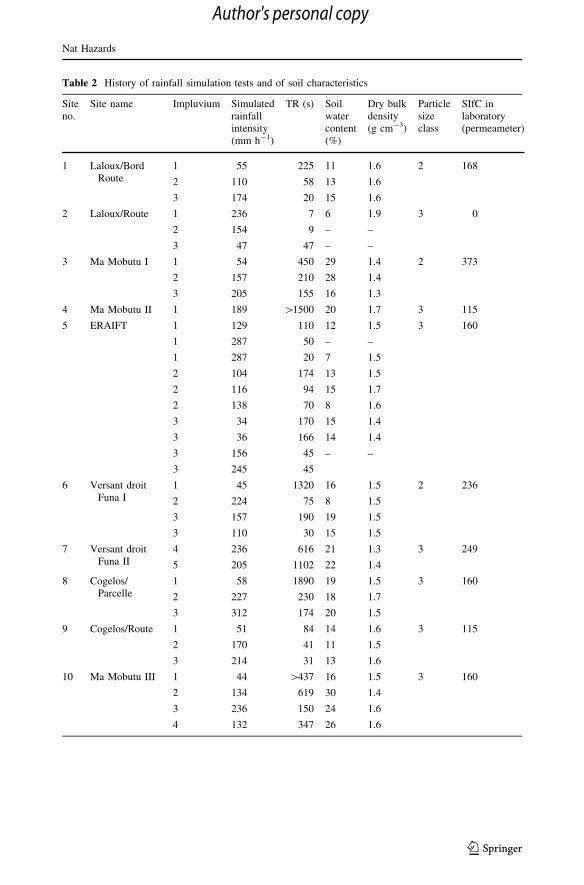
Table 2 History of rainfall simulation tests and of soil characteristics
Siteno.
Site name Impluvium Simulatedrainfallintensity(mm h-1)
TR (s) Soilwatercontent(%)
Dry bulkdensity(g cm-3)
Particlesizeclass
SIfC inlaboratory(permeameter)
1 Laloux/BordRoute
1 55 225 11 1.6 2 168
2 110 58 13 1.6
3 174 20 15 1.6
2 Laloux/Route 1 236 7 6 1.9 3 0
2 154 9 – –
3 47 47 – –
3 Ma Mobutu I 1 54 450 29 1.4 2 373
2 157 210 28 1.4
3 205 155 16 1.3
4 Ma Mobutu II 1 189 [1500 20 1.7 3 115
5 ERAIFT 1 129 110 12 1.5 3 160
1 287 50 – –
1 287 20 7 1.5
2 104 174 13 1.5
2 116 94 15 1.7
2 138 70 8 1.6
3 34 170 15 1.4
3 36 166 14 1.4
3 156 45 – –
3 245 45
6 Versant droitFuna I
1 45 1320 16 1.5 2 236
2 224 75 8 1.5
3 157 190 19 1.5
3 110 30 15 1.5
7 Versant droitFuna II
4 236 616 21 1.3 3 249
5 205 1102 22 1.4
8 Cogelos/Parcelle
1 58 1890 19 1.5 3 160
2 227 230 18 1.7
3 312 174 20 1.5
9 Cogelos/Route 1 51 84 14 1.6 3 115
2 170 41 11 1.5
3 214 31 13 1.6
10 Ma Mobutu III 1 44 [437 16 1.5 3 160
2 134 619 30 1.4
3 236 150 24 1.6
4 132 347 26 1.6
Nat Hazards
123
Author's personal copy

Table 2 continued
Siteno.
Site name Impluvium Simulatedrainfallintensity(mm h-1)
TR (s) Soilwatercontent(%)
Dry bulkdensity(g cm-3)
Particlesizeclass
SIfC inlaboratory(permeameter)
11 Wamu I 1 47 290 16 1.5 3 115
2 105 125 15 1.5
3 195 61 14 1.5
Wamu II 1 178 167 16 1.6 3 115
2 112 230 17 1.7
3 47 701 18 1.5
12 Masikita 1 47 160 15 1.4 2 236
1 135 65 24 1.2
1 220 59 16 1.6
2 36 [600 21 1.6
2 126 125 27 1.5
2 220 110 27 1.5
3 210 56 13 1.6
3 126 86 16 1.5
3 46 197 17 1.8
13 Ngamaba I 1 77 516 16 1.4 3 115
1 126 294 19 1.5
1 230 124 19 1.6
Ngamaba II 1 50 731 16 1.6 3 115
1 233 16 16 1.6
2 47 180 16 1.6
2 135 70 17 1.6
14 LyceeTobongisa
1 50 672 25 1.2 2 373
1 170 110 24 1.4
1 362 6 23 1.4
2 320 107 21 1.4
2 164 178 25 1.4
2 47 [1097 26 1.5
15 Bois deNdangye
1 39 289 8 1.3 2 304
1 153 53 12 1.7
1 312 47 12 1.7
2 53 340 10 1.4
2 167 56 14 1.2
2 208 52 29 1.2
16 Jardin du Graal I 1 44 720 15 1.8 1 116
2 148 384 18 1.8
3 224 173 20 1.5
Jardin du GraalII
1 243 82 17 1.6 1 116
2 113 166 17 1.5
Nat Hazards
123
Author's personal copy
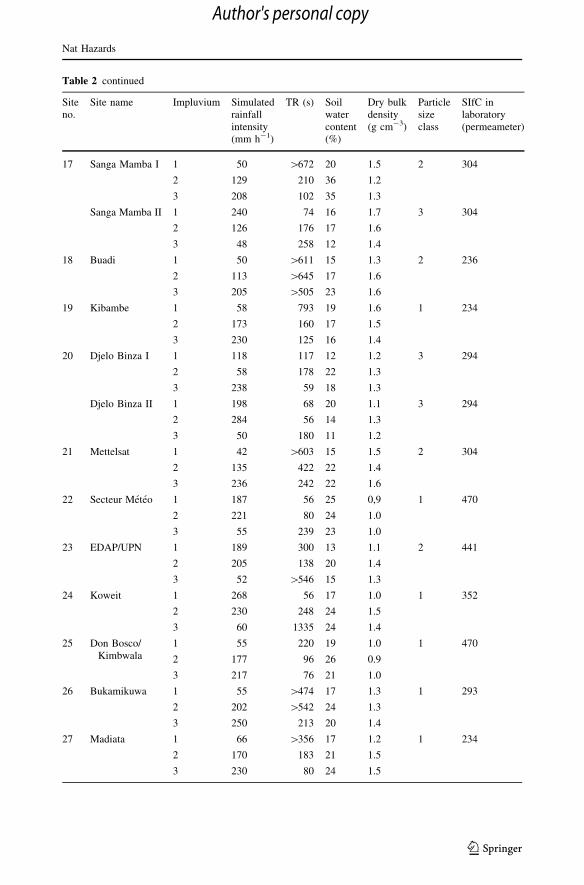
Table 2 continued
Siteno.
Site name Impluvium Simulatedrainfallintensity(mm h-1)
TR (s) Soilwatercontent(%)
Dry bulkdensity(g cm-3)
Particlesizeclass
SIfC inlaboratory(permeameter)
17 Sanga Mamba I 1 50 [672 20 1.5 2 304
2 129 210 36 1.2
3 208 102 35 1.3
Sanga Mamba II 1 240 74 16 1.7 3 304
2 126 176 17 1.6
3 48 258 12 1.4
18 Buadi 1 50 [611 15 1.3 2 236
2 113 [645 17 1.6
3 205 [505 23 1.6
19 Kibambe 1 58 793 19 1.6 1 234
2 173 160 17 1.5
3 230 125 16 1.4
20 Djelo Binza I 1 118 117 12 1.2 3 294
2 58 178 22 1.3
3 238 59 18 1.3
Djelo Binza II 1 198 68 20 1.1 3 294
2 284 56 14 1.3
3 50 180 11 1.2
21 Mettelsat 1 42 [603 15 1.5 2 304
2 135 422 22 1.4
3 236 242 22 1.6
22 Secteur Meteo 1 187 56 25 0,9 1 470
2 221 80 24 1.0
3 55 239 23 1.0
23 EDAP/UPN 1 189 300 13 1.1 2 441
2 205 138 20 1.4
3 52 [546 15 1.3
24 Koweit 1 268 56 17 1.0 1 352
2 230 248 24 1.5
3 60 1335 24 1.4
25 Don Bosco/Kimbwala
1 55 220 19 1.0 1 470
2 177 96 26 0.9
3 217 76 21 1.0
26 Bukamikuwa 1 55 [474 17 1.3 1 293
2 202 [542 24 1.3
3 250 213 20 1.4
27 Madiata 1 66 [356 17 1.2 1 234
2 170 183 21 1.5
3 230 80 24 1.5
Nat Hazards
123
Author's personal copy

present. The IfC (Darcy 1856) is defined by the timing of the fall of water level in the tube
above the ground and is given by Eq. 3 (Lambe and Whitman 1979):
k ¼ 2:3� a� L� log10ðh0ÞAðt1 � t0Þ � h1
ð3Þ
where k is the permeability in cm s-1, a is the section of the tube, which is 48 cm2, L is the
thickness of the sample tested, which is 5 cm, the depth to which the infiltrometer is
inserted in the ground without disturbance, A = a is the section of the sample tested, which
is 48 cm2, t1 - t0 is the time in seconds of the fall of water level h0 (=20 cm) to h1(=5 cm).
For the PVC tube ring infiltrometer in question, the infiltration capacity is given by:
k ¼ 6:93=ðt1 � t0Þ ð4Þ
In the laboratory, a constant head permeameter was used to test SIfC of soil samples of
the tested sites. SIfC was defined in function of the dry bulk density.
Table 2 continued
Siteno.
Site name Impluvium Simulatedrainfallintensity(mm h-1)
TR (s) Soilwatercontent(%)
Dry bulkdensity(g cm-3)
Particlesizeclass
SIfC inlaboratory(permeameter)
28 De la paix 1 231 47 18 1.4 3 205
2 87 [496 18 1.6
3 126 73 17 1.4
29 Bianda I 1 87 [612 17 1.4 3 160
2 150 900 22 1.5
3 240 300 20 1.7
30 Bianda II 1 240 87 14 1.4 2 236
2 129 519 20 1.5
3 71 [621 13 1.5
31 Mazamba 1 78 186 11 1.2 3 205
2 134 116 11 1.5
3 227 31 9 1.4
32 Masanga Mbila 1 51 [510 14 1.5 3 249
2 136 100 19 1.3
3 241 40 27 1.3
33 Kimbanseke/Rue
1 78 [607 20 1.6 2 304
2 137 [434 31 1.3
3 211 164 13 1.4
34 Kimbanseke/Parcelle
1 97 80 10 1.3 2 373
2 106 100 16 1.3
3 227 36 18 1.4
35 Ngafani 1 42 [372 18 1.5 2 236
2 126 186 19 1.5
3 230 135 23 1.7
Nat Hazards
123
Author's personal copy

The exact chronological procedure of rain simulation, number of impluvia tested,
measurements of hydraulic conductivity, volumetric sampling varies from site to site and is
given in Table 2. In most sites, a rainfall test has been done in three different impluvia in
order to establish the IfE. But the procedure was flexible. In some sites (5, 12, 13/1, 14 and
15), the same impluvium was used for repeated tests, in order to verify the influence of soil
moisture on the TP test. In other cases, the influence of vegetation cover was addressed.
3.4 Active rainstorm data gathering
In nine districts situated within a distance of 1 km to the weather station of Kinshasa/Binza
(Fig. 1), an investigation was carried out among the civil authorities and the inhabitants.
The aim was to obtain the exact dates (day, month and year) of sudden mega-gully
initiation and/or development. The pluviograms of the geomorphologically active rainfalls
linked to these occurrences are provided by the National Agency of Meteorology (MET-
TELSAT, Fig. 1). However, the analog cumulative rainfall height (RH) graphs do not
allow a very precise decomposition of a rainfall into pluviophases, i.e., packages of equal
RH. The 23 rains were decomposed manually into pluviophases of 5 mm RH. The defi-
nition of the rainfall intensity (RI) of each pluviophase is rather approximate once RI
exceeds a few tens of mm h-1. For this reason, an electronic pluviograph (Station
ALCYR) was installed at CRENK/Mont Amba (Fig. 1). The instrument is of the tipping
bucket type and measures the time in seconds between every package of RH of 0.2 mm.
4 Results
4.1 Soil parameters of the Kalahari sands
The particle sizes of the 35 tested soils show only minor differences. In average, the
Kinshasa sands contain 97.7 % sand ([63 lm). The mean D10 amounts to 100 lm. Based
on the spread of the granulometric population, three classes of samples are considered: the
class with 95.2–97.1 % sand (Class 1), the class with 97.1–98.1 % sand (Class 2) and the
class with 98.2–99.1 % sand (Class 3). Table 2 indicates the granulometric class of every
site.
In the 35 sites, the upper 5 cm of the soil has an initial water content varying between 2
and 39 % with a mean value of 9 %. The volume porosity varies between 33 and 65 %
with an average of 50 %. This high value is due to roots and other fine humic material. The
initial soil saturation varies between 5 and 85 % with an average of 25 %. The dry bulk
density varies between 1 and 1.9 g cm-3 with a mean of 1.4 g cm-3.
The ring infiltrometer tests prior to the first rainfall simulation show site-specific IfC
ranging from \50 to more than 900 mm h-1. There exists in the field no correlation
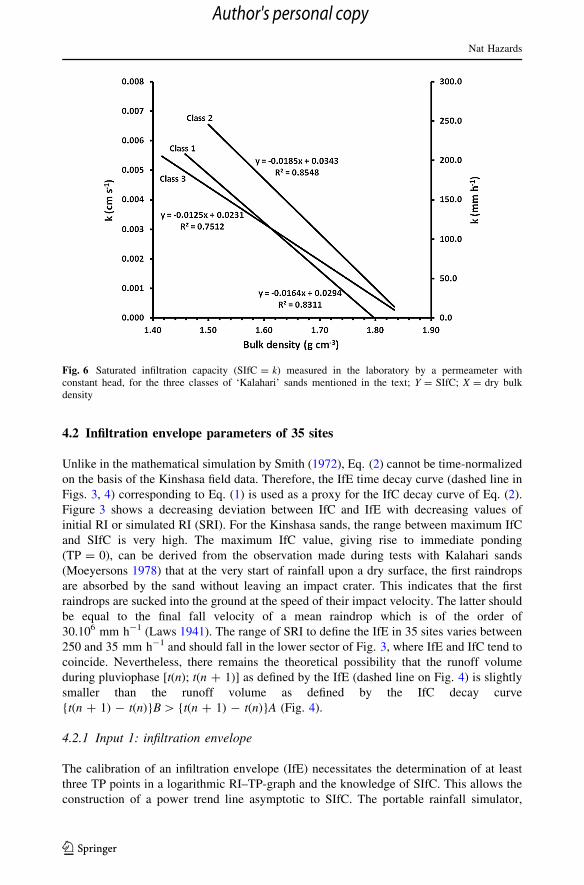
between IfC and dry bulk density. The laboratory tests with constant head permeameter
(Fig. 6) show that SIfC varies between 0 mm h-1 for a dry bulk density[1.85 g cm-3 and
200–260 mm h-1 for a dry bulk density of the order of 1.4–1.5 g cm-3, according to the
granulometric class. The difference between field and laboratory permeability test can be
ascribed to the unsaturated state of the soil at the start of the field test. For this reason, a
component of succion by capillarity is added to the saturated conductivity or SIfC
(Moeyersons 1989). Only the latter is measured in the laboratory.
Nat Hazards
123
Author's personal copy
4.2 Infiltration envelope parameters of 35 sites
Unlike in the mathematical simulation by Smith (1972), Eq. (2) cannot be time-normalized
on the basis of the Kinshasa field data. Therefore, the IfE time decay curve (dashed line in
Figs. 3, 4) corresponding to Eq. (1) is used as a proxy for the IfC decay curve of Eq. (2).
Figure 3 shows a decreasing deviation between IfC and IfE with decreasing values of
initial RI or simulated RI (SRI). For the Kinshasa sands, the range between maximum IfC
and SIfC is very high. The maximum IfC value, giving rise to immediate ponding
(TP = 0), can be derived from the observation made during tests with Kalahari sands
(Moeyersons 1978) that at the very start of rainfall upon a dry surface, the first raindrops
are absorbed by the sand without leaving an impact crater. This indicates that the first
raindrops are sucked into the ground at the speed of their impact velocity. The latter should
be equal to the final fall velocity of a mean raindrop which is of the order of
30.106 mm h-1 (Laws 1941). The range of SRI to define the IfE in 35 sites varies between
250 and 35 mm h-1 and should fall in the lower sector of Fig. 3, where IfE and IfC tend to
coincide. Nevertheless, there remains the theoretical possibility that the runoff volume
during pluviophase [t(n); t(n ? 1)] as defined by the IfE (dashed line on Fig. 4) is slightly
smaller than the runoff volume as defined by the IfC decay curve
{t(n ? 1) - t(n)}B[ {t(n ? 1) - t(n)}A (Fig. 4).
4.2.1 Input 1: infiltration envelope
The calibration of an infiltration envelope (IfE) necessitates the determination of at least
three TP points in a logarithmic RI–TP-graph and the knowledge of SIfC. This allows the
construction of a power trend line asymptotic to SIfC. The portable rainfall simulator,
Fig. 6 Saturated infiltration capacity (SIfC = k) measured in the laboratory by a permeameter withconstant head, for the three classes of ‘Kalahari’ sands mentioned in the text; Y = SIfC; X = dry bulkdensity
Nat Hazards
123
Author's personal copy

described in Sect. 3.2, was used to determine the three points (Fig. 3). For points 2 and 3,
the rainfall simulator has to be displaced to another impluvium where slope gradient,
vegetation/soil use and cover are closely identical and where the water content in the
5 upper cm of the soil is not influenced by the former test.
During the campaign, it soon appeared that a unequivocal determination of TP was not
possible. Ponding at the surface never occurred at the same time in the entire impluvium.
Some parts remained dry, while others were producing already appreciable runoff. For this
reason, the IfE is established by measuring the time in seconds between the start of SRI and
the moment that a runoff runnel reaches 10 cm beyond the impluvium border (time to
runoff, TR). The IfE, established by TR points, is rather a runoff envelope because the TR
is believed to approximate the time to continuous runoff in the field. For the sake of
convenience, the term infiltration envelope (IfE) will be used further in this article. The
term refers to ponding in the discussion of the mathematical model of Smith (1972) and
refers to the moment of continuous runoff when discussing the rain simulation results.
In 16 sites (Nos. 1, 2, 3, 5, 6, 8, 9, 11, 16, 19, 20, 22, 24, 25, 31 and 34), three TP/TR
values could be taken (Table 2). They increase with lowering SRI as it could be expected
on the basis of the mathematical simulation by Smith (1972) (Fig. 3). Figure 6 shows SIfC
depending on the granulometric class of the site and on the dry bulk density, measured in
the constant head permeameter in the laboratory. The difficulty in determining SIfE in the
field is that in most cases, SIfC in Fig. 6 (laboratory) appears to be superior to one or two
or even to the three SRI values used during the rainfall tests (Table 2). The phenomenon is
illustrated for the sites of Djelo Binza 1 and 2 (Fig. 7). The only exception is site 2, an
earthen road at Laloux, where the dry bulk density reaches 1.9 g cm-3 (Table 2), which
implies a close-to-zero SIfC (Fig. 6). For the 15 other sites, SIfC measured in the
Fig. 7 Two IfE tests at the Jelo Binza sites. In spite of marked inter- and intra-site differences in watercontent after each test (indicated in % of water weight to total sample weight), IfEs closely coincide,indicating that other factors than capillary suction by the soil are important. The SIfC, deduced from thepermeameter for the local sand class and the dry bulk density, amounts to 287 mm h-1. The infiltrationenvelopes show that runoff occurs after a certain TR at much lower rainfall intensities
Nat Hazards
123
Author's personal copy
laboratory does not correspond to the SIfC values suggested by rainfall simulation tests
(Table 2). In spite of all infiltrometer and permeameter measurements, valid field SIfC data
are not available for the 15 sites where three SRI tests gave univocal results and where the
dry bulk density remains below the critical 1.85 g cm-3 (Fig. 6). Therefore, in order to
establish the SIfE for these sites, several procedures were applied. One method assesses the
effective impluvium section as a percentage of the entire surface of the impluvium. As a
criterion, the percentage of vegetation cover has been used. But it quickly appears that the
recalculated SIfC is in all cases still much too high compared to the three SRIs applied to
define the three TP/TR times. The reason is that in most cases, especially where grasses are
concerned, the root extension just below the soil surface is much higher than the stem
coverage above the soil surface. Knowing that the SIfC in equilibrium with the specific soil
use/cover at every site should fall between 0 and the lowest SRI of the rainfall test, the half
value of the lowest SRI of the test is arbitrarily taken as the horizontal line to which the IfE
has to be asymptotic (Fig. 3).
In a double logarithmic (SRI-TR/TP) graph, IfEs of the 16 sites (1, 2, 3, 5, 6, 8, 9, 11,
16, 19, 20, 22, 24, 25, 31 and 34) are all rectilinear with a comparable slope gradient, but
without being strictly parallel as in the mathematic simulation by Smith (1972). However,
this allows defining an approximate IfE for the 19 other sites where TP/TR data are
controversial or insufficient in number. Table 5 lists the parameters a, b and SIfC (Eq. 1)
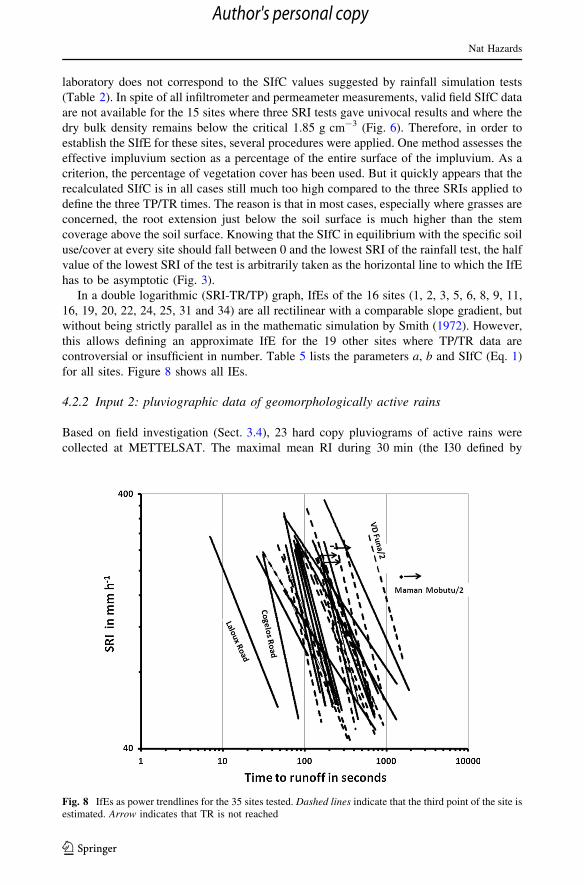
for all sites. Figure 8 shows all IEs.
4.2.2 Input 2: pluviographic data of geomorphologically active rains
Based on field investigation (Sect. 3.4), 23 hard copy pluviograms of active rains were
collected at METTELSAT. The maximal mean RI during 30 min (the I30 defined by
Fig. 8 IfEs as power trendlines for the 35 sites tested. Dashed lines indicate that the third point of the site isestimated. Arrow indicates that TR is not reached
Nat Hazards
123
Author's personal copy

Hudson (1971)) of the 23 active rainstorms was measured on these respective pluviograms.
Another two rainstorms, registered by the electronic pluviograph, were added to the series,
although field investigations were needed to ensure that these two rains were also active.
The 25 rainstorms are all used in Sect. 4.4 to calculate RC. Their average RH attains
64 mm, and their mean RI is 37 mm h-1 (Table 3).
Table 4 shows the active rainstorms with the lowest (24.9 mm) and the highest
(118.5 mm) RH decomposed in their respective pluviophases. Also, a rainstorm from the
middle of the cluster (67 mm) is added. The RH of the smallest active rain, P24/04/1984
(Table 3), amounts to 24.9 mm, with an average RI of 21.8 mm h-1 (Fig. 9).
4.3 Runoff coefficients on the 35 sites
Site-specific RCs have been calculated on the basis of the IfE equations (Eq. 1). Table 5
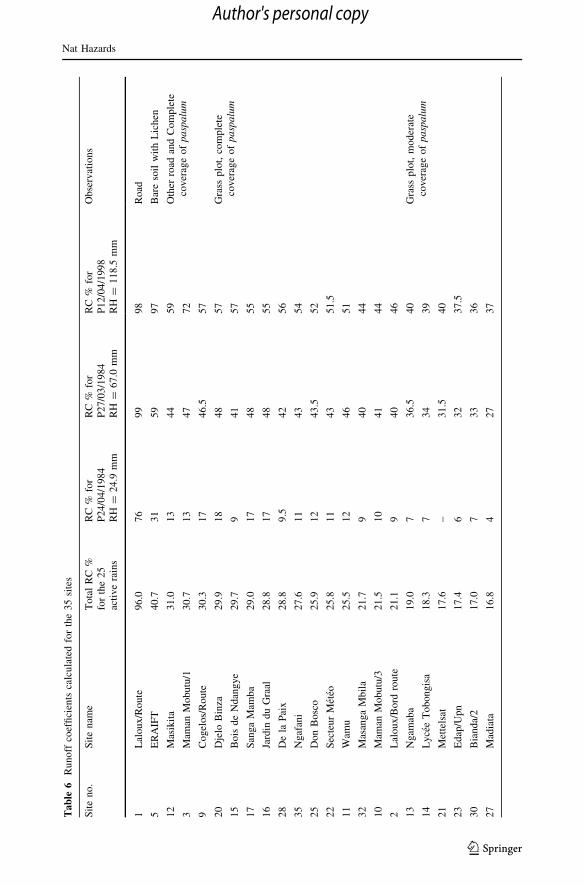
lists the parameters a, b and SIfC for each site, and Table 6 shows a ranking of the sites
according to their total RC for the 25 rainstorms. This ranking is considered as repre-
sentative of the end of the rainy season in the current rainfall regime:
Table 3 Active rainfall data1979–2012
Rainstorm date Total RH mm Mean RI mm h-1
P04/04/1979 75.6 53.5
P20/04/1983 53.8 30.9
P10/11/1983 57.7 19.6
P27/03/1984 67.0 53.9
P24/04/1984 24.9 21.8
P16/03/1986 61.4 55.5
P14/04/1986 56.4 24.8
P06/05/1986 58.4 53.2
P16/05/1986 100.5 73.2
P29/10/1986 103.1 62.9
P08/02/1990 82.0 40.3
P09/12/1990 41.4 25.2
P13/11/1991 56.7 24.7
P16/01/1992 104.0 30.9
P09/05/1993 55.3 9.7
P23/05/1995 59.9 42.1
P12/04/1998 118.5 81.8
P14/11/1998 46.3 12.1
P20/03/2001 55.1 31.1
P20/04/2002 57.0 18.3
P06/05/2002 97.1 63.9
P07/11/2002 40.9 6.1
P19/04/2005 33.3 65.9
P08/11/2012 20.2 15.4
P20/11/2012 62.6 15.3
Mean 63.6 –
Min 20.2 6.1
Max 118.5 81.8
Nat Hazards
123
Author's personal copy

Table 4 Pluviophases of threeactive rainstorms: 4.9, 67.0 and118.5 mm
Rainfall date Pluviophases
RH (mm) Duration (min) RI (mm h-1)
24/04/1984 1.8 30 3.6
5 10 30.0
5 5 60.0
5 10 30.0
5 75 4.0
3.1 55 3.4
Total 24.9 185 21.8
27/03/1984 5 65 4.6
5 5 60.0
5 2 150.0
5 5 60.0
5 4 75.0
5 6 50.0
5 4 75.0
5 5 60.0
5 6 50.0
5 5 60.0
5 5 60.0
5 8 37.5
5 72 4.2
2 15 8.0
Total 67 207 53.9
12/04/1998 3.5 5 42.0
5 3 100.0
5 5 60.0
5 2 150.0
5 5 60.0
5 5 60.0
5 7 42.9
5 6 50.0
5 11 27.3
5 8 37.5
5 2 150.0
5 4 75.0
5 2 150.0
5 2 150.0
5 3 100.0
5 3 100.0
5 5 60.0
5 5 60.0
5 2 150.0
5 3 100.0
5 3 100.0
Nat Hazards
123
Author's personal copy

a. The first place is occupied by surfaces artificially over-compacted, like earthen roads,
and they produce a mean RC of 96 %.
b. On the second place comes ERAIFT (RC = 40.7 %), a bare soil, with a moderate dry
bulk density of 1.5 g cm-3, but sealed by lichen.
c. The third place is occupied by two groups of sites. The first group is represented by a
few sites of complete coverage by Cynodon dactylon and Paspalum notatum like
Masikita Site. The second group contains sites with other roads like Cogelos/route.
d. The further place is subdivided into two groups. The first group shows sites with grass plot
and the second one with complete coverage of Cynodon dactylon and Paspalum notatum.
e. The sixth place is again subdivided into two groups. The first group comprises a few
sites with grass plot, and the second contains sites with a moderate coverage of
Cynodon dactylon and Paspalum notatum.
f. The second last position is occupied by three categories of sites. The presence of
cultivated plot and high grass plot could be expected here because of the vegetation (Rey
et al. 2004). But to this group belongs also courtyard with very low slope gradient.
g. Finally, there are sites 4, 18, 26 and 33 (Table 1), with undefined IfE: The water
reserve of 500 l available for the tests was insufficient. It concerns sites with the
highest infiltration capacities of Kinshasa.
Table 6 gives also the 35 site-specific RCs for three individual active rains. It concerns
the smallest active rain of 24.9 mm RH (mean RI = of 21.8 mm h-1), the ‘moderate’ rain
of 67 mm RH (mean RI = 54 mm h-1) and the biggest active rain of the collection, the
one of 118.5 mm RH (mean RI = 82 mm h-1). It appears that the size of the rainstorm
Table 4 continuedRainfall date Pluviophases
RH (mm) Duration (min) RI (mm h-1)
5 3 100.0
5 10 30.0
5 33 9.1
Total 118.5 137 81.8
Fig. 9 Rainfall characteristics and RC. A Low correlation between RH (=X) and RC (=Y), B highcorrelation between RI (=X) and RC (=Y)
Nat Hazards
123
Author's personal copy

influences only slightly the ranking but to a much bigger degree the importance of the site-
specific RC. This suggests that not only soil and soil cover characteristics but also rain-
storm characteristics govern RC. Figure 10A, B shows respectively that RC is poorly
related to RH but correlated to the mean RI.
Table 5 Parameters a, b, and SIfC in the IfE equation: a SRI-b ? SIfC
Siteno.
Vegetation type or soil cover Parameters
a b SIfC
1 Boerrhavia diffusa, Digitaria longiflora 7811.7 -0.989 28
2 Earthen road 2240.4 -1.098 0
3 Digitaria horizontalis, Eragrostis ciliaris, Tridax procumbeus 4,000,000 -1.949 25
4 Digitaria horizontalis – – –
5 Hibiscus sabdarrifa, Hibiscus acetocella 4,000,000 -2.245 17
6 Croton hirtus, Cyperus sp. 8227.7 -0.792 23
7 Hyparrhenia familiaris, Digitaria horizontalis, Pennisetumpolystaschyon
80,000,000 -1.971 45
8 Cynodon dactylon 58,329 -0.978 29
9 Unpaved road, bare soil 280,175 -2.088 26
10 Paspalum notatum, Digitaria horizontalis, Mariscus aletrnifolius,Cyperus distans
3,000,000 -1.890 30
11 Paspalum notatum, Eleusine indica, Cynodon dactylon 110,157 -1.254 24
12 Panicum maximum, Eleusine indica 750,347 -2.020 24
13 Cynodon dactylon, Cyperus sp. 2304.8 -0.690 24
14 Cynodon dactylon, Panicum repens 127,112 -1.266 25
15 Heterotis rotundifolia, Schweinckia americana 12,751 -1.081 20
16 Digitaria horizontalis, Scweinckia americana 614,053 -1.513 22
17 Cynodon dactylon 73,557 -1.251 28
18 Eragrostis tremula, Croton hirtus – – –
19 Cynodon dactylon 39,755 -1.052 29
20 Eleusine indica, Cynodon dactylon, Paspalum notatum 526,234 -1.896 29
21 Schweinckia americana 20,000,000 -2.018 27
22 Paspalum notatum, Eleusine indica 849,888 -1.864 28
23 Bare soil 55,551 -1.134 25
24 Cynodon dactylon, Digitaria horizontalis 4496.5 -0.659 30
25 Cynodon dactylon, Eleusine indica 811,955 -1.891 28
26 Eleusine indica – – –
27 Manihot esculenta 1748.9 -0.618 23
28 Cynodon dactylon, Eleusine indica 26,859 -1.217 22
29 Urena lobata, Croton hirtus 20,000,000 -2.003 30
30 Digitaria horizontalis, Eragrostis tremula 33,428 -1.089 29
31 Bare soil in inhabited land 2992.6 -0.784 39
32 Paspalum notatum 13,370.0 -1.051 29
33 Cynodn dactylon, Triumfetta rhomboidea, Senna occidentalis – – –
34 Unpaved area, bare soil 3618.8 -0.912 44
35 Eleusine indica 7,000,000 -2.077 24
Nat Hazards
123
Author's personal copy
Tab
le6
Runoffcoefficientscalculatedforthe35sites
Siteno.
Sitenam
eTotalRC%
forthe25
activerains
RC%
for
P24/04/1984
RH
=24.9
mm
RC%
for
P27/03/1984
RH
=67.0
mm
RC%
for
P12/04/1998
RH
=118.5
mm
Observations
1Laloux/Route
96.0
76
99
98
Road
5ERAIFT
40.7
31
59
97
BaresoilwithLichen
12
Masikita
31.0
13
44
59
Other
road
andComplete
coverageofpaspalum
3Mam
anMobutu/1
30.7
13
47
72
9Cogelos/Route
30.3
17
46.5
57
20
Djelo
Binza
29.9
18
48
57
Grass
plot,complete
coverageofpaspalum
15
BoisdeNdangye
29.7
941
57
17
SangaMam
ba
29.0
17
48
55
16
Jardin
duGraal
28.8
17
48
55
28
Dela
Paix
28.8
9.5
42
56
35
Ngafani
27.6
11
43
54
25
DonBosco
25.9
12
43.5
52
22
SecteurMeteo
25.8
11
43
51.5
11
Wam
u25.5
12
46
51
32
MasangaMbila
21.7
940
44
10
Mam
anMobutu/3
21.5
10
41
44
2Laloux/Bord
route
21.1
940
46
13
Ngam
aba
19.0
736.5
40
Grass
plot,moderate
coverageofpaspalum
14
LyceeTobongisa
18.3
734
39
21
Mettelsat
17.6
–31.5
40
23
Edap/Upn
17.4
632
37.5
30
Bianda/2
17.0
733
36
27
Madiata
16.8
427
37
Nat Hazards
123
Author's personal copy

Tab
le6continued
Siteno.
Sitenam
eTotalRC%
forthe25
activerains
RC%
for
P24/04/1984
RH
=24.9
mm
RC%
for
P27/03/1984
RH
=67.0
mm
RC%
for
P12/04/1998
RH
=118.5
mm
Observations
29
Bianda/1
15.3
–31
36
Culturalplot,Highgrass
plot,
courtyardwithverylow
slope
34
Kim
banseke/Parcelle
14.4
420
32
31
Mazam
ba
13.6
422
31
6VD
Funa/1
13.3
–28
30
19
Kibam
be
13.2
–28
32
24
Koweit
7.2
–12
21
8Cogelos/Parcelle
5.2
–6
20
7VD
Funa/2
4.1
–5
18
26
Kingu
––
––
Undefined
18
Buadi
––
––
33
Kim
banseke/Bord
route
––
––
4Mam
anMobutu/2
––
–
Nat Hazards
123
Author's personal copy

4.4 Critical rainstorm for sudden gully initiation or accelerated development
According to the interviews, the smallest active rain was the one of 24/04/1984 with a RH of
24.9 mm and a mean RI of 21.8 mm h-1 (Table 3). The rain recorded on 08/11/2012 which
totals 20.9 mm RH with a mean RI of 15.8 mm h-1 did not provoke visible mega-gully
initiation or development in theUNIKIN area and, therefore, is not considered as an active one.
Our calculations show that the smallest active rain of 24/04/1984 should provoke runoff
on all tested sites, except for those with high grasses and/or those with grasses or with a
bare surface but located on a slope gradient B0.08 mm-1(Table 6). During the rain of
08/11/2012, apparently just below the smallest active rain, only 5 sites out of the 35 would
produce runoff. It concerns Laloux/Road (RC = 86.7 %) due to its high dry bulk density
of 1.9 g cm-3 and ERAIFT (RC = 6.1 %) because of the sealing of the surface by lichen.
The other sites are Cogelos/Road (RC = 3 %) due again to the high compaction, and Djelo
Binza (RC = 1.8 %) and Masikita (RC = 1.6 %) both showing a dense cover by Cynodon
dactylon and Paspalum notatum.
The frequency analysis (Gumbel 1958; Beirlant et al. 2004; Reiss and Thomas 2007) of
the I30 of the active rains can be used as prediction of their occurrence (Fig. 10A, B). The
results show that the critical mean RI of 21.8 mm h-1 (Table 3) is reached every year. The
maximum mean RI of 82 mm h-1 is reached every 11 years. The critical active rain of
24.9 mm RH occurs several times per year.
5 Discussions
5.1 Causes of inaccuracies in the site-specific RC computation
• Rainfall simulator
Possible sources of error are introduced when the rainfall simulator fails to produce during
the test a constant SRI. In this case, the test has to be resumed in another impluvium with
exactly the same vegetation, soil and slope gradient characteristics.
Fig. 10 A Frequency analysis of I30 at Kinshasa/Binza, B Gumbel (1958) method adjustment of I30 atKinshasa/Binza
Nat Hazards
123
Author's personal copy

• Choice of impluvia
The intra-site variation of the site characteristics can induce various results even when the
rainfall simulator works well. The choice of three impluvia showing similar characteristics
is of primordial importance. In the worst case, errors are indicated by a not univoke
negative relation between SRI and TR.
• Pluviophase RH
Errors can result from a subdivision of a rainstorm into pluviophases showing a too high
RH. As shown in Fig. 4, TP/TR is located at the end of the pluviophase during which
runoff starts. For easy computation purposes, the IfE is constructed at the right upper angle
of this pluviophase. But, as a matter of fact, the IfE should start somewhere inside the
pluviophase and the IfE graph should be moved more to the left. Not doing so results in an
overestimation of runoff during the subsequent pluviophases. The overestimation will
increase with higher pluviophase RH. Therefore, it is recommended to use rainfall records
from an automatic rain gauge of the tipping bucket type, where pluviophase RH is in most
cases lower than 0.5 mm.
• IfE as a proxy for IfC
It has been indicated (Sect. 3.1) that using IfE as a proxy for IfC contributes to inaccurate
RC calculation. This leads possibly to a slight underestimation of RC (Fig. 7). In the case
of soil uses other than road, farmland or tall and dense grass vegetation, the arbitrarily
accepted SIfC (lowest SRI applied/2) leads to errors in the computation of RC that are
difficult to estimate. In order to avoid this, a rainfall simulator, able to produce SRI
\35 mm h-1, should be used. The computation error resulting from the use of arbitrary
SIfC should be less pronounced in less sandy soils where SIfC is reduced to a few mm h-1.
In such a case, the error in the RC computation is minimal for the common duration of
natural rainfall.
5.2 Timing of field tests and validity of inter-site comparison of RC
The comparison of the site- and rainfall-specific RC of the 35 sites is based on the
theoretical fact that all sites are affected at the same moment by the same rain. This implies
that rainfall test and complementary soil sampling should be done on the 35 sites at the
same moment, although the water content of the soil at that moment might considerably
vary from site to site. However, data retrieving at one single site needs a visit of several
hours, and in the best case, two sites a day could be tested. So, the testing of 35 sites took
place from May 2 to August 2, 2012. This period covers the end of the rainy season and the
start of the dry season and is characterized by the highest seasonally ambient soil water
content.
A comparison of site-specific RCs is only possible if the RC computation concerns a
same theoretical rainfall or a same series of rainfall events affecting all sites at the same
time. The question arises if data input spread over the period from 2 May to 2 August
allows valid inter-site RC comparison. To answer this question, all factors influencing the
IfE and having a daily or seasonal evolution have to be considered. In this work, it is shown
that two time-dependent factors influence the establishment of the IfE:
• The first factor is the initial water content of the upper 5 cm of the soil. Without doubt,
this factor plays a role in the total infiltration capacity decay with time. But the example
of site 20, Jelo Binza I and II (Fig. 7; Table 5), shows that the resulting IfE can be
Nat Hazards
123
Author's personal copy
nearly identical for both sites, even though inter-site as well as intra-site soil water
content varies considerably.
• Secondly, there is the vegetation effect expressed by the effective infiltration surface. In
sites Jelo Binza I and II, vegetation is exactly the same (Table 5). In the wet tropical
climate of Kinshasa, the effective infiltration surface falls often deep below 10 %. This
is the case in lawns with a root mat or in completely lichen-covered soil. In such cases,
the vegetation factor, comprised in the notion of effective infiltration surface, greatly
exceeds and therefore masks the capillary suction effect of the soil. In this context, it is
thought that RC comparisons, based on tests during a period of decreasing change in
vegetation like the period of 2 May to 2 August, are valid.
5.3 Role of vegetation in RC ranking
In many parts of the world, e.g., California (Dunne et al. 1991), Western Africa (Casenave
and Valentin 1992), Queensland (Roth 2004) and Rwanda (Moeyersons 1989), increase in
vegetation volume generally increases IfC: Root activity opens soil pores/fissures; the
aerial part of the vegetation reduces the impact of raindrops so that formation of ‘filtration
pavements’ (Bryan 1973) and other IfC reducing surface seals (Casenave and Valentin
1992; Poesen et al. 2003) is retarded or prevented; the aerial part of the vegetation also
decreases runoff velocity, what favors IfC, or stores part of the rainfall. In Kinshasa, the
porous and loose sands are not very prone to surface sealing and root activity is not needed
to have high SIfC or IfC. Figure 7 shows that SIfC, derived from field rainfall simulation
measurements, remains far below SIfC measured in the laboratory. In other words, the RC
ranking of sites in Kinshasa results from the fact that vegetation here is lowering the IfC or
SIfC instead of increasing it. This can be understood in the sense that the presence of a root
mat and/or the presence of vegetation remnants lying on the ground (e.g., grass stalks and
sticking leaves) increases locally the impermeability and reduces the effective soil surface
through which infiltration can take place. The sealing of bare soil by lichen, mosses and
algae is an extreme case of biological reduction in the effective soil surface.
The effective infiltration surface can be expressed as a percentage of the total soil
surface and will mainly depend on the morphological characteristics of the vegetation at
the surface of the soil and just below (e.g., root mat). In the case of farmland, hoeing
temporally reduces the bulk density of the soil below natural values, what might partially
or totally compensate for the reduction in effective infiltration surface. In the case of a
road, the soil is artificially compacted. According to the laboratory permeameter tests, the
SIfC of the soil at a dry bulk density of 1.85 g cm-3 should be nearly zero.
6 Conclusions and recommendations
6.1 RC ranking of representative soil uses in Kinshasa: check with currentopinions—basic recommendations
The first and most striking conclusion is that both earthen and tarred roads are by far the
highest runoff producers. The total RC of the earthen Laloux Road (Site 2) amounts to
96 % as calculated for 25 active rains. This explains why road control is a good proxy for
the topographical control of mega-gullies in Kinshasa (Makanzu Imwangana et al. 2014a).
In the high town of Kinshasa, the road network, both earthen and tarred, occupies *13 %
Nat Hazards
123
Author's personal copy
of the total surface of the contributing areas to mega-gully heads and, therefore, explains a
RC of *12.5 % for the entire urban area. A densification of the road network will increase
the RC. This implies that critical rain for gullying becomes a relative notion. For the actual
situation in the high town of Kinshasa, the critical RH is 24.9 mm (Sect. 3.4), but this
value will lower with increasing road surface percentage. One way to reduce the disastrous
runoff production by roads is to develop road coatings which allow easy water infiltration.
This solution aims to reduce runoff peak discharge upon and along the roads and might be
an alternative for the installation of runoff diverters along the streets (Makanzu Imwangana
et al. 2014a).
The second biggest RC is given by sandy soil covered by a thin layer of lichen (Site 5
ERAIFT). This confirms the ability of microorganisms, like it has also been observed in
Belgium and Israel (De Ploey 1977; Yair 2006), to seal an otherwise permeable soil.
Table 6 shows that RC of ERAIFT approaches RC of Laloux road for the RH of
118.5 mm. In the perspective of gully development due to Horton runoff, gullies in the
high town of Kinshasa have the highest chances to develop along roads and in places where
road runoff leaves the road. Also areas on bare sand with lichen should be prone to gully
formation.
In the other sites, RC is considerably lower (Table 6). In the third group, RC falls below
one-third of the one of Laloux road. It is interesting to see that this group includes bare
surfaces together with well-developed grass plots (Paspalum notatum sp., Cynodon
dactylon sp.). It concerns grass courts where the grass is regularly cut. Lawn is a type of
soil use, often advised to be applied within the courtyards to reduce runoff, but this study
shows that grass courts along houses are not a good solution for the runoff problem. Our
observations show, indeed, that grass courts, regularly cut, not only quickly cover nearly
100 % of the soil, but develop in the same time a strong and less permeable continuous
root mat.
The other sites produce a still lower RC, depending on the percentage of soil cover as
well as slope gradient. A point to be raised here is that courtyards with bare soil appear
only from the third group on but that they are especially present in the fifth group. This is
worth of noting because Van Caillie (1983) warned for the big quantities of runoff they
produce. Courtyards with a lower slope gradient, therefore, do not produce much runoff
regardless of the soil use. Inhabitants should be urged to give special attention to this
aspect of their courtyards. Instead of making them unsafe for children by digging deep
collector holes, a very slight counter-slope of\0.08 m m-1 should allow quasi-complete
infiltration of rain water in most of the cases. Of course roof water can cause a problem in
the compound if not collected, e.g., in a sink pit.
6.2 Early warning system for gullying and global change effects
The critical (RH-RI) combination for gulling in Kinshasa can be used by the meteoro-
logical services of DR Congo to add early warnings to the weather forecast.
Table 6 illustrates that RC not only is a function of soil use, soil compaction and slope
gradient but also of the simple rainstorm parameters RH and RI. This indicates that
changes in pluviometric regime can induce changes in the feeding of gullies and in the
hydrological cycle in general. The trend, indicated in Table 6, is such that a regime with
higher and more intense rainfall (Fig. 9B) will create higher RCs, especially in sites which
today display a comparative low RC. Ntombi et al. (2009), on the basis of pluviometric
analysis of data from the period of 1991–2005, think that in the future heavy and big rains
Nat Hazards
123
Author's personal copy

will become more frequent. This should be a starting point for initiating research into that
direction to provide solutions for adaptation strategies.
6.3 Calibration of the new method of RC assessment
The inaccuracies presented in Sect. 5.1 show that the proposed method of RC assessment is
still in the experimental phase. The use of IfE as a proxy for Horton IfC leads to a small RC
underestimation, which might be partially compensated for by overestimation due to high
pluviophase RH. Other inaccuracies stem from inadequate choice of intra-site test impluvia
and from material defects. Although the method is basically sound and the results are
logical, a comparison with data from field stations could lead to still more accurate RC
assessment.
Acknowledgments The authors thank the Frame Agreement between Belgium and the DR Congo con-cerning the Institutional Collaboration between the Royal Museum for Central Africa (Tervuren, Belgium)and the ‘Centre de Recherches Geologiques et Minieres’ (Kinshasa, DR Congo).
References
Arnaez J, Larrea V, Ortigosa L (2004) Surface runoff and soil erosion on unpaved forest roads from rainfallsimulation tests in northeastern Spain. Catena 57:1–14
Beirlant J, Goegebeur Y, Segers J, Teugels J (2004) Statistics of extremes: theory and applications. Wiley,London
Ben-Asher J, Humborg G (1992) A partial contributing area model for linking rainfall simulation data withhydrographs of a small arid watershed. Water Resour Res 28:2041–2047
Bryan RB (1973) Surface trusts formed under simulated rainfall on Canadian soils. Report to a conferenceheld in Pisa, CNR, 30p
Bultot F (1971) Statistiques des pluies intensives en un point dans une aire du Congo belge et du Ruanda –Urundi. B.C.C.V, 11, Bruxelles, 136p
Cahen L (1954) Geologie du Congo belge. H. Vaillant-Carmanne, LiegeCasenave A, Valentin C (1992) A runoff capability classification system based on surface features criteria in
semi-arid areas of West Africa. J Hydrol 130(23):1–249Darcy H (1856) Les fontaines publiques de la ville de Dijon. Dalmont, ParisDe Maximy R (1978) Site general de Kinshasa. In: Atlas de Kinshasa, Planche 1, B.E.A.U/T.P.A.T, IGN –
ParisDe Maximy R, Van Caillie X (1978) Geomorphologie de Kinshasa. In: Atlas de Kinshasa, Planche 8,
B.E.A.U/T.P.A.T, IGN – ParisDe Ploey J (1963) Quelques indices sur l’evolution morphologique et paleoclimatique des environs du
Stanley-Pool (Congo). Faculte des Sciences, Studia Universitatis «Lovanium» 17, Ed. de l’Universite,Leopoldville, 16 p?Annexes
De Ploey J (1977) Some experimental data on slopewash and wind action with reference to quaternarymorphologenesis in Belgium. Earth Surf Process Land 2:101–115
Dewitte O, Daoudi M, Bosco C, Van Den Eeckhaut M (2015) Predicting the susceptibility to gully initiationin data-poor regions. Geomorphology 228:101–115
Duiker SW, Flanagan DC, Lal R (2001) Erodibility and infiltration characteristics of five major soils ofsouthwest Spain. Catena 45:103–121
Dunne T, Zhang W, Aubry BF (1991) Effects of rainfall, vegetation, and microtopography on infiltrationand runoff. Water Resour Res 27(9):2271–2285
Egoroff A (1955) Esquisse geologique provisoire du sous-sol de Leopoldville. Service geologique du Congobelge et du Ruanda-Urundi, 6, 15p
Esteves M, Planchon O, Lapetite JM, Silvera N, Cadet P (2000) The «EMIRE» large rainfall simulator:design and field testing. Earth Surf Process Land 25:681–690
Ferreira CSS, Ferreira AJD, Pato RL, Do Carmo Magalhaes M, De Olivera Coelho C, Santos C (2012)Rainfall–runoff–erosion relationships study for different land uses, in a sub-urban area. Zeitschrift furGeomorphologie 56:005–020
Nat Hazards
123
Author's personal copy

Garcia-Ruiz JM (2010) The effects of land uses on soil erosion in Spain. A review. Catena 81:1–11Graf WL (1977) The rate law in fluvial geomorphology. Am J Sci 277:178–191Gumbel EJ (1958) Statistics of extremes. Columbia University Press, New YorkHamed Y, Albergel J, Pepin Y, Asseline J, NaIs S, Zante P, Berndtsson R, El-Niazy M, Balah M (2002)
Comparison between rainfall simulator erosion and observed reservoir sedimentation in an erosion-sensitive semiarid catchment. Catena 50:1–16
Horton RE (1933) The role of infiltration in the hydrologic cycle. Trans Am Geophys Union 14:446–460Horton RE (1945) Erosional development of streams and their drainage basins: hydrophysical approach to
quantitative morphology. Bull Geol Soc Am 56:275–330Hotel de Ville de Kinshasa (2007) Programme du gouvernement provincial de Kinshasa 2007–2011, HVK,
inedit, 94pHudson NW (1971) Soil conservation. Batsford, LondonKikufi BA, Lukoki FL (2008) Etude floristique et ecologique des marais de Masina. Revue Congolaise des
Sciences Nucleaires 23:1–20Lambe TW, Whitman RV (1979) Soil mechanics, S.I. Version. Wiley, New YorkLasanta T, Garcia-Ruiz JM, Perez-Rontonne C, Sancho Marcen C (2000) Runoff and sediment yield in a
semi-arid environment: the effect of land management after farmland abandonment. Catena38:265–278
Laws JO (1941) Measurement of the fall velocity of waterdrops and raindrops. Trans Am Geophys Union22:709
Li XY, Contreras S, Sole-Benet A, Canton Y, Domingo Fr, Lazaro R, Lin H, Van Wesemael B, Puigde-fabregas J (2011) Controls of infiltration–runoff processes in Mediterranean karst rangelands in SE,Spain. Catena 86:98–109
Makanzu Imwangana F (2010) Etude de l’erosion ravinante a Kinshasa par teledetection et SIG entre 1957et 2007. Advanced master thesis, Faculty of Sciences, DSGE/ULg, 76p
Makanzu Imwangana F, Ozer P, Moeyersons J, Vandecasteele I, Trefois P, Ntombi M (2012) Kinshasa enproie a l’erosion en ravine: inventaire et impact socio-economique.’’Colloque international sur letheme : Geomatique et gestion des risques naturels en hommage au Professeur Andre OZER’’, 6–8mars 2012, UMP, Oujda, Maroc. Volume de resumes, p 27
Makanzu Imwangana F, Moeyersons J, Ntombi M (2013) Factors in the development of urban mega-gulliesin the high town of Kinshasa. In: 6th ISGE, IASI/Romania, Book of abstracts, p 27
Makanzu Imwangana F, Dewitte O, Ntombi M, Moeyersons J (2014a) Topographic and road control ofmega-gullies in Kinshasa (DR. Congo). Geomorphology 217:131–139
Makanzu Imwangana F, Vandecasteele I, Ozer P, Trefois P, Moeyersons J (2014b) The origin and control ofmega-gullies in Kinshasa (DR Congo). Catena 125:38–49
Martinez-Murillo JF, Nadal-Romero E, Regues D, Cerda A, Poesen J (2013) Soil erosion and hydrology ofthe western Mediterranean badlands throughout rainfall simulation experiments: a review. Catena106:101–112
Moeyersons J (1978) The behaviour of stones and stone implements buried in consolidating and creepingKalahari sands. Earth Surf Process Land 3:115–128
Moeyersons J (1989) La nature de l’erosion des versants au Rwanda. Annales des Sciences economiques,Musee royal de l’Afrique centrale (MRAC), Tervuren, Belgique, 19, 379p
Nadal-Romero E, Lansanta T, Garcia-Ruiz JM (2013) Runoff and sediment yield from land under varioususes in a Mediterranean mountain area: long-term results from an experimental station. Earth Surf ProcLand 38:346–355
Ntombi MK, Yina N, Kisangala M, Makanzu IMF (2004) Evolution des precipitations superieures ou egalesa 15 mm durant la periode 1972–2002 a Kinshasa. Revue Congolaise des Sciences Nucleaires20:30–40
Ntombi MK, Pangu S, Mukunayi N, Kisangala M, Ntombi MM, Makanzu F (2009) Les ressources en eau etles changements climatiques en cours en Republique Democratique du Congo. In: Endundo Jose,‘‘Seconde communication nationale a la Convention Cadre sur le Changement Climatique.’’ Ministrede l’Environnement, Conservation de la Nature et Tourisme de la RD.Congo. Kinshasa, november2009. Presentee a la Communaute internationale en reponse au Protocole de KYOTO
Pain M (1984) Kinshasa – la ville et la cite, etudes urbaines. ORSTOM/Paris, Memoires 105, 267pPeel MC, Finlayson BL, McMahon TA (2007) Updated World map of the Koppen–Geiger climate. Hydrol
Earth Syst Sci 11:1633–1644Poesen J, Nachtergaele J, Verstraeten G, Valentin C (2003) Gully erosion and environmental change:
importance and research needs. Catena 50:91–133Poulenard J, Podwojewski P, Janeau JL, Collinet (2001) Runoff and soil erosion under rainfall simulation of
Andisols from the Ecuadorian Paramo: effect of tillage and burning. Catena 45:185–207
Nat Hazards
123
Author's personal copy

Prosser IP, Dietrich WE (1995) Field experiments on erosion by overland flow and their implication for adigital terrain model of channel initiation. Water Resour Res 31(11):2867–2876
Prosser IP, Slade CJ (1994) Gully formation and the role of valley-floor vegetation, southeastern Australia.Geology 22:1127–1130
Reiss R-D, Thomas M (2007) Statistical analysis of extreme values, with application to insurance, finance,hydrology and other fields, vol 18, 3rd edn. Birkhauser, Basel
Rey F, Ballais J-L, Marre A, Rovera G (2004) Role de la vegetation dans la protection contre l’erosionhydrique de surface. Comptes Rendus Geosci 336:991–998
Romkens MJM, Helming K, Prasad SN (2001) Soil erosion under different rainfall intensities, surfaceroughness, and soil water regimes. Catena 46:103–203
Roth CH (2004) A framework relating soil surface condition to infiltration and sediment and nutrientmobilization in grazed rangelands of northeastern Queensland, Australia. Earth Surf Process Landf29:1093–1104
Smith RE (1972) The infiltration envelope: results from a theoretical infiltrometer. J Hydrol 17:1–21Tshibangu KWT, Engels P, Malaisse F (1997) Evolution du couvert vegetal dans la region de Kinshasa
(1960–1987) selon une approche cartographique. Geo-Eco-Trop 21:95–103Van Caillie X (1983) Hydrologie et erosion dans la region de Kinshasa : Analyse des interactions entre les
conditions du milieu, les erosions et le bilan hydrologique. These de doctorat, Dpt de GeografieGeologie, KUL, 554p
Yair A (2006) Runoff generation in a sandy area-the nizzana sands, Western Negev, Israel. Earth SurfProcess Land 15:597–609
Nat Hazards
123
Author's personal copy