Embed Size (px)
Citation preview
Tallinn 2005
Statistikaamet
Statistical Office of Estonia
SISSETULEK JA ELAMISTINGIMUSEDINCOME AND LIVING CONDITIONS
Kogumik käsitleb elanike aastasissetulekut, vaesust, elamistingimusi, tervist ja turvatunnet.
Koostanud Statistikaameti sotsiaalstatistika osakond (Mari Toomse, tel 625 9218; Anna Bileva, Piia-Piret Eomois, Elsa Leiten, Merle Paats, Marin Randoja). The yearbook provides data on the annual income, poverty, living conditions, health and feeling of security of population.
Compiled by the Social Statistics Department of the Statistical Office of Estonia (Mari Toomse, tel +372 625 9218; Anna Bileva, Piia-Piret Eomois, Elsa Leiten, Merle Paats, Marin Randoja).
Märkide seletus Explanation of symbols
( ) väheusaldusväärsed andmed (põhinevad valimi 20–39 isikul) unreliable data (based on 20–39 persons of the sample) ... andmed ei ole usaldusväärsed (põhinevad valimi vähem kui 20 isikul) extremely unreliable data (based on less than 20 persons of the sample) .. mõiste pole rakendatav category not applicable Kirjastanud Statistikaamet, Endla 15, 15174 Tallinn, analüüsi ja väljaannete talitus, telefon 625 9247 Toimetanud Sven Maanso Inglise keel: Elina Härsing Küljendus: Uku Nurges Trükkinud Ofset OÜ, Paldiski mnt 25, 10612 Tallinn November 2005 Published by the Statistical Office of Estonia, 15 Endla Str, 15174 Tallinn, Analysis and Publications Service, telephone +372 625 9247 Edited by Sven Maanso English by Elina Härsing Layout by Uku Nurges Printed by Ofset Ltd, 25 Paldiski Rd, 10612 Tallinn November 2005 ISBN 9985-74-347-4 © Statistikaamet, 2005 © Kaanefoto / Cover photograph: Bulls Press Käesoleva väljaande andmete kasutamisel või tsiteerimisel palume viidata allikale When using or quoting the data included in this issue, please indicate the source
SISSETULEK JA ELAMISTINGIMUSED SAATEKS
Income and Living Conditions Foreword
STATISTIKAAMET 3 Statistical Office of Estonia
Saateks
Viieteistkümne viimase aasta jooksul on Euroopa Liit lakanud olemast pelgalt majandusühendus ning omandanud aina enam sotsiaalset dimensiooni. Selle olulisim väljendus viimastel aastatel on olnud otsus rakendada avatud koordinatsioonimeetodit sotsiaalpoliitika valdkonnas ja seada ühised eesmärgid sotsiaalse tõrjutuse vähendamiseks. Selleks et jälgida, kui edukad on liikmesriigid nende üldiste eesmärkide täitmisel, on vaja ühtset alust ja ühtseid kriteeriume.
Suur samm ühtsele mõõdupuule lähemale oli sotsiaalse tõrjutuse statistiliste indikaatorite süsteemi loomine. See näitajate süsteem on tuntud Laekeni indikaatorite nime all. Et saada riikide vahel täielikult võrreldavaid näitajaid, ei piisa aga ainult nende arvutamise reeglites kokkuleppimisest: ka andmed, mida nende leidmiseks kasutatakse, peavad olema kogutud samadest põhimõtetest lähtudes. Kuni viimaste aastateni selline andmeallikas puudus ja liikmes- ning kandidaatriigid kasutasid oma andmeallikaid. 2003. aastal võeti vastu määrus, mis kehtestas ühtse sissetulekute ja elamistingimuste statistikasüsteemi (EU-SILC), mis kohustab kõiki liikmesriike koguma sotsiaalse tõrjutuse mõõtmiseks vajalikke andmeid samade põhimõtete alusel.
Eestis algasid tööd EU-SILC-i rakendamiseks juba 2001. aastal. Pärast põhjalikku testimist ja pilootuuringuid oli Statistikaamet 2004. aastal valmis algust tegema täiesti uue uuringuga, mis hakkas kandma Eesti sotsiaaluuringu nime. Oleme siin uute Euroopa Liidu liikmesriikide hulgas esirinnas, sest kõik ülejäänud 2004. aastal liitunud riigid alustasid uuringut aasta hiljem.
Statistikaameti ja kogu Eesti seisukohalt on sotsiaaluuring mitmes mõttes uudne ja eriline. Esiteks on see Statistikaametile esmakordne paneeluuringu kogemus. Statistikamõistena tähendab paneeluuring seda, et samu inimesi küsitletakse mitmel aastal järjest. See võimaldab leida isikutasandi muutust iseloomustavaid näitajaid, mis ei ole teistsuguste uuringute põhjal võimalik.
Teiseks kogutakse sotsiaaluuringuga esimest korda andmeid aastasissetuleku kohta. Seni leiti aastasissetulek leibkonna eelarve uuringust pärinevate kuusissetuleku andmete põhjal. Mõõdetud ühe kuu sissetulek ei pruugi olla leibkonna aastasissetuleku taseme suhtes esinduslik. Seetõttu on aastasissetulek rahvusvaheliselt enam kasutamist ja soovitamist leidnud eelkõige elatustaseme ja heaolu näitajate arvutamisel.
Sotsiaaluuringus ja leibkonna eelarve uuringus lähtutakse sissetuleku mõõtmisel paljuski erinevast metoodikast. Peale aasta- ja kuusissetuleku erinevuse on oluline silmas pidada erinevusi sissetuleku definitsioonis ehk selles, mida loetakse sissetulekuks ja mida mitte, uuringu disainis, tarbimiskaalude kasutamises, millest tuleb pikemalt juttu sissetuleku peatükis, jne. Leibkonna eelarve uuring on fokuseeritud eelkõige leibkonna kulutuste ja selle kaudu tarbimise mõõtmisele. Kulutusi ja leibkonna toimetulekut vaadatakse lähtudes kuusissetulekust, mis on vaadeldaval ajavahemikul kasutada olevaks ressursiks. Sotsiaaluuring ei mõõda lühiajalisi protsesse, vaid on keskendunud eelkõige sellistele pikaajalistele nähtustele nagu vaesus ja sotsiaalne tõrjutus. Sellest johtuvalt ei ole mõistlik erinevate uuringute sissetulekuid võrrelda. Tarbijal tuleb andmete kasutamisel lähtuda eesmärgist, mida soovitakse mõõta, ja sellest lähtuvalt kasutada kas kuu- või aastasissetulekut.
See kogumik märgib esimest sammu Statistikaameti üleminekul kuusissetuleku asemel aastasissetuleku kasutamisele. Meie motivatsioon on andmete võrreldavus teiste Euroopa Liidu riikidega ja soov rakendada rahvusvaheliselt aktsepteeritud põhimõtteid tootmaks täpset ja usaldusväärset statistikat. Selles kogumikus avaldame sotsiaaluuringu tulemusi esimest korda. Peale sissetuleku ja sellega seotud vaesuse leiavad käsitlemist mõnevõrra “kergemad”, kuid niisama huvitavad teemad, nagu Eesti elanike tervis, arstiabi kättesaadavus ja turvatunne.
Täname kõiki, kes on selle kogumiku ilmumisele kaasa aidanud, ja soovime lugejatele põnevaid hetki statistikamaailmas! Mari Toomse, juhtivstatistik

SISUKORD SISSETULEK JA ELAMISTINGIMUSED
Contents Income and Living Conditions
4 STATISTIKAAMET
Statistical Office of Estonia
Sisukord
Sissetulek. P.-P. Eomois......................................................................................................................... 7 Tuludetsiilid ja -kvintiilid ................................................................................................................. 7 Sissetuleku erinevused piirkonniti .................................................................................................... 9 Sissetulek leibkonna koosseisu järgi ................................................................................................ 11
Vaesus. P.-P. Eomois ............................................................................................................................. 14 Elamistingimused. M. Paats ................................................................................................................... 17 Rahva tervis. M. Toomse ....................................................................................................................... 22 Arstiabi kättesaadavus. M. Toomse ....................................................................................................... 27 Kuritegevus ja turvalisus. M. Toomse.................................................................................................... 30 Lastehoid ja huvitegevus. M. Paats........................................................................................................ 33 Tabelid
1. Aasta ekvivalentnetosissetulek kvintiili ja detsiili järgi, 2003...................................................... 55 2. Elanikkond kvintiilidesse kuulumise järgi, 2003.......................................................................... 56 3. Keskmine aasta ekvivalentnetosissetulek leibkonnapea soo järgi, 2003 ...................................... 58 4. Keskmine aasta ekvivalentnetosissetulek leibkonnapea haridustaseme järgi, 2003 ..................... 60 5. Keskmine aasta ekvivalentnetosissetulek piirkonna järgi, 2003................................................... 61 6. Aasta ekvivalentnetosissetulek peamise tuluallika järgi, 2003..................................................... 62 7. Leibkonna netosissetulek ja toimetulek, 2004 ............................................................................. 63 8. Erilise luksuseta elada võimaldav netokuusissetulek liikme kohta leibkonna hinnangul, 2004 ... 64 9. Vaesusriski määr pärast siirdeid piirkonna järgi, 2003................................................................. 65 10. Vaesusriski määr enne siirdeid (v.a pensionid) piirkonna järgi, 2003........................................ 65 11. Vaesusriski määr enne siirdeid (k.a pensionid) piirkonna järgi, 2003........................................ 65 12. Vaesusriski määr vanuserühma ja soo järgi, 2003...................................................................... 65 13. Vaesusriski määr sissetuleku viiteperioodi peamise hõiveseisundi ja soo järgi, 16-aastased ja vanemad, 2003.................................................................................................................................. 66 14. Vaesusriski määr eluruumi omandisuhte ja soo järgi, 2003 ....................................................... 66 15. Vaesussüvik vanuse ja soo järgi, 2003 ....................................................................................... 66 16. Vaesusriski määr hariduse ja soo järgi, 16-aastased ja vanemad, 2003...................................... 66 17. Vaesusriski määr leibkonnapea vanuse, soo, hariduse ja rahvuse järgi, 2003 ............................ 67 18. Allpool vaesusriski piiri elavad inimesed, 2003......................................................................... 67 19. Allpool vaesusriski piiri elavad inimesed vanuserühma ja soo järgi, 2003 ................................ 67 20. Allpool vaesusriski piiri elavad 16-aastased ja vanemad sissetuleku viiteperioodi peamise hõiveseisundi ja soo järgi, 2003 ....................................................................................................... 67 21. Elamistingimused ja tervis, 2004................................................................................................ 68 22. Elamistingimused ja pikaajaline krooniline haigus, 2004 .......................................................... 69 23. Elanike tervis peamiste sotsiaal-demograafiliste näitajate järgi, 2004 ....................................... 70 24. Pikaajalise (kroonilise) haiguse esinemine peamiste sotsiaal-demograafiliste näitajate järgi, 2004......................................................................................................................................... 71 25. Piiratud igapäevategevus terviseprobleemide tõttu peamiste sotsiaal-demograafiliste näitajate järgi, 2004......................................................................................................................................... 72 26. Perearsti abi kättesaadavus peamiste sotsiaal-demograafiliste näitajate järgi, 2004................... 73 27. Eriarsti abi kättesaadavus peamiste sotsiaal-demograafiliste näitajate järgi, 2004..................... 74 28. Hambaarsti abi kättesaadavus peamiste sotsiaal-demograafiliste näitajate järgi, 2004 .............. 75 29. Perearsti abi kättesaadavuse probleemide põhjused peamiste sotsiaal-demograafiliste näitajate järgi, 2004......................................................................................................................................... 76 30. Eriarsti abi kättesaadavuse probleemide põhjused peamiste sotsiaal-demograafiliste näitajate järgi, 2004......................................................................................................................................... 76 31. Hambaarsti abi kättesaadavuse probleemide põhjused peamiste sotsiaal-demograafiliste näitajate järgi, 2004 .......................................................................................................................... 77 32. Leibkonnaliikmete elamistingimused ja sissetulek, 2004 .......................................................... 77 33. Leibkonnaliikmete hügieenivõimalused ja sissetulek, 2004 ...................................................... 78 34. Leibkonnaliikmete eluruumiga seotud probleemid ja sissetulek, 2004 ...................................... 78 35. Leibkonna eluruumi kogukulu aastas, 2003 ............................................................................... 79 36. Leibkonna rahaliste võimaluste sõltuvus eluruumi kogukuludest, 2004 .................................... 80 37. 16-aastaste ja vanemate kokkupuuted kuritegevuse ja/või vägivallaga 12 viimase kuu jooksul, 2004 .................................................................................................................................... 81

SISSETULEK JA ELAMISTINGIMUSED SISUKORD
Income and Living Conditions Contents
STATISTIKAAMET 5
Statistical Office of Estonia
38. 16-aastaste ja vanemate hinnang turvalisusele tänavatel, 2004 .................................................. 82 39. 16-aastaste ja vanemate hinnang turvalisusele avalikes kohtades ja kodus, 2004 ...................... 83 40. 16-aastaste ja vanemate turvameetmete kasutamine, 2004......................................................... 84 41. 16-aastaste ja vanemate turvameetmed, 2004............................................................................. 85
Metoodika .............................................................................................................................................. 86 Mõisted .................................................................................................................................................. 93
Contents Income. P.-P. Eomois............................................................................................................................. 36
Income deciles and quintiles............................................................................................................. 36 Income differences by regions .......................................................................................................... 37 Income by structure of household..................................................................................................... 38
Poverty. P.-P. Eomois ............................................................................................................................ 40 Living conditions. M. Paats ................................................................................................................... 42 Population health. M. Toomse ............................................................................................................... 45 Access to health care. M. Toomse .......................................................................................................... 48 Crime and security. M. Toomse ............................................................................................................. 51 Childcare and children's attendance at hobby groups. M. Paats........................................................... 53 Tables
1. Equalised yearly disposable income by quintiles and deciles, 2003 ............................................ 55 2. Population by quintiles, 2003....................................................................................................... 56 3. Mean equalised yearly disposable income by gender of head of the household, 2003................. 58 4. Mean equalised yearly disposable income by level of education of head of the household, 2003.......................................................................................................................... 60 5. Mean equalised yearly disposable income by region, 2003 ......................................................... 61 6. Equalised yearly disposable income by main source of income, 2003 ......................................... 62 7. Household disposable income and subsistence, 2004 ................................................................. 63 8. Household’s assessment of monthly disposable income per household member needed to live without excessive luxury, 2004 ......................................................................................................... 64 9. At-risk-of-poverty rate after transfers by region, 2003 ................................................................ 65 10. At-risk-of-poverty rate before transfers (excl. pensions) by region, 2003.................................. 65 11. At-risk-of-poverty rate before transfers (incl. pensions) by region, 2003 .................................. 65 12. At-risk-of-poverty rate by age group and gender, 2003 ............................................................. 65 13. At-risk-of-poverty rate by main labour status during income reference period and by gender, people aged 16 and older, 2003...................................................................................... 66 14. At-risk-of-poverty rate by tenure status of the dwelling and by gender, 2003............................ 66 15. Relative median at-risk-of-poverty gap by age and gender, 2003.............................................. 66 16. At-risk-of-poverty rate by education and gender, population aged 16 and older, 2003............. 66 17. At-risk-of-poverty rate by age, gender, education and ethnic nationality of head of the household, 2003.......................................................................................................................... 67 18. People living below the at-risk-of-poverty threshold, 2003........................................................ 67 19. People living below the at-risk-of-poverty threshold by age group and gender, 2003............... 67 20. People aged 16 and older living below at-risk-of-poverty threshold by main labour status during income reference period and by gender, 2003...................................................................... 67 21. Living conditions and general assessment of health, 2004......................................................... 68 22. Living conditions and long-term (chronic) illness, 2004............................................................ 69 23. State of health of population by main social-demographic characteristics, 2004 ..................... 70 24. Occurrence of long-term (chronic) illness by main social-demographic characteristics, 2004 71 25. Limitations of everyday activities due to health problems by main social-demographic characteristics, 2004 ....................................................................................................................... 72 26. Accessibility of help or consultation of general practitioner by main social-demographic characteristics, 2004 ....................................................................................................................... 73 27. Accessibility of help or consultation of specialised doctor by main social-demographic characteristics, 2004 ........................................................................................................................ 74

SISUKORD SISSETULEK JA ELAMISTINGIMUSED
Contents Income and Living Conditions
6 STATISTIKAAMET
Statistical Office of Estonia
28. Accessibility of help or consultation of dentist by main social-demographic characteristics, 2004 ....................................................................................................................... 75 29. Reasons of problems with access to general practitioner by main social-demographic characteristics, 2004 ........................................................................................................................ 76 30. Reasons of problems with access to specialised doctor by main social-demographic characteristics, 2004 ....................................................................................................................... 76 31. Reasons of problems with access to dentist by main social-demographic characteristics, 2004 ........................................................................................................................ 77 32. Living conditions and income of household members, 2004 ..................................................... 77 33. Possibilities of hygiene and income of household members, 2004 ............................................ 78 34. Problems of household members concerning the dwelling and income, 2004 ........................... 78 35. Total yearly housing cost, 2003.................................................................................................. 79 36. The dependence of financial possibilities on total housing cost, 2004 ....................................... 80 37. Persons aged 16 or over by experiences with crime and/or violence in the last 12 months, 2004................................................................................................................................ 81 38. Persons aged 16 or over by assessment to the safety on the streets, 2004 ................................. 82 39. Persons aged 16 or over by assessment to the safety in public places and at home, 2004......... 83 40. Persons aged 16 or over by usage of the security measures, 2004............................................. 84 41. Persons aged 16 or over by the security measures of inhabitants, 2004.................................... 85
Methodology............................................................................................................................................. 95 Definitions................................................................................................................................................103
SISSETULEK JA ELAMISTINGIMUSED SISSETULEK
Income and Living Conditions Income
STATISTIKAAMET 7 Statistical Office of Estonia
SISSETULEK
Sissetulek selle kogumiku tähenduses hõlmab tulu palgatööst, ettevõtlusest, maa ja muu vara rendist, teistelt leibkondadelt saadud regulaarseid makseid (näiteks elatis) ning sotsiaalseid siirdeid (vanaduspension, lapsetoetus jm), omanditulu ja tulumaksu tagastust. Saadud summast arvatakse maha tulumaksu juurdemaksed, teistele leibkondadele tehtud regulaarsed maksed ning varalt makstav maks (peamiselt maamaks). Kasutatud on aasta netosissetulekut, mis tähendab, et tulust on varem maha arvatud tulumaks, sotsiaalmaks jm maksud. Leibkonnaliikmete sissetulek liidetakse, et leida leibkonna kogu sissetulek, mis seejärel suhestatakse leibkonna liikmete arvu.
Keskmise sissetuleku saamiseks leibkonna liikme kohta tuleb võtta arvesse, et osa sissetulekust kulutatakse kogu leibkonna peale, osa aga kulutatakse iga leibkonnaliikme peale eraldi sõltuvalt tema vanusest. Näiteks tähendab see, et ühe kaheliikmelise leibkonna kulutused kokku on väiksemad, kui nende samade liikmete kulutuste summa juhul, kui mõlemad isikud elaksid üksinda, sest neil on võimalik mitmeid kaupu ühiselt tarbida (näiteks auto, mööbel, kodumasinad) ning kuna mitmed kaubad on suuremas koguses ostes odavamad. Leibkondade sellise “säästuefektiga” arvestamiseks tuleb leibkonnaliikme sissetuleku leidmisel kasutada tarbimis- ehk ekvivalentsuskaale. Sissetuleku all mõeldakse niisiis ekvivalentsissetulekut, mis on defineeritud kui leibkonna kogu netosissetuleku ja tema ekvivalentsuuruse jagatis. Leibkonna ekvivalentsuurus annab igale leibkonnaliikmele kaalu vastavalt tema vanusele. Selles kogumikus on kasutatud Eurostati ametlikult soovitatud modifitseeritud OECD-tarbimiskaale, mis annavad esimesele täiskasvanud liikmele kaalu 1,0, igale järgmisele täiskasvanud liikmele 0,5 ning kõigile 13-aastastele ja noorematele lastele 0,3. Näiteks kahe täiskasvanu ja kahe lapsega leibkonna ekvivalentsuurus on 1+0,5+0,3+0,3=2,1. Oletame, et selle leibkonna netosissetulek on aastas 120 000 krooni. Kui leibkonna “säästuefekti” mitte eeldada ja jagada sissetulek liikmete arvuga (ehk teisisõnu kasutada tarbimiskaale 1:1:1), on selle leibkonna iga liikme aasta sissetulekuks 30 000 krooni. Kui aga kasutada tarbimiskaale, on tarbimisühiku sissetulek (120 000 / 2,1) 57 143 krooni.
Sellise võrdsustatud leibkonna mudeli kasutamine vähendab leibkondade koosseisu erinevuste mõju leibkonna vaesuse määramisel. Kogu järgnevas tekstis on sissetulekust rääkides peetud silmas ekvivalentsissetulekut.
Leibkonna keskmine aastasissetulek oli 2003. aastal 49 820 krooni tarbimisühiku kohta. Sissetuleku mediaan oli 35 419 krooni.
Tuludetsiilid ja -kvintiilid
Sissetuleku jaotumist ühiskonnas peegeldavad tuludetsiilid ja -kvintiilid. Nende leidmiseks jagatakse tarbimisühiku kohta teenitud keskmine sissetulek kümneks või viieks võrdseks osaks, mida nimetakse vastavalt detsiilideks või kvintiilideks. Esimene detsiil hõlmab inimesi ühe kümnendiku väikseima sissetulekuga ning viimane detsiil kümnendiku kõrgeima sissetulekuga. Sarnaselt hõlmab esimene kvintiil viiendikku madalaima sissetulekuga inimesi ja viimane viiendiku kõigist nendest leibkonnaliikmetest, kelle sissetulek on suurim. Aastal 2003 oli keskmine ekvivalentsissetulek kõrgeimas detsiilis 162 426 krooni ja madalaimas 7005 krooni aastas. Kümnendasse detsiili kuuluvate inimeste sissetulek hõlmas kõikide inimeste kogusissetulekust 32%, mis on peaaegu sama, kui esimesse kuude detsiili kuuluvate inimeste sissetulek kokku (31%).
Ekvivalentsissetulek

SISSETULEK SISSETULEK JA ELAMISTINGIMUSED
Income Income and Living Conditions
8 STATISTIKAAMET
Statistical Office of Estonia
Keskmine ekvivalentnetosissetulek detsiili järgi, 2003 Average equalised disposable income by decile, 2003
I II III IV V VI VII VIII IX X0
20 000
40 000
60 000
80 000
100 000
120 000
140 000
160 000
180 000
KrooniKroons
DetsiilDecile
Kuna detsiilipõhine analüüs toob esile ka ebatüüpiliselt madala ja ebatüüpiliselt kõrge sissetuleku, on mõistlik kasutada kvintiilipõhist jaotust, vähendamaks juhuslikku viga hinnangutes. 2003. aastal oli aasta keskmine ekvivalentsissetulek madalaimas kvintiilis 13 084 ja kõrgemais kvintiilis 121 905 krooni.
Keskmine ekvivalentnetosissetulek kvintiili järgi, 2003 Average equalised disposable income by quintile, 2003
0
20 000
40 000
60 000
80 000
100 000
120 000
140 000
KrooniKroons
Madalaim kvintiilThe lowestquintile
Teine kvintiilThe secondquintile
Kõrgeim kvintiilThe highestquintile
Kolmas kvintiilThe thirdquintile
Neljas kvintiilThe fourthquintile
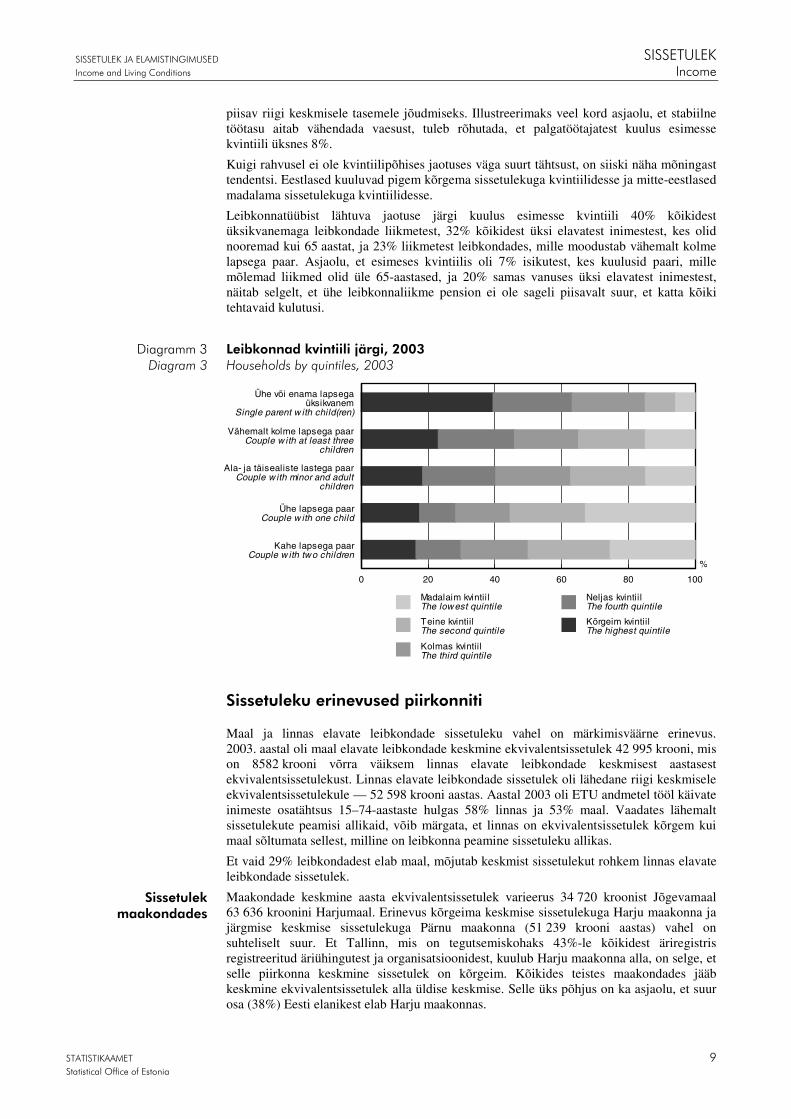
Vaesuse põhjuste mõistmiseks on oluline uurida esimesse kvintiili kuuluvate inimeste tausta. Pisut enam kui pool madalaimat keskmist ekvivalentsissetulekut saavatest inimestest (51%) elas linnas, peamiselt Lõuna-Eestis. Madalaima sissetulekuga inimeste osatähtsus oli suur ka Kirde-Eestis (26%). Kõige väiksem esimesse kvintiili kuuluvate inimeste osatähtsus oli Põhja-Eestis. Seda saab seletada asjaoluga, et aastal 2003 oli palgastatistika andmetel keskmine palk kõrgeim Põhja-Eestis ja Tallinnas. Et palgatööst saadavat sissetulekut peetakse üheks põhilisimaks vaesusest pääsemise viisiks, tuleks arvestada sedagi, et tööjõus osalemise määr oli Eesti tööjõu-uuringu (ETU) andmetel Põhja-Eestis kõrgeim.
Samuti on oluline, et rohkem kui pool (51%) töötutest kuulus madalaima ekvivalentsissetulekuga kvintiili. Ka suur osa ettevõtjatest (38%) ja majanduslikult mitteaktiivsetest inimestest (30%) kuulus esimesse kvintiili. Peale nende kuulus esimesse kvintiili 17% pensionäridest. Asjaolu, et vanaduspensionil olijad kuuluvad pigem teise (36%) ja kolmandasse (28%) kvintiili, viitab sellele, et pensionide keskmine suurus välistab enamasti küll kõige madalama sissetulekuga isikute hulka langemise, kuid ei ole ometi
Diagramm 1 Diagram 1
Diagramm 2 Diagram 2
Rahvastikurühmade kvintiilidesse
jaotumine
SISSETULEK JA ELAMISTINGIMUSED SISSETULEK
Income and Living Conditions Income
STATISTIKAAMET 9 Statistical Office of Estonia
piisav riigi keskmisele tasemele jõudmiseks. Illustreerimaks veel kord asjaolu, et stabiilne töötasu aitab vähendada vaesust, tuleb rõhutada, et palgatöötajatest kuulus esimesse kvintiili üksnes 8%.
Kuigi rahvusel ei ole kvintiilipõhises jaotuses väga suurt tähtsust, on siiski näha mõningast tendentsi. Eestlased kuuluvad pigem kõrgema sissetulekuga kvintiilidesse ja mitte-eestlased madalama sissetulekuga kvintiilidesse.
Leibkonnatüübist lähtuva jaotuse järgi kuulus esimesse kvintiili 40% kõikidest üksikvanemaga leibkondade liikmetest, 32% kõikidest üksi elavatest inimestest, kes olid nooremad kui 65 aastat, ja 23% liikmetest leibkondades, mille moodustab vähemalt kolme lapsega paar. Asjaolu, et esimeses kvintiilis oli 7% isikutest, kes kuulusid paari, mille mõlemad liikmed olid üle 65-aastased, ja 20% samas vanuses üksi elavatest inimestest, näitab selgelt, et ühe leibkonnaliikme pension ei ole sageli piisavalt suur, et katta kõiki tehtavaid kulutusi.
Leibkonnad kvintiili järgi, 2003 Households by quintiles, 2003
0 20 40 60 80 100
%
Ühe lapsega paarCouple w ith one child
Kahe lapsega paarCouple w ith two children
Ala- ja täisealiste lastega paarCouple w ith minor and adult
children
Ühe või enama lapsegaüksikvanem
Single parent w ith child(ren)
Vähemalt kolme lapsega paarCouple w ith at least three
children
Kõrgeim kvintiilThe highest quintile
Madalaim kvintii lThe lowest quintile
Teine kvintiilThe second quintile
Kolmas kvintii lThe third quintile
Neljas kvintii lThe fourth quintile
Sissetuleku erinevused piirkonniti
Maal ja linnas elavate leibkondade sissetuleku vahel on märkimisväärne erinevus. 2003. aastal oli maal elavate leibkondade keskmine ekvivalentsissetulek 42 995 krooni, mis on 8582 krooni võrra väiksem linnas elavate leibkondade keskmisest aastasest ekvivalentsissetulekust. Linnas elavate leibkondade sissetulek oli lähedane riigi keskmisele ekvivalentsissetulekule — 52 598 krooni aastas. Aastal 2003 oli ETU andmetel tööl käivate inimeste osatähtsus 15–74-aastaste hulgas 58% linnas ja 53% maal. Vaadates lähemalt sissetulekute peamisi allikaid, võib märgata, et linnas on ekvivalentsissetulek kõrgem kui maal sõltumata sellest, milline on leibkonna peamine sissetuleku allikas.
Et vaid 29% leibkondadest elab maal, mõjutab keskmist sissetulekut rohkem linnas elavate leibkondade sissetulek.
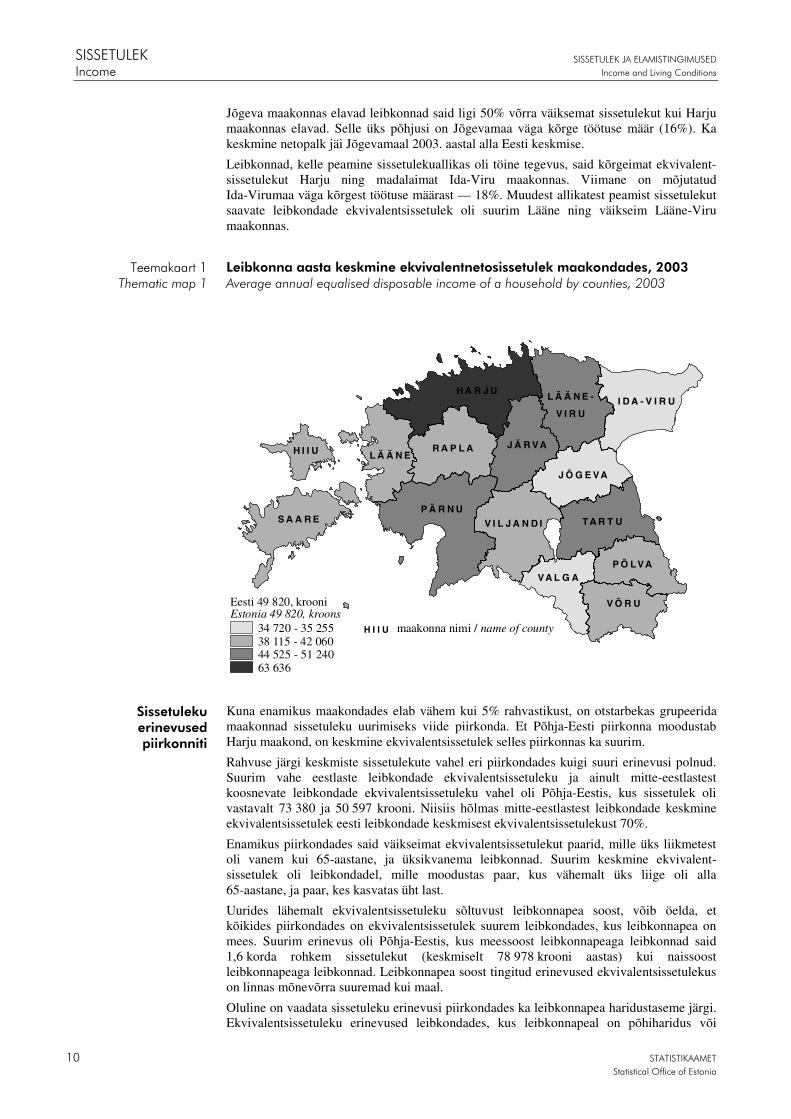
Maakondade keskmine aasta ekvivalentsissetulek varieerus 34 720 kroonist Jõgevamaal 63 636 kroonini Harjumaal. Erinevus kõrgeima keskmise sissetulekuga Harju maakonna ja järgmise keskmise sissetulekuga Pärnu maakonna (51 239 krooni aastas) vahel on suhteliselt suur. Et Tallinn, mis on tegutsemiskohaks 43%-le kõikidest äriregistris registreeritud äriühingutest ja organisatsioonidest, kuulub Harju maakonna alla, on selge, et selle piirkonna keskmine sissetulek on kõrgeim. Kõikides teistes maakondades jääb keskmine ekvivalentsissetulek alla üldise keskmise. Selle üks põhjus on ka asjaolu, et suur osa (38%) Eesti elanikest elab Harju maakonnas.
Diagramm 3 Diagram 3
Sissetulek maakondades
SISSETULEK SISSETULEK JA ELAMISTINGIMUSED
Income Income and Living Conditions
10 STATISTIKAAMET
Statistical Office of Estonia
Jõgeva maakonnas elavad leibkonnad said ligi 50% võrra väiksemat sissetulekut kui Harju maakonnas elavad. Selle üks põhjusi on Jõgevamaa väga kõrge töötuse määr (16%). Ka keskmine netopalk jäi Jõgevamaal 2003. aastal alla Eesti keskmise.
Leibkonnad, kelle peamine sissetulekuallikas oli töine tegevus, said kõrgeimat ekvivalent-sissetulekut Harju ning madalaimat Ida-Viru maakonnas. Viimane on mõjutatud Ida-Virumaa väga kõrgest töötuse määrast — 18%. Muudest allikatest peamist sissetulekut saavate leibkondade ekvivalentsissetulek oli suurim Lääne ning väikseim Lääne-Viru maakonnas.
Leibkonna aasta keskmine ekvivalentnetosissetulek maakondades, 2003 Average annual equalised disposable income of a household by counties, 2003
P Ä R N U
H A R J U
TA R T U
R A P L A
V I L J A N D IS A A R E
I D A - V I R U
J Ä R VA
V Õ R U
J Õ G E VA
P Õ LVAVA L G A
L Ä Ä N E -
V I R U
L Ä Ä N EH I I U
34 720 - 35 255 38 115 - 42 060
Eesti 49 820, krooniEstonia 49 820, kroons
44 525 - 51 24063 636
H I I U maakonna nimi / name of county
Kuna enamikus maakondades elab vähem kui 5% rahvastikust, on otstarbekas grupeerida maakonnad sissetuleku uurimiseks viide piirkonda. Et Põhja-Eesti piirkonna moodustab Harju maakond, on keskmine ekvivalentsissetulek selles piirkonnas ka suurim.
Rahvuse järgi keskmiste sissetulekute vahel eri piirkondades kuigi suuri erinevusi polnud. Suurim vahe eestlaste leibkondade ekvivalentsissetuleku ja ainult mitte-eestlastest koosnevate leibkondade ekvivalentsissetuleku vahel oli Põhja-Eestis, kus sissetulek oli vastavalt 73 380 ja 50 597 krooni. Niisiis hõlmas mitte-eestlastest leibkondade keskmine ekvivalentsissetulek eesti leibkondade keskmisest ekvivalentsissetulekust 70%.
Enamikus piirkondades said väikseimat ekvivalentsissetulekut paarid, mille üks liikmetest oli vanem kui 65-aastane, ja üksikvanema leibkonnad. Suurim keskmine ekvivalent-sissetulek oli leibkondadel, mille moodustas paar, kus vähemalt üks liige oli alla 65-aastane, ja paar, kes kasvatas üht last.
Uurides lähemalt ekvivalentsissetuleku sõltuvust leibkonnapea soost, võib öelda, et kõikides piirkondades on ekvivalentsissetulek suurem leibkondades, kus leibkonnapea on mees. Suurim erinevus oli Põhja-Eestis, kus meessoost leibkonnapeaga leibkonnad said 1,6 korda rohkem sissetulekut (keskmiselt 78 978 krooni aastas) kui naissoost leibkonnapeaga leibkonnad. Leibkonnapea soost tingitud erinevused ekvivalentsissetulekus on linnas mõnevõrra suuremad kui maal.
Oluline on vaadata sissetuleku erinevusi piirkondades ka leibkonnapea haridustaseme järgi. Ekvivalentsissetuleku erinevused leibkondades, kus leibkonnapeal on põhiharidus või
Teemakaart 1 Thematic map 1
Sissetuleku erinevused piirkonniti
SISSETULEK JA ELAMISTINGIMUSED SISSETULEK
Income and Living Conditions Income
STATISTIKAAMET 11 Statistical Office of Estonia
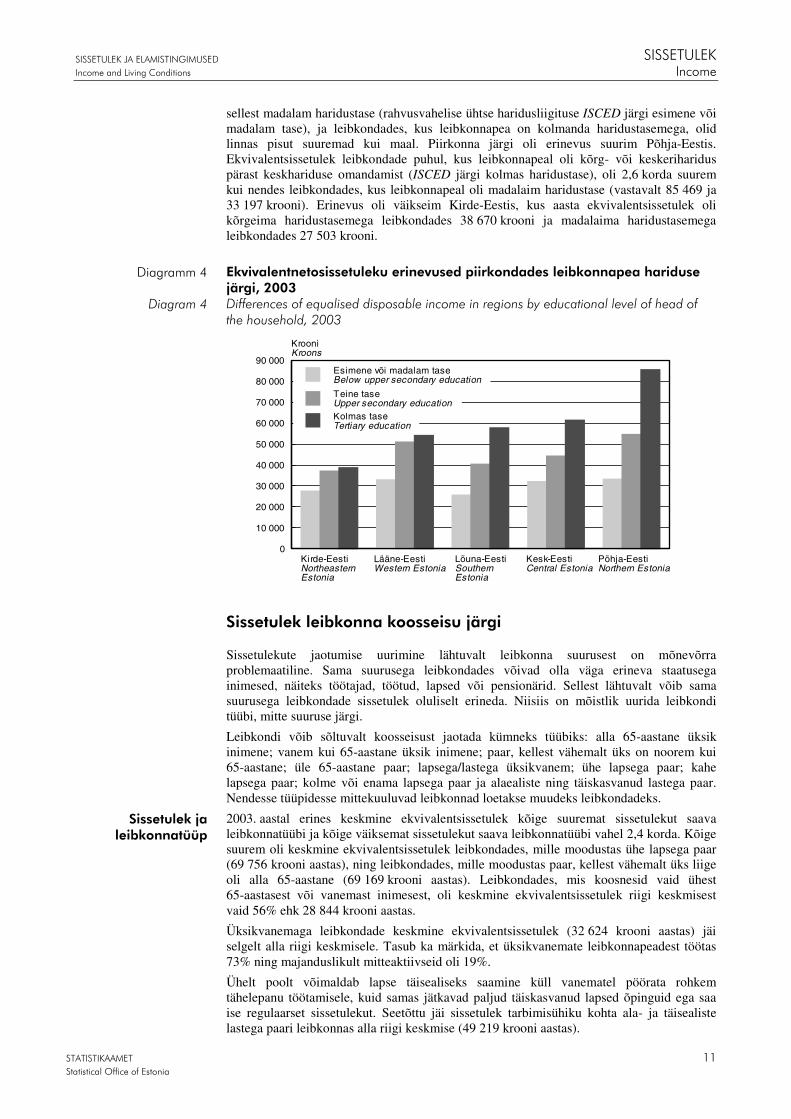
sellest madalam haridustase (rahvusvahelise ühtse haridusliigituse ISCED järgi esimene või madalam tase), ja leibkondades, kus leibkonnapea on kolmanda haridustasemega, olid linnas pisut suuremad kui maal. Piirkonna järgi oli erinevus suurim Põhja-Eestis. Ekvivalentsissetulek leibkondade puhul, kus leibkonnapeal oli kõrg- või keskeriharidus pärast keskhariduse omandamist (ISCED järgi kolmas haridustase), oli 2,6 korda suurem kui nendes leibkondades, kus leibkonnapeal oli madalaim haridustase (vastavalt 85 469 ja 33 197 krooni). Erinevus oli väikseim Kirde-Eestis, kus aasta ekvivalentsissetulek oli kõrgeima haridustasemega leibkondades 38 670 krooni ja madalaima haridustasemega leibkondades 27 503 krooni.
Ekvivalentnetosissetuleku erinevused piirkondades leibkonnapea hariduse järgi, 2003 Differences of equalised disposable income in regions by educational level of head of the household, 2003
Põhja-EestiNorthern Estonia
Kesk-EestiCentral Estonia
Lõuna-EestiSouthernEstonia
Kirde-EestiNortheasternEstonia
Lääne-EestiWestern Estonia
KrooniKroons
0
10 000
20 000
30 000
40 000
50 000
60 000
70 000
80 000
90 000Esimene või madalam taseBelow upper secondary education
Kolmas taseTertiary education
Teine taseUpper secondary education
Sissetulek leibkonna koosseisu järgi
Sissetulekute jaotumise uurimine lähtuvalt leibkonna suurusest on mõnevõrra problemaatiline. Sama suurusega leibkondades võivad olla väga erineva staatusega inimesed, näiteks töötajad, töötud, lapsed või pensionärid. Sellest lähtuvalt võib sama suurusega leibkondade sissetulek oluliselt erineda. Niisiis on mõistlik uurida leibkondi tüübi, mitte suuruse järgi.
Leibkondi võib sõltuvalt koosseisust jaotada kümneks tüübiks: alla 65-aastane üksik inimene; vanem kui 65-aastane üksik inimene; paar, kellest vähemalt üks on noorem kui 65-aastane; üle 65-aastane paar; lapsega/lastega üksikvanem; ühe lapsega paar; kahe lapsega paar; kolme või enama lapsega paar ja alaealiste ning täiskasvanud lastega paar. Nendesse tüüpidesse mittekuuluvad leibkonnad loetakse muudeks leibkondadeks.
2003. aastal erines keskmine ekvivalentsissetulek kõige suuremat sissetulekut saava leibkonnatüübi ja kõige väiksemat sissetulekut saava leibkonnatüübi vahel 2,4 korda. Kõige suurem oli keskmine ekvivalentsissetulek leibkondades, mille moodustas ühe lapsega paar (69 756 krooni aastas), ning leibkondades, mille moodustas paar, kellest vähemalt üks liige oli alla 65-aastane (69 169 krooni aastas). Leibkondades, mis koosnesid vaid ühest 65-aastasest või vanemast inimesest, oli keskmine ekvivalentsissetulek riigi keskmisest vaid 56% ehk 28 844 krooni aastas.
Üksikvanemaga leibkondade keskmine ekvivalentsissetulek (32 624 krooni aastas) jäi selgelt alla riigi keskmisele. Tasub ka märkida, et üksikvanemate leibkonnapeadest töötas 73% ning majanduslikult mitteaktiivseid oli 19%.
Ühelt poolt võimaldab lapse täisealiseks saamine küll vanematel pöörata rohkem tähelepanu töötamisele, kuid samas jätkavad paljud täiskasvanud lapsed õpinguid ega saa ise regulaarset sissetulekut. Seetõttu jäi sissetulek tarbimisühiku kohta ala- ja täisealiste lastega paari leibkonnas alla riigi keskmise (49 219 krooni aastas).
Diagramm 4
Diagram 4
Sissetulek ja leibkonnatüüp

SISSETULEK SISSETULEK JA ELAMISTINGIMUSED
Income Income and Living Conditions
12 STATISTIKAAMET
Statistical Office of Estonia
Leibkondades, kus on alaealiste lastega paar, langeb keskmine sissetulek tarbimisühiku kohta laste arvu suurenedes. Ühe lapsega paari leibkondades oli keskmine ekvivalentsissetulek 1,4 korda suurem kui riigi keskmine. Kahe alaealise lapsega paari leibkondade keskmine sissetulek (53 726 krooni inimese kohta) oli vaid veidi üle riigi keskmise. Kolme või enama lapsega paari leibkondade keskmine ekvivalentsissetulek (44 560 krooni inimese kohta) oli juba selgelt alla riigi keskmise. Leibkondade jaotuse uurimine näitab, et kolme või enama lapsega paari leibkondi oli vaid 2,2% leibkondade koguarvust, ühe ja kahe lapsega paari leibkondi oli vastavalt 8,7% ja 6,2%.
Võrreldes ühe liikmega leibkondi, on näha, et ühest alla 65-aastasest inimesest koosnevad leibkonnad teenisid keskmiselt 53 853 krooni aastas, mis oli 1,9 korda suurem kui 65-aas-tasest või vanemast inimesest koosneva leibkonna keskmine sissetulek. On selge, et viimastest enamik on pensionärid, aga tuleks ära märkida, et kuigi üksi elavate alla 65-aastaste hulgas oli 55% töötajaid, oli nende hulgas ka 10% töötuid ja 24% pensionäre. Samasugune sissetulekute tendents tuleb välja ka võrreldes leibkondi, mis koosnevad paarist, kellest üks on noorem kui 65 aastat, ning paarist, kus mõlemad liikmed on üle 65-aastased.
Et sissetuleku all on mõeldud ekvivalentsissetulekut, hõlmab leibkonna ühiskulude osatähtsus sissetulekus inimese kohta ühe liikmega leibkondades suurema osa kui kahe liikmega leibkondades. Niisiis on selge, et leibkonnaliikmete saadud sama suure sissetuleku puhul on kahe liikmega leibkonna sissetulek tarbimisühiku kohta suurem kui ühe liikmega leibkonnal.
Keskmine ekvivalentnetosissetulek leibkonnatüübi järgi, 2003 Average equalised disposable income by type of the household, 2003
0 10 000 20 000 30 000 40 000 50 000 60 000 70 000 80 000
Ühe lapsega paarCouple w ith one child
Paar, kellest vähemalt üksalla 65-aastane
Couple in which at least onepartner is aged under 65
Üksik alla 65-aastaneSingle person aged under 65
Vähemalt kahe lapsega paarCouple w ith at least two children
Ala- ja täisealiste lastega paarCouple w ith minor and adult children
Paar, kellest vähemalt üksüle 65-aastane
Couple in which at leastone partner is aged over 65
Ühe või enama lapsega üksikvanemSingle parent w ith child(ren)
Üksik 65-aastane või vanemSingle person aged over 65
MuuOther Krooni
Kroons
Uurides sissetulekut erinevates leibkonnatüüpides leibkonnapea haridustaseme järgi, on näha, et põhihariduse või madalama haridusega leibkonnapeaga leibkondades keskmine sissetulek tarbimisühiku kohta leibkonnatüübiti palju ei erine, püsides umbes 25 000 krooni ringis aastas. Kahest täiskasvanust koosnevates leibkondades on ekvivalentsissetulek siiski selgelt kõrgem, ulatudes 35 000 kroonini.
Põhiharidusest kõrgema haridusega leibkonnapeaga leibkondade sissetulek erineb leibkonnatüüpide vahel selgemalt. Nii esimese kui ka teise haridustasemega leibkonnapea leibkondade hulgast on kõige suurem keskmine ekvivalentsissetulek leibkondades, mis koosnevad paarist, kus vähemalt üks liige on noorem kui 65 aastat, või ühe lapsega paarist. Väikseim ekvivalentsissetulek on üksi elaval inimesel, kes on vanem kui 65 aastat (teise haridustaseme puhul 30 011 krooni ja kolmanda taseme puhul 35 456 krooni aastas). Ühest üle 64-aastasest põhihariduse või madalama haridusega isikust koosneva leibkonna keskmine sissetulek on 25 124 krooni. Sellest lähtuvalt võib öelda, et pensionil oleva inimese haridustase ei mõjuta sissetulekut kuigivõrd.
Diagramm 5 Diagram 5
Sissetulek ja leibkonnapea
haridus
SISSETULEK JA ELAMISTINGIMUSED SISSETULEK
Income and Living Conditions Income
STATISTIKAAMET 13 Statistical Office of Estonia
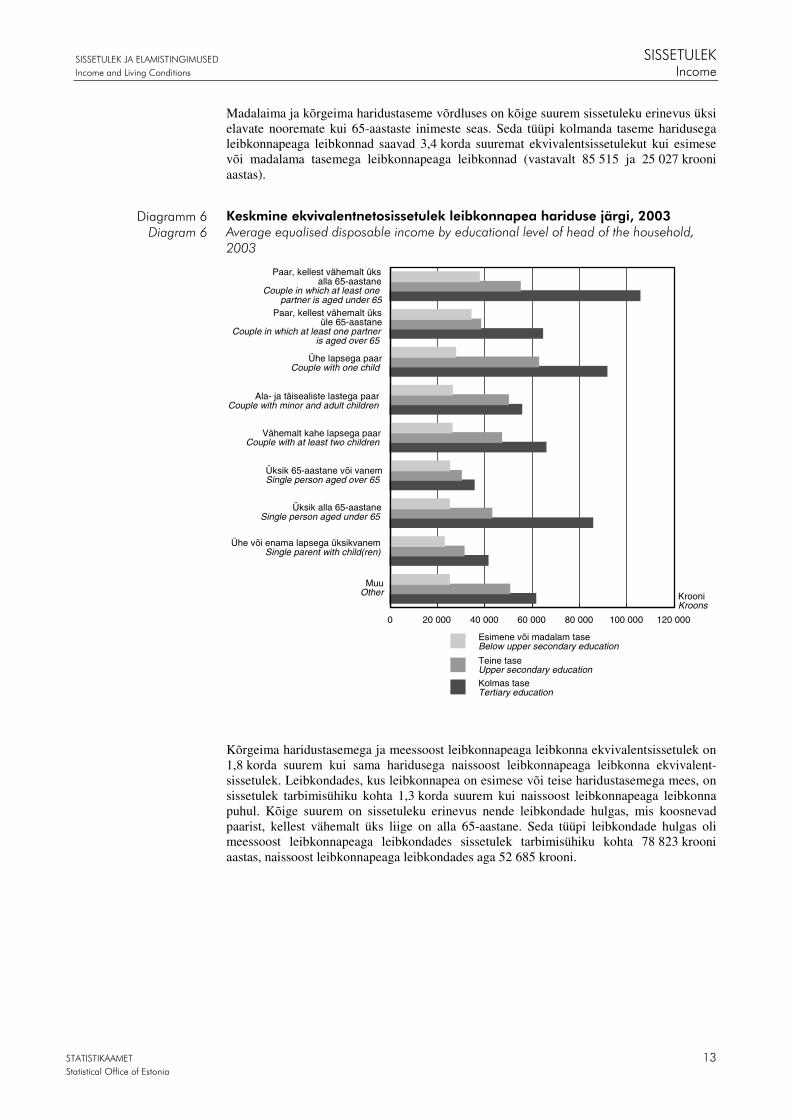
Madalaima ja kõrgeima haridustaseme võrdluses on kõige suurem sissetuleku erinevus üksi elavate nooremate kui 65-aastaste inimeste seas. Seda tüüpi kolmanda taseme haridusega leibkonnapeaga leibkonnad saavad 3,4 korda suuremat ekvivalentsissetulekut kui esimese või madalama tasemega leibkonnapeaga leibkonnad (vastavalt 85 515 ja 25 027 krooni aastas).
Keskmine ekvivalentnetosissetulek leibkonnapea hariduse järgi, 2003 Average equalised disposable income by educational level of head of the household, 2003
0 20 000 40 000 60 000 80 000 100 000 120 000
KrooniKroons
Ühe lapsega paarCouple with one child
Paar, kellest vähemalt üksalla 65-aastane
Couple in which at least onepartner is aged under 65
Üksik alla 65-aastaneSingle person aged under 65
Vähemalt kahe lapsega paarCouple with at least two children
Ala- ja täisealiste lastega paarCouple with minor and adult children
Paar, kellest vähemalt üksüle 65-aastane
Couple in which at least one partneris aged over 65
Ühe või enama lapsega üksikvanemSingle parent with child(ren)
Üksik 65-aastane või vanemSingle person aged over 65
MuuOther
Esimene või madalam tase Below upper secondary education
Kolmas taseTertiary education
Teine taseUpper secondary education
Kõrgeima haridustasemega ja meessoost leibkonnapeaga leibkonna ekvivalentsissetulek on 1,8 korda suurem kui sama haridusega naissoost leibkonnapeaga leibkonna ekvivalent-sissetulek. Leibkondades, kus leibkonnapea on esimese või teise haridustasemega mees, on sissetulek tarbimisühiku kohta 1,3 korda suurem kui naissoost leibkonnapeaga leibkonna puhul. Kõige suurem on sissetuleku erinevus nende leibkondade hulgas, mis koosnevad paarist, kellest vähemalt üks liige on alla 65-aastane. Seda tüüpi leibkondade hulgas oli meessoost leibkonnapeaga leibkondades sissetulek tarbimisühiku kohta 78 823 krooni aastas, naissoost leibkonnapeaga leibkondades aga 52 685 krooni.
Diagramm 6 Diagram 6
VAESUS SISSETULEK JA ELAMISTINGIMUSED
Poverty Income and Living Conditions
14 STATISTIKAAMET
Statistical Office of Estonia
VAESUS
Vaesust võib defineerida kui võimetust saavutada elementaarne elatustase ebapiisavate aineliste ressursside tõttu. Vaesust mõõdetakse sissetuleku jaotuse põhjal ilma igasuguste seosteta muude vaesust mõjutavate teguritega, nagu haridus, kulutused jms.
Euroopas kõige enam kasutatud ja Eurostati soovitatud metoodika põhjal nimetatakse vaeseks neid inimesi, kelle ekvivalentsissetulek jääb alla 60% riigi mediaansissetulekust. Seda piiri nimetatakse vaesusriski piiriks.
Eestis oli 2003. aastal vaesusriski piir 23 303 krooni. See tähendab, et inimesed, kelle aasta ekvivalentsissetulek oli väiksem kui 23 303 krooni, loeti vaeste hulka kuuluvaks. 2003. aastal pidi 22% Eesti elanikest toime tulema mediaansissetulekust madalama sissetulekuga.
Peamiste vaesust süvendavate põhjuste väljaselgitamiseks ja sotsiaaltoetuste poliitika parandamiseks on oluline uurida vaesusriskis elavate inimeste tausta.
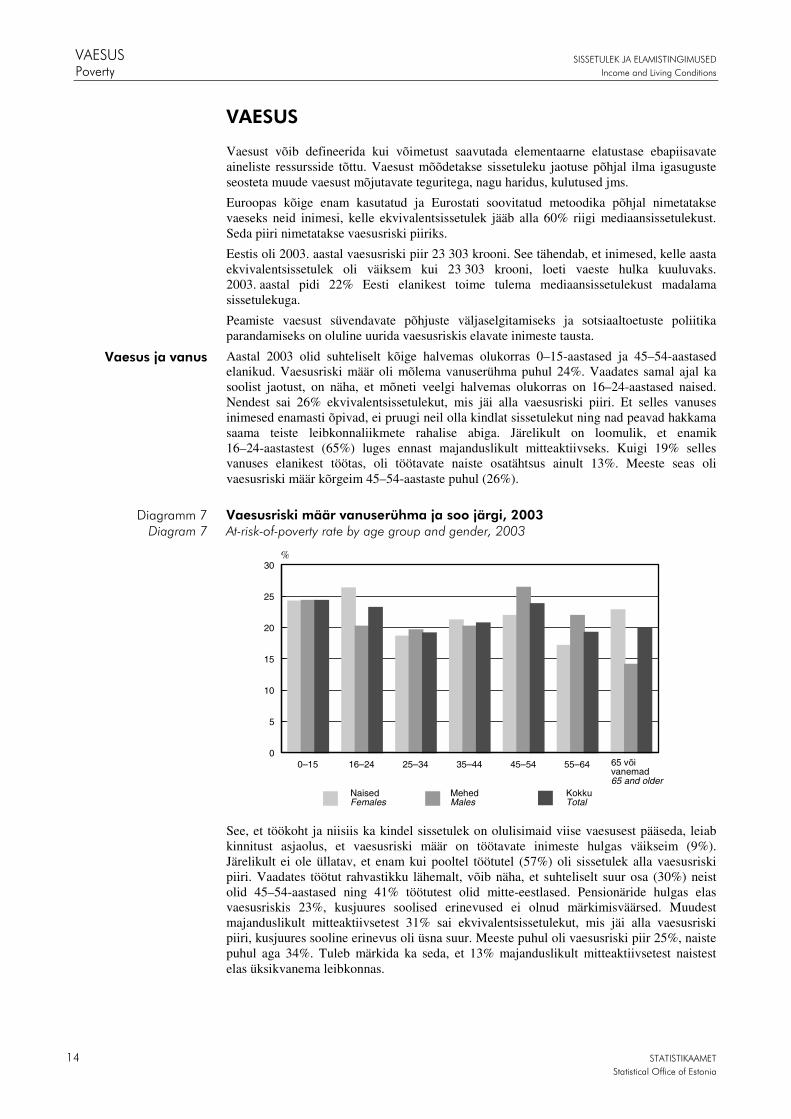
Aastal 2003 olid suhteliselt kõige halvemas olukorras 0–15-aastased ja 45–54-aastased elanikud. Vaesusriski määr oli mõlema vanuserühma puhul 24%. Vaadates samal ajal ka soolist jaotust, on näha, et mõneti veelgi halvemas olukorras on 16–24-aastased naised. Nendest sai 26% ekvivalentsissetulekut, mis jäi alla vaesusriski piiri. Et selles vanuses inimesed enamasti õpivad, ei pruugi neil olla kindlat sissetulekut ning nad peavad hakkama saama teiste leibkonnaliikmete rahalise abiga. Järelikult on loomulik, et enamik 16–24-aastastest (65%) luges ennast majanduslikult mitteaktiivseks. Kuigi 19% selles vanuses elanikest töötas, oli töötavate naiste osatähtsus ainult 13%. Meeste seas oli vaesusriski määr kõrgeim 45–54-aastaste puhul (26%).
Vaesusriski määr vanuserühma ja soo järgi, 2003 At-risk-of-poverty rate by age group and gender, 2003
%
0–15 16–24 25–34 35–44 45–54 55–64 0
5
10
15
20
25
30
NaisedFemales
Kokku Total
MehedMales
65 või vanemad 65 and older
See, et töökoht ja niisiis ka kindel sissetulek on olulisimaid viise vaesusest pääseda, leiab kinnitust asjaolus, et vaesusriski määr on töötavate inimeste hulgas väikseim (9%). Järelikult ei ole üllatav, et enam kui pooltel töötutel (57%) oli sissetulek alla vaesusriski piiri. Vaadates töötut rahvastikku lähemalt, võib näha, et suhteliselt suur osa (30%) neist olid 45–54-aastased ning 41% töötutest olid mitte-eestlased. Pensionäride hulgas elas vaesusriskis 23%, kusjuures soolised erinevused ei olnud märkimisväärsed. Muudest majanduslikult mitteaktiivsetest 31% sai ekvivalentsissetulekut, mis jäi alla vaesusriski piiri, kusjuures sooline erinevus oli üsna suur. Meeste puhul oli vaesusriski piir 25%, naiste puhul aga 34%. Tuleb märkida ka seda, et 13% majanduslikult mitteaktiivsetest naistest elas üksikvanema leibkonnas.
Vaesus ja vanus
Diagramm 7 Diagram 7
SISSETULEK JA ELAMISTINGIMUSED VAESUS
Income and Living Conditions Poverty
STATISTIKAAMET 15 Statistical Office of Estonia
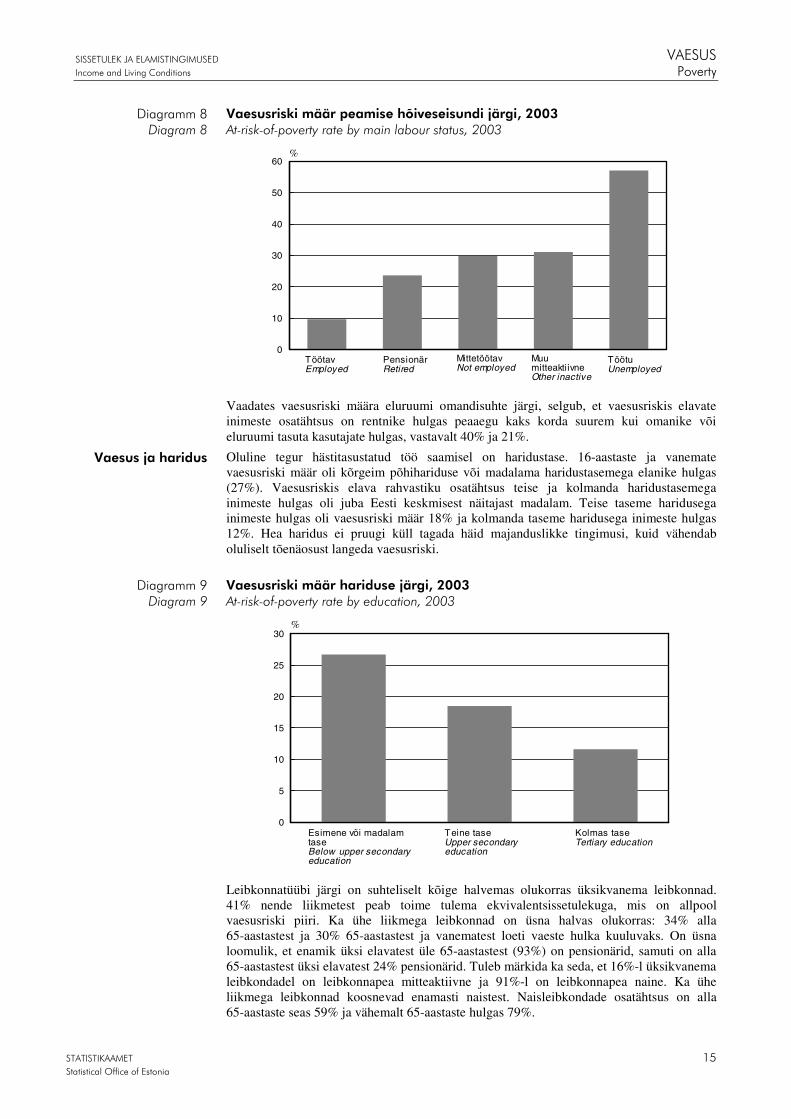
Vaesusriski määr peamise hõiveseisundi järgi, 2003 At-risk-of-poverty rate by main labour status, 2003
0
10
20
30
40
50
60%
TöötavEmployed
PensionärRetired
MittetöötavNot employed
MuumitteaktiivneOther inactive
TöötuUnemployed
Vaadates vaesusriski määra eluruumi omandisuhte järgi, selgub, et vaesusriskis elavate inimeste osatähtsus on rentnike hulgas peaaegu kaks korda suurem kui omanike või eluruumi tasuta kasutajate hulgas, vastavalt 40% ja 21%.
Oluline tegur hästitasustatud töö saamisel on haridustase. 16-aastaste ja vanemate vaesusriski määr oli kõrgeim põhihariduse või madalama haridustasemega elanike hulgas (27%). Vaesusriskis elava rahvastiku osatähtsus teise ja kolmanda haridustasemega inimeste hulgas oli juba Eesti keskmisest näitajast madalam. Teise taseme haridusega inimeste hulgas oli vaesusriski määr 18% ja kolmanda taseme haridusega inimeste hulgas 12%. Hea haridus ei pruugi küll tagada häid majanduslikke tingimusi, kuid vähendab oluliselt tõenäosust langeda vaesusriski.
Vaesusriski määr hariduse järgi, 2003 At-risk-of-poverty rate by education, 2003
0
5
10
15
20
25
30%
Esimene või madalamtaseBelow upper secondaryeducation
Kolmas taseTertiary education
Teine taseUpper secondaryeducation
Leibkonnatüübi järgi on suhteliselt kõige halvemas olukorras üksikvanema leibkonnad. 41% nende liikmetest peab toime tulema ekvivalentsissetulekuga, mis on allpool vaesusriski piiri. Ka ühe liikmega leibkonnad on üsna halvas olukorras: 34% alla 65-aastastest ja 30% 65-aastastest ja vanematest loeti vaeste hulka kuuluvaks. On üsna loomulik, et enamik üksi elavatest üle 65-aastastest (93%) on pensionärid, samuti on alla 65-aastastest üksi elavatest 24% pensionärid. Tuleb märkida ka seda, et 16%-l üksikvanema leibkondadel on leibkonnapea mitteaktiivne ja 91%-l on leibkonnapea naine. Ka ühe liikmega leibkonnad koosnevad enamasti naistest. Naisleibkondade osatähtsus on alla 65-aastaste seas 59% ja vähemalt 65-aastaste hulgas 79%.
Diagramm 8 Diagram 8
Vaesus ja haridus
Diagramm 9 Diagram 9

VAESUS SISSETULEK JA ELAMISTINGIMUSED
Poverty Income and Living Conditions
16 STATISTIKAAMET
Statistical Office of Estonia
Et aidata inimestel toime tulla, jagavad riik ja kohalikud omavalitsused abivajajatele mitmesuguseid sotsiaaltoetusi. Veendumaks, kas sellised siirded õigustavad ennast ja saamaks teada, kuidas nende jagamist parandada, tuleks toetusi uurida sissetulekute kontekstis.
Üks võimalik viis mõõta abirahade efektiivsust on uurida sissetulekuid enne sotsiaaltoetusi. Jättes vaesusriski piiri muutumatuks, saab vaadata kaht erinevat vaesusriski määra: vaesusriski määr enne sotsiaalsiirdeid, aga pärast pensione, ning vaesusriski määr enne kõiki sotsiaalsiirdeid (ka enne pensionide juurdearvestamist).
Jättes sissetulekust välja muud sotsiaalsiirded peale pensionide, kasvab alla vaesusriski piiri elavate inimeste osatähtsus 6 protsendipunkti võrra, 28%-ni. Jättes sissetulekust välja kõik sotsiaalsiirded (k.a pensionid), kasvab vaesusriski määr 20 protsendipunkti võrra, 42%-ni. Niisiis langeb kõikide sotsiaalsete siirete tõttu vaesusriski määr 0,48 korda, pensionide mõju on muude siirete mõjust enam kui kaks korda suurem.
Siirete mõju vaesusriski määrale, 2003 Effect of transfers on at-risk-of-poverty rate, 2003
0 5
10 15 20 25 30 35 40 45 %
Vaesusriski määr ennesiirdeid (v.a pensionid)At-risk-of-poverty ratebefore transfers (excl.pensions)
Vaesusriski määrpärast siirdeidAt-risk-of-povertyrate after transfers
Vaesusriski määr enne siirdeid (k.a pensionid) At-risk-of-poverty rate before transfers (incl. pensions)
Piirkondlikult oli pensionide mõju kõige suurem Põhja-Eestis. Tänu pensionidele langes vaesusriski määr 0,42 korda, 31%-st 18%-ni. Teised siirded olid efektiivseimad Kesk- ja Lõuna-Eestis, alandades vaesusriski määra 0,2 korda.
Ilma sotsiaalsete siireteta elaksid üle poole Kirde- ja Lõuna-Eesti elanikest vaesusriskis, vastavalt 54% ja 51%.
Et saada selgemat pilti ebavõrdsusest ühiskonnas, tuleb vaadata ka vaesuse sügavust. Vaesusriski süvik leitakse kui erinevus vaesusriski piiri ja vaesusriskis elavate inimeste mediaansissetuleku vahel ning seda väljendatakse protsendina vaesusriski piirist. Näitaja mõõdab, kui kaugel on vaesusriski piirist vaesusriskis olevate inimeste sissetulek ehk kui vaesed on vaesed. 2003. aastal oli vaesusriski süvik 32%. Niisiis hõlmas pooltel allpool vaesusriski piiri elavatel inimestel ekvivalentsissetulek vaesusriski piirist alla 68% ehk nende ekvivalentsissetulek jäi aastas alla 15 846 krooni.
Vaesusriski süvik oli suurim 16–24-aastaste seas — 45%. See tähendab, et pooltel selles vanuses inimestel, kes elasid vaesusriskis, oli aasta ekvivalentsissetulek alla 12 817 krooni. Madalaim vaesusriski süvik oli 65-aastaste ja vanemate inimeste seas — 14%.
Sotsiaalsiirete mõju
Diagramm 10 Diagram 10
Vaesuse sügavus
SISSETULEK JA ELAMISTINGIMUSED ELAMISTINGIMUSED Income and Living Conditions Living conditions
STATISTIKAAMET 17 Statistical Office of Estonia
ELAMISTINGIMUSED
Elamistingimuste all mõeldakse eelkõige eluaset ning seda ümbritsevat infrastruktuuri. Eluaseme olukorda iseloomustavad mugavuste olemasolu ning ruumikus, eluaset ümbritsevat keskkonda turvalisus ning tervist mõjutavad tegurid: kärarikkus, rohelus, saastatus jms. Leibkonna elamistingimused on tihedas seoses üldise toimetulekuga ning mõjutavad ühtlasi oluliselt ka üldist eluolu.
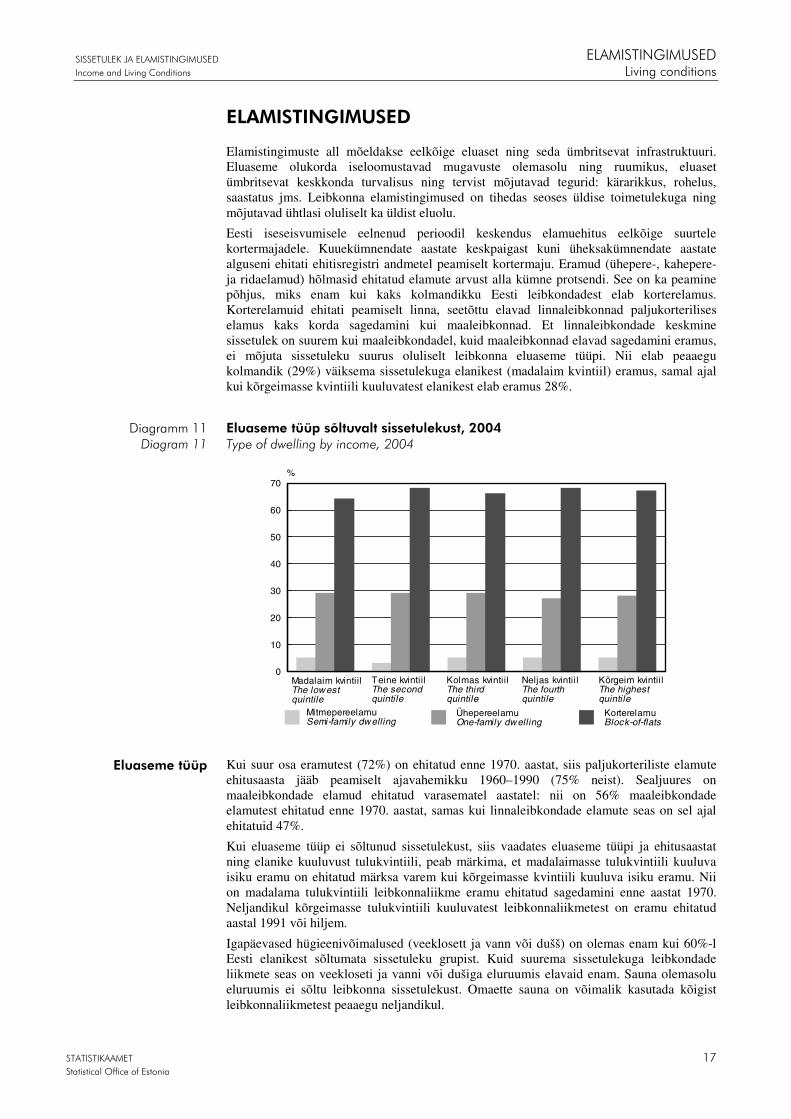
Eesti iseseisvumisele eelnenud perioodil keskendus elamuehitus eelkõige suurtele kortermajadele. Kuuekümnendate aastate keskpaigast kuni üheksakümnendate aastate alguseni ehitati ehitisregistri andmetel peamiselt kortermaju. Eramud (ühepere-, kahepere- ja ridaelamud) hõlmasid ehitatud elamute arvust alla kümne protsendi. See on ka peamine põhjus, miks enam kui kaks kolmandikku Eesti leibkondadest elab korterelamus. Korterelamuid ehitati peamiselt linna, seetõttu elavad linnaleibkonnad paljukorterilises elamus kaks korda sagedamini kui maaleibkonnad. Et linnaleibkondade keskmine sissetulek on suurem kui maaleibkondadel, kuid maaleibkonnad elavad sagedamini eramus, ei mõjuta sissetuleku suurus oluliselt leibkonna eluaseme tüüpi. Nii elab peaaegu kolmandik (29%) väiksema sissetulekuga elanikest (madalaim kvintiil) eramus, samal ajal kui kõrgeimasse kvintiili kuuluvatest elanikest elab eramus 28%.
Eluaseme tüüp sõltuvalt sissetulekust, 2004 Type of dwelling by income, 2004
0
10
20
30
40
50
60
70%
MitmepereelamuSemi-family dwelling
ÜhepereelamuOne-family dwelling
KorterelamuBlock-of-flats
Madalaim kvintiilThe lowestquintile
Teine kvintiilThe secondquintile
Kõrgeim kvintiilThe highestquintile
Kolmas kvintiilThe thirdquintile
Neljas kvintiilThe fourthquintile
Kui suur osa eramutest (72%) on ehitatud enne 1970. aastat, siis paljukorteriliste elamute ehitusaasta jääb peamiselt ajavahemikku 1960–1990 (75% neist). Sealjuures on maaleibkondade elamud ehitatud varasematel aastatel: nii on 56% maaleibkondade elamutest ehitatud enne 1970. aastat, samas kui linnaleibkondade elamute seas on sel ajal ehitatuid 47%.
Kui eluaseme tüüp ei sõltunud sissetulekust, siis vaadates eluaseme tüüpi ja ehitusaastat ning elanike kuuluvust tulukvintiili, peab märkima, et madalaimasse tulukvintiili kuuluva isiku eramu on ehitatud märksa varem kui kõrgeimasse kvintiili kuuluva isiku eramu. Nii on madalama tulukvintiili leibkonnaliikme eramu ehitatud sagedamini enne aastat 1970. Neljandikul kõrgeimasse tulukvintiili kuuluvatest leibkonnaliikmetest on eramu ehitatud aastal 1991 või hiljem.
Igapäevased hügieenivõimalused (veeklosett ja vann või dušš) on olemas enam kui 60%-l Eesti elanikest sõltumata sissetuleku grupist. Kuid suurema sissetulekuga leibkondade liikmete seas on veekloseti ja vanni või dušiga eluruumis elavaid enam. Sauna olemasolu eluruumis ei sõltu leibkonna sissetulekust. Omaette sauna on võimalik kasutada kõigist leibkonnaliikmetest peaaegu neljandikul.
Diagramm 11 Diagram 11
Eluaseme tüüp
ELAMISTINGIMUSED SISSETULEK JA ELAMISTINGIMUSED
Living conditions Income and Living Conditions
18 STATISTIKAAMET
Statistical Office of Estonia
Vaadates igapäevaseid hügieenivõimalusi ja laste olemasolu leibkonnas, saab märkida, et lastega leibkonnad elavad pisut paremates tingimustes kui lasteta. Lastega leibkondadel on veeklosett, vann või dušš või saun sagedamini. Samuti elavad nad lasteta leibkondadega võrreldes keskmiselt uuemas eluruumis.
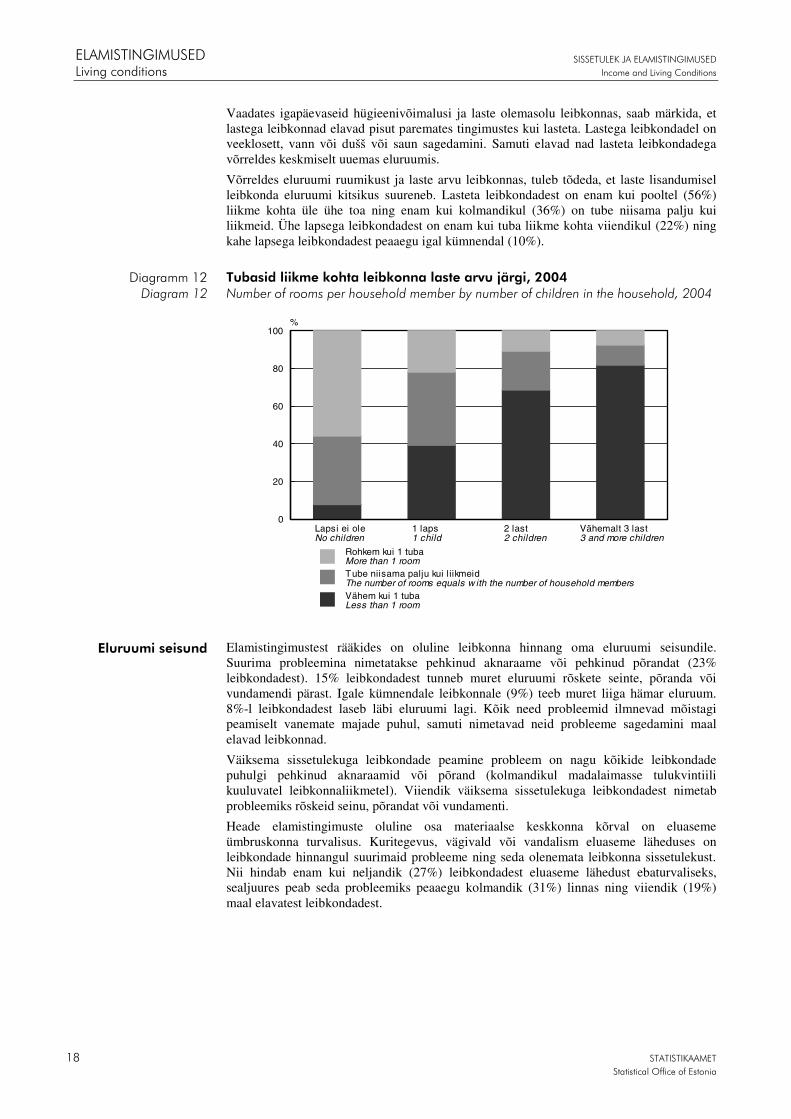
Võrreldes eluruumi ruumikust ja laste arvu leibkonnas, tuleb tõdeda, et laste lisandumisel leibkonda eluruumi kitsikus suureneb. Lasteta leibkondadest on enam kui pooltel (56%) liikme kohta üle ühe toa ning enam kui kolmandikul (36%) on tube niisama palju kui liikmeid. Ühe lapsega leibkondadest on enam kui tuba liikme kohta viiendikul (22%) ning kahe lapsega leibkondadest peaaegu igal kümnendal (10%).
Tubasid liikme kohta leibkonna laste arvu järgi, 2004 Number of rooms per household member by number of children in the household, 2004
0
20
40
60
80
100%
Vähem kui 1 tubaLess than 1 room
Lapsi ei oleNo children
Tube niisama palju kui liikmeidThe number of rooms equals w ith the number of household members
Rohkem kui 1 tubaMore than 1 room
1 laps1 child
2 last2 children
Vähemalt 3 last3 and more children
Elamistingimustest rääkides on oluline leibkonna hinnang oma eluruumi seisundile. Suurima probleemina nimetatakse pehkinud aknaraame või pehkinud põrandat (23% leibkondadest). 15% leibkondadest tunneb muret eluruumi rõskete seinte, põranda või vundamendi pärast. Igale kümnendale leibkonnale (9%) teeb muret liiga hämar eluruum. 8%-l leibkondadest laseb läbi eluruumi lagi. Kõik need probleemid ilmnevad mõistagi peamiselt vanemate majade puhul, samuti nimetavad neid probleeme sagedamini maal elavad leibkonnad.
Väiksema sissetulekuga leibkondade peamine probleem on nagu kõikide leibkondade puhulgi pehkinud aknaraamid või põrand (kolmandikul madalaimasse tulukvintiili kuuluvatel leibkonnaliikmetel). Viiendik väiksema sissetulekuga leibkondadest nimetab probleemiks rõskeid seinu, põrandat või vundamenti.
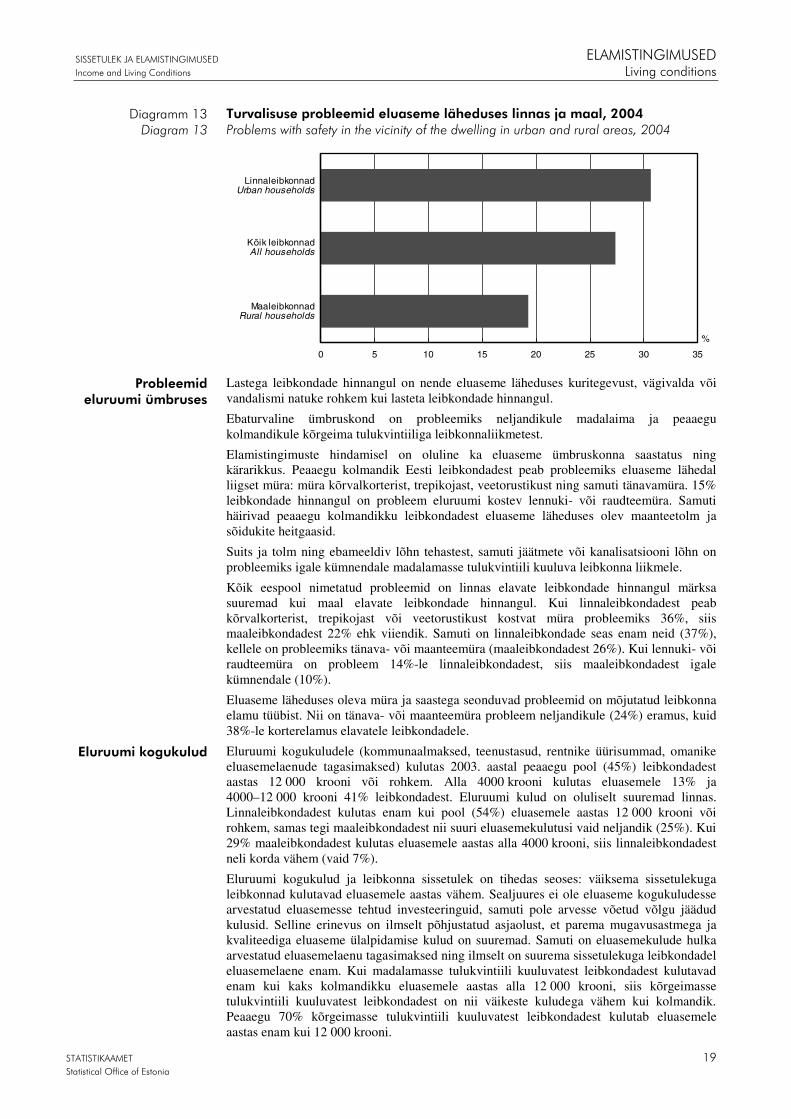
Heade elamistingimuste oluline osa materiaalse keskkonna kõrval on eluaseme ümbruskonna turvalisus. Kuritegevus, vägivald või vandalism eluaseme läheduses on leibkondade hinnangul suurimaid probleeme ning seda olenemata leibkonna sissetulekust. Nii hindab enam kui neljandik (27%) leibkondadest eluaseme lähedust ebaturvaliseks, sealjuures peab seda probleemiks peaaegu kolmandik (31%) linnas ning viiendik (19%) maal elavatest leibkondadest.
Diagramm 12 Diagram 12
Eluruumi seisund
SISSETULEK JA ELAMISTINGIMUSED ELAMISTINGIMUSED Income and Living Conditions Living conditions
STATISTIKAAMET 19 Statistical Office of Estonia
Turvalisuse probleemid eluaseme läheduses linnas ja maal, 2004 Problems with safety in the vicinity of the dwelling in urban and rural areas, 2004
0 5 10 15 20 25 30 35
LinnaleibkonnadUrban households
Kõik leibkonnadAll households
MaaleibkonnadRural households
%
Lastega leibkondade hinnangul on nende eluaseme läheduses kuritegevust, vägivalda või vandalismi natuke rohkem kui lasteta leibkondade hinnangul.
Ebaturvaline ümbruskond on probleemiks neljandikule madalaima ja peaaegu kolmandikule kõrgeima tulukvintiiliga leibkonnaliikmetest.
Elamistingimuste hindamisel on oluline ka eluaseme ümbruskonna saastatus ning kärarikkus. Peaaegu kolmandik Eesti leibkondadest peab probleemiks eluaseme lähedal liigset müra: müra kõrvalkorterist, trepikojast, veetorustikust ning samuti tänavamüra. 15% leibkondade hinnangul on probleem eluruumi kostev lennuki- või raudteemüra. Samuti häirivad peaaegu kolmandikku leibkondadest eluaseme läheduses olev maanteetolm ja sõidukite heitgaasid.
Suits ja tolm ning ebameeldiv lõhn tehastest, samuti jäätmete või kanalisatsiooni lõhn on probleemiks igale kümnendale madalamasse tulukvintiili kuuluva leibkonna liikmele.
Kõik eespool nimetatud probleemid on linnas elavate leibkondade hinnangul märksa suuremad kui maal elavate leibkondade hinnangul. Kui linnaleibkondadest peab kõrvalkorterist, trepikojast või veetorustikust kostvat müra probleemiks 36%, siis maaleibkondadest 22% ehk viiendik. Samuti on linnaleibkondade seas enam neid (37%), kellele on probleemiks tänava- või maanteemüra (maaleibkondadest 26%). Kui lennuki- või raudteemüra on probleem 14%-le linnaleibkondadest, siis maaleibkondadest igale kümnendale (10%).
Eluaseme läheduses oleva müra ja saastega seonduvad probleemid on mõjutatud leibkonna elamu tüübist. Nii on tänava- või maanteemüra probleem neljandikule (24%) eramus, kuid 38%-le korterelamus elavatele leibkondadele.
Eluruumi kogukuludele (kommunaalmaksed, teenustasud, rentnike üürisummad, omanike eluasemelaenude tagasimaksed) kulutas 2003. aastal peaaegu pool (45%) leibkondadest aastas 12 000 krooni või rohkem. Alla 4000 krooni kulutas eluasemele 13% ja 4000–12 000 krooni 41% leibkondadest. Eluruumi kulud on oluliselt suuremad linnas. Linnaleibkondadest kulutas enam kui pool (54%) eluasemele aastas 12 000 krooni või rohkem, samas tegi maaleibkondadest nii suuri eluasemekulutusi vaid neljandik (25%). Kui 29% maaleibkondadest kulutas eluasemele aastas alla 4000 krooni, siis linnaleibkondadest neli korda vähem (vaid 7%).
Eluruumi kogukulud ja leibkonna sissetulek on tihedas seoses: väiksema sissetulekuga leibkonnad kulutavad eluasemele aastas vähem. Sealjuures ei ole eluaseme kogukuludesse arvestatud eluasemesse tehtud investeeringuid, samuti pole arvesse võetud võlgu jäädud kulusid. Selline erinevus on ilmselt põhjustatud asjaolust, et parema mugavusastmega ja kvaliteediga eluaseme ülalpidamise kulud on suuremad. Samuti on eluasemekulude hulka arvestatud eluasemelaenu tagasimaksed ning ilmselt on suurema sissetulekuga leibkondadel eluasemelaene enam. Kui madalamasse tulukvintiili kuuluvatest leibkondadest kulutavad enam kui kaks kolmandikku eluasemele aastas alla 12 000 krooni, siis kõrgeimasse tulukvintiili kuuluvatest leibkondadest on nii väikeste kuludega vähem kui kolmandik. Peaaegu 70% kõrgeimasse tulukvintiili kuuluvatest leibkondadest kulutab eluasemele aastas enam kui 12 000 krooni.
Diagramm 13 Diagram 13
Probleemid eluruumi ümbruses
Eluruumi kogukulud

ELAMISTINGIMUSED SISSETULEK JA ELAMISTINGIMUSED
Living conditions Income and Living Conditions
20 STATISTIKAAMET
Statistical Office of Estonia
Eluruumi kulud aastas sõltuvalt leibkonna elukohast, 2003 Total housing cost per year by place of residence of the household, 2003
0
5
10
15
20
25
30
35
40
45
50
Alla 4000Below 4,000
4000–11 900 Üle 20 000Over 20,000
12 000–20 000
KrooniKroons
%
LinnUrban
MaaRural
Samuti elavad suuremate eluasemekuludega eluruumis need leibkonnad, kus leibkonnapea on kõrgeima haridustasemega või töötav. Kolmanda haridustasemega leibkonnapeaga leibkondadest on eluasemekulud aastas suuremad kui 12 000 krooni enam kui 60%-l. Esimese või sellest madalama haridustasemega leibkonnapeaga leibkondadest kulutab neljandik eluasemele aastas alla 4000 ning pool 4000 kuni 12 000 krooni.
Eluruumikulud piiravad leibkonna rahalisi võimalusi enam, kui nad ületavad aastas 12 000 krooni piiri. Kui need kulud jäävad aastas alla 4000 krooni, piiravad need peaaegu viiendiku leibkondade rahalisi võimalusi (19%). Kolmandiku leibkondade rahalisi võimalusi eluruumi kulud ei piira.
Kuigi madalaimasse tulukvintiili kuuluvad leibkonnad kulutasid eluasemele vähem, on eluasemekulud osutunud neile just rohkem rahalisi võimalusi piiravaks kui kõrgemasse tulukvintiili kuuluvatel leibkondadel. Madalamasse tulukvintiili kuuluvatest leibkondadest peaaegu pool hindab eluasemekulusid rahalisi võimalusi väga piiravaks, 41%-l piiravad need rahalisi võimalusi mõningal määral ning iga kümnes sellise sissetulekuga leibkond arvab, et eluasemekulud ei piira nende leibkonna rahalisi võimalusi üldse. Kõrgemasse tulukvintiili kuuluvatest leibkondadest hindab enam kui iga kümnes eluasemekulusid väga piiravaks ning enam kui pool mõningal määral piiravaks. Nendest vähem kui kolmandiku hinnangul ei piira eluasemekulud rahalisi võimalusi üldse.
Eluruumi kogukulu leibkonna tulukvintiili järgi, 2003 Total housing cost by household income quintile, 2003 (krooni — kroons)
0
20
40
60
80
100%
Alla 4000Below 4,000
Madalaim kvintiil The lowest quintile
Teine kvintiilThe secondquintile
Kõrgeim kvintiil The highest quintile
Kolmas kvintiilThe thirdquintile
Neljas kvintiilThe fourthquintile
4000–12 000
Üle 12 000Over 12,000
Diagramm 14 Diagram 14
Kogukuludest tingitud piirangud
Diagramm 15 Diagram 15

SISSETULEK JA ELAMISTINGIMUSED ELAMISTINGIMUSED Income and Living Conditions Living conditions
STATISTIKAAMET 21 Statistical Office of Estonia
Eluruumi kogukuludest tingitud piirangud leibkonna tulukvintiili järgi, 2003 Restrictions caused by total houshing cost by household income quintile, 2003
%
Ei piira üldseDo not restrict at all
Piiravad mõningal määralRestrict to a certain extent
Piiravad vägaRestrict a lot
0 20 40 60 80 100
Madalaim kvintiilThe low est
quintile
Teine kvintiilThe second
quintile
Kõrgeim kvintiilThe highest
quintile
Kolmas kvintiilThe third
quintile
Neljas kvintiilThe fourth
quintile
Diagramm 16 Diagram 16
RAHVA TERVIS SISSETULEK JA ELAMISTINGIMUSED
Population health Income and Living Conditions
22 STATISTIKAAMET
Statistical Office of Estonia
RAHVA TERVIS
Selles peatükis on tähelepanu keskmes Eesti rahvastiku terviseseisund 2004. aastal. Esmalt käsitletakse vastanute hinnangut oma tervisele, seejärel analüüsitakse objektiivsemaid näitajaid.
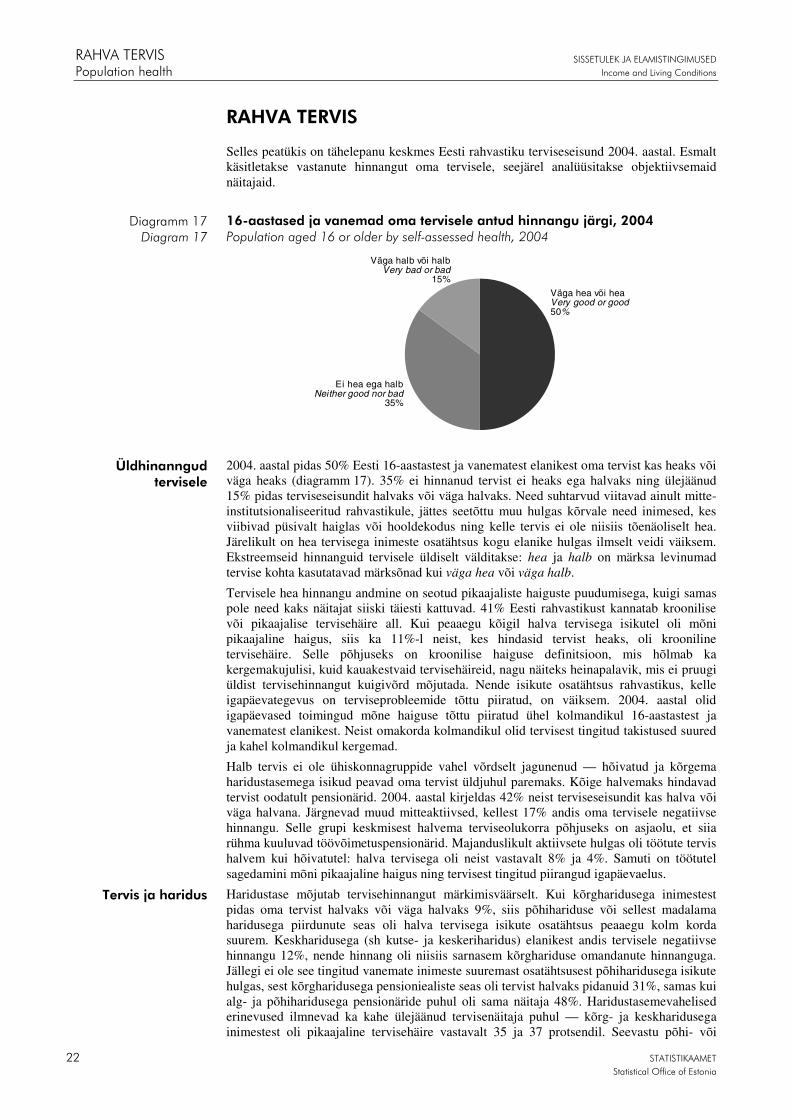
16-aastased ja vanemad oma tervisele antud hinnangu järgi, 2004 Population aged 16 or older by self-assessed health, 2004
Väga hea või heaVery good or good50%
Ei hea ega halbNeither good nor bad
35%
Väga halb või halbVery bad or bad
15%
2004. aastal pidas 50% Eesti 16-aastastest ja vanematest elanikest oma tervist kas heaks või väga heaks (diagramm 17). 35% ei hinnanud tervist ei heaks ega halvaks ning ülejäänud 15% pidas terviseseisundit halvaks või väga halvaks. Need suhtarvud viitavad ainult mitte-institutsionaliseeritud rahvastikule, jättes seetõttu muu hulgas kõrvale need inimesed, kes viibivad püsivalt haiglas või hooldekodus ning kelle tervis ei ole niisiis tõenäoliselt hea. Järelikult on hea tervisega inimeste osatähtsus kogu elanike hulgas ilmselt veidi väiksem. Ekstreemseid hinnanguid tervisele üldiselt välditakse: hea ja halb on märksa levinumad tervise kohta kasutatavad märksõnad kui väga hea või väga halb.
Tervisele hea hinnangu andmine on seotud pikaajaliste haiguste puudumisega, kuigi samas pole need kaks näitajat siiski täiesti kattuvad. 41% Eesti rahvastikust kannatab kroonilise või pikaajalise tervisehäire all. Kui peaaegu kõigil halva tervisega isikutel oli mõni pikaajaline haigus, siis ka 11%-l neist, kes hindasid tervist heaks, oli krooniline tervisehäire. Selle põhjuseks on kroonilise haiguse definitsioon, mis hõlmab ka kergemakujulisi, kuid kauakestvaid tervisehäireid, nagu näiteks heinapalavik, mis ei pruugi üldist tervisehinnangut kuigivõrd mõjutada. Nende isikute osatähtsus rahvastikus, kelle igapäevategevus on terviseprobleemide tõttu piiratud, on väiksem. 2004. aastal olid igapäevased toimingud mõne haiguse tõttu piiratud ühel kolmandikul 16-aastastest ja vanematest elanikest. Neist omakorda kolmandikul olid tervisest tingitud takistused suured ja kahel kolmandikul kergemad.
Halb tervis ei ole ühiskonnagruppide vahel võrdselt jagunenud — hõivatud ja kõrgema haridustasemega isikud peavad oma tervist üldjuhul paremaks. Kõige halvemaks hindavad tervist oodatult pensionärid. 2004. aastal kirjeldas 42% neist terviseseisundit kas halva või väga halvana. Järgnevad muud mitteaktiivsed, kellest 17% andis oma tervisele negatiivse hinnangu. Selle grupi keskmisest halvema terviseolukorra põhjuseks on asjaolu, et siia rühma kuuluvad töövõimetuspensionärid. Majanduslikult aktiivsete hulgas oli töötute tervis halvem kui hõivatutel: halva tervisega oli neist vastavalt 8% ja 4%. Samuti on töötutel sagedamini mõni pikaajaline haigus ning tervisest tingitud piirangud igapäevaelus.
Haridustase mõjutab tervisehinnangut märkimisväärselt. Kui kõrgharidusega inimestest pidas oma tervist halvaks või väga halvaks 9%, siis põhihariduse või sellest madalama haridusega piirdunute seas oli halva tervisega isikute osatähtsus peaaegu kolm korda suurem. Keskharidusega (sh kutse- ja keskeriharidus) elanikest andis tervisele negatiivse hinnangu 12%, nende hinnang oli niisiis sarnasem kõrghariduse omandanute hinnanguga. Jällegi ei ole see tingitud vanemate inimeste suuremast osatähtsusest põhiharidusega isikute hulgas, sest kõrgharidusega pensioniealiste seas oli tervist halvaks pidanuid 31%, samas kui alg- ja põhiharidusega pensionäride puhul oli sama näitaja 48%. Haridustasemevahelised erinevused ilmnevad ka kahe ülejäänud tervisenäitaja puhul — kõrg- ja keskharidusega inimestest oli pikaajaline tervisehäire vastavalt 35 ja 37 protsendil. Seevastu põhi- või
Diagramm 17 Diagram 17
Üldhinanngud tervisele
Tervis ja haridus

SISSETULEK JA ELAMISTINGIMUSED RAHVA TERVIS
Income and Living Conditions Population health
STATISTIKAAMET 23 Statistical Office of Estonia
madalama haridusega vastanute puhul oli sama näitaja 55%. Olukord on sarnane ka piirangute puhul, mida terviseprobleemid igapäevaelus tekitavad. Kõrg- ja keskharidusega vastanute seas ei piiranud tervis igapäevatoimetusi 72% ja 69% juhtudest, samas kui alg- ja põhiharidusega inimestest sai sama väita vaid 49% (diagramm 18). Hariduserinevused tervisehinnangus säilivad ka vanima kohordi puhul.
Igapäevaelu piiravate terviseprobleemidega 16-aastased ja vanemad hõiveseisundi ja hariduse järgi, 2004 Population aged 16 or older who experience health induced limitations in daily life by labour status and level of education, 2004
0 10 20 30 40 50 60 70 80
HaridustaseLevel of education
Kolmas taseTertiary education
Teine taseUpper secondary education
Esimene või madalam taseBelow upper secondary
education
%
Kogu rahvastikTotal population
VanaduspensionäridOld-age pensioners
Erinevused ilmnevad ka rahvuse tasandil. Eestlased pidasid tervist suurema tõenäosusega halvaks kui muud etnilised grupid, kellel oli tervis halb 13%-l. Eestlaste sama näitaja oli 16%. Ühtlasi oli eestlaste seas ka enam neid, kes pidasid tervist heaks või väga heaks — 52%, mitte-eestlaste sama näitaja oli 45%. Selle põhjuseks on asjaolu, et mitte-eestlased hindasid oma tervist ei heaks ega halvaks märksa sagedamini. Kahe ülejäänud tervisenäitaja puhul on rahvustevahelised erinevused minimaalsed, mis näitab, et etniliste gruppide tervis on üldjoontes sarnane ning mitte-eestlased on tervisele antavates hinnangutes tagasihoidlikumad.
Maakondlikud erinevused rahvastiku tervises on samuti olemas. Teemakaart kajastab tervist halvaks või väga halvaks pidanud elanike osatähtsust. Vältimaks rahvastiku vanuskoosseisu erinevusi, on vaatluse alla võetud vaid 16–64-aastased. Pensionieast noorema rahvastiku tervis on parim Harju maakonnas, kus vaid 6% hindab oma tervist kas halvaks või väga halvaks. Ülejäänud põhja- ja läänepoolsete maakondade (v.a Pärnumaa) rahvastiku tervis on samuti suhteliselt hea: halva tervisega isikute osatähtsus ei küüni seal üle 8%. Järgmise grupi moodustavad Rapla, Pärnu, Viljandi ja Järva maakond, kus oma tervist halvaks või väga halvaks hindavate isikute osatähtsus jääb 9% ja 12% vahele. Mõnevõrra halvem on olukord Tartu, Jõgeva ja Valga maakonnas. Kõige halvem tervis on siiski Võru ja Põlva maakonna elanikel. Põlvamaal on nende pensionieast nooremate isikute osatähtsus, kes hindavad tervist halvaks, 18%, niisiis enam kui kolm korda suurem kui sama näitaja Harju maakonnas.
Kahe ülejäänud tervisenäitaja võrdlus maakonniti annab mõnevõrra teistsuguse pildi (diagramm 19). Nii mõneski maakonnas, kus tervisehinnang on suhteliselt hea, on tegelik olukord märksa halvem, kui arvesse võtta kroonilisi haigusi põdevate ja igapäevaelus terviseprobleemide tõttu piiratute osatähtsust. Nii näiteks ei ületa Lääne maakonnas oma tervist halvaks või väga halvaks hindavate mittepensionäride osakaal 5%, samas kui terviseprobleemid piiravad elanikkonnast 32% tegevust, mis on kaks korda kõrgem kui Tallinna sama näitaja. Olukord on vastupidine Valga maakonnas, kus suhteliselt suurel osal inimestest on halb või väga halb tervis, aga krooniliste haigustega rahvastiku osatähtsus ei ole teiste maakondadega võrreldes suur. Seevastu kõige parema ja kõige halvema tervisega
Diagramm 18
Diagram 18
Tervis maakondades

RAHVA TERVIS SISSETULEK JA ELAMISTINGIMUSED
Population health Income and Living Conditions
24 STATISTIKAAMET
Statistical Office of Estonia
piirkonnad jäävad sõltumata kasutatud näitajast samaks: Tallinna rahvastik on püsivalt kõige paremas ja Põlvamaa rahvastik kõige halvemas olukorras.
Oma tervisele halva või väga halva hinnangu andnud 16–64-aastaste osatähtsus maakondades, 2004 The proportion of persons aged 16–64 who have assessed their health to be poor or very poor by counties, 2004
P Ä R N U
H A R J U
TA R T U
R A P L A
V I L J A N D IS A A R E
I D A - V I R U
J Ä R VA
V Õ R U
J Õ G E VA
P Õ LVAVA L G A
L Ä Ä N E -
V I R U
L Ä Ä N EH I I U
5.7 - 8.0 9.5 - 11.7
Eesti 8.3%Estonia 8.3%
12.0 - 13.615.6 - 18.4
H I I U maakonna nimi / name of county
Hõivatud, töötud ja muud mitteaktiivsed terviseseisundi ja maakonna järgi, 2004 Employed, unemployed and other inactive by health status and county, 2004
Valga Tallinn
Võru Hiiu
Harju Pärnu Rapla
Viljandi Järva
Ida-Viru Tartu
Lääne Jõgeva
Saare Lääne-Viru
Põlva
0 5 10 15 20 25 30 35 40 45
%
Põeb pikaajalist haigustSuffering from a long-standing illness
Igapäevategevus piiratud terviseprobleemide tõttu Daily activities limited due to health problems
Maakond County
Teemakaart 2
Thematic map 2
Diagramm 19
Diagram 19

SISSETULEK JA ELAMISTINGIMUSED RAHVA TERVIS
Income and Living Conditions Population health
STATISTIKAAMET 25 Statistical Office of Estonia
On tähelepanuväärne, et ainult ühes maakonnas — Põlvamaal — ületas nende osatähtsus, kelle igapäevategevus on tervisest tulenevatel põhjustel piiratud, nende osatähtsuse, kes põevad mõnd pikaajalist haigust. Vastavad osatähtsused olid suhteliselt sarnased ka Valga, Hiiu ja Võru maakonnas. Erinevus oli suurim Tallinnas ja Harjumaal, kus igapäevaelus piiranguid kogevate isikute osatähtsus oli kroonilist haigust põdejate osatähtsusest 10% väiksem. Niisiis on nende maakondade elanikel palju paremad võimalused tulla pikaajaliste haigustega toime nii, et need ei saa igapäevast tegevust takistavaks teguriks.
Kõige olulisem on aga tervise seos sissetulekuga. 2004. aastal pidas 20% allpool vaesusriski piiri elavaid inimesi oma tervist kas halvaks või väga halvaks. Mittevaestest andis tervisele sama hinnangu 14%. Olukord jääb samaks sõltumata sellest, millist tervisenäitajat kasutada. Peaaegu pool vaesusriskis elavatest inimestest põeb mõnd kroonilist haigust, samas kui vaesusriski piirist ülespoole jäävatest on pikaajaline tervise probleem 39 protsendil. Vaeste ja mittevaeste erinevus on suur ka tervisest tingitud piirangute puhul. Kui vaesusriski piirist suurema sissetulekuga inimeste seas on 32% neid, kelle igapäevategevust mõjutab mõni terviseprobleem, siis allpool vaesusriski piiri elava rahvastiku sama näitarv on 41%.
Üksikasjalikuma pildi annab erinevatesse tulukvintiilidesse kuuluvate isikute terviseseisundi võrdlemine. Peenem joon diagrammil 20 märgib nende osatähtsust igas kvintiilis, kes hindavad oma tervist halvaks või väga halvaks. Kuigi üldine trend on negatiivsete hinnangute harvenemine sissetuleku suurenedes, on halvim tervis teise, mitte esimesse kvintiili kuulujatel. Põhjuseks on see, et teise kvintiili kuulub suur osa pensionäridest. Seepärast märgib paksem joon diagrammil halva tervisega isikute osatähtsust mittepensionäride hulgas. Tööealiste hinnang oma tervisele on oodatult soodsam kui kogurahvastikus tervikuna, kuid erinevus väheneb suuremate sissetulekute puhul. Tervist halvaks hindajate osatähtsus väheneb sissetuleku suurenedes monotoonselt. Madalaimasse kvintiili kuulujatest oli tervis halb 12%-l, samas kui kõrgeimas kvintiilis on sama näitarv vaid 3%. Järelikult, mida vaesemas leibkonnas inimene elab, seda suurem on tõenäosus, et tema tervis ei ole hea. Ilmnenud peaaegu lineaarne seos sissetuleku ja tervise vahel on mõnevõrra üllatav. Varasemad uuringud on näidanud, et üldjuhul on positiivne seos iseloomulik sissetuleku madalamate tasemete puhul, kus iga lisandunud sissetuleku ühik tähendab keskmiselt paremat tervist. See seos ei kehti suuremate sissetulekute puhul, kus sissetuleku kasvuga ei kaasne enam proportsionaalset keskmise tervise paranemist.
Hinnang tervisele tulukvintiili ja hõiveseisundi järgi, 2004 Self-assessed health by income quintile and labour status, 2004
0
5
10
15
20
25
30
Halva või väga halva tervisega, %With bad or very bad health, %
Hõivatud, töötud ja muudmitteaktiivsedEmployed, unemployed andother inactive
Kogu rahvastikTotal population
Madalaim kvintiilThe lowestquintile
Teine kvintiilThe secondquintile
Kõrgeim kvintiilThe highestquintile
Kolmas kvintiilThe thirdquintile
Neljas kvintiilThe fourthquintile
Inimesed, kes erinevad tervisehinnangu poolest, elavad ka erinevates oludes. Üldjuhul on parema tervisega elanikkonna elamistingimused märksa paremad kui neil, kelle tervis on halvem. Neist, kes hindasid tervist halvaks või väga halvaks, elas enne 1940. aastat ehitatud majas 26%. Hea tervisega elanike puhul on sama näitaja 16%. Vanades majades on elementaarseid mugavusi väiksema tõenäosusega, mistõttu halva tervisega inimeste seas on
Tervis ja sissetulek
Diagramm 20 Diagram 20
Tervis ja elamistingimused

RAHVA TERVIS SISSETULEK JA ELAMISTINGIMUSED
Population health Income and Living Conditions
26 STATISTIKAAMET
Statistical Office of Estonia
enam neid, kelle eluruumis ei ole veevärki, kanalisatsiooni ja sooja vett. Kuna vanematel inimestel on halvem tervis ja nad elavad suurema tõenäosusega maal, on järgnevalt käsitletud vaid mittepensionäride elamistingimusi. Tulemused on üldjoontes sarnased kui kogu elanikkonna puhul — isegi kui pensionärid on kõrvale jäetud, elavad halva tervisega inimesed suurema tõenäosusega eluruumis, kus puuduvad elementaarsed mugavused või mis on muul moel tervisele ebasoodne (diagramm 21). Nii näiteks elas ainult 7% hea tervisega rahvastikust eluruumis, kus ei ole veevärki, samas kui halva tervisega inimestest elas sellistes oludes 20%. Peale selle elavad halva tervisega inimesed sagedamini eluruumis, mis on liiga niiske või hämar.
Hõivatud, töötud ja muud mitteaktiivsed tervisele antud hinnangu ja eluruumi seisukorra järgi, 2004 Employed, unemployed and other inactive by self-assessed health and state of a dwelling, 2004
0
5
10
15
20
25
30
35
40%
Hea või väga heaGood or very good
Ei hea ega halbNeither good nor bad
Halb või väga halbBad or very bad
Ilma veevärgitaWithout watersupply system
Ilma veeklosetitaWithout flushtoilet
Liiga hämarToo dark
Ilma soojaveetaWithout hotwater
Rõsked seinad,põrand võivundamentDamp w alls, floor orbasement
Sissetuleku suuruse ja indiviidi tervise vahelise seose põhjusi on mitmeid. Nagu eelnenust näha, elavad väiksema sissetulekuga inimesed tingimustes, mis suurendavad terviseprobleeme. Samuti on väiksema sissetulekuga inimestel sagedamini tervise-kahjulikke harjumusi, sh suitsetamine. Ka ei pruugi vaesuses või selle ohus elavatel isikutel olla võimalik alati tervislikult toituda ja harrastada tervislikke eluviise. Lisaks ei ole kõige vaesematel elanikkonnakihtidel tihti ravikindlustust ning piisavalt ressursse arsti poole pöördumisega seotud kulutuste katteks, mis piirab oluliselt arstiabi kättesaadavust. Kuigi on võimalik ka vastupidine kausaalne mehhanism — halvema tervisega inimesed kas ei soovi leida või ei ole võimelised leidma tasuvat tööd ning elavad seetõttu vaesuses —, ei ole see ilmselt piisav seletamaks kogu sissetulekute ja tervise vahel ilmnenud seost.
Diagramm 21
Diagram 21
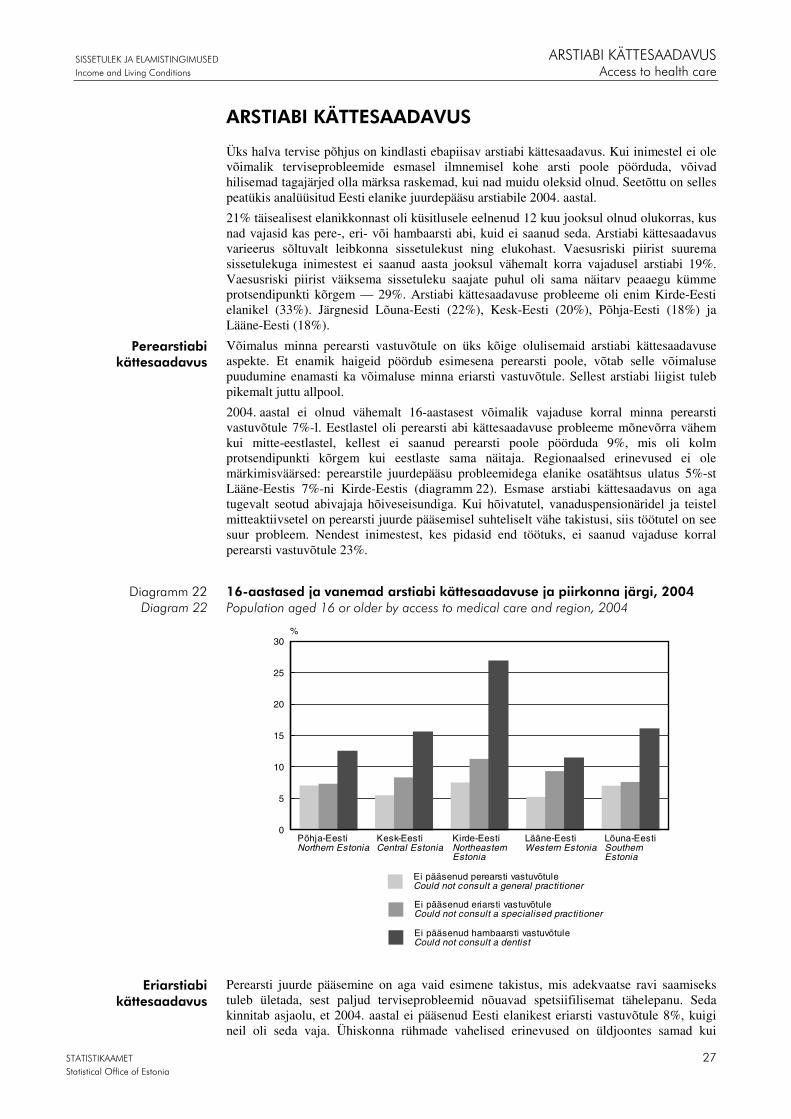
SISSETULEK JA ELAMISTINGIMUSED ARSTIABI KÄTTESAADAVUS
Income and Living Conditions Access to health care
STATISTIKAAMET 27 Statistical Office of Estonia
ARSTIABI KÄTTESAADAVUS
Üks halva tervise põhjus on kindlasti ebapiisav arstiabi kättesaadavus. Kui inimestel ei ole võimalik terviseprobleemide esmasel ilmnemisel kohe arsti poole pöörduda, võivad hilisemad tagajärjed olla märksa raskemad, kui nad muidu oleksid olnud. Seetõttu on selles peatükis analüüsitud Eesti elanike juurdepääsu arstiabile 2004. aastal.
21% täisealisest elanikkonnast oli küsitlusele eelnenud 12 kuu jooksul olnud olukorras, kus nad vajasid kas pere-, eri- või hambaarsti abi, kuid ei saanud seda. Arstiabi kättesaadavus varieerus sõltuvalt leibkonna sissetulekust ning elukohast. Vaesusriski piirist suurema sissetulekuga inimestest ei saanud aasta jooksul vähemalt korra vajadusel arstiabi 19%. Vaesusriski piirist väiksema sissetuleku saajate puhul oli sama näitarv peaaegu kümme protsendipunkti kõrgem — 29%. Arstiabi kättesaadavuse probleeme oli enim Kirde-Eesti elanikel (33%). Järgnesid Lõuna-Eesti (22%), Kesk-Eesti (20%), Põhja-Eesti (18%) ja Lääne-Eesti (18%).
Võimalus minna perearsti vastuvõtule on üks kõige olulisemaid arstiabi kättesaadavuse aspekte. Et enamik haigeid pöördub esimesena perearsti poole, võtab selle võimaluse puudumine enamasti ka võimaluse minna eriarsti vastuvõtule. Sellest arstiabi liigist tuleb pikemalt juttu allpool.
2004. aastal ei olnud vähemalt 16-aastasest võimalik vajaduse korral minna perearsti vastuvõtule 7%-l. Eestlastel oli perearsti abi kättesaadavuse probleeme mõnevõrra vähem kui mitte-eestlastel, kellest ei saanud perearsti poole pöörduda 9%, mis oli kolm protsendipunkti kõrgem kui eestlaste sama näitaja. Regionaalsed erinevused ei ole märkimisväärsed: perearstile juurdepääsu probleemidega elanike osatähtsus ulatus 5%-st Lääne-Eestis 7%-ni Kirde-Eestis (diagramm 22). Esmase arstiabi kättesaadavus on aga tugevalt seotud abivajaja hõiveseisundiga. Kui hõivatutel, vanaduspensionäridel ja teistel mitteaktiivsetel on perearsti juurde pääsemisel suhteliselt vähe takistusi, siis töötutel on see suur probleem. Nendest inimestest, kes pidasid end töötuks, ei saanud vajaduse korral perearsti vastuvõtule 23%.
16-aastased ja vanemad arstiabi kättesaadavuse ja piirkonna järgi, 2004 Population aged 16 or older by access to medical care and region, 2004
0
5
10
15
20
25
30%
Ei pääsenud perearsti vastuvõtuleCould not consult a general practitioner
Ei pääsenud eriarsti vastuvõtuleCould not consult a specialised practitioner
Ei pääsenud hambaarsti vastuvõtuleCould not consult a dentist
Põhja-EestiNorthern Estonia
Kesk-EestiCentral Estonia
Lõuna-EestiSouthernEstonia
Kirde-EestiNortheasternEstonia
Lääne-EestiWestern Estonia
Perearsti juurde pääsemine on aga vaid esimene takistus, mis adekvaatse ravi saamiseks tuleb ületada, sest paljud terviseprobleemid nõuavad spetsiifilisemat tähelepanu. Seda kinnitab asjaolu, et 2004. aastal ei pääsenud Eesti elanikest eriarsti vastuvõtule 8%, kuigi neil oli seda vaja. Ühiskonna rühmade vahelised erinevused on üldjoontes samad kui
Perearstiabi kättesaadavus
Diagramm 22 Diagram 22
Eriarstiabi kättesaadavus

ARSTIABI KÄTTESAADAVUS SISSETULEK JA ELAMISTINGIMUSED
Access to health care Income and Living Conditions
28 STATISTIKAAMET
Statistical Office of Estonia
perearsti kättesaadavuse puhul, kuid suuremad. Eriarstiabi saamise probleeme oli 11%-l mitte-eestlastest ja 7%-l eestlastest. See näitab, et eestlastele on ka seda tüüp arstiabi kättesaadavam. Regionaalselt oli juurdepääs arstiabile parim Põhja-Eestis ja halvim Kirde-Eestis. Oluliselt vähendab eriarsti poole pöördumise võimalusi töötuks jäämine. Töötutest oli seda tüüpi arstiabi kättesaadavuse probleeme 19%-l, samas kui pensioniealiste puhul oli sama näitarv 10% ning hõivatutel ja muudel mitteaktiivsetel 7%.
Arstiabi kättesaadavus sõltub mõistagi suuresti ka leibkonna käsutuses olevatest majanduslikest ressurssidest. 2004. aastal oli 11% vaesusriskis elavatest inimestest eelnenud aasta jooksul kogenud olukorda, kus nad vajasid perearsti abi, kuid ei saanud seda. Mittevaeste seas oli vastav näitarv 6%. Eriarstiabi puhul olid samad näitajad 14% vaesusriski piirist allapoole jäävate isikute puhul ja 7% vaesusriski piirist kõrgema ekvivalentsissetuleku saajate seas. Arvestades vaesusriskis olevate inimeste halvemat terviseseisundit, on erinevus arstiabi mittesaanute osatähtsuses kõigi hulgast, kes abi vajasid, ilmselt veelgi suurem. Olukord on sarnane, kui lähtuda vaesusriski piiri asemel tulukvintiilidest. Nende osatähtsus, kes ei saanud vajaduse korral perearsti poole pöörduda, oli esimeses kvintiilis 12% ja viiendas 5%.
Arstiabi mittesaamise põhjused on mitmesugused. Perearsti vastuvõtule mittepääsemise puhul on olulisim majanduslik motivatsioon — 31%-l jäi perearstiga konsulteerimata, sest puudus kehtiv ravikindlustus või ei olnud piisavalt raha vastuvõtu eest tasumiseks. Sageduselt teine põhjus oli liiga pikk ootejärjekord, mida mainis 18% neist vastanutest, kel oli arstiabi kättesaadavuse probleeme. Muude põhjustena toodi välja sobiva arsti mitteteadmist (8%), ajapuudust ja lootust, et terviseprobleem läheb iseenesest mööda, ning liiga pikka vahemaad (kokku 19%). Ülejäänud 18% nimetas muid põhjusi, nagu arstide ebasõbralikkust ning hirmu ravi ees. Rahalised põhjused olid olulisemad mitte-eestlaste seas, kellest jäi kalliduse tõttu arstiabi saamata 37%-l, samas kui eestlaste puhul oli sama näitaja 27%. Arstiabi kallidus ja puuduv tervisekindlustus oli konkurentsitult olulisim töötute puhul, kellest tõi rahalised põhjused välja 81%.
Eriarsti vastuvõtule mittepääsemise põhjused on mõnevõrra teistsugused (diagramm 23). 39%-l said määravaks rahalised põhjused, mis on märksa enam kui perearsti kättesaadavuse puhul. Ootejärjekorra pikkus oli siin samuti olulisem — eriarsti konsultatsioonil jäi seetõttu käimata 27%-l arstiabi mittesaanutest. Peale selle mainiti hea arsti mittetundmist ja transpordiprobleeme, kuigi märksa harvemini. Hõiveseisundist tingitud erinevused olid niisama olulised kui perearsti juurde pääsemisel. Rahalised põhjused on töötute puhul veel tähtsamad: peaaegu 90%-l sellesse gruppi kuuluvatest arsti juurde mittepääsenutest sai määravaks arstiabi kallidus ja puuduv tervisekindlustus. Ülejäänud gruppidel on juurdepääsuprobleemide põhjused jagunenud märksa ühtlasemalt.
16-aastased ja vanemad eriarsti vastuvõtule mittepääsemise põhjuste järgi, 2004 Population aged 16 or older by reasons for not being able to access a specialised practitioner, 2004
MajanduslikudpõhjusedFinancial reasons38%
Ei teadnud head arstiDid not know a good doctor
7%
Põhjus teadmataReason unknown
4%
Liiga pikkootejärjekord
Too long waiting list27%
Liiga pikk vahemaa, sõiduprobleemidToo far, transportation problems
7%
Muud põhjusedOther reasons
17%
Arstiabi mittesaamise põhjus varieerub suuresti sõltuvalt abi mittesaanu leibkonna ekvivalentsissetulekust. Vaesusriski piirist väiksema sissetuleku saajate puhul domi-neerivad majanduslikud põhjused — 59% selles grupis ligipääsuprobleeme kogenutest ei läinud perearsti vastuvõtule, sest nad ei saanud seda endale lubada või puudus neil kehtiv
Arstiabi kättesaadavuse
probleemide põhjused
Diagramm 23
Diagram 23

SISSETULEK JA ELAMISTINGIMUSED ARSTIABI KÄTTESAADAVUS
Income and Living Conditions Access to health care
STATISTIKAAMET 29 Statistical Office of Estonia
ravikindlustus. Vaesusriski piirist suurema sissetuleku saajate puhul oli sama näitaja 18%. Selles grupis on märksa olulisem mitmekesine muude põhjuste kategooria, kuhu kuulub ajapuudus ja hea arsti mitteteadmine. Eriarstiabi puhul on vaesusriskis elavate isikute puhul tähtsaim jällegi majanduslik motivatsioon (abi mittesaanutest 58%-l). Pikad ootejärjekorrad on vähem levinud vaesusriski piirist madalamat ja olulisemad vaesusriski piirist kõrgemat ekvivalentsissetulekut saavate isikute seas (vastavalt 14% ja 32%).
2004. aastal oli 15% vähemalt 16-aastastest kogenud viimase aasta jooksul olukorda, kus nad vajasid hambaarsti abi, kuid ei saanud seda. Mitte-eestlaste juurdepääs hambaravile on jällegi piiratum kui põliselanikel, kellest jäi hambaarsti vastuvõtul käimata 13%-l. Mitte-eestlaste seas jäi hambaravi saamata enam kui viiendikul. Hõiveseisundi järgi on ebasoodsaimas olukorras jällegi töötud, kellest ei saanud vajaduse korral hambaarsti vastuvõtule pöörduda peaaegu kolmandik. Ülejäänud rühmade vahelised erinevused on märksa tagasihoidlikumad: pensionäridest ei saanud vajaduse korral hambaravi 15%, hõivatutest 14% ja muudest mitteaktiivsetest 13%. Regionaalsed erinevused on samuti märkimisväärsed. Situatsioon on halvim Kirde-Eestis, kus ei pääsenud aasta jooksul vajaduse korral hambaarsti juurde 27% elanikest. Kõige soodsamas olukorras on Lääne- ja Põhja-Eesti elanikud, kellest koges juurdepääsuprobleeme vastavalt 11% ja 12%. Ülejäänud piirkondades — Kesk- ja Lõuna-Eestis — oli sama näitaja kummaski 16%.
Hambaravi kättesaadavust mõjutab oluliselt ka sissetulek. 22%-l vaesusriskis olevatest ja 14%-l vaesusriskis mitteolevatest isikutest oli küsitlusele eelnenud aasta jooksul olnud olukordi, kus neil oli hambaravi vaja, kuid ei saanud seda. Kahe äärmise kvintiili vaheline erinevus on veelgi suurem — arstiabi saamise probleeme oli 23%-l madalaima ja 9%-l kõrgeima sissetuleku saajatel.
Hambaarsti juurde mittepääsemise põhjused varieeruvad palju vähem kui ülejäänud arstiabi liikide puhul. Peamised lahendamata jäänud hambaprobleemide põhjused olid ravi kallidus ja kehtiva ravikindlustuse puudumine — 81%-l ravi mittesaanutest. Rahalised põhjused olid jällegi enam levinud mitte-eestlaste seas — 87%-l. Eestlastel oli sama näitarv 76%. Hõiveseisundist lähtudes oli raha peaaegu ainuke põhjus töötutel: neist 94% ei saanud seetõttu vajaduse korral hambaarsti vastuvõtule minna. Rahalised põhjused olid kõige sagedasemad Põhja- ja Lääne-Eestis ning kõige väiksema osatähtsusega, kuigi siiski kõige olulisemad, Lõuna-Eestis. Kui Kirde-Eesti kõrvale jätta, on rahalistel põhjustel hambaarsti vastuvõtule mittepääsenute osatähtsus kõigis piirkondades 11–12%. Lõuna- ja Kesk-Eestis suurendavad abi mittesaanute osatähtsust ajapuudus ja transpordiprobleemid.
Sissetulekurühmade järgi erinevad hambaravi mittesaamise põhjused vähem kui kahe ülejäänud arstiabi tüübi puhul. Majanduslikud põhjused on peamised nii all- kui ka ülalpool vaesusriski piiri olevatel isikutel (vastavalt 79% ja 86% abi mittesaanutest), näidates, et hambaravi on sageli liiga kallis ka neile, keda otsene vaesus ei ähvarda.
Hambaravi kättesaadavus

KURITEGEVUS JA TURVALISUS SISSETULEK JA ELAMISTINGIMUSED
Crime and security Income and Living Conditions
30 STATISTIKAAMET
Statistical Office of Estonia
KURITEGEVUS JA TURVALISUS
Selles peatükis kirjeldatakse Eesti elanikkonna turvatunnet ja kokkupuuteid kuritegevusega 2004. aastal. Küsitletavatel paluti vastata, kas nad on viimase aasta jooksul langenud vägivalla ja ähvarduste (sh röövide) ning varavastaste kuritegude (vargused elamust ja autost ning auto ärandamine) ohvriks. Tabel esitab rahvastikurühmade kaupa nende üle 15-aastaste inimeste osatähtsuse, kes on kogenud vähemalt üht isiku- või varavastast kuritegu. Siinkohal on oluline rõhutada, et tegemist ei ole kuritegude arvu, vaid vägivalla ja varguse ohvriks langenud inimeste arvuga.
16-aastased ja vanemad aasta jooksul kuriteo ohvriks langemise, hõiveseisundi ja piirkonna järgi, 2004 Population aged 16 or older by experiences with crime, labour status and region, 2004
Isikuvastased kuriteod
Varavastased kuriteod
on kuriteo ohvriks langenud
ei ole kuriteo ohvriks langenud
on kuriteo ohvriks langenud
ei ole kuriteo ohvriks langenud
Violent crime Property crime have experiences
no experiences
have experiences
no experiences
Hõivatud 6.5 93.5 10.0 90.0 Employed Töötud 10.9 89.1 7.3 92.7 Unemployed Vanadus-pensionärid
3.2 96.5 5.1 94.8 Retired
Muud mitteaktiivsed 7.7 92.0 5.3 94.4 Other inactive Põhja-Eesti 6.0 93.9 9.7 90.3 Northern Estonia Kesk-Eesti 6.2 93.6 5.2 94.5 Central Estonia Kirde-Eesti 8.5 91.3 7.8 92.0 North-Eastern Estonia Lääne-Eesti 3.3 96.7 6.8 93.2 Western Estonia Lõuna-Eesti 6.9 92.9 6.7 93.2 Southern Estonia
Kokku 6.3 93.6 7.9 92.0 Total
2004. aastal oli 6% elanikest langenud viimase aasta jooksul vägivaldse kuriteo ja 8% varavastase kuriteo ohvriks. Vägivallakuritegusid oli kõige enam Kirde-Eestis. Ida-Virumaa 16-aastasest ja vanemast rahvastikust oli kogenud vägivallaakti või ähvardusi 8%, samas kui Lääne-Eestis oli sama näitaja vaid 3%. Ülejäänud piirkonnad jäid nende kahe äärmuse vahele. Varavastaste kuritegude puhul on olukord erinev. Seda tüüpi kuritegude ohvriks langenuid oli enim Põhja-Eestis (10%) ja kõige vähem Kesk-Eestis (5%). Hõivegrupiti on vägivallakuritegude ohvriks langemise tõenäosus suurim töötutel, kellest oli viimase aasta jooksul kogenud vägivalda või ähvardusi 11% (diagramm 24). Samas puutuvad hõivatud kõige sagedamini kokku varavastaste kuritegudega — kümnendik töötavatest elanikest oli viimase aasta jooksul kogenud üht või teist tüüpi vargust. Pensionäride tõenäosus ohvriks langeda on väikseim mõlemat liiki kuriteo puhul. Sissetuleku puhul on vaesusriski piirist kõrgemal olevatel isikutel veidi suurem tõenäosus kogeda varavastast kuritegu, samas kui vaesusriski piirist madalamal olevatel isikutel on suurem risk kokku puutuda vägivalla ja ähvardustega. Need erinevused on aga suhteliselt väikesed.
Tabel A
Table A
Kuriteo ohvriks langemine

SISSETULEK JA ELAMISTINGIMUSED KURITEGEVUS JA TURVALISUS
Income and Living Conditions Crime and security
STATISTIKAAMET 31 Statistical Office of Estonia
16-aastased ja vanemad viimase aasta jooksul kuritegevusega kokkupuutumise ja hõiveseisundi järgi, 2004 Population aged 16 or older by experiences with crime in the past year and labour status, 2004
0 2 4 6 8 10 12
Muud mitteaktiivsedOther inactive
VanaduspensionäridOld-age pensioners
TöötavadEmployed
%
On kogenud vägivalda või ähvardusiExperienced an act of violence or a threat
On kogenud varavastast kuriteguExperienced a property crime
TöötudUnemployed
Järgmisena on tähelepanu keskmes rahvastiku hirm erinevates kohtades kallaletungi või ähvarduste ohvriks langeda. 2004. aastal kartis täiskasvanud elanikest tänaval vägivalla ja ähvardustega kokku puutuda 9%, mõningal määral kartis seal vägivalda ja ähvardusi kogeda 33%. Avalikke kohti ja kodu peeti mõnevõrra turvalisemaks — vastavad näitajad olid avalike kohtade puhul 6% ja 29% ning kodu puhul 2% ja 11%. Järelikult kartis tänaval või avalikus kohas vägivalla ohvriks langeda 43% ning kodus 13% elanikest. Tuleb märkida, et vägivalda, mida kodus kardetakse, ei saa võrdsustada perevägivallaga, kuigi see hõlmab kõigist juhtudest kindlasti teatava osa.
Rahvastikurühmade vahel ilmnevad märkimisväärsed erinevused. Üldjuhul kardavad mehed nii kodust väljas kui ka kodus kallaletunge ja ähvardusi naistest vähem: 53% naistest tõdes, et nad kardavad või kardavad mõningal määral tänaval ja avalikus kohas vägivalla ja ähvarduste ohvriks langeda, samas kui meeste puhul oli sama näitaja 31%. Hõivegrupiti kardavad need, kelle tõenäosus vägivaldse kuriteo ohvriks langeda on suurim, vägivalda kõige vähem. Nii kartis kodust väljaspool vägivallaga kokku puutuda 36% töötutest. Sama näitaja on kõrgeim (46%) pensionäride puhul, kes langevad vägivalla ohvriks kõige harvemini. Pensioniealised tunnevad suurimat hirmu ka kodus — 19% arvas, et nad kardavad kodus vägivalda ja ähvardusi vähemalt mõningal määral. Koduse vägivalla puhul ei ole töötud enam kõige kartmatumad, vaid on 14 protsendiga pensionäride järel teisel kohal. Piirkondlikult on hirm kodust väljaspool kallaletungi ja ähvarduste ohvriks langeda suurim Põhja-Eestis ja väikseim Lääne- ja Kesk-Eestis (diagramm 25). Kartus koduse vägivalla ja ähvarduste ees oli suurim Kirde- ja Lõuna-Eesti elanikel, kellest tundis hirmu 16%. Oma kodu hindavad kõige turvalisemaks Lääne-Eesti elanikud, kellest kartis kodus kallaletungi või ähvarduste ohvriks langeda 7%. Tänaval ja avalikus kohas vägivalla ja ähvarduste ees hirmu tundmises ei olnud sissetulekurühmade vahel erinevusi. Küll aga kartsid vaesusriskis olevad inimesed kodus rünnaku või ähvarduste ohvriks langeda suhteliselt enam.
Diagramm 24
Diagram 24
Turvatunne

KURITEGEVUS JA TURVALISUS SISSETULEK JA ELAMISTINGIMUSED
Crime and security Income and Living Conditions
32 STATISTIKAAMET
Statistical Office of Estonia
16-aastased ja vanemad tänaval ja avalikes kohtades vägivalla ja ähvarduste ees hirmu tundmise ja piirkonna järgi, 2004 Population aged 16 or older by being afraid of violence on the streets and in public places by region, 2004
0
20
40
60
80
100%
Tunneb vägi-valla ees hirmuIs afraid of violence
Ei tunne vägivalla eeshirmu Is not afraidof violence
Põhja-Eesti Northern Estonia
Kesk-EestiCentral Estonia
Lõuna-Eesti Southern Estonia
Kirde-EestiNortheasternEstonia
Lääne-EestiWestern Estonia
PiirkondRegion
Üks võimalus potentsiaalset ohtu vältida on võtta tarvitusele ettevaatusabinõusid. Siinkohal on eristatud kolme liiki meetmeid — ettevaatlikkus (üksinda ja pimedas väljas mittekäimine, ohtlike kohtade vältimine jms), enesekaitsevahendi (gaasipihusti, püstoli või noa) või koera omamine ning turvateenuste kasutamine (turvaluku või alarmsüsteemi paigaldamine). Enamik Eesti elanikest (70%) olid teadlikult ettevaatlikud, et vähendada kuritegevuse ohvriks langemise ohtu. Kaks ülejäänud meetmete liiki on märksa vähem levinud: 29% inimestest kasutas turvateenuseid ning 17% kandis pidevalt kaasas mõnd enesekaitsevahendit või oli neil kaitseks koer.
Tõenäosus, millega neid abinõusid rakendatakse, on rahvastikurühmadel erinev. Nii näiteks olid mitte-eestlased eestlastega võrreldes ettevaatlikumad, vastavad näitarvud on 75% ja 68%, ja kasutasid enam turvateenuseid, vastavalt 36% ja 26%. Nendesse hõivegruppidesse kuuluvad isikud, kellel on oht isikuvastaste kuritegude ohvriks langeda suurim, võtavad kasutusele kõige vähem ettevaatusabinõusid. Vaid 58% töötutest olid ettevaatlikud ning 23% kasutas turvateenuseid. Pensioniealised kasutasid turvateenuseid küll kõige harvemini (20%), kuid olid samas kõige ettevaatlikumad: 77% neist vältis ohtlikke kohti või rakendas muid sarnaseid abinõusid. Kõige ettevaatlikumad olid Põhja- ja Kirde-Eesti elanikud, näitarvud vastavalt 78% ja 77%. Need on ka kaks piirkonda, kus turvateenused on kõige enam levinud. Siiski on see abinõu märksa olulisem Põhja-Eestis, kus 52% elanikest oli paigaldanud turvaluku või alarmsüsteemi, mis on 30 protsendipunkti kõrgem näitaja kui Kirde-Eestis. Lääne-Eesti elanikud kasutasid igat tüüpi ettevaatusabinõusid kõige harvemini — vaid 46% selle piirkonna elanikest olid teadlikult ettevaatlikud ning 10% kasutas turvateenuseid.
Diagramm 25
Diagram 25
Turvalisuse tagamise meetmed
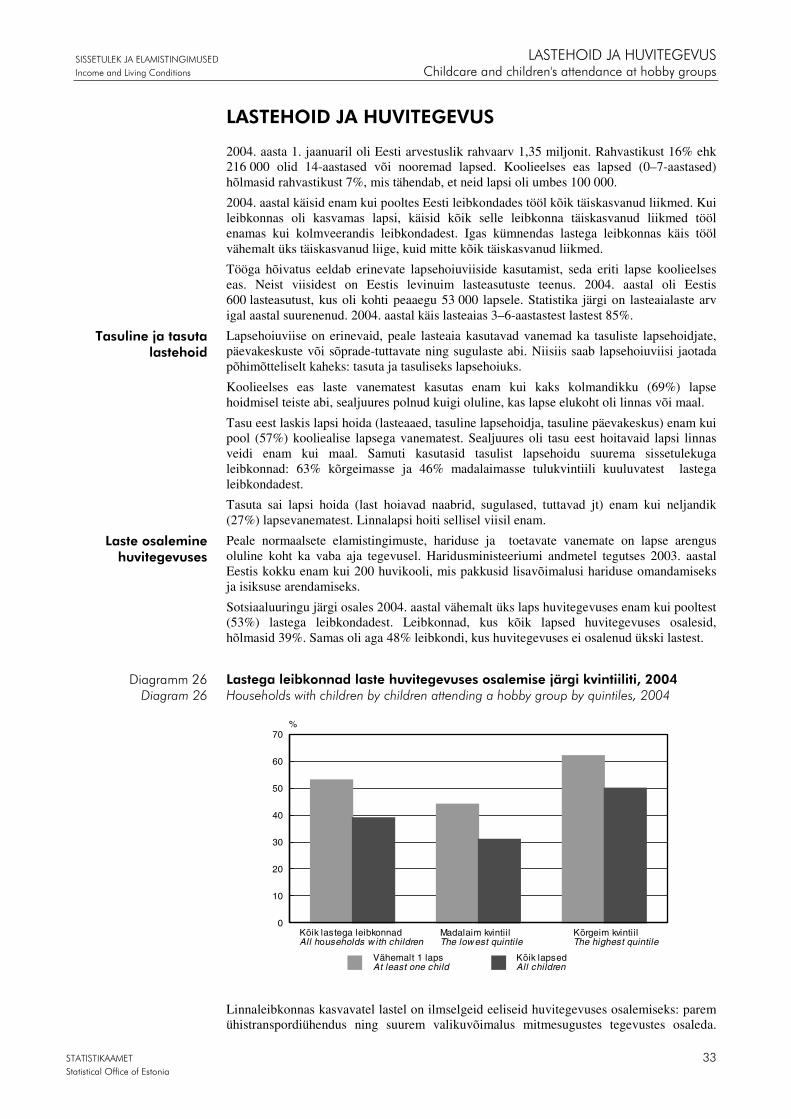
SISSETULEK JA ELAMISTINGIMUSED LASTEHOID JA HUVITEGEVUS
Income and Living Conditions Childcare and children's attendance at hobby groups
STATISTIKAAMET 33 Statistical Office of Estonia
LASTEHOID JA HUVITEGEVUS
2004. aasta 1. jaanuaril oli Eesti arvestuslik rahvaarv 1,35 miljonit. Rahvastikust 16% ehk 216 000 olid 14-aastased või nooremad lapsed. Koolieelses eas lapsed (0–7-aastased) hõlmasid rahvastikust 7%, mis tähendab, et neid lapsi oli umbes 100 000.
2004. aastal käisid enam kui pooltes Eesti leibkondades tööl kõik täiskasvanud liikmed. Kui leibkonnas oli kasvamas lapsi, käisid kõik selle leibkonna täiskasvanud liikmed tööl enamas kui kolmveerandis leibkondadest. Igas kümnendas lastega leibkonnas käis tööl vähemalt üks täiskasvanud liige, kuid mitte kõik täiskasvanud liikmed.
Tööga hõivatus eeldab erinevate lapsehoiuviiside kasutamist, seda eriti lapse koolieelses eas. Neist viisidest on Eestis levinuim lasteasutuste teenus. 2004. aastal oli Eestis 600 lasteasutust, kus oli kohti peaaegu 53 000 lapsele. Statistika järgi on lasteaialaste arv igal aastal suurenenud. 2004. aastal käis lasteaias 3–6-aastastest lastest 85%.
Lapsehoiuviise on erinevaid, peale lasteaia kasutavad vanemad ka tasuliste lapsehoidjate, päevakeskuste või sõprade-tuttavate ning sugulaste abi. Niisiis saab lapsehoiuviisi jaotada põhimõtteliselt kaheks: tasuta ja tasuliseks lapsehoiuks.
Koolieelses eas laste vanematest kasutas enam kui kaks kolmandikku (69%) lapse hoidmisel teiste abi, sealjuures polnud kuigi oluline, kas lapse elukoht oli linnas või maal.
Tasu eest laskis lapsi hoida (lasteaaed, tasuline lapsehoidja, tasuline päevakeskus) enam kui pool (57%) kooliealise lapsega vanematest. Sealjuures oli tasu eest hoitavaid lapsi linnas veidi enam kui maal. Samuti kasutasid tasulist lapsehoidu suurema sissetulekuga leibkonnad: 63% kõrgeimasse ja 46% madalaimasse tulukvintiili kuuluvatest lastega leibkondadest.
Tasuta sai lapsi hoida (last hoiavad naabrid, sugulased, tuttavad jt) enam kui neljandik (27%) lapsevanematest. Linnalapsi hoiti sellisel viisil enam.
Peale normaalsete elamistingimuste, hariduse ja toetavate vanemate on lapse arengus oluline koht ka vaba aja tegevusel. Haridusministeeriumi andmetel tegutses 2003. aastal Eestis kokku enam kui 200 huvikooli, mis pakkusid lisavõimalusi hariduse omandamiseks ja isiksuse arendamiseks.
Sotsiaaluuringu järgi osales 2004. aastal vähemalt üks laps huvitegevuses enam kui pooltest (53%) lastega leibkondadest. Leibkonnad, kus kõik lapsed huvitegevuses osalesid, hõlmasid 39%. Samas oli aga 48% leibkondi, kus huvitegevuses ei osalenud ükski lastest.
Lastega leibkonnad laste huvitegevuses osalemise järgi kvintiiliti, 2004 Households with children by children attending a hobby group by quintiles, 2004
0
10
20
30
40
50
60
70%
Vähemalt 1 lapsAt least one child
Kõik lapsedAll children
Madalaim kvintiilThe lowest quintile
Kõrgeim kvintiilThe highest quintile
Kõik lastega leibkonnadAll households w ith children
Linnaleibkonnas kasvavatel lastel on ilmselgeid eeliseid huvitegevuses osalemiseks: parem ühistranspordiühendus ning suurem valikuvõimalus mitmesugustes tegevustes osaleda.
Tasuline ja tasuta lastehoid
Laste osalemine huvitegevuses
Diagramm 26 Diagram 26

LASTEHOID JA HUVITEGEVUS SISSETULEK JA ELAMISTINGIMUSED
Childcare and children's attendance at hobby groups Income and Living Conditions
34 STATISTIKAAMET
Statistical Office of Estonia
Ilmselt seetõttu oli linnaleibkondade seas rohkem neid, kus vähemalt üks lastest huvitegevuses osales (55%), ning ka neid, kus seda tegid kõik leibkonda kuuluvad lapsed. Maaleibkondadest osalesid kõik lapsed huvitegevuses lastega leibkondadest kolmandikus.
Laste huvitegevuses osalemine on seda tõenäolisem, mida kõrgem on vanema haridustase. Nii tegeles huvidega 61% nende leibkondade lastest, kus leibkonnapeal oli kolmanda taseme haridus. Samas osales esimese ja madalama taseme haridusega leibkonnapeaga leibkondadest huvitegevuses vähemalt üks laps vaid 39%-l.
Laste arv leibkonnas pole eriti oluline tegur, mis mõjutaks laste osalemist huvitegevuses. Nii võttis huvitegevusest osa vähemalt üks laps enam kui kahes kolmandikus kolme ja enama lapsega leibkondadest. Ühe lapsega leibkondadest osales laps huvitegevuses vähem kui pooltes, kuid see võis olla tingitud ka laste vanusest, sest tõenäoliselt oli nende hulgas palju huvitegevuseks liiga väikese lapsega leibkondi. Samuti oli selliseid leibkondi, kus vähemalt üks lastest huvitegevusega tegeles, vähem mitteaktiivsete leibkondade seas (35%).
Laste huvitegevuses osalemine ja leibkonna sissetulek on omavahel seotud. Mida suurem on leibkonna sissetulek, seda tõenäolisemalt laps huvitegevuses osaleb. Madalaimasse tulukvintiili kuuluvatest leibkondadest oli 45% neid, kus vähemalt üks laps huvitegevusega tegeles. Kõrgeimas tulukvintiilis oli selliseid leibkondi 62%. Samuti oli vaesusriski piirist suurema sissetulekuga leibkondade seas enam neid (55%), kus huvitegevusega oli seotud vähemalt üks laps, kui neid leibkondi, kus ükski laps huvitegevuses ei osalenud. Vaesusriski piirist väiksema sissetulekuga leibkondadest 56%-l ei osalenud huvitegevuses ükski laps.
Üldse osales huvitegevuses 45% kuni 14-aastastest lastest. Enamik neist (57%) kulutas huvitegevusele kuni kaks tundi nädalas. Neljandik kuni 14-aastastest kulutas aga huvi-tegevusele nädalas kaks kuni neli tundi. Peaaegu viiendik (18%) kuni 14-aastastest huvitegevuses osalenud lastest tegeles huvitegevusega nädalas üle nelja tunni.
Laste osalemine huvitegevuses vanuse järgi, 2004 Children attending a hobby group by age, 2004
0 10 000 20 000 30 000 40 000 50 000 60 000 70 000 80 000 90 000
Laste arv Number of children
Osaleb huvitegevusesAttending a hobby group
Laste arv All children
Koolieelses easPre-school-aged
Vanemad kooliealised Older school-aged
Nooremad kooliealisedYounger school-aged
Agaramalt võtsid huvitegevusest osa nooremas koolieas (7–11-aastased) lapsed — 67% neist. 38% neist tegeles sellega nädalas kuni kaks tundi. Niisama palju oli neid, kellel huvitegevus hõlmas kaks kuni neli tundi. Peaaegu neljandik (24%) nooremas koolieas huvitegevuses osalenud lastest tegeles huvitegevusega nädalas üle nelja tunni.
Vanemas koolieas (11–14-aastased) oli huvitegevuses osalevaid lapsi veidi vähem — 61%. Kuni kaks tundi oli huvitegevusega hõivatud 37% ja kaks kuni neli tundi peaaegu kolmandik (30%). Pisut rohkem oli neid, kellel kulus nädalas huvitegevusele üle nelja tunni.
Huvitegevus ja leibkonna sissetulek
Diagramm 27 Diagram 27
SISSETULEK JA ELAMISTINGIMUSED SAATEKSIncome and Living Conditions Foreword
STATISTIKAAMET 35 Statistical Office of Estonia
Foreword
In the past fifteen years, the European Union has ceased to be a solely economic association and has developed a social dimension. Its most important manifestations are the decision to implement the method of open coordination in the domain of social policy and to set joint objectives for reducing social exclusion. To be able to monitor how successful the Member States have been in fulfilling these objectives, it is necessary to have common criteria against which the progress of Member States could be judged.
A large step towards creating this common standard was the establishment of the European system of indicators designed to measure social exclusion, known more widely as Laeken indicators. Yet in order to obtain measures that are completely comparable between countries, it is not enough to agree on the methods to be used for their calculation. In addition, the data that are utilised to arrive at indicators have to be collected following the same principles. Up until recently there was no such unified data source and all Member States and acceding countries used their national data. In 2003, a regulation establishing a common framework of statistics on income and living conditions (EU-SILC) was adopted, requiring all Member States to collect data for measuring social exclusion based on the same commonly agreed principles.
In Estonia, the EU-SILC implementation process began already in 2001. Finally in 2004 after thorough testing and piloting process, the Statistical Office was ready to launch a completely new survey, entitled the Estonian Social Survey. This puts us to the forefront of the new Member States, as all other countries that joined the European Union in 2004 started their respective surveys a year later.
The Social Survey is in several ways a unique experience for the Statistical Office as well as for Estonia as a whole. On the one hand, it is the first time ever the Statistical Office is carrying out a panel survey. Panel survey stands, in the parlance of statisticians, for a survey, which involves interviewing the same people in consecutive years, allowing thus the calculation of indicators reflecting the changes on the individual levels. A feat that is not possible with data from regular cross-sectional surveys.
Secondly, the Social Survey marks the first occasion when the data on annual income are collected. Up until now annual income was derived from monthly income measures obtained from the Household Budget Survey. Yet the monthly income of a household is not necessarily representative to its annual income level. For this reason, annual income data are more widely used internationally and also recommended by international statistical bodies mainly for calculation of welfare measures.
The Social Survey and the Household Budget Survey follow in several regards different methodological principles when measuring the income. In addition to the difference between annual and monthly income, discussed earlier, there are also discrepancies in the definition of income — i.e. what is considered to be part of income and what is not, in research design, in the use of equivalence scales to be discussed in greater detail in income section and so on. The Household Budget Survey is mainly focused on measuring the expenditure of households and by that also the consumption. The expenditure and coping of the household is treated in relation to the monthly income, which is the amount of resources that can be used during this period. The Social Survey, on the other hand, is not suitable for measuring short-term processes and is instead designed to capture more long-term phenomena, such as poverty and social exclusion. It is thus not reasonable to compare the income statistics calculated on the bases of two surveys. The user of statistical data has to make the decision between using the annual and monthly income depending on his/her needs and on what it is that has to be measured.
This publication marks the first step for the Statistical Office in moving away from using monthly income towards using annual income. Our motivation is to ascertain the comparability of data with the rest of the European Union and a desire to implement internationally accepted principles for creating precise and reliable statistics. This publication is the first time that the results of the Social Survey are published. In addition to income and its closely related concept of poverty, other somewhat ‘lighter’ yet equally interesting topics, such as health, access to health care and feeling of security, are discussed.
We are grateful to everyone who has been instrumental in the completion of this publication and wish all the readers fascinating moments in the world of statistics!
Mari Toomse Leading Statistician
SISSETULEK SISSETULEK JA ELAMISTINGIMUSED
Income Income and Living Conditions
36 STATISTIKAAMET
Statistical Office of Estonia
Income
In this publication, income includes employee cash and near cash income, income from rental of a property or land, regular inter-household cash transfer received, social benefits (old-age benefits, children-related allowances, etc.), interest, dividends, profit from capital investments in unincorporated business and receipts for tax adjustments. From this sum, repayments for tax adjustments, regular inter-household cash transfer paid and regular taxes on wealth are subtracted. For income calculations, annual total disposable income is used. It means that tax on income, social tax and other taxes are withheld. To get the total disposable household income, income from all household members is added up and related to the number of household members.
To get the average income per household member, it is necessary to take into account that some of the income is spent on the whole household and some of it is spent variously on members depending on their age. This means, for example, that total expenditure of one household with two members is smaller than the sum of expenditures if both members lived alone. That is because of some products (car, furniture, consumer durables, etc.) could be consumed together and many goods are cheaper when brought in bulk. To take into account of this “spearing effect”, equivalence scales should be used while calculating households’ disposable income. Income must be therefore understood as equalised disposable income that is defined as the household's total disposable income divided by its equivalent size. In this publication, modified OECD equivalence scale is used. This scale is also officially recommended by Eurostat. The equalised household size gives a weight of 1.0 to the first adult, 0.5 to other household members aged 14 or over and 0.3 to household members aged less than 14. For example household with two adults and two children has the equalised size of 1+0.5+0.3+0.3=2.1. Suppose that this household has a total disposable income of 120,000 kroons per year. When households “sparing effect” is ignored and households total income is divided by the number of household members (in other words equivalence scale of 1: 1: 1 is used), income per household member in this household would be 30,000 kroons. While using consumption scale of 1: 0.5: 0.3 income per consumption unit is (120,000/2.1) 57,143 kroons per year.
The application of this equivalence scale helps to reduce the impact of differences in household structure on the evaluation of household poverty. In the following text income is to be understood as equalised disposable income.
The average yearly income in 2003 amounted to 49,820 kroons per consumption unit. Median income amounted to 35,419 kroons.
Income deciles and quintiles
Income deciles and quintiles reflect income distribution in society. For finding these divisions, income received by consumption unit is divided into ten or five equal segments. These segments are called deciles or quintiles, respectively. The first decile includes people with one tenth of lowest income and the last decile one tenth of highest-income population. Likewise, the first quintile includes people with lowest fifth of income and last quintile people with highest fifth of income.
In 2003, the average equalised income of population in the last decile was 162,426 kroons and in the first decile 7,005 kroons per year. People in the tenth decile received 32% of the total income of all population, which is about the same as income received by six lowest deciles together (31%) (Diagram 1 on page 8 ).
As decile-based analyses bring out atypically low and high income, it is reasonable to follow quintile distribution to reduce random errors in estimates. In 2003, average yearly disposable income in the lowest quintile was 13,084 kroons and in the highest quintile 121,905 kroons (Diagram 2 on page 8).
To understand the causes of poverty, it is important to study the background of people in the first quintile. Slightly more than half (51%) of the lowest-income population lived in urban areas, mostly in Southern Estonia. The proportion of the lowest-income population was large also in North-Eastern Estonia (26%). In Northern Estonia, the proportion of people in the first quintile was the smallest. This can be so due to the fact that in 2003 according to wages and salaries statistics the average net wages and salaries were highest
Equalised income
Distribution of population groups
into quintiles
SISSETULEK JA ELAMISTINGIMUSED SISSETULEK
Income and Living Conditions Income
STATISTIKAAMET 37 Statistical Office of Estonia
in Northern Estonia and Tallinn. As income from work can be one of the main ways of escaping poverty, one should also consider the fact that on the basis of the Estonian Labour Force Survey (ELFS) labour force participation rate was highest in Northern Estonia.
It is also evident that more than half (51%) of unemployed population come under lowest income quintile. Also large proportion of self-employed (38%) and other economically inactive (30%) population come under first quintile. Still, 17% of retired population belong to the first quintile. The fact that retired people tend to fall rather into the second (36%) and third income quintile (28%) indicates that retirement benefits in Estonia are mostly sufficient to prevent falling into the group of lowest-income persons, yet, it is not sufficient to attain the level of national average. However, confirming the fact that steady income from labour market helps to escape poverty, one should mention that only 8% of employed population came under the first income quintile.
Although ethnic nationality is not so important factor in quintile division, it has still some tendency. Estonians tend to fall more into higher income quintiles and non-Estonians into lower quintiles.
By household type, the first quintile included 40% of all people living in single parent households, 32% of single persons aged less than 65 years and 23% of people living in households of a couple with at least three children. As in the first income quintile there is 7% of population in households with a couple aged over 65 years and yet 20% of the same-aged single persons, it is evident that retirement benefits are not sufficient for coping for one person (Diagram 3 on page 9).
Income differences by regions
There is a significant difference between the income level of households living in urban and rural areas. In 2003, average equalised income earned by rural population was 42,995 kroons per year, 8,582 kroons lower than the average, whereas the income earned by urban population was quite close to the average, 52,598 kroons per year. This is partly due to the difference in the proportion of employed persons in the population. In 2003, the employment rate for population aged 15–74 was, on the basis of ELFS, 58% in urban areas and 53% in rural areas. Examining population in different type of settlement by main source of income, it can be noticed that income in urban areas is bigger than in rural areas, irrespective of the main source of households’ income.
As only 29% of population live in rural areas, the income of urban population had more significant impact on the average yearly income.
By counties the average yearly equalised income varied from 34,720 kroons in Jõgeva county to 63,636 kroons in Harju county. The difference between income in Harju county and Pärnu county, which had the second highest average income (51,239 kroons per year) is quite large. As, on the basis of business statistics, the capital, Tallinn, accounts for 43% of all companies and organizations registered in the Commercial Register, Non-Profit Associations and Foundations Register, and is included in Harju county, it is evident that in this district the average equalised income is the highest. Average equalised income in all other counties is below the national average. This is also mostly affected by large proportion of people living in Harju county (38%).
People living in Jõgeva county earned almost 50% less than people in Harju county. Such a low average income can be due to very high unemployment rate (16%) in Jõgeva county. On the basis of wages and salaries statistics, also average net wages and salaries in this area were significantly below the national average in 2003.
Households who had employment as their main source of income had highest equalised income in Harju county and lowest in Ida-Viru county. The latter can be affected by the highest unemployment rate (18%) in Ida-Viru county. However, among households with main income from other sources, equalised income was highest in Lääne county and lowest in Lääne-Viru county (Thematic map 1 on page 10).
Income in counties
SISSETULEK SISSETULEK JA ELAMISTINGIMUSED
Income Income and Living Conditions
38 STATISTIKAAMET
Statistical Office of Estonia
As most counties cover less than 5% of population, it is reasonable to examine income in different regions of the country. While Northern Estonia covers only Harju county, it is also the region with the highest average equalised income. The lowest average equalised income was earned by people living in North-Eastern Estonia, 34,876 kroons per year.
By ethnic composition of household, differences in most regions were quite small. The biggest difference was in Northern Estonia; equalised income in Estonian households was 73,380 kroons while equalised income in non-Estonian households was less than 70% of that amount, 50,597 kroons.
In most of the regions, the lowest equalised income was earned by people living in households with one member aged over 65 or in single parent households. The highest equalised income was earned by people in households with a couple, in which at least one partner was aged under 65 or a couple with one child.
Examining equalised income by gender of head of the household indicates that in all regions households with a male head of the household tend to earn more than the ones with a female head. Generic difference was the highest in Northern Estonia; households with a male head of the household earned 1.6 times more income, 78,978 kroons per household member compared to 48,919 kroons per member. Differences in equalised income concerning gender of head of the household were slightly higher in urban areas than in rural areas.
It is also important to study income differences by regions by level of education of head of the household. The difference between equalised income of households with head of the household with ISCED lowest and highest level of education was slightly higher in urban areas than in rural areas. By region, this difference was highest in Northern Estonia; equalised income among households with head of the household with tertiary education was 2.6 times higher than the one with head of the household with below upper secondary education (85,469 kroons and 33,197 kroons, respectively). The difference was lowest in North-Eastern Estonia; equalised income among households with head of the household having tertiary education 38,670 kroons per year, compared to 27,503 kroons per year among households with head of the household having below upper secondary education (Diagram 4 on page 11).
Income by structure of household
Examining income by household size is quite problematic. As in households with the same number of household members, there can be people with different labour status, like employed or unemployed people, children or retired persons, household income level and sources may differ a lot. Therefore it is reasonable to study income not by household size but rather by household type.
Households can be divided into 10 groups by household composition: single person aged under 65; single person aged over 65; couple in which at least one partner is aged under 65; couple aged over 65; single parent with child/children; couple with one child; couple with two children; couple with at least three children and couple with minor and adult children. Households that do not fall into any of these groups are considered as other type of households.
In 2003, the average yearly equalised income differed up to 2.4 times, depending on the type of household. Equalised income was highest in households consisting of a couple with one child (69,756 kroons per year) or a couple in which at least on partner was aged under 65 (69,169 kroons per year). In households consisting of one person aged over 65, average yearly equalised income amounted only to 56% of the national average (28,844 kroons).
The equalised income of single parent households (32,624 kroons per year) remained considerably below the national average. It should be also pointed out that among single parent households 73% of heads of the households were employed and 19% were economically inactive.
Although having at least one grown-up child in the household enables the parents to spend more time on earning a living, still most of the adult children studied and had no earnings. Therefore, the average income per consumption unit among households consisting of
Regional differences in income
Income and type of household

SISSETULEK JA ELAMISTINGIMUSED SISSETULEK
Income and Living Conditions Income
STATISTIKAAMET 39 Statistical Office of Estonia
couple with minor and adult children was slightly below the national average (49,219 kroons).
Within couples with minor children, the average yearly income per consumption unit decreases with the increase of the number of children in the households. Among households with couple and one child, equalised income was 1.4 times higher than national average. Among households consisting of couple and two children, income per household member was slightly over national average (53,726 kroons). For households with couple and three or more children, average income per household member was already below the national average (44,560 kroons). Studying the proportion of households, couples with three or more children accounted for only 2.2% of all households, whereas households consisting of couple with one child and two children accounted for 8.7% and 6.2%, respectively.
Comparing one person households shows that people aged less than 65 years earned 1.9 times more income (53,853 kroons per year) than people aged 65 or more. It is evident that most people among the latter are retired but it should also be pointed out that although among single persons under 65 years 55% were employed; there were also 10% of unemployed and 24% retired people. The same tendency in incomes can be seen when comparing households consisting of couples in which at least one partner is aged under 65 or both members are 65 years or more.
As income must be understood as equalised income, the proportion of income that is meant to be spent on the whole household, is bigger in one-person household’s income per household member. Therefore, it is evident that under the same amounts of income earned by household members, income per consumption unit in two-person household is higher than in one-person households (Diagram 5 on page 12).
Examining incomes among different types of households by the level of education of head of the household indicates that among households where head of the household has below upper secondary education, average yearly equalised income among different household types does not vary much, remaining constantly around 25,000 kroons per household member. Only among households consisting of two adults equalised income is clearly higher, around 35,000 kroons.
In households where the head of the household has upper secondary or tertiary education the difference between the average equalised income per consumption unit among household types comes out more clearly. For two higher levels of education, equalised income of people in households consisting of a couple in which at least one partner is aged under 65 or a couple with one child is the highest. The lowest average equalised income per consumption unit is for both levels among single persons aged 65 or more (30,011 kroons and 35,456 kroons). For households with head of the household below upper secondary education the average yearly equalised income among single persons aged 65 or more is 25,124 kroons per household member. Hence, for retired people education does not have much effect on income.
The biggest difference in income comparing the lowest and highest level of education is among households containing one person aged under 65. People with tertiary education earn 3.4 times higher equalised income than those with below upper secondary education (85,515 kroons and 25,027 kroons, respectively) (Diagram 6 on page 13).
As among households where education level of head of the household is highest, male heads of the households tend to earn 1.8 times higher equalised income than female heads of the households, it also affects equalised income among different household types according to the gender of the head of the household. Within the first and second level of education male heads of the households tend to earn 1.3 times more than female. Income difference comes out most clearly among households consisting of a couple in which at least one partner is aged under 65. In this type of household, the average yearly income within households with male head of the household was 78,823 kroons per consumption unit, whereas with female head of the household the average income per consumption unit amounted to 52,685 kroons.
Income and education of head of
the household
VAESUS SISSETULEK JA ELAMISTINGIMUSED
Poverty Income and Living Conditions
40 STATISTIKAAMET
Statistical Office of Estonia
Poverty
Poverty can be defined as inability to attain a basic standard of living due to the insufficiency of material resources. It is measured in terms of income distribution with no reference to other influences such as education, expenditure, etc.
On the basis of Eurosat methodology, which is mostly used in Europe, poor are those whose equalised income is below 60% of the national median equalised income. This margin is called at-risk-of poverty threshold.
In 2003, the at-risk-of-poverty threshold was 23,303 kroons per year, which means that people who received equalised income less than 23,303 kroons per year were considered as being poor. In 2003, 22% of Estonian population had to manage with lower equalised income than 60% of the national median.
To find out the main reasons of poverty and to be able to improve social protection, it is important to study background of the people living in poverty risk.
In 2003, people aged 0–15 and 45–54 were in relatively worst situation; at-risk-of-poverty rate for both age groups being 24%. Examining also gender for age breakdown shows that females aged 16–24 were in slightly worse situation; 26% of them had equalised income below the at-risk-of-poverty threshold. As people at that age are usually still studying, they do not have steady income themselves and they have to cope with the financial help of other household members. Therefore it is evident that most of 16–24-year-olds (65%) declared themselves as economically inactive. Although 19% of them were employed, the share of working population among females was only 13%. Among males, the highest at-risk-of-poverty rate was for 45–54-year-olds (26%), although only 10% defined themselves as unemployed (Diagram 7 on page 14).
As having a job, and therefore steady income, is one of the main ways of escaping poverty, at-risk-of-poverty rate among employed population was smallest (9%). Hence, it is not surprising that more than half of the unemployed population (57%) had equalised income below at-risk-of-poverty threshold. Examining unemployed population more closely shows that quite a big share of them (30%) were aged 45–54 and 41% of the unemployed people were non-Estonians. Among retired population, 23% were living in the risk of poverty, whereby generic difference was not remarkable. Among other economically inactive persons 31% had equalised income below at-risk-of-poverty threshold, yet difference among males and females was quite considerable; at-risk-of-poverty rate among males was 25% and among females 34%. It should also be pointed out that 13% of economically inactive females were living in single parent households (Diagram 8 on page 15).
Examining at-risk-of-poverty rate by tenure status of the household indicates that the share of people living in the risk of poverty among tenants is almost twice as high as among owners or rent-frees, 40% and 21%, respectively.
One important factor for getting well-paid job is education. For population aged 16 or older the at-risk-of-poverty rate for people with below upper secondary education was highest (27%). The share of population living in the risk of poverty among people with two higher levels of education was already lower than the national average. The at-risk-of-poverty rate among population with upper secondary education was 18% and with tertiary education 12%. Having good education does not assure good financial conditions yet it decreases considerably the chances to fall into risk group of poverty (Diagram 9 on page 15 ).
By household type, people living in single parent households are in relatively worse situation; 41% of these households have to cope with equalised income below the at-risk-of-poverty threshold. Also people in single person households are in quite bad situation; 34% of people aged under 65 in single person households and 30% aged 65 or older are considered as poor population. It is evident that most of the one-person households with members aged 65 or more (93%) are retired, but also among one-person households with people aged under 65 24% are retired. It should be also pointed out that for 16% of the single parent households, head of the household is economically inactive and for 91% the head of the households is female. Also single person households consist mostly of females. The share of single-person female households with people aged under 65 is 59% and with people aged 65 or more 79%.
Poverty and age
Poverty and education
SISSETULEK JA ELAMISTINGIMUSED VAESUS
Income and Living Conditions Poverty
STATISTIKAAMET 41 Statistical Office of Estonia
To help people to cope, state and local authorities allocate social benefits to relieve people from the financial burden of number of risks and needs. However, to verify whether these benefits justify themselves and to find out how to improve all kinds of benefits, these allowances should be measured in context of income.
One possible way to measure the effect of social transfers is to examine income before social transfers. Leaving the at-risk-of-poverty threshold unchanged, two at-risk-of-poverty rates can be calculated: at-risk-of-poverty rate before social transfers but including pensions and at-risk-of-poverty rate before all social transfers (excludes also pensions).
Leaving transfers (excluding pensions) out from the income the share of people living below the at-risk-of-poverty threshold would rise 6 percentage points, to 28%. Leaving out all transfers increases the at-risk-of-poverty rate 20 percentage points, to 42%. Thus, all transfers decrease the at-risk-of-poverty rate 0.48 times and the effect of pensions is more than twice of the effect of other transfers (Diagram 10 on page 16).
By regions, the effect of pensions was greatest in Northern Estonia; pensions decreased the at-risk-of-poverty rate 0.42 times, from 31% to 18%. Other social transfers had most effect in Central Estonia and Southern Estonia, decreasing the at-risk-of-poverty rate 0.2 times.
Without any financial help from the state, more than half of the population in North-Eastern Estonia and Southern Estonia would live in the risk of poverty, 54% and 51%, respectively.
To get the correct view of inequality in society, the intensity of poverty should also be measured.
Median at-risk-of-poverty gap is calculated as the difference between the at-risk-of-poverty threshold and the median income of population below the at-risk-of-poverty threshold and it is expressed as a percentage of the poverty threshold. It measures how far below the threshold the income of people at-risk-of-poverty is, i.e. how poor the poor are. In 2003, the median at-risk-of-poverty gap was 32%. Thus, half of the population at-risk-of-poverty had equalised income below 68% of the at-risk-of-poverty threshold, that is below 15,846 kroons per year.
The at-risk-of-poverty gap was highest among population aged 16–24-years, 45%. Hence half of the population in that age group living in the risk of poverty had yearly equalised income below 12,817 kroons per consumption unit. At-risk-of-poverty gap was the lowest among population aged 65 and more; the at-risk-of-poverty gap was 14% and yearly median equalised income earned by people aged 65 or more was below 86% of the at-risk-of-poverty threshold, i.e. 20,041 kroons per year.
Effect of social transfers
Intensity of poverty
ELAMISTINGIMUSED SISSETULEK JA ELAMISTINGIMUSED
Living conditions Income and Living Conditions
42 STATISTIKAAMET
Statistical Office of Estonia
Living conditions
Above all the dwelling and the infrastructure surrounding it are considered as living conditions. First of all the existence of conveniences and spaciousness characterize the state of the dwelling, safety and the factors influencing health: noisiness, greenery, pollution etc. — the environment surrounding the dwelling. The living conditions of the household are in close connection with the general subsistence and simultaneously also affect essentially the general living.
The construction of dwellings at the period before Estonia became independent concentrated in the first place on the building of big blocks of flats. According to the data of the Construction Works Register mainly blocks of flats were built from the mid-sixties until the beginning of nineties and detached houses (one-family, two-family dwellings and terraced houses) accounted for less than 10% of the number of dwellings being built. This is also the main reason why more than two thirds of Estonian households live in blocks of flats. The construction of blocks of flats was more active in urban districts, thus urban households live in blocks of flats twice as often as rural households. As the urban households have higher average income than the rural, but the rural households live more often in detached houses, then the quantity of income does not affect essentially the type of the household’s dwelling. So almost a third (29%) of the members of the household with lower income (the lowest quintile) live in detached houses, when 28% of the members of the household belonging to the highest quintile live in detached houses (Diagram 11 on page 17).
While a large part of the detached houses (72%) has been built before 1970, the building year of blocks of flats remains mainly between 1960–1990 (75%). Besides, the dwellings of rural households have been built in the earlier years: so 56% of the dwellings of rural households have been built before 1970, when among urban households’ dwellings 47% have been built so early.
When the type of the dwelling does not depend on the income of the household, then considering the type of the dwelling and the year of building and the belonging of household members to the income quintile it must be noted that a detached house of the household member belonging to the quintile of lower income has been built considerably earlier compared to a detached house of the household member of the highest quintile. Thus the detached house of the member of the household belonging to the quintile of lower income has been more often built before 1970, at the same time detached houses of a quarter of households belonging to the higher income quintile have been built in 1991 and later.
More than 60% of Estonian population irrespective of the income group have everyday possibilities of hygiene: flush toilet and bath or shower. But among the people with higher income there are more those who live in the dwelling where there is flush toilet and bath or shower. The existence of sauna does not depend on the income of the household and a fourth of Estonian population have a possibility to use a sauna.
Observing the everyday possibilities of hygiene and the existence of children in the household, it can be noted that households with children live in somewhat better conditions than households without children. Among the households with children there are more households who have a flush toilet, bath or shower or sauna. Households with children live in dwellings built later than the dwellings of households without children.
Comparing the floor area of dwellings and the number of children in the household, it must be stated that each additional child increases household’s lack of space. More than half (56%) of households without children have more than one room per member and in more than a third (36%) households the number of rooms equals the number of household members. A fifth (22%) of households with one child and almost every tenth household (10%) of households with two children have more than one room per member (Diagram 12 on page 18).
Speaking of the living conditions, the household’s self-assessment to the state of its dwelling is important. A fifth of households (23%) consider rotten window frames or floor to be a problem. 15% of the households are concerned about damp walls, floor or basement. Every tenth household (9%) is worried about too dark dwelling where there is not enough light. 8% of the households are facing the problem that the ceiling of their
Type of dwelling
State of dwelling
SISSETULEK JA ELAMISTINGIMUSED ELAMISTINGIMUSED Income and Living Conditions Living conditions
STATISTIKAAMET 43 Statistical Office of Estonia
dwelling leaks. All these problems appear naturally in case of the earlier built houses, the above mentioned problems are also reported more often by rural households.
The main problem of the members of households with lower income regarding the state of the dwelling is rotten window frames or floor (almost a third of the members of households belonging to the quintile of the lowest income). A fifth of the members of households with lower income have a problem with damp walls, floors or basement.
An important part of good living conditions besides the material is the safety of the dwelling’s surroundings. Crime, violence or vandalism in the vicinity of the dwelling is one of the biggest problem and that regardless of the household’s income. More than a fourth (27%) of Estonian households consider the vicinity of their dwellings unsafe, in doing so, almost a third (31%) of urban and a fifth (19%) of rural households consider it a problem (Diagram 13 on page 19).
In the opinion of households with children compared to those without children, there are more problems with crime, violence or vandalism in the vicinity of the dwelling. Unsafe surroundings is a problem for a fourth of the members of households with the lowest and almost for a third of those with the highest income quintile.
In addition to the dwelling’s conveniences, good state and safety in the surroundings of the dwelling, also the pollution and noisiness of the dwelling’s surroundings is important at the rating of the living conditions. Almost a third of Estonian households consider excessive noise in the vicinity of the dwelling a problem: the noise from neighbouring apartments, staircase, water pipes and also the noise being heard from the streets. In the opinion of 15% of households, the noise made by planes or trains is a problem. Almost a third of the households are also disturbed by the road dust and exhaust gases of vehicles in the vicinity of the dwelling.
Smoke, dust and unpleasant smell from factories, also unpleasant smell of wastes or sewerage are problems for every tenth household member belonging to the quintile of lower income.
All the aforementioned problems are considerably bigger for the urban households than for the rural households. While 36% of urban households consider noise being heard from neighbouring apartments, staircase or water pipes a problem, it is a problem for a fifth (22%) of rural households. There are also more those (37%) among urban households than among rural households (26%) for whom street or road noise is a problem. When noise made by planes or trains is a problem for 14% of urban households, then every tenth (10%) of rural households considers it a problem.
Yet more than the household’s place of residence, the problems connected to the noise and pollution being in the vicinity of the dwelling are affected by the type of the dwelling. So street or road noise is a problem for a fourth (24%) of the households living in detached houses but for 38% of the households living in a block of flats.
In 2003, almost half (45%) of Estonian households spent 12,000 kroons or more a year on total housing costs (public utility charges, service charges, hires of lessees, repayments of home loans of owners). 13% spent less than 4,000 kroons and 41% of Estonian households 4,000–12,000 kroons on the dwelling. The housing costs are significantly higher in urban areas, more than half (54%) of urban households spent 12,000 kroons or more a year on the dwelling, while only a fourth (25%) of rural households made such big expenditures on the dwelling. While 29% of rural households spent under 4,000 kroons a year on the dwelling, there were four times less (only 7%) those among urban households (Diagram 14 on page 20).
Total housing costs and household’s income are in close connection: the households with lower income spend less on the dwelling. At that, the investments in the dwelling have not been counted in the total housing costs and also the unpaid remained expenses have not been taken into account. Such difference is probably caused by the fact that the costs of maintenance of the dwelling with better convenience rate and quality are higher. The repayments of the home loans have been counted in the housing costs and probably the households with higher income are more often repaying the home loans. More than two thirds of the households belonging to the quintile of lower income spend less than 12,000 kroons a year on the dwelling, whereas the expenses of less than a third of the households belonging to the quintile of the highest income are so small. Almost 70% of the households
Problems in the vicinity of dwellings
Total housing cost
ELAMISTINGIMUSED SISSETULEK JA ELAMISTINGIMUSED
Living conditions Income and Living Conditions
44 STATISTIKAAMET
Statistical Office of Estonia
belonging to the quintile of the highest income spend more than 12,000 kroons a year on their dwellings (Diagram 15 on page 20).
Also, households where the head of the household is with tertiary level of education or is working live in the dwellings with higher housing costs. When the head of the household has tertiary level of education, the housing costs of more than 60% are over 12,000 kroons a year. A fourth of households where head has primary level of education or lower spend less than 4,000 kroons and a half of them 4,000–12,000 kroons a year on the dwelling.
The housing costs restrict the financial possibilities of the household more when they exceed 12,000 kroons a year. When the housing costs in a year remain under 4,000 kroons, they restrict the financial possibilities for almost a fifth of the households (19%) and a third of households report that the housing costs do not restrict their financial possibilities.
Though the households belonging to the quintile of lower income spent less on the dwelling, the housing costs have turned out to be for them more restrictive of financial possibilities than for the households belonging to the quintile of higher income. Almost half of the households belonging to the quintile of lower income rate their housing costs to restrict the financial possibilities a lot, the financial possibilities of 41% are restricted to a certain extent and every tenth household with such income finds that the housing costs do not restrict the financial possibilities of their household at all. More than tenth of households belonging to the quintile of higher income rate their housing costs very restrictive, more than half of the households restrictive to a certain extent and according to the opinion of 26% the housing costs do not restrict their financial possibilities at all (Diagram 16 on page 21).
Restrictions caused by total housing cost
SISSETULEK JA ELAMISTINGIMUSED RAHVA TERVIS
Income and Living Conditions Population health
STATISTIKAAMET 45 Statistical Office of Estonia
Population health
This section will observe the health status of Estonian population in 2004. First, the attention will be focused on the generic self-rated health measures, then moving from subjective to more objective indicators.
In 2004, 50% of people living in Estonia aged 16 or older considered their health to be either good or very good (Diagram 17 on page 22). Further 35% rated their health to be neither good nor bad and the remaining 15% reported bad or very bad health. These figures pertain only to the non-institutionalised population, excluding, among others, people who are living in hospitals and care homes and who by definition are likely to suffer from bad health. Thus, the share of people with good health in the total population is in all probability, slightly lower. In general, the extreme evaluations are avoided with very good and very bad being substantially less common assessments than good and bad.
Giving a favourable assessment to one’s health is coupled with having no long-standing illness, although the two measures are not entirely overlapping. In the whole population, slightly more than 41% reported themselves to be suffering from a chronic or long-standing illness. While nearly all persons who considered their health to be bad or very bad had a long-standing medical condition, 11% of those in good health also reported a non-trivial ailment. This is due to the definition of long-standing illness including not only serious chronic conditions but also prolonged albeit milder ailments, such as hay fever, which do not interfere with daily activities to a considerable extent. The share of population affected by medical condition in their day-to-day activities is lower. In 2004, one third of the people aged 16 or over reported long-term limitations in their daily life, which were caused by some medical problem. Of those further one third reported severe and the remaining two third milder limitations.
Ill health is unevenly spread among the subgroups of population. In general, the employed persons and people with higher levels of education are more likely to report good health. As expected, old-age pensioners give the worst rating to their health. In 2004, 42% of people in retirement considered their health to be either bad or very bad. Pensioners are followed by other inactive persons, of whom 17% suffer from ill health. The latter is due to those unfit for work being categorised to this group. Of the economically active, the unemployed have worse health than the employed — 8% and 4% respectively describe their health as bad. The unemployed are also more likely to report a longstanding illness and health induced limitations in daily activities.
The educational differences in self-reported health are substantial. While 9% of those with tertiary education consider their health to be either bad or very bad, the figure is nearly three times higher among those with basic education or less. Those with secondary education are in their health assessment more similar to tertiary degree holders, as only 12% of them give an unfavourable evaluation of their health. Again, this appears not to be due to the higher share of older people among the least qualified, as the proportion of retired people with tertiary degrees who report ill health is 31%, whereas the same measure among pensioners with primary or basic education is 48%. The educational differences in health are also substantial if the share of those reporting a long-standing medical problem is considered instead — of those with tertiary and secondary education 35% and 37% suffer from a prolonged ailment, whereas the proportion is 55% among those with basic or primary education. The picture is similar in the case of limitations brought about by medical problems, with 72% and 69% of tertiary and secondary level graduates respectively reporting no limitations and with only 49% of the least qualified being able to say the same (Diagram 18 on page 23). Again, the differences are retained even among the oldest cohorts.
The ethnic nationality also matters. Estonians are slightly more likely than other ethnic groups to report ill health — 16% as against 13% among non-Estonians. However, Estonians are also more likely to report good health; 52% Estonians and 45% of non-Estonians regarded their health to be either good or very good. This owes to a much larger share among non-Estonians who report their health to be neither good nor bad. The differences are negligible with regard to two other health measures, indicating that ethnic groups have on average similar health, with non-Estonians being more modest in their assessment.
General assessment of health
Health and education

RAHVA TERVIS SISSETULEK JA ELAMISTINGIMUSED
Population health Income and Living Conditions
46 STATISTIKAAMET
Statistical Office of Estonia
Estonian counties vary to a considerable extent by the health status of their population. On Thematic map 2 (page 24), counties are grouped by the share of population describing their health as either bad or very bad. To avoid potential compositional effects, stemming from between county variances in age structure, the population aged 16–64 is considered instead of total population. Self-assessed health of people who are below the retirement age is the best in Harju county, where 6% rate their health to be either bad or very bad. Other Northern and Western counties (excluding Pärnu county) also fare well in terms of self-rated health, with the share of population with ill health not increasing 8%. Next group of counties consists of Rapla, Pärnu, Viljandi and Järva counties, where the proportion of those considering their health bad ranges from 9% to 12%. The situation is somewhat worse in Tartu, Jõgeva and Valga county, although the two regions with the worst self-assessed health are Võru and Põlva counties. The share of non-retired population rating their health to be either bad or very bad is 18% in Põlva county, which is three times as high as the respective figure in Harju county.
The picture that emerges from the comparison of two other health measures by county (Diagram 19 on page 24) is somewhat different. A few counties that exhibited relatively favourable self-assessed health fare much worse, when the more objective measures of the share of population with a chronic illness and the share of people who report health-induced limitations in their daily life are concerned. In Lääne county, for example, the proportion of non-retired population with self-rated ill health does not exceed 5%, whereas the share of people reporting limitations in their everyday life due to health problems is above 32%, which is twice as high as the same measure in Tallinn. The opposite is true for Valga county, where a relatively high share of inhabitants rate their health to be either bad or very bad, yet the proportion of those with prolonged health impairments is not high when compared to other counties. Nevertheless, the counties with the best and the worst population health are the same no matter what measure of health is considered, the inhabitants of Tallinn and Harju county fare the best, whereas the non-retired population of Põlva county is in the worst situation.
It is notable that only in one county — Põlva — does the share of those with health induced limitations in daily life exceed the share of those suffering from a chronic health disorder. The proportions are rather similar also in Valga, Hiiu and Võru counties. The difference is the greatest in Tallinn and Harju county, where the share of those with limitations is 10 percentage points lower than the share of those with a prolonged health disorder. The inhabitants of the latter counties have thus much better options of managing their chronic illnesses in a way that they do not become a disturbance in a daily life.
Most crucially, health is related to income. In 2004, 20% of people living below the at-risk-of-poverty threshold rated their health to be either bad or very bad. Of those not in relative poverty, 14% gave the same assessment. Situation is the same regardless of the health measure used. Nearly half of people in relative poverty have a chronic medical disorder, whereas the same measure for those above the at-risk-of-poverty threshold is 39%. The difference is also great in the case of health-induced limitations in daily life. While 32% of those not in poverty experienced limitations in their daily activities, which were brought about by health problems, the figure was 41% in the case of people living in relative poverty.
A more detailed picture is revealed by the comparison of health outcomes by income quintiles. The thin line on Diagram 20 on page 25 represents the proportion of those rating their health bad in every income quintile. While the general trend is evidently that of decline as the income grows, it is in fact the second quintile and not the first that exhibits the worst health outcomes. This is clearly a result of the majority of retired persons belonging to this group. The thick line presents the same information for the non-retired population. The health assessments are, in general, more favourable in every quintile than in the total population, with the gap between two groups narrowing as the income increases. The share of those with bad or very bad health in non-retired population declines monotonously as the equalised income of a household rises. 12% of people receiving the lowest income suffer from bad health. The same figure for those from the wealthiest fifth of the households is 3%. Thus, the poorer the household one lives in, the worse his/her health is likely to be. The near linear decline that was observed is slightly unusual, however. While positive relationship between income and health is a common finding at lower levels of income, the benefit of additional income at higher levels is usually not as great and it improves health only marginally.
Health in counties
Health and income
SISSETULEK JA ELAMISTINGIMUSED RAHVA TERVIS
Income and Living Conditions Population health
STATISTIKAAMET 47 Statistical Office of Estonia
People with different health status vary by their living conditions. In general, persons who rate their health to be better are also more likely to live in more favourable conditions. Those who consider their health to be either bad or very bad are much more likely to live in buildings dating before 1940 — 26% as opposed to 16% in the case of those who consider their health to be either good or very good. That older buildings are less likely to be equipped with essential amenities, is evident from the fact that those suffering from ill health are much more likely to live in dwellings, which lack running and hot water and canalisation. To avoid a compositional effect that can arise from the fact that elderly people tend to have worse self-rated health and are more likely to live in the rural areas, the population is further broken down by labour status. The picture that emerges is similar to the one observed on the level of total population — even when the pensioners and the rest of the population are considered separately, those with worse health are still more likely to live in less favourable conditions (Diagram 21 on page 26). Thus for example, only 7% of non-retired population rating their health to be good lives in dwellings, which have no running water, whereas 20% of those with bad or very bad health live without a water system. Also, people suffering from ill health are substantially more likely to live in too dark and too damp conditions than people in good health.
The explanations of the relation between income and health of an individual are manifold. As shown above, people who have lower income are more likely to live in environment that is inductive of health problems. The examples include crowded living quarters, lack of running and of hot water, too damp or too dark rooms, etc. Those with low income are more likely to take up self-destructive behaviour, such as smoking. People on low income are also less likely to be able to afford to always eat healthy food and to engage in activities that facilitate health. Additionally, persons in poverty will often have less access to health care either due to having no valid health insurance or due to being unable to cover the costs involved. Although the reverse causation is also possible — people with poor health are unable or perhaps unwilling to find well-paying employment and are thus forced to poverty — it is unlikely to explain the whole of the relationship observed.
Health and living conditions

ARSTIABI KÄTTESAADAVUS SISSETULEK JA ELAMISTINGIMUSED
Access to health care Income and Living Conditions
48 STATISTIKAAMET
Statistical Office of Estonia
Access to health care
One reason for ill health is certainly insufficient access to health care. If people are unable to seek adequate medical attention when the health problems first appear, the resulting health impairments may be considerably worse than they would have otherwise been. Thus, the next section will look at the access (and the lack of thereof) to different types of health care that Estonian population had in 2004.
21% of the adult population reported as having in the past 12 months preceding the interview been in a situation where they needed a consultation or a treatment from a general practitioner, a specialised doctor or a dentist, but did not receive it. Access to health care differed depending on the household income and place of residence. 19% of people, whose income was above the at-risk-of-poverty threshold, reported access problems, whereas the same figure was ten percentage points higher (29%) for those living below the at-risk-of-poverty threshold. By region, the access problems were the greatest in North-Western Estonia, where 33% of adult population reported access problems. It was followed by Southern Estonia (22%), Central Estonia (20%), Northern Estonia (18%) and Western Estonia (18%).
The access to a general practitioner is possibly the most crucial aspect of availability of health care. As general practitioners are the first instance where most people suffering from health problems turn to, inability to access this type of care will also rule out the possibility to consult more specialised medical experts, a type of health care to be discussed below.
In 2004, the share of Estonian population older than 15 years who could not consult a general practitioner when in need was 7%. Estonians have slightly few access problems than non-Estonians, with the share of those not getting medical attention being 6% and 9%, respectively. The regional differences are also not remarkable, as the share of those with access problems ranges from 5% in Western Estonia to 7% in North-Eastern Estonia (Diagram 22 on page 27). The availability of most elementary medical care is, however, dependent on one’s labour status. While the employed, retired persons and other inactive enjoy similarly high access rate, the unemployed are clearly seriously deprived when wishing to consult a general practitioner. 23% of people describing themselves as unemployed reported being unable to get medical treatment when in need.
Access to a general practitioner is, however, only the first obstacle in getting adequate medical treatment, as several medical problems require more specialised attention. This is corroborated by the fact that in 2004 8% of Estonia’s adult population had problems with accessing a specialised medical expert. For the large part, the differences between the socio-economic groups are the same but more pronounced. By ethnic nationality, Estonians find it easier to consult a specialised practitioner, with 7% reporting access problems as opposed to 11% in the case of non-Estonians. Geographically, the access is the best in Northern Estonia and worst in North-Eastern Estonia. Again, being unemployed considerably reduces the possibility of accessing a specialised practitioner, with 19% of people in this group not getting a specialised treatment when needing it. 10% of retired people report access problems and the measure is about 7% in the case of the employed and other inactive persons.
The access to health care is, of course, also largely dependent on the financial resources that a household can command. In 2004, 11% of people living below at-risk-of-poverty threshold had in the past year experienced a situation where they needed to consult a general practitioner, but could not do so. The respective figure among those not in poverty was 6%. In the case of specialised practitioners, 14% of those below and 7% of those above at-risk-of-poverty threshold faced access problems. Considering the worse health of those in poverty, the difference in the share of people unable to consult a doctor out of those in need of medical attention, is in all likelihood greater still. The situation is similar if the income quintiles are considered instead. Thus, the share of those who could not consult a general practitioner when in need is 12% in the first and 5% in the fifth quintile.
The reasons for not getting medical attention vary. In the case of general practitioners the most common reasons for not getting access are financial, with 31% of those with access problems reporting being unable to afford the treatment or not being covered by
Access to general practitioners
Access to specialised doctor
Reasons of access problems

SISSETULEK JA ELAMISTINGIMUSED ARSTIABI KÄTTESAADAVUS
Income and Living Conditions Access to health care
STATISTIKAAMET 49 Statistical Office of Estonia
health insurance. Second most important reason was the length of the waiting list, with 18% citing this as their main reason. Other explanations include not knowing a good doctor (8%), lack of time and hope that the medical problem would go away by itself and not having suitable means of transportation (altogether 19%). The remaining 18% quoted other reasons, such as hostility of doctors and being afraid of the treatment. Financial reasons are more common among non-Estonians than Estonians — 37% as against 27% in the case of Estonians. Being unable to afford the visit to a general practitioner or not being covered by health insurance are by far the main reason why the unemployed people are unable to consult a general practitioner when in need, with 81% of those with access problems citing these reasons.
The reasons for not being able to consult a specialised practitioner are somewhat different (Diagram 23 on page 28). Financial motivation is much more common than in the case of accessing the general practitioner, with 39% citing financial reasons. The length of waiting list is also more dominant — 27% of people who needed a specialised treatment but did not get it were held back by overly long waiting lists. Not knowing a good doctor and transportation problems are citied as well, although much less frequently. The differences by labour status are almost as large as in the case of access to general practitioner. Financial reasons are almost the sole explanation behind the unemployed not getting needed specialised medical attention, with nearly 90% citing lack of health insurance or being unable to afford the medical treatment. Other groups are spread much more evenly among the reasons for not being able to access specialised practitioner.
Reasons for being unable to consult a medical practitioner vary greatly depending on equalised income per household member. Those below the at-risk-of-poverty threshold experience access problems to a general practitioner mainly due to financial reasons — 59% citied either the lack of financial resources or of a valid health insurance as their main motivation. However, only 18% of those not at-risk-of-poverty threshold and reporting an unmet need for a medical consultation could not get it because they were unable to afford it. Instead, for this group the main reasons fall to the varied category of other reasons, including lack of time and not knowing a good doctor. In the case of specialised practitioners the main reason for not having access among those below at-risk-of-poverty threshold is also financial motivation (58%). Long waiting lists, while not so crucial for those at-risk-of-poverty threshold, are more common reason among those not at-risk-of-poverty threshold (14% and 32%, respectively).
In 2004, 15% of the Estonian population aged 16 or older had in a past year experienced an occasion where they needed a dental treatment but did not get it. Of population subgroups, non-Estonians have a much higher probability of facing difficulties with access to dental care — 13% of Estonians report an unattended dental problem as opposed to 21% of non-Estonians. By labour status, the unemployed are in the least favourable situation, as nearly one third of people belonging to this group did not have an access to a dentist when in need. Differences among other groups are much less pronounced, with 15% of pensioners not receiving dental treatment as opposed to 14% and 13% among the employed and the other inactive, respectively. The regional differences are also considerable — the access to dental care is clearly the worst in North-Eastern Estonia, where in 2004 27% of the populations had within the year preceding the interview experienced problems with access to a dentist. The inhabitants of Western and Northern Estonia were in the most favourable situation, with respectively 11% and 12% of population not getting dental attention when needing it. The remaining regions — Central and Southern Estonia — occupy a middle position, with respective figure on both occasions being 16%.
The differences among income groups are also significant in the case of access to dental care. 22% of people at-risk-of-poverty threshold and 14% of those not at-risk-of-poverty threshold had an unmet need for dental treatment in the past year preceding the interview. The difference between the first and fifth quintile is greater still, with 23% of those in the lowest and 9% in the highest quintile experiencing access problems.
The reasons for not receiving dental treatment are much less varied than in the case of access to two other types of medical practitioners. The main reason for not getting dental attention was not being able to afford it or not having valid health insurance, with 81% of the people facing access problems quoting this as their main motivation. Financial problems are more common among non-Estonians than Estonians — 87% as opposed to 76%. By labour status not being able to afford dental treatment was more often cited
Access to dental care
ARSTIABI KÄTTESAADAVUS SISSETULEK JA ELAMISTINGIMUSED
Access to health care Income and Living Conditions
50 STATISTIKAAMET
Statistical Office of Estonia
among the unemployed who had problems with access, of whom 94% referred to financial reasons. Lack of financial means is more widespread in Northern and Western Estonia and least often reported although still by far the most widespread reason in Southern Estonia. In fact, with the exception of North-Eastern Estonia the share of the total population who did not receive dental treatment due to being unable to afford it is around 11–12% in all regions. In Southern and Central Estonia, other reasons, such as lack of time and means of transport contribute to the share of those with access problems.
The differences among income groups in the reasons for unmet medical care are much less pronounced in the case of dental treatment than they are in the case of general and specialised practitioners. Financial reasons are the sole main motivation for both those above and those below the at-risk-of-poverty threshold (79% and 86%, respectively), showing that the dental care is often not affordable even to those who are not in relative poverty.
SISSETULEK JA ELAMISTINGIMUSED KURITEGEVUS JA TURVALISUS
Income and Living Conditions Crime and security
STATISTIKAAMET 51 Statistical Office of Estonia
Crime and security
This section will present some statistics on the experiences with crime and sense of security of the Estonian population in 2004. The respondents were asked to report on whether they had fallen a victim to violent crimes (including any form of violence, threats and mugging) and property crimes (burglary from a dwelling or car, car theft). Table A on page 30 presents the share of people aged 16 or older who have experienced a violent crime and share of those who have fallen victim to a property crime. It is important to emphasise in this juncture that the results presented here do no refer to the number of crimes but to the number of people who have experienced an act of violence or been subject to a theft.
In 2004, 6% of adult population reported that they had personally in the past year fallen victim to a violent crime and 8% to a property crime. North-Eastern Estonia is, as far as acts of violence are concerned, the most dangerous region in Estonia, with 8% of people aged 16 or older having suffered from a violent crime. The same figure is as low as 3% in Western Estonia. The remaining regions fall between these opposites. The picture is quite different when property crimes are considered. The rate is lowest in Central Estonia, where 5% of population had been subject to some form of theft, as opposed to nearly 10% in Northern Estonia. Turning now to labour status, the unemployed are most likely to fall a victim to a violent crime, with 11% of this group reporting an act of violence (Diagram 24 on page 31). However, it is the employed who are most often subject to property crimes, as one tenth of them reported having experienced some form of theft. Retired people are the least likely to experience both type of crimes. With regard to income, those above the at-risk-of-poverty threshold are slightly more likely to experience property crimes than those below it, whereas those below the at-risk-of-poverty threshold fall more often a victim to violence or threats. The differences are not considerable, however.
This section will examine the extent to which people are afraid of falling a victim to an act of violence or threats in different settings. In 2004, 9% of adult population reported being afraid and 33% somewhat afraid of violence and threats on the streets. Public places and one’s home were deemed more safe, with respective figures being 6% and 29% for public settings and 2% and 11% for one’s home. Thus, taken together 43% of the population report being either afraid or somewhat afraid of violence and threats on the streets or in the public settings and 13% report being afraid of violence at home. It must be noted that violence at home cannot be equated with domestic violence, however it is likely to form a substantial part of violence that people are afraid of.
The differences that emerge from the comparison between different groups of population are considerable. In general, men are less afraid of violence both in and outside of home than women — 53% of women reported being afraid or somewhat afraid of an act of violence on streets and in public settings, whereas only 31% of men said the same. In terms of labour status, the groups that are more likely to fall victim to a violent crime are, in fact, the ones least afraid of such acts. Thus, 36% of the unemployed reported being afraid in public settings, whereas the same figure was 46% for retired persons, which is the group least likely to have experiences with violent crime. Those in retirement are also a group most afraid of violence at their own home — 19% of the group. The unemployed are, however, no longer the least fearful, ranking second with 14% reporting some feelings of fear at home. Turning finally to regional differences, the fear of violence outside of one’s home is greatest in Northern Estonia and lowest in Western and Central Estonia (Diagram 25 on page 32). However, when violence and threats at home are considered, Southern and North-Eastern Estonia rank the highest with 16% of population being afraid, as opposed to 7% in Western Estonia, which is the region ranking the lowest. There are no differences between those above and those below the at-risk-of-poverty threshold in fear of falling a victim to violence or threats on the streets or in public places. However, those at-risk-of-poverty are more afraid of attacks and threats at their own home than those not at-risk-of-poverty (17% and 12%, respectively).
A way to deal with a potential threat of crime is to take various precautions. This section distinguishes three groups of such measures — being careful (not going out alone, avoiding dangerous places, etc.), carrying some sort of device for self-protection (such as a gun, a knife or a gas sprayer) or having a dog for protection or using security services (by installing a safety lock or an alarm system). In general, most of the Estonian population (70%) reported consciously being cautious in order to avoid falling a victim to a crime.
Victimisation
Sense of security
Precautions

KURITEGEVUS JA TURVALISUS SISSETULEK JA ELAMISTINGIMUSED
Crime and security Income and Living Conditions
52 STATISTIKAAMET
Statistical Office of Estonia
Two other types of precautions were considerably less common, with 29% of population using security services and 17% carrying some weapon for self-defence or having a dog for protection.
Subgroups of population do differ by the type of measures they are likely to employ. For example, non-Estonians are more likely than Estonians to be cautious, with 75% of non-Estonians and 68% of Estonians saying they are being careful, and to use security services (36% vs. 26%). Looking at the labour status, it is again the groups that are most likely to fall victim to a violent crime that take the least precautions. Only 58% of the unemployed reported being careful and 23% used security services. The retired persons, however, while even less likely to use security services (20%), were the most careful group overall, with 77% either avoiding dangerous places or taking other similar measures. Geographically, it is the inhabitants of Northern and North-Eastern Estonia that are the most cautious, with 78% and 77% reporting being careful, respectively. These are also the regions where the use of security services is the most common, although the practice is much more widespread in Northern Estonia this time, as 52% of people have security locks or alarm systems as opposed to 22% in North-Eastern Estonia. People in Western Estonia are the least likely to use any security measures, as only 46% of population in this area reports being careful and 10% uses security services.
SISSETULEK JA ELAMISTINGIMUSED LASTEHOID JA HUVITEGEVUS
Income and Living Conditions Childcare and children's attendance at hobby groups
STATISTIKAAMET 53 Statistical Office of Estonia
Childcare and children’s attendance at hobby groups
On January 1, 2004, there were 1.35 million people living in Estonia. 16% of the population or 216,000 were 14-year-old or younger children. 7% of the population were pre-school-aged children (0–7 years old). So there were about 100,000 pre-school-aged children in Estonia in 2004.
In 2004, in more than half of Estonian households all adult members were working. When the household included at least one child, all adult members were working in more than three quarters of the households with children. In every tenth of household with children at least one but not all adult members were employed.
The employment of parents brings about the usage of childcare. The childcare is especially important with the pre-school-aged children. According to the information of the Ministry of Education and Research, there were more than 600 kindergartens with almost 50,000 places for children in Estonia in 2004. The share of children attending pre-school institutions has risen from year to year and already 85% of 3–6-year-old children were attending pre-school institutions in 2004.
There are different alternatives for the usage of childcare. In addition to kindergartens, it is possible to use professional childminders, day-centres or help of relatives, grandparents, neighbours or other friends. So, in general there are two different possibilities in using the childcare: gratis and paid children’s nursing.
Two thirds of the households (69%) with pre-school-aged children use the help of relatives, grandparents, neighbours or other friends in childcare. This does not depend on the place of residence of the household.
More than half of the households (57%) with pre-school-aged children use the paid childcare (kindergarten, professional childminder, paid day-centres). The parents use more paid children’s nursing in urban areas. Also, the households with higher income are more likely to use the paid childcare: the paid childcare is used by 46% of the households belonging to the quintile of the lowest income and by 63% of the households with the highest income (the highest quintile).
More than one fourth of the parents (27%) use the gratis childcare (help of relatives, grandparents, neighbours or other friends). This is more frequent in urban areas.
In addition to the normal living conditions, education and support of the parents, the attendance at a hobby group has an important role in child’s development. According to the information of the Ministry of Education and Research, there were more than 200 hobby education schools in Estonia in 2003, which offered a supplementary opportunity to acquire education and develop the personality.
According to the Social Survey 2004, in more than half of the households with children (53%) at least one child attended a hobby group. All children attended a hobby group in 39% of households with children and in 48% none of the children attended hobby group (Diagram 26 on page 33).
Children living in urban areas have an advantage in attending hobby groups: better public transport and wide variety of hobby groups. Due to this reason there are more households with children where at least one child (55%) or even all children of the household attended a hobby group in urban areas. All children of the household attended hobby groups in one third of the households with children in rural areas.
When at least one of the parents has a tertiary level of education, the children are more likely to attend a hobby group. Thus 61% of the households with the head of the household having tertiary education had children attending hobby groups. When the head of the household did not have tertiary education, only 39% of the households had at least one child attending a hobby group.
The number of children in the household does not affect children’s attendance at hobby groups. Thus more than two thirds of the households with at least three children had at least one child attending a hobby group. Less than half of the households with one child had a child attending a hobby group. It may be affected by the younger age of the children in the households with one child. Also, only 35% of inactive households had at least one child attending a hobby group.
Gratis and paid childcare
Attendance at hobby groups

LASTEHOID JA HUVITEGEVUS SISSETULEK JA ELAMISTINGIMUSED
Childcare and children's attendance at hobby groups Income and Living Conditions
54 STATISTIKAAMET
Statistical Office of Estonia
The child’s attendance at hobby group is closely connected with income. 45% of the households belonging to the lower income quintile had at least one child attending a hobby group. The share of such households in higher income quintile was 62%. Also, there were more households (55%) with at least one child attending a hobby group where the household’s income was above the at-risk-of-poverty threshold. 56% of the households with the income below this threshold had no children attending a hobby group.
In general, 45% of children aged 14 and less attended a hobby group. Most of them (57%) spent up to two hours a week at a hobby group. One fourth of up to 14-year-old children attending a hobby group spent two to four hours a week at a hobby group. Almost one fifth (18%) of children at this age attended a hobby group more than four hours a week (Diagram 27 on page 34).
Younger school-aged children (7–11 years old) were more likely to attend a hobby group. 67% of children at this age attended hobby groups and 38% of younger school-aged children attended hobby groups up to two hours a week and the same amount of children attended hobby groups two to four hours a week. Almost one fourth of younger school-aged children attending a hobby group did so for more than four hours a week.
61% of older school-aged children (11–14 years old) attended hobby groups. This share is less than it is among younger school-aged children. 37% of older school-aged children attended hobby groups up to two hours a week and one third two to four hours a week. Only slightly more children of older school age attended hobby groups more than four hours a week.
Attendance at hobby groups and
household income
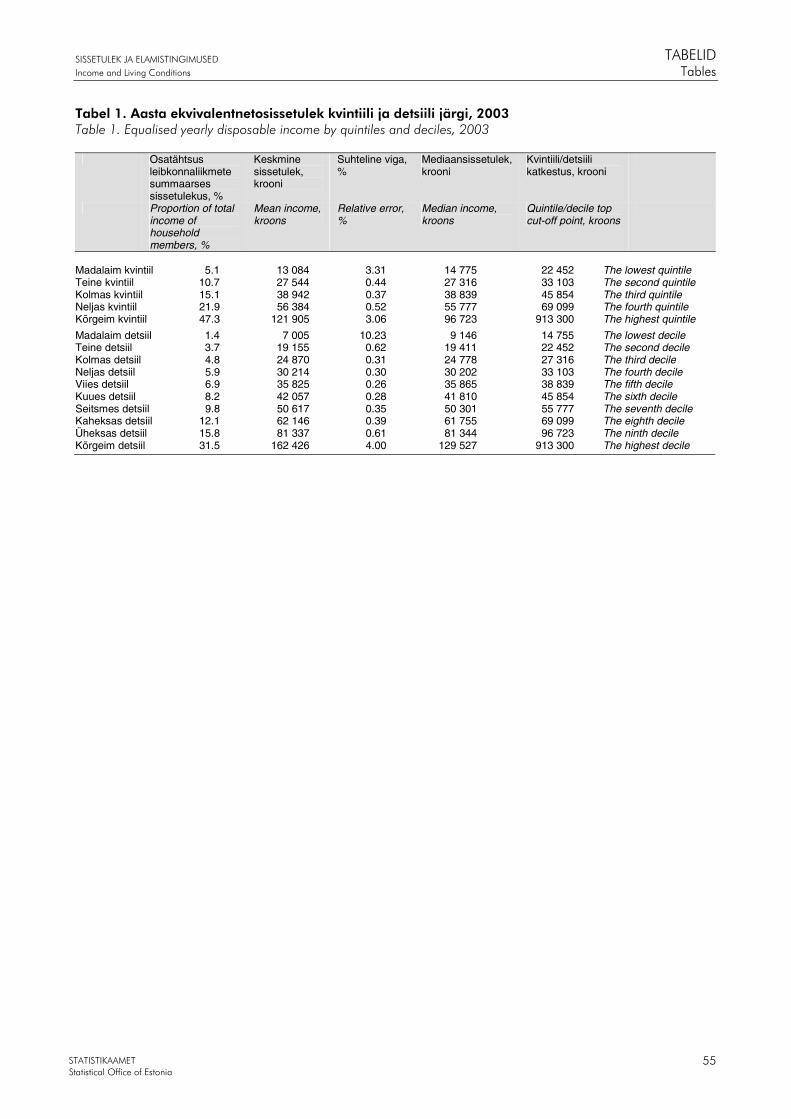
SISSETULEK JA ELAMISTINGIMUSED TABELID
Income and Living Conditions Tables
STATISTIKAAMET Statistical Office of Estonia
55
Tabel 1. Aasta ekvivalentnetosissetulek kvintiili ja detsiili järgi, 2003 Table 1. Equalised yearly disposable income by quintiles and deciles, 2003
Osatähtsus leibkonnaliikmete summaarses sissetulekus, %
Keskmine sissetulek, krooni
Suhteline viga, %
Mediaansissetulek, krooni
Kvintiili/detsiili katkestus, krooni
Proportion of total income of household members, %
Mean income, kroons
Relative error, %
Median income, kroons
Quintile/decile top cut-off point, kroons
Madalaim kvintiil 5.1 13 084 3.31 14 775 22 452 The lowest quintile Teine kvintiil 10.7 27 544 0.44 27 316 33 103 The second quintile Kolmas kvintiil 15.1 38 942 0.37 38 839 45 854 The third quintile Neljas kvintiil 21.9 56 384 0.52 55 777 69 099 The fourth quintile Kõrgeim kvintiil 47.3 121 905 3.06 96 723 913 300 The highest quintile
Madalaim detsiil 1.4 7 005 10.23 9 146 14 755 The lowest decile Teine detsiil 3.7 19 155 0.62 19 411 22 452 The second decile Kolmas detsiil 4.8 24 870 0.31 24 778 27 316 The third decile Neljas detsiil 5.9 30 214 0.30 30 202 33 103 The fourth decile Viies detsiil 6.9 35 825 0.26 35 865 38 839 The fifth decile Kuues detsiil 8.2 42 057 0.28 41 810 45 854 The sixth decile Seitsmes detsiil 9.8 50 617 0.35 50 301 55 777 The seventh decile Kaheksas detsiil 12.1 62 146 0.39 61 755 69 099 The eighth decile Üheksas detsiil 15.8 81 337 0.61 81 344 96 723 The ninth decile Kõrgeim detsiil 31.5 162 426 4.00 129 527 913 300 The highest decile
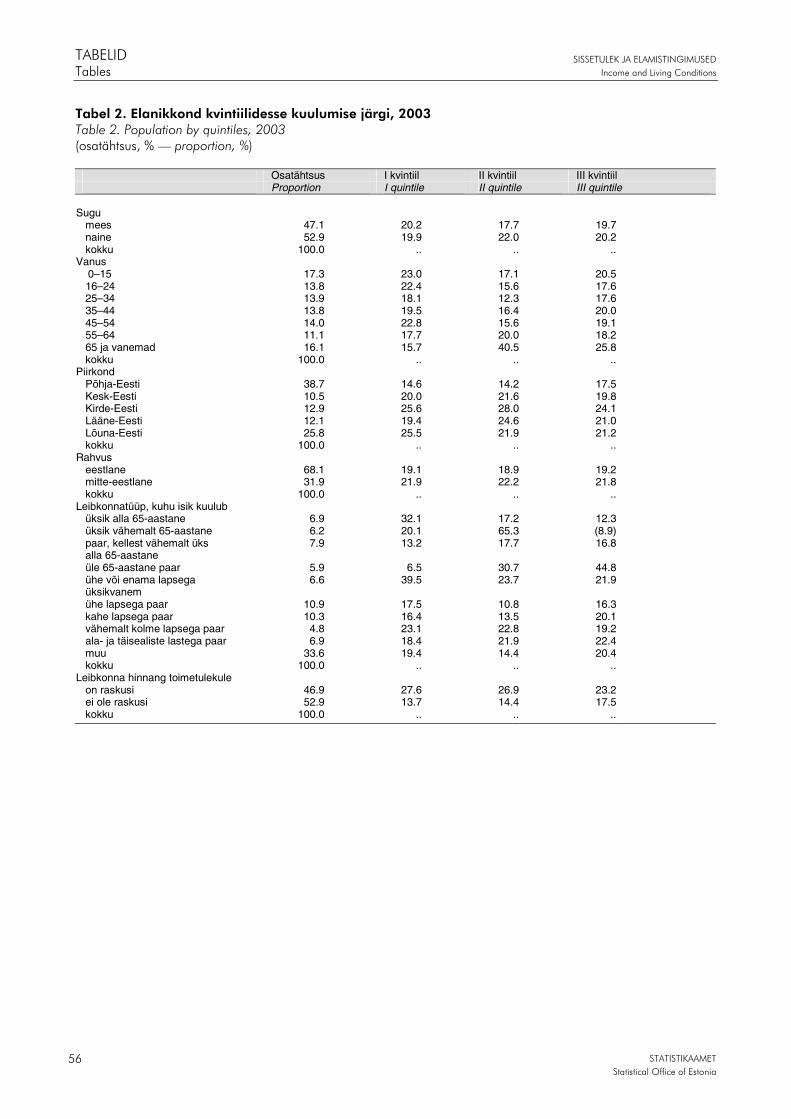
TABELID SISSETULEK JA ELAMISTINGIMUSED
Tables Income and Living Conditions
STATISTIKAAMET
Statistical Office of Estonia 56
Tabel 2. Elanikkond kvintiilidesse kuulumise järgi, 2003 Table 2. Population by quintiles, 2003 (osatähtsus, % — proportion, %)
Osatähtsus I kvintiil II kvintiil III kvintiil Proportion I quintile II quintile III quintile
Sugu
mees 47.1 20.2 17.7 19.7naine 52.9 19.9 22.0 20.2kokku 100.0 .. .. ..
Vanus 0–15 17.3 23.0 17.1 20.516–24 13.8 22.4 15.6 17.625–34 13.9 18.1 12.3 17.635–44 13.8 19.5 16.4 20.045–54 14.0 22.8 15.6 19.155–64 11.1 17.7 20.0 18.265 ja vanemad 16.1 15.7 40.5 25.8kokku 100.0 .. .. ..
Piirkond Põhja-Eesti 38.7 14.6 14.2 17.5Kesk-Eesti 10.5 20.0 21.6 19.8Kirde-Eesti 12.9 25.6 28.0 24.1Lääne-Eesti 12.1 19.4 24.6 21.0Lõuna-Eesti 25.8 25.5 21.9 21.2kokku 100.0 .. .. ..
Rahvus eestlane 68.1 19.1 18.9 19.2mitte-eestlane 31.9 21.9 22.2 21.8kokku 100.0 .. .. ..
Leibkonnatüüp, kuhu isik kuulub üksik alla 65-aastane 6.9 32.1 17.2 12.3üksik vähemalt 65-aastane 6.2 20.1 65.3 (8.9)paar, kellest vähemalt üks alla 65-aastane
7.9 13.2 17.7 16.8
üle 65-aastane paar 5.9 6.5 30.7 44.8ühe või enama lapsega üksikvanem
6.6 39.5 23.7 21.9
ühe lapsega paar 10.9 17.5 10.8 16.3kahe lapsega paar 10.3 16.4 13.5 20.1vähemalt kolme lapsega paar 4.8 23.1 22.8 19.2ala- ja täisealiste lastega paar 6.9 18.4 21.9 22.4muu 33.6 19.4 14.4 20.4kokku 100.0 .. .. ..
Leibkonna hinnang toimetulekule on raskusi 46.9 27.6 26.9 23.2ei ole raskusi 52.9 13.7 14.4 17.5kokku 100.0 .. .. ..
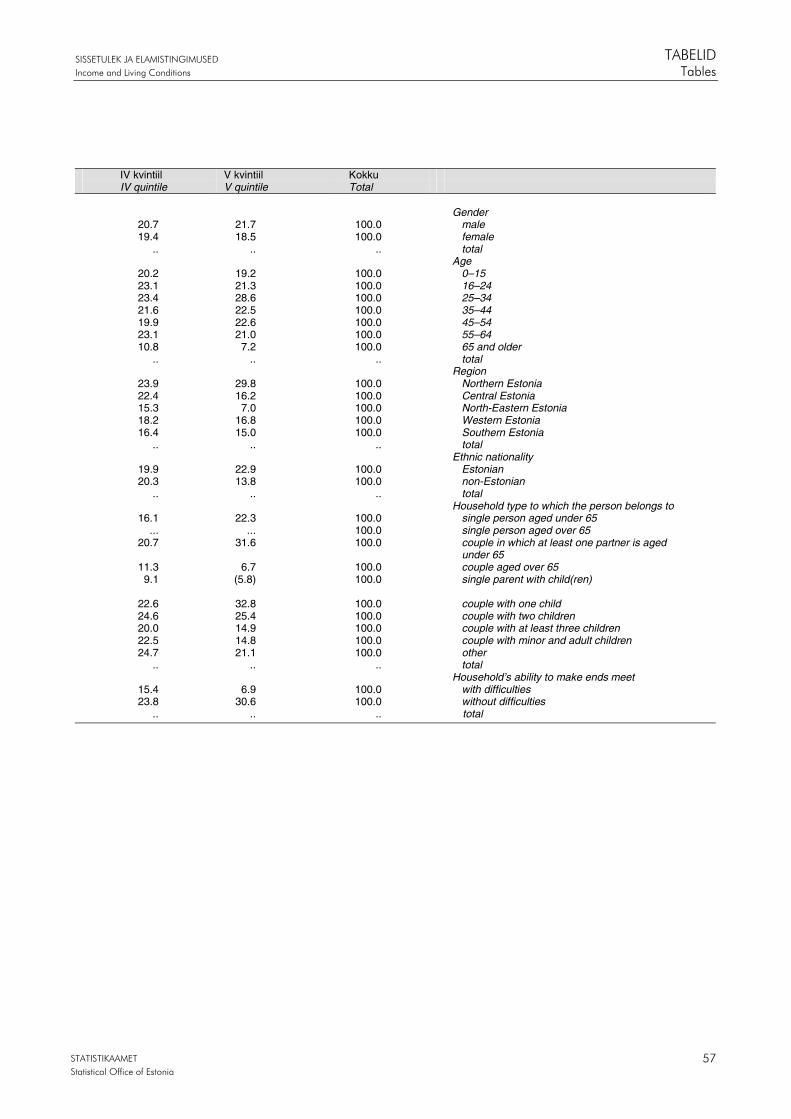
SISSETULEK JA ELAMISTINGIMUSED TABELID
Income and Living Conditions Tables
STATISTIKAAMET
Statistical Office of Estonia 57
IV kvintiil V kvintiil Kokku IV quintile V quintile Total
Gender
20.7 21.7 100.0 male 19.4 18.5 100.0 female
.. .. .. total Age
20.2 19.2 100.0 0–15 23.1 21.3 100.0 16–24 23.4 28.6 100.0 25–34 21.6 22.5 100.0 35–44 19.9 22.6 100.0 45–54 23.1 21.0 100.0 55–64 10.8 7.2 100.0 65 and older
.. .. .. total Region
23.9 29.8 100.0 Northern Estonia 22.4 16.2 100.0 Central Estonia 15.3 7.0 100.0 North-Eastern Estonia 18.2 16.8 100.0 Western Estonia 16.4 15.0 100.0 Southern Estonia
.. .. .. total Ethnic nationality
19.9 22.9 100.0 Estonian 20.3 13.8 100.0 non-Estonian
.. .. .. total Household type to which the person belongs to
16.1 22.3 100.0 single person aged under 65 ... ... 100.0 single person aged over 65
20.7 31.6 100.0 couple in which at least one partner is aged under 65
11.3 6.7 100.0 couple aged over 65 9.1 (5.8) 100.0 single parent with child(ren)
22.6 32.8 100.0 couple with one child 24.6 25.4 100.0 couple with two children 20.0 14.9 100.0 couple with at least three children 22.5 14.8 100.0 couple with minor and adult children 24.7 21.1 100.0 other
.. .. .. total Household’s ability to make ends meet
15.4 6.9 100.0 with difficulties 23.8 30.6 100.0 without difficulties
.. .. .. total
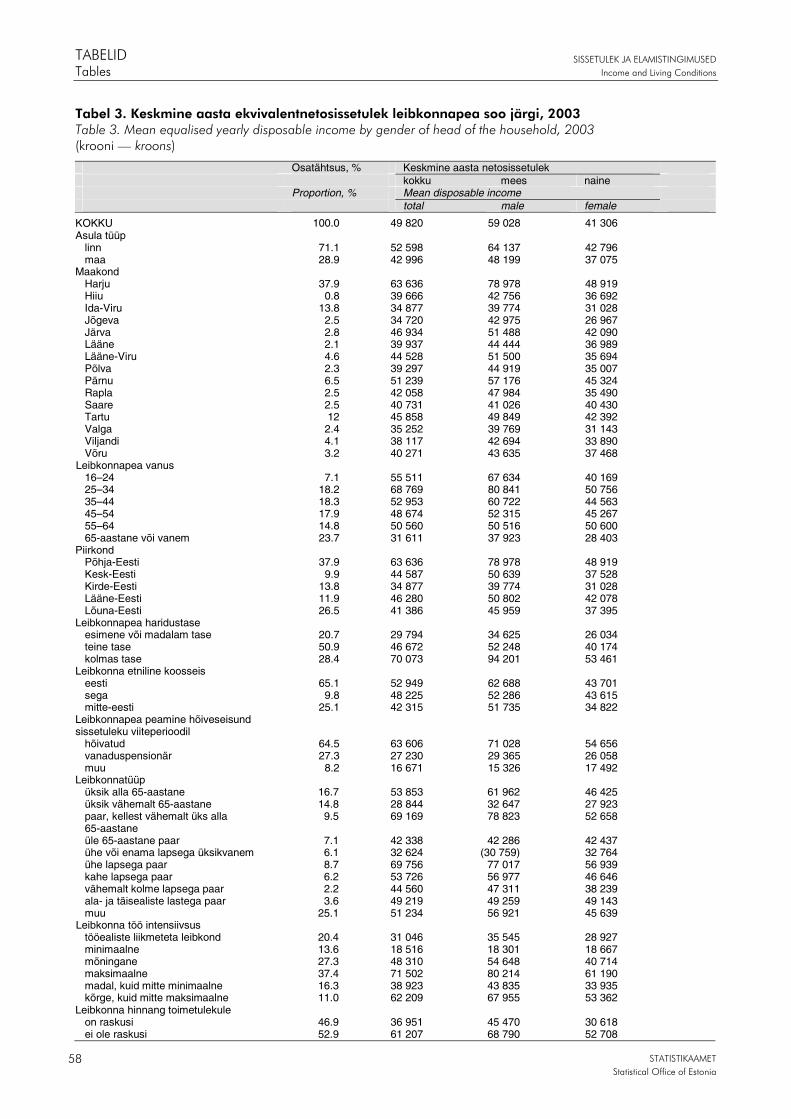
TABELID SISSETULEK JA ELAMISTINGIMUSED
Tables Income and Living Conditions
STATISTIKAAMET
Statistical Office of Estonia 58
Tabel 3. Keskmine aasta ekvivalentnetosissetulek leibkonnapea soo järgi, 2003 Table 3. Mean equalised yearly disposable income by gender of head of the household, 2003 (krooni — kroons)
Osatähtsus, % Keskmine aasta netosissetulek kokku mees naine Proportion, % Mean disposable income total male female
KOKKU 100.0 49 820 59 028 41 306 Asula tüüp
linn 71.1 52 598 64 137 42 796 maa 28.9 42 996 48 199 37 075
Maakond Harju 37.9 63 636 78 978 48 919 Hiiu 0.8 39 666 42 756 36 692 Ida-Viru 13.8 34 877 39 774 31 028 Jõgeva 2.5 34 720 42 975 26 967 Järva 2.8 46 934 51 488 42 090 Lääne 2.1 39 937 44 444 36 989 Lääne-Viru 4.6 44 528 51 500 35 694 Põlva 2.3 39 297 44 919 35 007 Pärnu 6.5 51 239 57 176 45 324 Rapla 2.5 42 058 47 984 35 490 Saare 2.5 40 731 41 026 40 430 Tartu 12 45 858 49 849 42 392 Valga 2.4 35 252 39 769 31 143 Viljandi 4.1 38 117 42 694 33 890 Võru 3.2 40 271 43 635 37 468
Leibkonnapea vanus 16–24 7.1 55 511 67 634 40 169 25–34 18.2 68 769 80 841 50 756 35–44 18.3 52 953 60 722 44 563 45–54 17.9 48 674 52 315 45 267 55–64 14.8 50 560 50 516 50 600 65-aastane või vanem 23.7 31 611 37 923 28 403
Piirkond Põhja-Eesti 37.9 63 636 78 978 48 919 Kesk-Eesti 9.9 44 587 50 639 37 528 Kirde-Eesti 13.8 34 877 39 774 31 028 Lääne-Eesti 11.9 46 280 50 802 42 078 Lõuna-Eesti 26.5 41 386 45 959 37 395
Leibkonnapea haridustase esimene või madalam tase 20.7 29 794 34 625 26 034 teine tase 50.9 46 672 52 248 40 174 kolmas tase 28.4 70 073 94 201 53 461
Leibkonna etniline koosseis eesti 65.1 52 949 62 688 43 701 sega 9.8 48 225 52 286 43 615 mitte-eesti 25.1 42 315 51 735 34 822
Leibkonnapea peamine hõiveseisund sissetuleku viiteperioodil
hõivatud 64.5 63 606 71 028 54 656 vanaduspensionär 27.3 27 230 29 365 26 058 muu 8.2 16 671 15 326 17 492
Leibkonnatüüp üksik alla 65-aastane 16.7 53 853 61 962 46 425 üksik vähemalt 65-aastane 14.8 28 844 32 647 27 923 paar, kellest vähemalt üks alla 65-aastane
9.5 69 169 78 823 52 658
üle 65-aastane paar 7.1 42 338 42 286 42 437 ühe või enama lapsega üksikvanem 6.1 32 624 (30 759) 32 764 ühe lapsega paar 8.7 69 756 77 017 56 939 kahe lapsega paar 6.2 53 726 56 977 46 646 vähemalt kolme lapsega paar 2.2 44 560 47 311 38 239 ala- ja täisealiste lastega paar 3.6 49 219 49 259 49 143 muu 25.1 51 234 56 921 45 639
Leibkonna töö intensiivsus tööealiste liikmeteta leibkond 20.4 31 046 35 545 28 927 minimaalne 13.6 18 516 18 301 18 667 mõningane 27.3 48 310 54 648 40 714 maksimaalne 37.4 71 502 80 214 61 190 madal, kuid mitte minimaalne 16.3 38 923 43 835 33 935 kõrge, kuid mitte maksimaalne 11.0 62 209 67 955 53 362
Leibkonna hinnang toimetulekule on raskusi 46.9 36 951 45 470 30 618 ei ole raskusi 52.9 61 207 68 790 52 708
SISSETULEK JA ELAMISTINGIMUSED TABELID
Income and Living Conditions Tables
STATISTIKAAMET
Statistical Office of Estonia 59
Mediaan kokku mees naine Median total male female
35 419 43 225 29 244 TOTAL Type of the settlement
36 889 45 854 30 476 urban 31 607 37 247 27 222 rural
County 44 935 56 325 36 120 Harju 32 104 39 940 27 000 Hiiu 28 146 34 533 24 435 Ida-Viru 26 350 33 515 23 598 Jõgeva 39 900 45 768 35 193 Järva 29 219 35 916 27 615 Lääne 37 882 46 145 26 846 Lääne-Viru 30 520 36 600 28 392 Põlva 34 099 41 246 28 680 Pärnu 34 453 34 611 31 000 Rapla 34 229 34 229 34 657 Saare 31 855 35 192 28 980 Tartu 28 291 35 802 25 000 Valga 32 219 36 546 29 078 Viljandi 31 879 39 125 28 067 Võru
Age of head of the household 38 839 48 200 24 024 16–24 48 813 55 471 40 220 25–34 41 478 48 473 33 532 35–44 38 425 42 944 35 507 45–54 36 577 39 075 35 422 55–64 26 868 32 727 25 680 65 and older
Region 44 935 56 325 36 120 Northern Estonia 36 453 43 578 29 077 Central Estonia 28 146 34 533 24 435 North-Eastern Estonia 32 370 37 620 28 770 Western Estonia 30 976 35 860 28 176 Southern Estonia
Level of education of head of the household 25 700 31 067 24 248 below upper secondary education 36 345 42 718 29 812 upper secondary education 51 032 64 000 41 328 tertiary education
Ethnic composition of household 36 700 44 472 30 964 Estonian 39 443 44 986 35 231 mixed 30 327 38 764 26 012 non-Estonian
Main labour status of head of the household during the income reference period
47 993 53 952 41 328 employed 25 700 29 300 24 900 retired 11 707 10 533 11 965 other
Household type 35 419 35 600 32 908 single person aged under 65 25 300 27 600 25 100 single person aged over 65 49 235 54 947 39 093 couple in which at least one partner is aged
under 65 35 192 35 860 34 099 couple aged over 65 28 187 (28 600) 28 187 single parent with child(ren) 49 149 56 806 39 000 couple with one child 45 426 48 844 40 551 couple with two children 36 005 37 482 28 394 couple with at least three children 38 764 40 136 33 403 couple with minor and adult children 41 500 49 091 35 422 other
Work intensity of household 26 890 32 727 25 716 household without working age members 17 733 17 733 17 652 minimal 36 585 42 551 31 647 partial 53 100 59 169 46 800 maximal 30 467 35 972 24 936 low, but not minimal 48 102 52 402 43 087 high, but not maximal
Household’s ability to make ends meet 27 985 34 123 25 700 with difficulties 46 800 54 450 39 634 without difficulties

TABELID SISSETULEK JA ELAMISTINGIMUSED
Tables Income and Living Conditions
STATISTIKAAMET
Statistical Office of Estonia 60
Tabel 4. Keskmine aasta ekvivalentnetosissetulek leibkonnapea haridustaseme järgi, 2003 Table 4. Mean equalised yearly disposable income by level of education of head of the household, 2003 (krooni — kroons)
Kokku Esimene või madalam tase
Teine tase Kolmas tase
Total Below upper secondary education
Upper secondary education
Tertiary education
Asula tüüp Type of the settlement
linn 52 598 30 320 47 709 71 833 urban maa 42 996 29 038 44 243 62 208 rural
Leibkonnapea vanus Age of head of the household 16–24 55 511 29 283 54 655 (84 087) 16–24 25–34 68 769 36 371 54 557 108 990 25–34 35–44 52 953 27 601 48 820 65 581 35–44 45–54 48 674 31 742 45 224 59 428 45–54 55–64 50 560 33 800 43 883 70 286 55–64 65 ja vanemad 31 611 27 504 31 895 40 744 65 and older
Piirkond Region Põhja-Eesti 63 636 33 197 54 551 85 469 Northern Estonia Kesk-Eesti 44 587 32 059 44 227 61 336 Central Estonia Kirde-Eesti 34 877 27 503 37 106 38 670 North-Eastern Estonia Lääne-Eesti 46 280 32 944 50 898 54 113 Western Estonia Lõuna-Eesti 41 386 25 585 40 371 57 742 Southern Estonia
Leibkonna etniline koosseis Ethnic composition of householdeesti 52 949 30 708 47 900 79 115 Estonian sega 48 225 33 803 47 371 58 461 mixed mitte-eesti 42 315 26 143 43 042 52 660 non-Estonian
Leibkonnapea peamine hõiveseisund sissetuleku viiteperioodil
Main labour status of head of the household during the income reference period
hõivatud 63 606 42 987 55 719 82 042 employed vanaduspensionär 27 230 26 348 26 868 30 342 retired muu 16 671 9 958 16 579 22 968 other
Leibkonnatüüp Household type üksik alla 65-aastane 53 853 25 027 42 915 85 515 single person aged under 65 üksik vähemalt 65-aastane 28 844 25 124 30 011 35 456 single person aged over 65 paar, kellest vähemalt üks alla 65-aastane
69 169 37 653 54 936 105 494 couple in which at least one partner is aged under 65
üle 65-aastane paar 42 338 34 111 38 218 64 353 couple aged over 65 ühe või enama lapsega üksikvanem
32 624 (22 787) 31 173 41 296 single parent with child(ren)
ühe lapsega paar 69 756 (27 601) 62 685 91 561 couple with one child vähemalt kahe lapsega paar 51 302 (26 143) 46 989 65 734 couple with at least two
children ala- ja täisealiste lastega paar 49 219 (26 281) 49 935 55 542 couple with minor and
adult children muu 51 234 25 027 50 465 61 475 other
Leibkonna töö intensiivsus Work intensity of household tööealiste liikmeteta leibkond 31 042 27 883 31 860 37 223 household without working
age members minimaalne 18 516 18 505 17 394 21 998 minimal mõningane 48 310 34 544 45 195 61 699 partial maksimaalne 71 502 52 890 60 765 90 968 maximal madal, kuid mitte minimaalne 38 923 30 059 38 169 45 037 low, but not minimal kõrge, kuid mitte maksimaalne 62 209 40 874 56 373 83 218 high but not maximal
Leibkonna hinnang toimetulekule Household’s ability to make ends meet
raskustega 36 951 26 793 36 582 50 473 with difficulties raskusteta 61 207 34 061 56 259 80 699 without difficulties
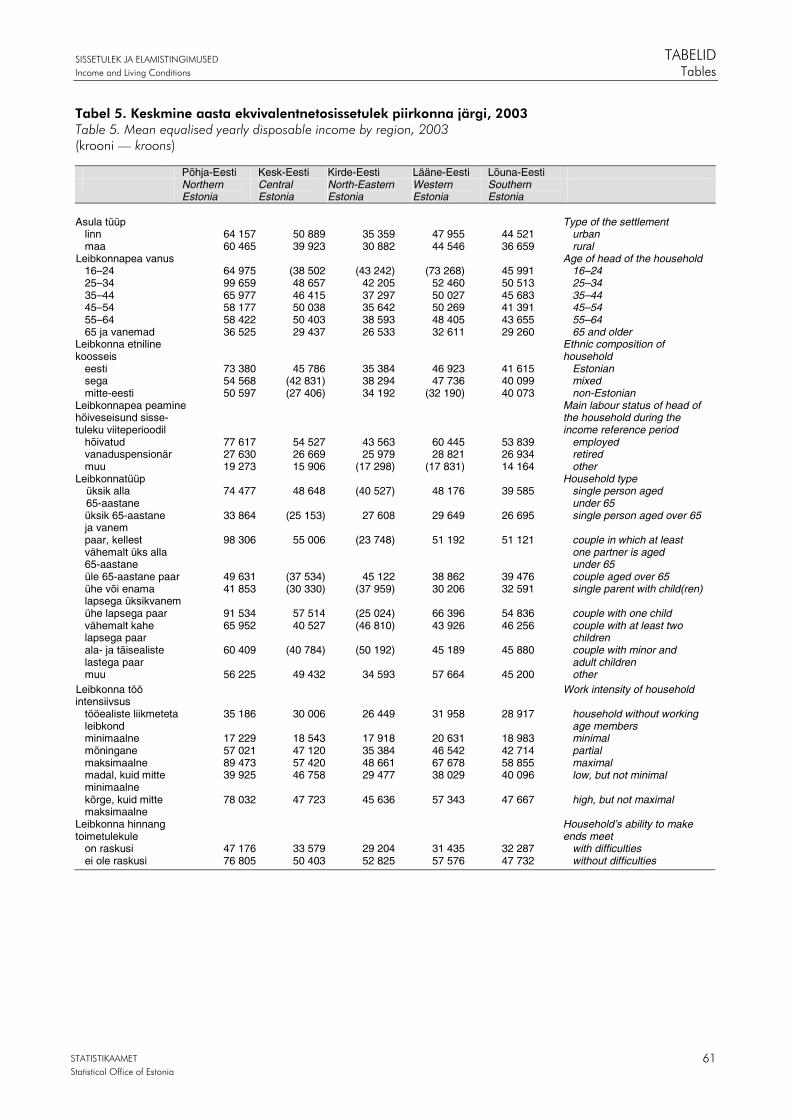
SISSETULEK JA ELAMISTINGIMUSED TABELID
Income and Living Conditions Tables
STATISTIKAAMET
Statistical Office of Estonia 61
Tabel 5. Keskmine aasta ekvivalentnetosissetulek piirkonna järgi, 2003 Table 5. Mean equalised yearly disposable income by region, 2003 (krooni — kroons)
Põhja-Eesti Kesk-Eesti Kirde-Eesti Lääne-Eesti Lõuna-Eesti Northern
Estonia Central Estonia
North-Eastern Estonia
Western Estonia
Southern Estonia
Asula tüüp Type of the settlement
linn 64 157 50 889 35 359 47 955 44 521 urban maa 60 465 39 923 30 882 44 546 36 659 rural
Leibkonnapea vanus Age of head of the household 16–24 64 975 (38 502 (43 242) (73 268) 45 991 16–24 25–34 99 659 48 657 42 205 52 460 50 513 25–34 35–44 65 977 46 415 37 297 50 027 45 683 35–44 45–54 58 177 50 038 35 642 50 269 41 391 45–54 55–64 58 422 50 403 38 593 48 405 43 655 55–64 65 ja vanemad 36 525 29 437 26 533 32 611 29 260 65 and older
Leibkonna etniline koosseis
Ethnic composition of household
eesti 73 380 45 786 35 384 46 923 41 615 Estonian sega 54 568 (42 831) 38 294 47 736 40 099 mixed mitte-eesti 50 597 (27 406) 34 192 (32 190) 40 073 non-Estonian
Leibkonnapea peamine hõiveseisund sisse-tuleku viiteperioodil
Main labour status of head of the household during the income reference period
hõivatud 77 617 54 527 43 563 60 445 53 839 employed vanaduspensionär 27 630 26 669 25 979 28 821 26 934 retired muu 19 273 15 906 (17 298) (17 831) 14 164 other
Leibkonnatüüp Household type üksik alla 65-aastane
74 477 48 648 (40 527) 48 176 39 585 single person aged under 65
üksik 65-aastane ja vanem
33 864 (25 153) 27 608 29 649 26 695 single person aged over 65
paar, kellest vähemalt üks alla 65-aastane
98 306 55 006 (23 748) 51 192 51 121 couple in which at least one partner is aged under 65
üle 65-aastane paar 49 631 (37 534) 45 122 38 862 39 476 couple aged over 65 ühe või enama lapsega üksikvanem
41 853 (30 330) (37 959) 30 206 32 591 single parent with child(ren)
ühe lapsega paar 91 534 57 514 (25 024) 66 396 54 836 couple with one child vähemalt kahe lapsega paar
65 952 40 527 (46 810) 43 926 46 256 couple with at least two children
ala- ja täisealiste lastega paar
60 409 (40 784) (50 192) 45 189 45 880 couple with minor and adult children
muu 56 225 49 432 34 593 57 664 45 200 other Leibkonna töö intensiivsus
Work intensity of household
tööealiste liikmeteta leibkond
35 186 30 006 26 449 31 958 28 917 household without working age members
minimaalne 17 229 18 543 17 918 20 631 18 983 minimal mõningane 57 021 47 120 35 384 46 542 42 714 partial maksimaalne 89 473 57 420 48 661 67 678 58 855 maximal madal, kuid mitte minimaalne
39 925 46 758 29 477 38 029 40 096 low, but not minimal
kõrge, kuid mitte maksimaalne
78 032 47 723 45 636 57 343 47 667 high, but not maximal
Leibkonna hinnang toimetulekule
Household’s ability to make ends meet
on raskusi 47 176 33 579 29 204 31 435 32 287 with difficulties ei ole raskusi 76 805 50 403 52 825 57 576 47 732 without difficulties
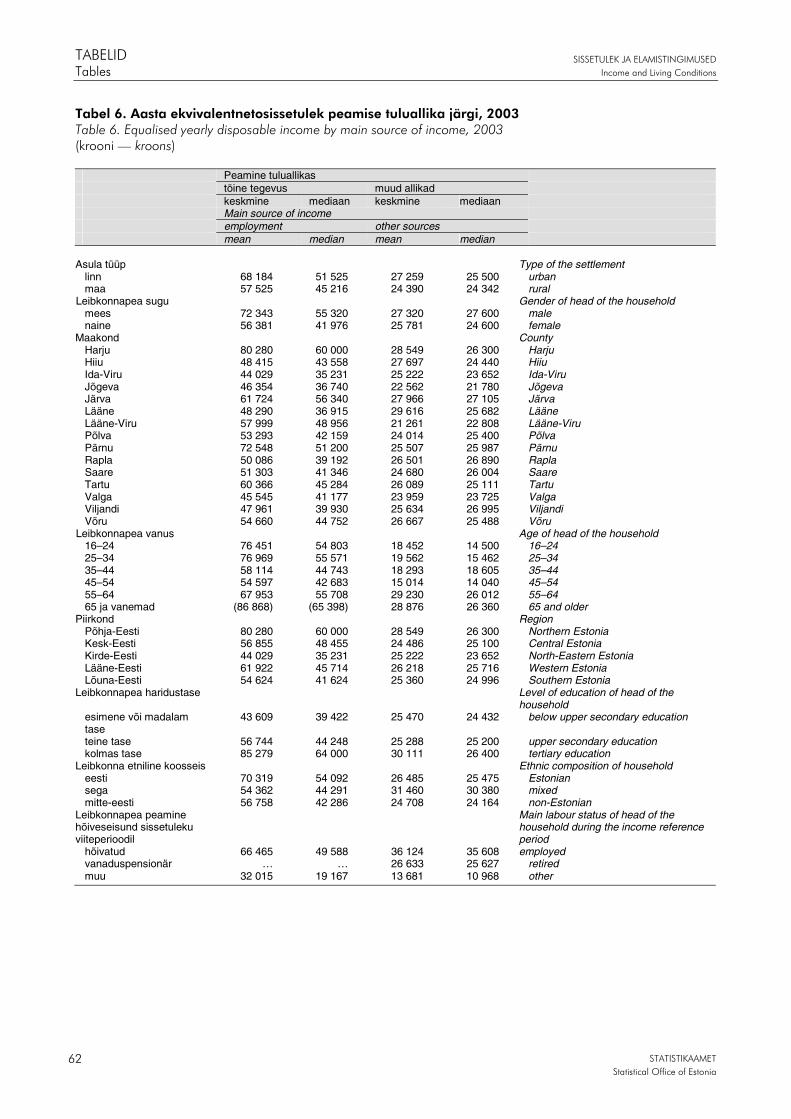
TABELID SISSETULEK JA ELAMISTINGIMUSED
Tables Income and Living Conditions
STATISTIKAAMET
Statistical Office of Estonia 62
Tabel 6. Aasta ekvivalentnetosissetulek peamise tuluallika järgi, 2003 Table 6. Equalised yearly disposable income by main source of income, 2003 (krooni — kroons)
Peamine tuluallikas töine tegevus muud allikad keskmine mediaan keskmine mediaan Main source of income employment other sources mean median mean median
Asula tüüp Type of the settlement
linn 68 184 51 525 27 259 25 500 urban maa 57 525 45 216 24 390 24 342 rural
Leibkonnapea sugu Gender of head of the household mees 72 343 55 320 27 320 27 600 male naine 56 381 41 976 25 781 24 600 female
Maakond County Harju 80 280 60 000 28 549 26 300 Harju Hiiu 48 415 43 558 27 697 24 440 Hiiu Ida-Viru 44 029 35 231 25 222 23 652 Ida-Viru Jõgeva 46 354 36 740 22 562 21 780 Jõgeva Järva 61 724 56 340 27 966 27 105 Järva Lääne 48 290 36 915 29 616 25 682 Lääne Lääne-Viru 57 999 48 956 21 261 22 808 Lääne-Viru Põlva 53 293 42 159 24 014 25 400 Põlva Pärnu 72 548 51 200 25 507 25 987 Pärnu Rapla 50 086 39 192 26 501 26 890 Rapla Saare 51 303 41 346 24 680 26 004 Saare Tartu 60 366 45 284 26 089 25 111 Tartu Valga 45 545 41 177 23 959 23 725 Valga Viljandi 47 961 39 930 25 634 26 995 Viljandi Võru 54 660 44 752 26 667 25 488 Võru
Leibkonnapea vanus Age of head of the household 16–24 76 451 54 803 18 452 14 500 16–24 25–34 76 969 55 571 19 562 15 462 25–34 35–44 58 114 44 743 18 293 18 605 35–44 45–54 54 597 42 683 15 014 14 040 45–54 55–64 67 953 55 708 29 230 26 012 55–64 65 ja vanemad (86 868) (65 398) 28 876 26 360 65 and older
Piirkond Region Põhja-Eesti 80 280 60 000 28 549 26 300 Northern Estonia Kesk-Eesti 56 855 48 455 24 486 25 100 Central Estonia Kirde-Eesti 44 029 35 231 25 222 23 652 North-Eastern Estonia Lääne-Eesti 61 922 45 714 26 218 25 716 Western Estonia Lõuna-Eesti 54 624 41 624 25 360 24 996 Southern Estonia
Leibkonnapea haridustase Level of education of head of the household
esimene või madalam tase
43 609 39 422 25 470 24 432 below upper secondary education
teine tase 56 744 44 248 25 288 25 200 upper secondary education kolmas tase 85 279 64 000 30 111 26 400 tertiary education
Leibkonna etniline koosseis Ethnic composition of household eesti 70 319 54 092 26 485 25 475 Estonian sega 54 362 44 291 31 460 30 380 mixed mitte-eesti 56 758 42 286 24 708 24 164 non-Estonian
Leibkonnapea peamine hõiveseisund sissetuleku viiteperioodil
Main labour status of head of the household during the income reference period
hõivatud 66 465 49 588 36 124 35 608 employed vanaduspensionär … … 26 633 25 627 retired muu 32 015 19 167 13 681 10 968 other
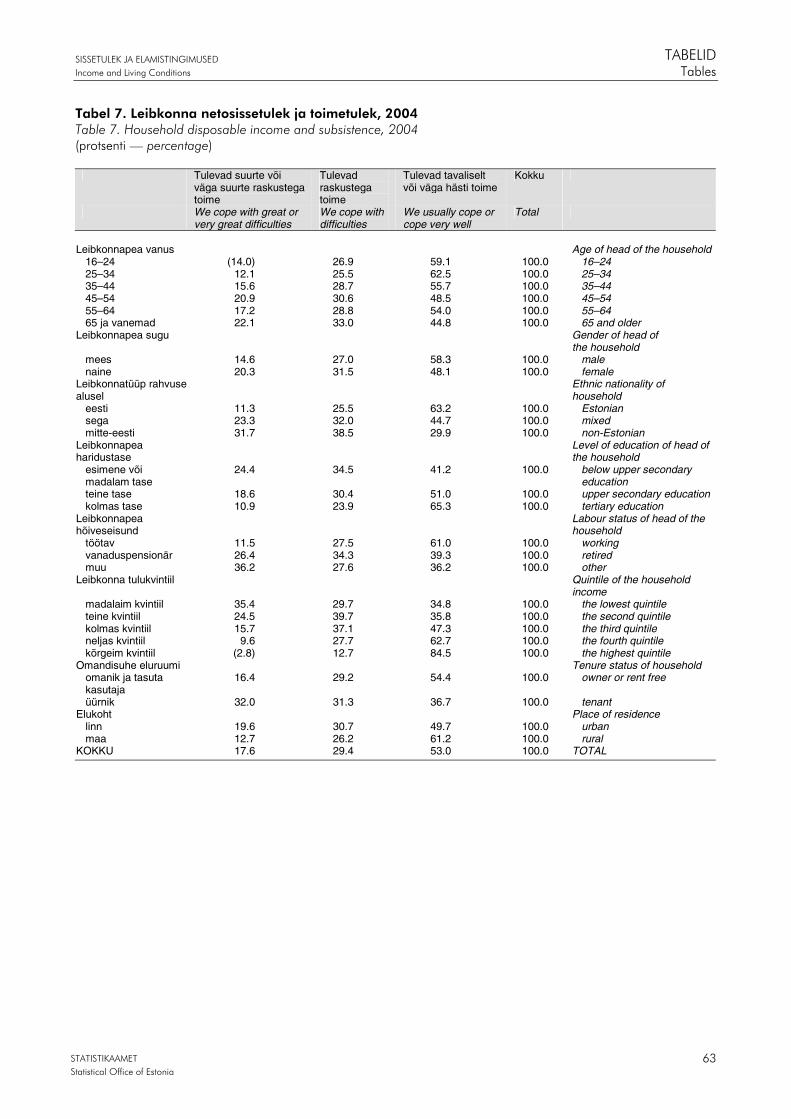
SISSETULEK JA ELAMISTINGIMUSED TABELID
Income and Living Conditions Tables
STATISTIKAAMET
Statistical Office of Estonia 63
Tabel 7. Leibkonna netosissetulek ja toimetulek, 2004 Table 7. Household disposable income and subsistence, 2004 (protsenti — percentage)
Tulevad suurte või väga suurte raskustega toime
Tulevad raskustega toime
Tulevad tavaliselt või väga hästi toime
Kokku
We cope with great or very great difficulties
We cope with difficulties
We usually cope or cope very well
Total
Leibkonnapea vanus Age of head of the household
16–24 (14.0) 26.9 59.1 100.0 16–24 25–34 12.1 25.5 62.5 100.0 25–34 35–44 15.6 28.7 55.7 100.0 35–44 45–54 20.9 30.6 48.5 100.0 45–54 55–64 17.2 28.8 54.0 100.0 55–64 65 ja vanemad 22.1 33.0 44.8 100.0 65 and older
Leibkonnapea sugu
Gender of head of the household
mees 14.6 27.0 58.3 100.0 male naine 20.3 31.5 48.1 100.0 female
Leibkonnatüüp rahvuse alusel
Ethnic nationality of household
eesti 11.3 25.5 63.2 100.0 Estonian sega 23.3 32.0 44.7 100.0 mixed mitte-eesti 31.7 38.5 29.9 100.0 non-Estonian
Leibkonnapea haridustase
Level of education of head of the household
esimene või madalam tase
24.4 34.5 41.2 100.0 below upper secondary education
teine tase 18.6 30.4 51.0 100.0 upper secondary education kolmas tase 10.9 23.9 65.3 100.0 tertiary education
Leibkonnapea hõiveseisund
Labour status of head of the household
töötav 11.5 27.5 61.0 100.0 working vanaduspensionär 26.4 34.3 39.3 100.0 retired muu 36.2 27.6 36.2 100.0 other
Leibkonna tulukvintiil Quintile of the household income
madalaim kvintiil 35.4 29.7 34.8 100.0 the lowest quintile teine kvintiil 24.5 39.7 35.8 100.0 the second quintile kolmas kvintiil 15.7 37.1 47.3 100.0 the third quintile neljas kvintiil 9.6 27.7 62.7 100.0 the fourth quintile kõrgeim kvintiil (2.8) 12.7 84.5 100.0 the highest quintile
Omandisuhe eluruumi Tenure status of household omanik ja tasuta kasutaja
16.4 29.2 54.4 100.0 owner or rent free
üürnik 32.0 31.3 36.7 100.0 tenant Elukoht Place of residence
linn 19.6 30.7 49.7 100.0 urban maa 12.7 26.2 61.2 100.0 rural
KOKKU 17.6 29.4 53.0 100.0 TOTAL

TABELID SISSETULEK JA ELAMISTINGIMUSED
Tables Income and Living Conditions
STATISTIKAAMET
Statistical Office of Estonia 64
Tabel 8. Erilise luksuseta elada võimaldav netokuusissetulek liikme kohta leibkonna hinnangul, 2004 Table 8. Household’s assessment of monthly disposable income per household member needed to live without excessive luxury, 2004 (protsenti — percentage)
Alla 3000 3000–4499 4500–5999 Üle 6000 Kokku Under 3,000 3,000 –4,499 4,500 –5,999 Over 6,000 Total
Leibkonnapea vanus Age of head of the
household 16–24 15.6 24.6 28.8 31.0 100.0 16–24 25–34 17.7 28.2 26.4 27.7 100.0 25–34 35–44 24.7 28.1 24.8 22.4 100.0 35–44 45–54 12.9 29.2 32.6 25.3 100.0 45–54 55–64 9.6 33.5 32.8 24.1 100.0 55–64 65 ja vanemad 12.2 50.7 29.0 8.1 100.0 65 and older
Leibkonnapea sugu Gender of head of the household
mees 15.5 31.6 27.9 25.1 100.0 male naine 15.5 36.7 29.9 17.9 100.0 female
Leibkonnatüüp rahvuse alusel
Ethnic nationality of the household
eesti 16.4 33.3 28.3 22.0 100.0 Estonian sega 18.1 34.5 29.8 17.6 100.0 mixed mitte-eesti 12.1 36.5 30.2 21.2 100.0 non-Estonian
Leibkonnapea haridustase
Level of education of head of the household
esimene või madalam tase
18.5 48.9 25.2 7.4 100.0 below upper secondary education
teine tase 17.8 34.7 28.1 19.4 100.0 upper secondary educationkolmas tase 9.1 22.8 33.2 35.0 100.0 tertiary education
Leibkonnapea hõiveseisund
Labour status of head of the household
töötav 14.4 26.1 30.5 29.0 100.0 working vanaduspensionär 13.4 52.4 28.4 5.7 100.0 retired muu 30.9 37.7 18.3 (13.1) 100.0 other
Leibkonna tulukvintiil
Quintile of the household income
madalaim kvintiil 29.0 38.8 20.8 11.4 100.0 the lowest quintile teine kvintiil 15.2 47.4 32.2 (5.3) 100.0 the second quintile kolmas kvintiil 19.0 38.1 29.2 13.7 100.0 the third quintile neljas kvintiil 9.3 31.3 32.1 27.3 100.0 the fourth quintile kõrgeim kvintiil 5.0 15.6 30.4 48.9 100.0 the highest quintile
Omandisuhe eluruumi Tenure status of household omanik ja tasuta kasutaja
15.1 34.2 29.3 21.3 100.0 owner or rent free
üürnik 19.5 34.4 24.1 (21.9) 100.0 tenant Elukoht Place of residence
linn 11.9 32.4 31.2 24.5 100.0 urban maa 24.2 38.8 23.4 13.5 100.0 rural
KOKKU 15.5 34.2 28.9 21.3 100.0 TOTAL

SISSETULEK JA ELAMISTINGIMUSED TABELID
Income and Living Conditions Tables
STATISTIKAAMET
Statistical Office of Estonia 65
Tabel 9. Vaesusriski määr pärast siirdeid piirkonna järgi, 2003 Table 9. At-risk-of-poverty rate after transfers by region, 2003 (protsenti — percentage)
Kokku Mehed Naised Total Males Females
Põhja-Eesti 15.8 14.8 16.6 Northern Estonia Kesk-Eesti 21.5 20.8 22.1 Central Estonia Kirde-Eesti 29.7 28.5 30.6 North-Eastern Estonia Lääne-Eesti 20.8 21.2 20.5 Western Estonia Lõuna-Eesti 26.9 27.9 26.0 Southern Estonia Eesti 21.6 21.3 21.9 Estonia
Tabel 10. Vaesusriski määr enne siirdeid (v.a pensionid) piirkonna järgi, 2003 Table 10. At-risk-of-poverty rate before transfers (excl. pensions) by region, 2003 (protsenti — percentage)
Kokku Mehed Naised Total Males Females
Põhja-Eesti 18.4 17.2 19.4 Northern Estonia Kesk-Eesti 30.0 29.3 30.5 Central Estonia Kirde-Eesti 35.7 34.9 36.2 North-Eastern Estonia Lääne-Eesti 27.7 28.1 27.4 Western Estonia Lõuna-Eesti 36.1 36.7 35.5 Southern Estonia Eesti 27.5 27.1 27.9 Estonia
Tabel 11. Vaesusriski määr enne siirdeid (k.a pensionid) piirkonna järgi, 2003 Table 11. At-risk-of-poverty rate before transfers (incl. pensions) by region, 2003 (protsenti — percentage)
Kokku Mehed Naised Total Males Females
Põhja-Eesti 30.6 27.3 33.4 Northern Estonia Kesk-Eesti 41.5 38.7 44.1 Central Estonia Kirde-Eesti 54.4 51.4 56.7 North-Eastern Estonia Lääne-Eesti 46.2 43.2 48.9 Western Estonia Lõuna-Eesti 51.0 49.3 52.5 Southern Estonia Eesti 42.0 39.2 44.4 Estonia
Tabel 12. Vaesusriski määr vanuserühma ja soo järgi, 2003 Table 12. At-risk-of-poverty rate by age group and gender, 2003 (protsenti — percentage)
Kokku Mehed Naised Total Males Females
Kokku 21.6 21.2 21.9 Total 0–15 24.3 24.3 24.2 0–15 16–24 23.2 20.3 26.3 16–24 25–34 19.1 19.6 18.6 25–34 35–44 20.7 20.2 21.2 35–44 45–54 23.8 26.4 21.6 45–54 55–64 19.2 21.9 17.1 55–64 65 ja vanemad 19.9 14.1 22.8 65 and older
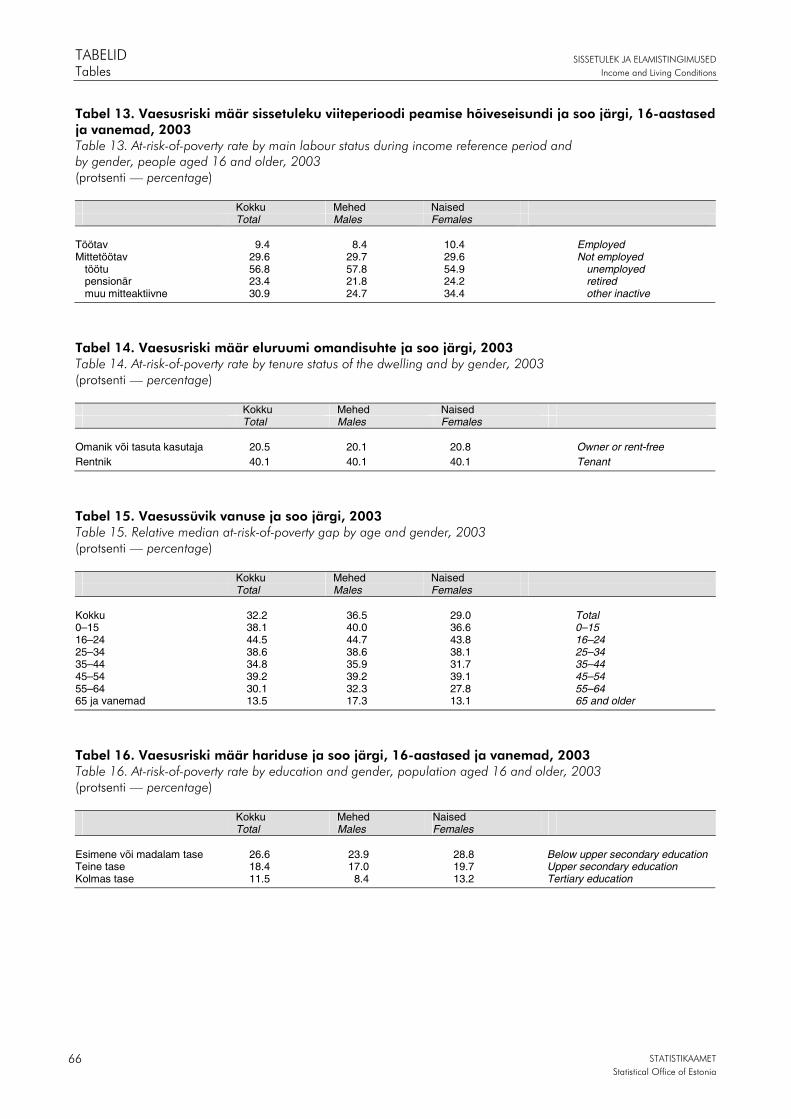
TABELID SISSETULEK JA ELAMISTINGIMUSED
Tables Income and Living Conditions
STATISTIKAAMET
Statistical Office of Estonia 66
Tabel 13. Vaesusriski määr sissetuleku viiteperioodi peamise hõiveseisundi ja soo järgi, 16-aastased ja vanemad, 2003 Table 13. At-risk-of-poverty rate by main labour status during income reference period and by gender, people aged 16 and older, 2003 (protsenti — percentage)
Kokku Mehed Naised Total Males Females
Töötav 9.4 8.4 10.4 Employed Mittetöötav 29.6 29.7 29.6 Not employed
töötu 56.8 57.8 54.9 unemployed pensionär 23.4 21.8 24.2 retired muu mitteaktiivne 30.9 24.7 34.4 other inactive
Tabel 14. Vaesusriski määr eluruumi omandisuhte ja soo järgi, 2003 Table 14. At-risk-of-poverty rate by tenure status of the dwelling and by gender, 2003 (protsenti — percentage)
Kokku Mehed Naised Total Males Females
Omanik või tasuta kasutaja 20.5 20.1 20.8 Owner or rent-free Rentnik 40.1 40.1 40.1 Tenant
Tabel 15. Vaesussüvik vanuse ja soo järgi, 2003 Table 15. Relative median at-risk-of-poverty gap by age and gender, 2003 (protsenti — percentage)
Kokku Mehed Naised Total Males Females
Kokku 32.2 36.5 29.0 Total 0–15 38.1 40.0 36.6 0–15 16–24 44.5 44.7 43.8 16–24 25–34 38.6 38.6 38.1 25–34 35–44 34.8 35.9 31.7 35–44 45–54 39.2 39.2 39.1 45–54 55–64 30.1 32.3 27.8 55–64 65 ja vanemad 13.5 17.3 13.1 65 and older
Tabel 16. Vaesusriski määr hariduse ja soo järgi, 16-aastased ja vanemad, 2003 Table 16. At-risk-of-poverty rate by education and gender, population aged 16 and older, 2003 (protsenti — percentage)
Kokku Mehed Naised Total Males Females
Esimene või madalam tase 26.6 23.9 28.8 Below upper secondary education Teine tase 18.4 17.0 19.7 Upper secondary education Kolmas tase 11.5 8.4 13.2 Tertiary education
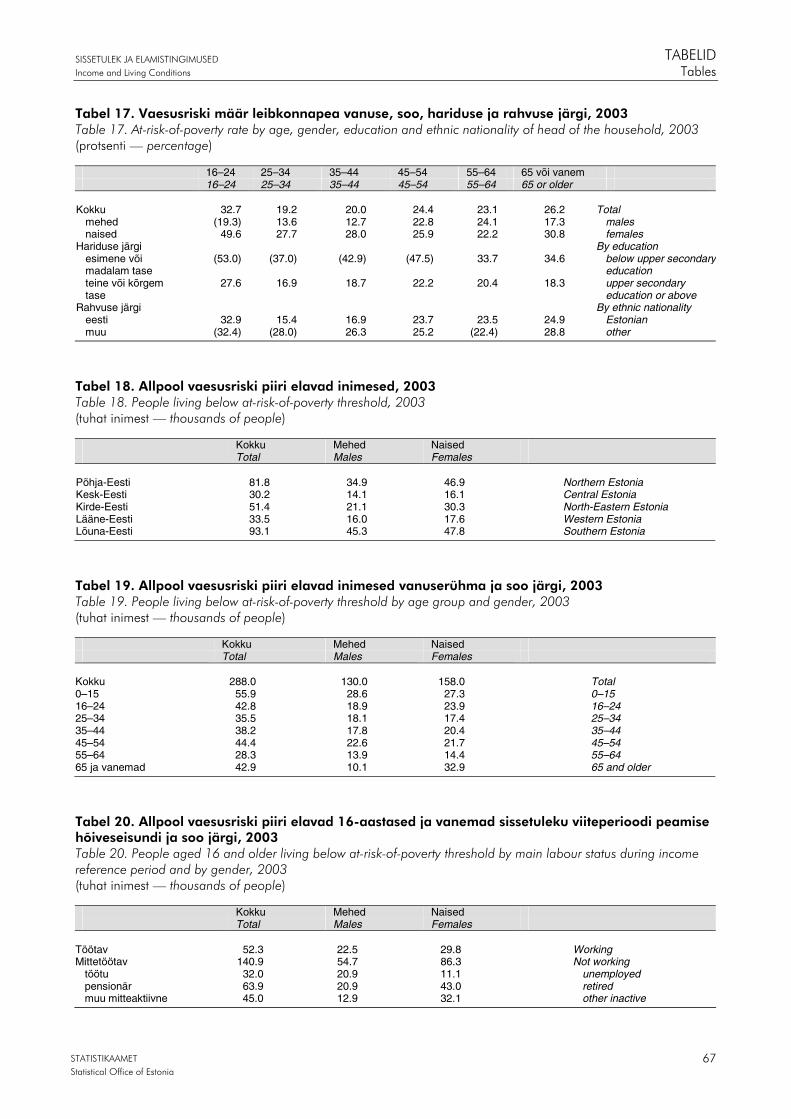
SISSETULEK JA ELAMISTINGIMUSED TABELID
Income and Living Conditions Tables
STATISTIKAAMET
Statistical Office of Estonia 67
Tabel 17. Vaesusriski määr leibkonnapea vanuse, soo, hariduse ja rahvuse järgi, 2003 Table 17. At-risk-of-poverty rate by age, gender, education and ethnic nationality of head of the household, 2003 (protsenti — percentage)
16–24 25–34 35–44 45–54 55–64 65 või vanem 16–24 25–34 35–44 45–54 55–64 65 or older
Kokku 32.7 19.2 20.0 24.4 23.1 26.2 Total
mehed (19.3) 13.6 12.7 22.8 24.1 17.3 males naised 49.6 27.7 28.0 25.9 22.2 30.8 females
Hariduse järgi By education esimene või madalam tase
(53.0) (37.0) (42.9) (47.5) 33.7 34.6 below upper secondaryeducation
teine või kõrgem tase
27.6 16.9 18.7 22.2 20.4 18.3 upper secondary education or above
Rahvuse järgi By ethnic nationality eesti 32.9 15.4 16.9 23.7 23.5 24.9 Estonian muu (32.4) (28.0) 26.3 25.2 (22.4) 28.8 other
Tabel 18. Allpool vaesusriski piiri elavad inimesed, 2003 Table 18. People living below at-risk-of-poverty threshold, 2003 (tuhat inimest — thousands of people)
Kokku Mehed Naised Total Males Females
Põhja-Eesti 81.8 34.9 46.9 Northern Estonia Kesk-Eesti 30.2 14.1 16.1 Central Estonia Kirde-Eesti 51.4 21.1 30.3 North-Eastern Estonia Lääne-Eesti 33.5 16.0 17.6 Western Estonia Lõuna-Eesti 93.1 45.3 47.8 Southern Estonia
Tabel 19. Allpool vaesusriski piiri elavad inimesed vanuserühma ja soo järgi, 2003 Table 19. People living below at-risk-of-poverty threshold by age group and gender, 2003 (tuhat inimest — thousands of people)
Kokku Mehed Naised Total Males Females
Kokku 288.0 130.0 158.0 Total 0–15 55.9 28.6 27.3 0–15 16–24 42.8 18.9 23.9 16–24 25–34 35.5 18.1 17.4 25–34 35–44 38.2 17.8 20.4 35–44 45–54 44.4 22.6 21.7 45–54 55–64 28.3 13.9 14.4 55–64 65 ja vanemad 42.9 10.1 32.9 65 and older
Tabel 20. Allpool vaesusriski piiri elavad 16-aastased ja vanemad sissetuleku viiteperioodi peamise hõiveseisundi ja soo järgi, 2003 Table 20. People aged 16 and older living below at-risk-of-poverty threshold by main labour status during income reference period and by gender, 2003 (tuhat inimest — thousands of people)
Kokku Mehed Naised Total Males Females
Töötav 52.3 22.5 29.8 Working Mittetöötav 140.9 54.7 86.3 Not working
töötu 32.0 20.9 11.1 unemployed pensionär 63.9 20.9 43.0 retired muu mitteaktiivne 45.0 12.9 32.1 other inactive

TABELID SISSETULEK JA ELAMISTINGIMUSED
Tables Income and Living Conditions
STATISTIKAAMET
Statistical Office of Estonia 68
Tabel 21. Elamistingimused ja tervis, 2004 Table 21. Living conditions and general assessment of health, 2004 (protsenti — percentage)
Hea Ei hea ega halb
Halb
Good Neither good nor bad
Bad
Elamu tüüp Type of dwelling
ühepereelamu 27.1 26.7 34.7 one-family dwelling mitmepereelamu 4.8 3.7 4.3 semi-family dwelling korterelamu 67.1 68.7 60.9 block of flats muu … … 0.1 other kokku 100.0 100.0 100.0 total
Elamu ehitusaeg Time of construction of the dwelling enne 1946 16.2 18.8 26.3 before 1946 1946–1960 9.0 10.6 13.7 1946–1960 1961–1970 15.7 19.5 20.0 1961–1970 1971–1980 25.0 24.1 21.3 1971–1980 1981–1990 21.3 21.4 13.7 1981–1990 1991 või hiljem 8.5 2.9 (2.2) 1991 or later teadmata 4.3 2.7 (2.8) unknown kokku 100.0 100.0 100.0 total
Eluruumi kasulik pind (isiku kohta)
Useful floor area of the dwelling (per capita)
kuni 15 m2 25.0 18.6 12.8 up to 15 m2
15–30 m2 52.6 50.2 47.1 15–30 m2
üle 30 m2 22.4 31.2 40.1 more than 30 m2
kokku 100.0 100.0 100.0 total Eluruum Amenities of the dwelling
veevärgiga 92.2 85.3 76.1 with water supply system veevärgita 7.8 14.7 23.9 without water supply system kokku 100.0 100.0 100.0 total kanalisatsiooniga 91.3 83.7 74.2 with sewage disposal system kanalisatsioonita 8.7 16.3 25.8 without sewage disposal system kokku 100.0 100.0 100.0 total soe vesi 81.9 72.6 57.9 with hot water sooja veeta 18.1 27.4 42.1 without hot water kokku 100.0 100.0 100.0 total keskküttega 67.8 65.2 53.8 with central heating keskkütteta 32.2 34.8 46.2 without central heating kokku 100.0 100.0 100.0 total gaasi- või elektripliidiga 93.1 87.9 78.4 with gas or electric stove gaasi või elektripliitita 6.9 12.1 21.6 without gas or electric stove kokku 100.0 100.0 100.0 total telefoniga (v.a mobiiltelefon)
57.5 49.3 40.6 with telephone (excl. mobile phone)
telefonita (v.a mobiiltelefon)
42.5 50.7 59.4 without telephone (excl. mobile phone)
kokku 100.0 100.0 100.0 total
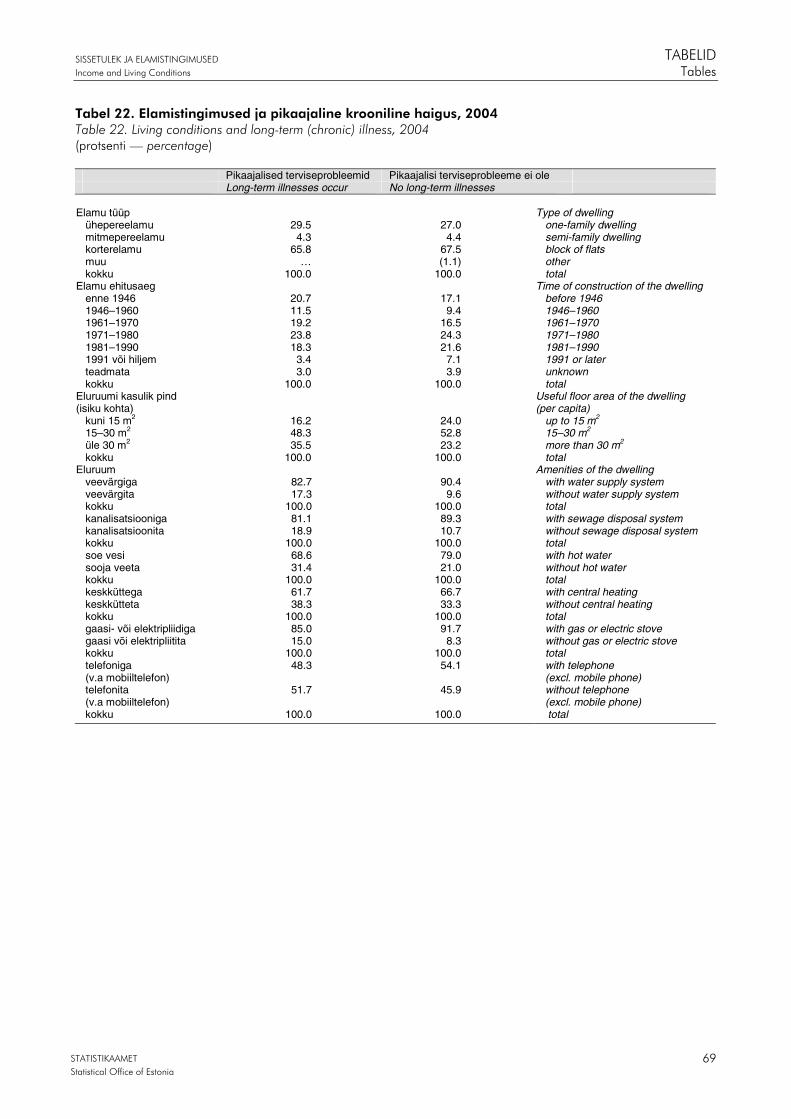
SISSETULEK JA ELAMISTINGIMUSED TABELID
Income and Living Conditions Tables
STATISTIKAAMET
Statistical Office of Estonia 69
Tabel 22. Elamistingimused ja pikaajaline krooniline haigus, 2004 Table 22. Living conditions and long-term (chronic) illness, 2004 (protsenti — percentage)
Pikaajalised terviseprobleemid Pikaajalisi terviseprobleeme ei ole Long-term illnesses occur No long-term illnesses
Elamu tüüp Type of dwelling
ühepereelamu 29.5 27.0 one-family dwelling mitmepereelamu 4.3 4.4 semi-family dwelling korterelamu 65.8 67.5 block of flats muu … (1.1) other kokku 100.0 100.0 total
Elamu ehitusaeg Time of construction of the dwelling enne 1946 20.7 17.1 before 1946 1946–1960 11.5 9.4 1946–1960 1961–1970 19.2 16.5 1961–1970 1971–1980 23.8 24.3 1971–1980 1981–1990 18.3 21.6 1981–1990 1991 või hiljem 3.4 7.1 1991 or later teadmata 3.0 3.9 unknown kokku 100.0 100.0 total
Eluruumi kasulik pind (isiku kohta)
Useful floor area of the dwelling (per capita)
kuni 15 m2 16.2 24.0 up to 15 m2
15–30 m2 48.3 52.8 15–30 m2
üle 30 m2 35.5 23.2 more than 30 m2
kokku 100.0 100.0 total Eluruum Amenities of the dwelling
veevärgiga 82.7 90.4 with water supply system veevärgita 17.3 9.6 without water supply system kokku 100.0 100.0 total kanalisatsiooniga 81.1 89.3 with sewage disposal system kanalisatsioonita 18.9 10.7 without sewage disposal system kokku 100.0 100.0 total soe vesi 68.6 79.0 with hot water sooja veeta 31.4 21.0 without hot water kokku 100.0 100.0 total keskküttega 61.7 66.7 with central heating keskkütteta 38.3 33.3 without central heating kokku 100.0 100.0 total gaasi- või elektripliidiga 85.0 91.7 with gas or electric stove gaasi või elektripliitita 15.0 8.3 without gas or electric stove kokku 100.0 100.0 total telefoniga (v.a mobiiltelefon)
48.3 54.1 with telephone (excl. mobile phone)
telefonita (v.a mobiiltelefon)
51.7 45.9 without telephone (excl. mobile phone)
kokku 100.0 100.0 total
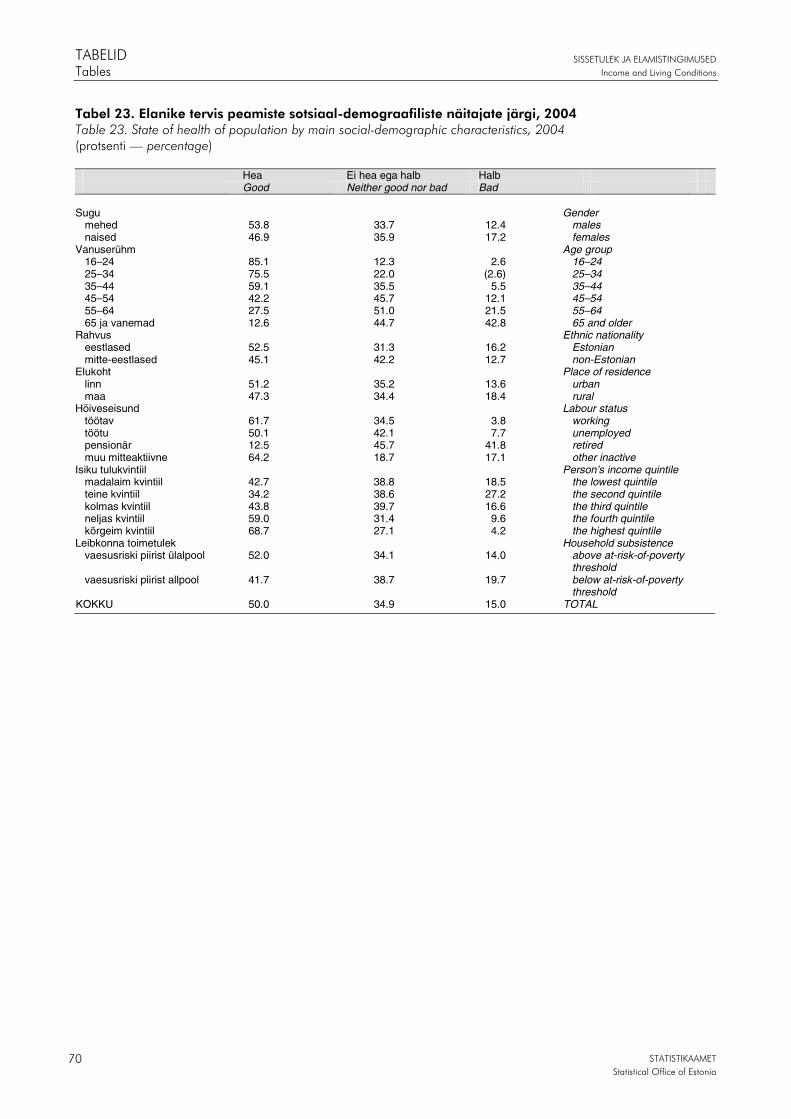
TABELID SISSETULEK JA ELAMISTINGIMUSED
Tables Income and Living Conditions
STATISTIKAAMET
Statistical Office of Estonia 70
Tabel 23. Elanike tervis peamiste sotsiaal-demograafiliste näitajate järgi, 2004 Table 23. State of health of population by main social-demographic characteristics, 2004 (protsenti — percentage)
Hea Ei hea ega halb Halb Good Neither good nor bad Bad
Sugu Gender
mehed 53.8 33.7 12.4 males naised 46.9 35.9 17.2 females
Vanuserühm Age group 16–24 85.1 12.3 2.6 16–24 25–34 75.5 22.0 (2.6) 25–34 35–44 59.1 35.5 5.5 35–44 45–54 42.2 45.7 12.1 45–54 55–64 27.5 51.0 21.5 55–64 65 ja vanemad 12.6 44.7 42.8 65 and older
Rahvus Ethnic nationality eestlased 52.5 31.3 16.2 Estonian mitte-eestlased 45.1 42.2 12.7 non-Estonian
Elukoht Place of residence linn 51.2 35.2 13.6 urban maa 47.3 34.4 18.4 rural
Hõiveseisund Labour status töötav 61.7 34.5 3.8 working töötu 50.1 42.1 7.7 unemployed pensionär 12.5 45.7 41.8 retired muu mitteaktiivne 64.2 18.7 17.1 other inactive
Isiku tulukvintiil Person’s income quintile madalaim kvintiil 42.7 38.8 18.5 the lowest quintile teine kvintiil 34.2 38.6 27.2 the second quintile kolmas kvintiil 43.8 39.7 16.6 the third quintile neljas kvintiil 59.0 31.4 9.6 the fourth quintile kõrgeim kvintiil 68.7 27.1 4.2 the highest quintile
Leibkonna toimetulek Household subsistence vaesusriski piirist ülalpool 52.0 34.1 14.0 above at-risk-of-poverty
threshold vaesusriski piirist allpool 41.7 38.7 19.7 below at-risk-of-poverty
threshold KOKKU 50.0 34.9 15.0 TOTAL

SISSETULEK JA ELAMISTINGIMUSED TABELID
Income and Living Conditions Tables
STATISTIKAAMET
Statistical Office of Estonia 71
Tabel 24. Pikaajalise (kroonilise) haiguse esinemine peamiste sotsiaal-demograafiliste näitajate järgi, 2004 Table 24. Occurrence of long-term (chronic) illness by main social-demographic characteristics, 2004 (protsenti — percentage)
Pikaajaline haigus on Pikaajalist haigust ei ole Long-term illnesses occur No long-term illnesses
Sugu Gender
mehed 35.6 63.7 males naised 45.2 54.1 females
Vanuserühm Age group 16–24 16.4 83.4 16–24 25–34 21.7 78.0 25–34 35–44 28.7 70.9 35–44 45–54 41.3 58.1 45–54 55–64 56.9 41.9 55–64 65 ja vanemad 77.6 21.1 65 and older
Rahvus Ethnic nationality eestlased 41.4 57.9 Estonian mitte-eestlased 40.0 59.4 non-Estonian
Elukoht Place of residence linn 39.1 60.3 urban maa 45.1 54.1 rural
Hõiveseisund Labour status töötav 28.2 71.2 working töötu 33.8 65.9 unemployed pensionär 76.1 22.8 retired muu mitteaktiivne 36.2 63.4 other inactive
Isiku tulukvintiil Person’s income quintile madalaim kvintiil 45.9 53.5 the lowest quintile teine kvintiil 54.5 44.7 the second quintile kolmas kvintiil 46.2 53.1 the third quintile neljas kvintiil 32.6 67.1 the fourth quintile kõrgeim kvintiil 26.6 72.5 the highest quintile
Leibkonna toimetulek Household subsistence vaesusriski piirist ülalpool 39.4 59.9 above at-risk-of-poverty
threshold vaesusriski piirist allpool 47.5 51.9 below at-risk-of-poverty
threshold KOKKU 40.9 58.4 TOTAL
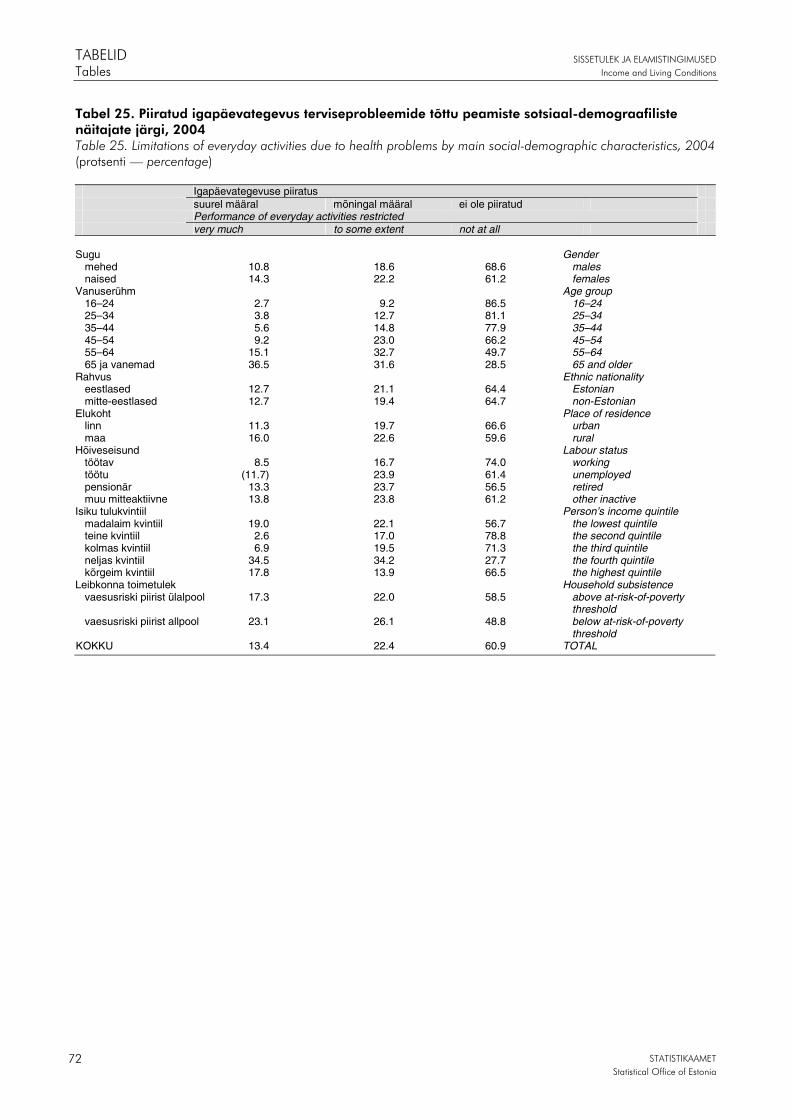
TABELID SISSETULEK JA ELAMISTINGIMUSED
Tables Income and Living Conditions
STATISTIKAAMET
Statistical Office of Estonia 72
Tabel 25. Piiratud igapäevategevus terviseprobleemide tõttu peamiste sotsiaal-demograafiliste näitajate järgi, 2004 Table 25. Limitations of everyday activities due to health problems by main social-demographic characteristics, 2004 (protsenti — percentage)
Igapäevategevuse piiratus suurel määral mõningal määral ei ole piiratud Performance of everyday activities restricted very much to some extent not at all
Sugu Gender
mehed 10.8 18.6 68.6 males naised 14.3 22.2 61.2 females
Vanuserühm Age group 16–24 2.7 9.2 86.5 16–24 25–34 3.8 12.7 81.1 25–34 35–44 5.6 14.8 77.9 35–44 45–54 9.2 23.0 66.2 45–54 55–64 15.1 32.7 49.7 55–64 65 ja vanemad 36.5 31.6 28.5 65 and older
Rahvus Ethnic nationality eestlased 12.7 21.1 64.4 Estonian mitte-eestlased 12.7 19.4 64.7 non-Estonian
Elukoht Place of residence linn 11.3 19.7 66.6 urban maa 16.0 22.6 59.6 rural
Hõiveseisund Labour status töötav 8.5 16.7 74.0 working töötu (11.7) 23.9 61.4 unemployed pensionär 13.3 23.7 56.5 retired muu mitteaktiivne 13.8 23.8 61.2 other inactive
Isiku tulukvintiil Person’s income quintile madalaim kvintiil 19.0 22.1 56.7 the lowest quintile teine kvintiil 2.6 17.0 78.8 the second quintile kolmas kvintiil 6.9 19.5 71.3 the third quintile neljas kvintiil 34.5 34.2 27.7 the fourth quintile kõrgeim kvintiil 17.8 13.9 66.5 the highest quintile
Leibkonna toimetulek Household subsistence vaesusriski piirist ülalpool 17.3 22.0 58.5 above at-risk-of-poverty
threshold vaesusriski piirist allpool 23.1 26.1 48.8 below at-risk-of-poverty
threshold KOKKU 13.4 22.4 60.9 TOTAL

SISSETULEK JA ELAMISTINGIMUSED TABELID
Income and Living Conditions Tables
STATISTIKAAMET
Statistical Office of Estonia 73
Tabel 26. Perearsti abi kättesaadavus peamiste sotsiaal-demograafiliste näitajate järgi, 2004 Table 26. Accessibility of help or consultation of general practitioner by main social-demographic characteristics, 2004 (protsenti — percentage)
Ei saanud vajadusel arstiabi Probleeme ei olnud Did not get the help or consultation Did not have a problem
Sugu Gender
mehed 6.6 93.2 males naised 6.7 93.2 females
Vanuserühm Age group 16–24 4.2 95.7 16–24 25–34 7.6 92.2 25–34 35–44 7.5 92.5 35–44 45–54 9.1 90.7 45–54 55–64 7.4 92.4 55–64 65 ja vanemad 4.5 95.5 65 and older
Rahvus Ethnic nationality eestlased 5.6 94.2 Estonian mitte-eestlased 8.6 91.2 non-Estonian
Elukoht Place of residence linn 6.8 93.0 urban maa 6.2 93.7 rural
Hõiveseisund Labour status töötav 5.5 94.3 working töötu 23.0 76.9 unemployed pensionär 5.1 94.8 retired muu mitteaktiivne 5.7 94.2 other inactive
Isiku tulukvintiil Person’s income quintile madalaim kvintiil 12.3 87.5 the lowest quintile teine kvintiil 6.0 93.9 the second quintile kolmas kvintiil 5.2 94.8 the third quintile neljas kvintiil 6.0 93.6 the fourth quintile kõrgeim kvintiil 4.7 95.3 the highest quintile
Leibkonna toimetulek Household subsistence vaesusriski piirist ülalpool 5.5 94.3 above at-risk-of-poverty
threshold vaesusriski piirist allpool 11.3 88.6 below at-risk-of-poverty
threshold KOKKU 6.6 93.2 TOTAL
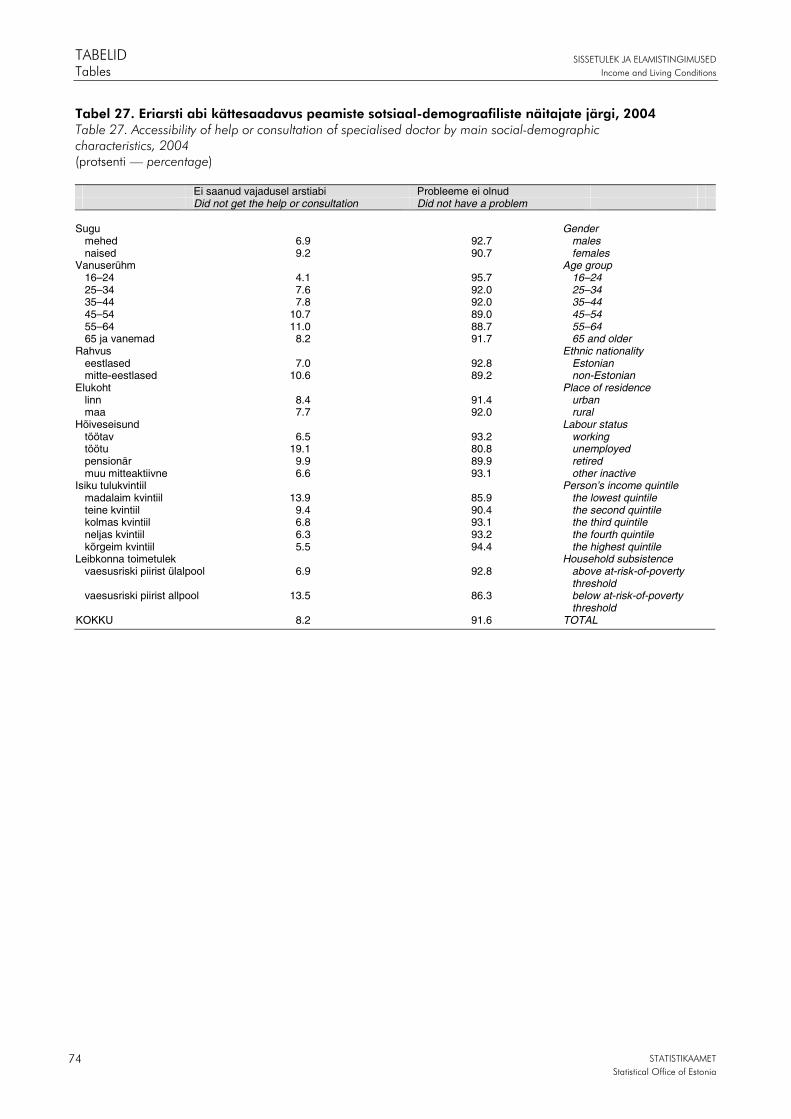
TABELID SISSETULEK JA ELAMISTINGIMUSED
Tables Income and Living Conditions
STATISTIKAAMET
Statistical Office of Estonia 74
Tabel 27. Eriarsti abi kättesaadavus peamiste sotsiaal-demograafiliste näitajate järgi, 2004 Table 27. Accessibility of help or consultation of specialised doctor by main social-demographic characteristics, 2004 (protsenti — percentage)
Ei saanud vajadusel arstiabi Probleeme ei olnud Did not get the help or consultation Did not have a problem
Sugu Gender
mehed 6.9 92.7 males naised 9.2 90.7 females
Vanuserühm Age group 16–24 4.1 95.7 16–24 25–34 7.6 92.0 25–34 35–44 7.8 92.0 35–44 45–54 10.7 89.0 45–54 55–64 11.0 88.7 55–64 65 ja vanemad 8.2 91.7 65 and older
Rahvus Ethnic nationality eestlased 7.0 92.8 Estonian mitte-eestlased 10.6 89.2 non-Estonian
Elukoht Place of residence linn 8.4 91.4 urban maa 7.7 92.0 rural
Hõiveseisund Labour status töötav 6.5 93.2 working töötu 19.1 80.8 unemployed pensionär 9.9 89.9 retired muu mitteaktiivne 6.6 93.1 other inactive
Isiku tulukvintiil Person’s income quintile madalaim kvintiil 13.9 85.9 the lowest quintile teine kvintiil 9.4 90.4 the second quintile kolmas kvintiil 6.8 93.1 the third quintile neljas kvintiil 6.3 93.2 the fourth quintile kõrgeim kvintiil 5.5 94.4 the highest quintile
Leibkonna toimetulek Household subsistence vaesusriski piirist ülalpool 6.9 92.8 above at-risk-of-poverty
threshold vaesusriski piirist allpool 13.5 86.3 below at-risk-of-poverty
threshold KOKKU 8.2 91.6 TOTAL
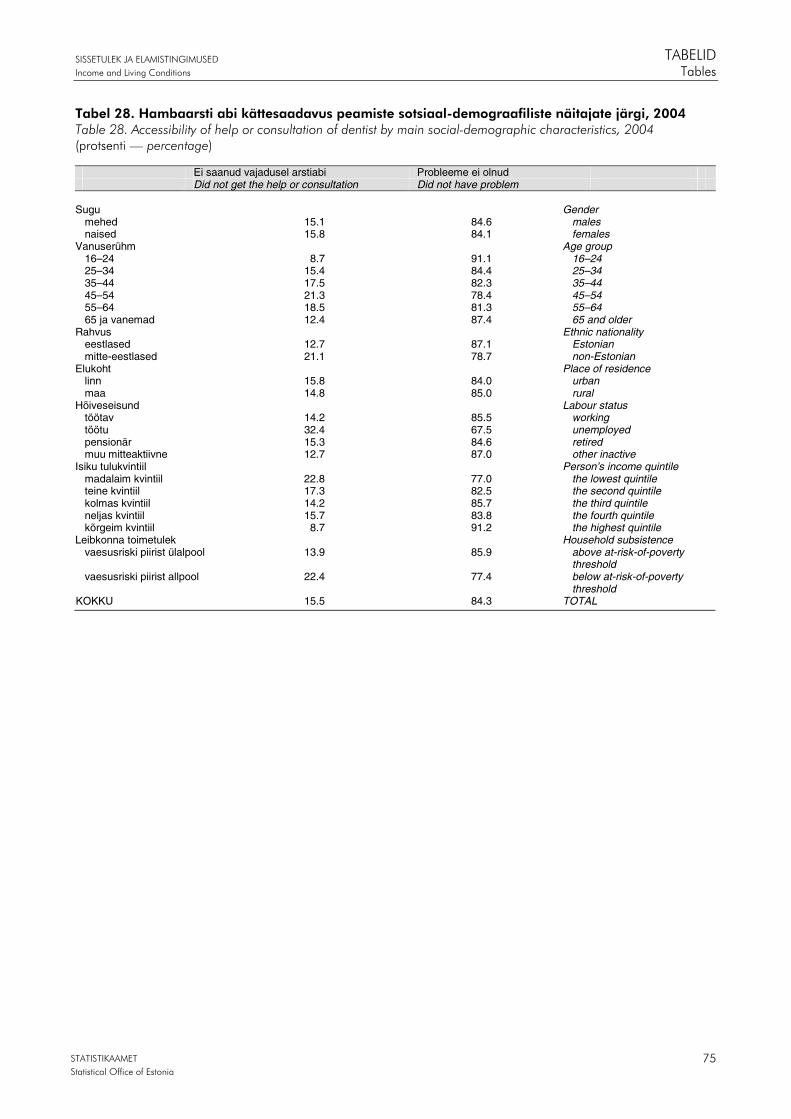
SISSETULEK JA ELAMISTINGIMUSED TABELID
Income and Living Conditions Tables
STATISTIKAAMET
Statistical Office of Estonia 75
Tabel 28. Hambaarsti abi kättesaadavus peamiste sotsiaal-demograafiliste näitajate järgi, 2004 Table 28. Accessibility of help or consultation of dentist by main social-demographic characteristics, 2004 (protsenti — percentage)
Ei saanud vajadusel arstiabi Probleeme ei olnud Did not get the help or consultation Did not have problem
Sugu Gender
mehed 15.1 84.6 males naised 15.8 84.1 females
Vanuserühm Age group 16–24 8.7 91.1 16–24 25–34 15.4 84.4 25–34 35–44 17.5 82.3 35–44 45–54 21.3 78.4 45–54 55–64 18.5 81.3 55–64 65 ja vanemad 12.4 87.4 65 and older
Rahvus Ethnic nationality eestlased 12.7 87.1 Estonian mitte-eestlased 21.1 78.7 non-Estonian
Elukoht Place of residence linn 15.8 84.0 urban maa 14.8 85.0 rural
Hõiveseisund Labour status töötav 14.2 85.5 working töötu 32.4 67.5 unemployed pensionär 15.3 84.6 retired muu mitteaktiivne 12.7 87.0 other inactive
Isiku tulukvintiil Person’s income quintile madalaim kvintiil 22.8 77.0 the lowest quintile teine kvintiil 17.3 82.5 the second quintile kolmas kvintiil 14.2 85.7 the third quintile neljas kvintiil 15.7 83.8 the fourth quintile kõrgeim kvintiil 8.7 91.2 the highest quintile
Leibkonna toimetulek Household subsistence vaesusriski piirist ülalpool 13.9 85.9 above at-risk-of-poverty
threshold vaesusriski piirist allpool 22.4 77.4 below at-risk-of-poverty
threshold KOKKU 15.5 84.3 TOTAL
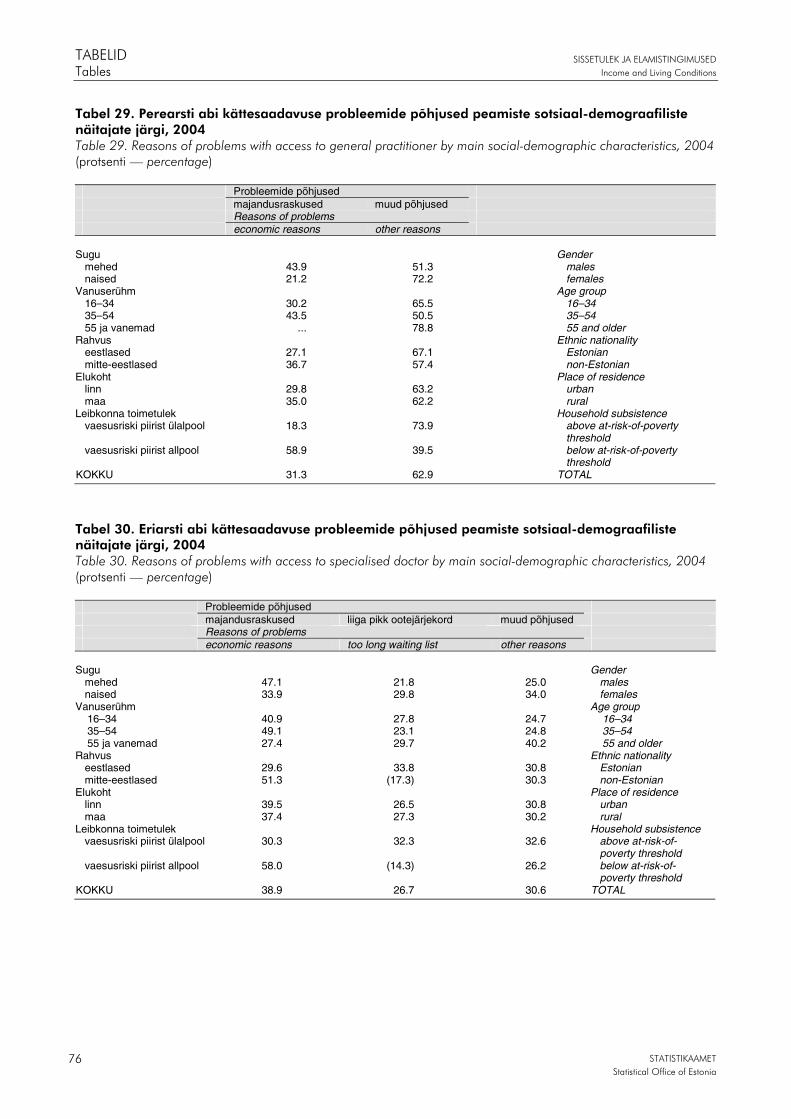
TABELID SISSETULEK JA ELAMISTINGIMUSED
Tables Income and Living Conditions
STATISTIKAAMET
Statistical Office of Estonia 76
Tabel 29. Perearsti abi kättesaadavuse probleemide põhjused peamiste sotsiaal-demograafiliste näitajate järgi, 2004 Table 29. Reasons of problems with access to general practitioner by main social-demographic characteristics, 2004 (protsenti — percentage)
Probleemide põhjused majandusraskused muud põhjused Reasons of problems economic reasons other reasons
Sugu Gender
mehed 43.9 51.3 males naised 21.2 72.2 females
Vanuserühm Age group 16–34 30.2 65.5 16–34 35–54 43.5 50.5 35–54 55 ja vanemad ... 78.8 55 and older
Rahvus Ethnic nationality eestlased 27.1 67.1 Estonian mitte-eestlased 36.7 57.4 non-Estonian
Elukoht Place of residence linn 29.8 63.2 urban maa 35.0 62.2 rural
Leibkonna toimetulek Household subsistence vaesusriski piirist ülalpool 18.3 73.9 above at-risk-of-poverty
threshold vaesusriski piirist allpool 58.9 39.5 below at-risk-of-poverty
threshold KOKKU 31.3 62.9 TOTAL
Tabel 30. Eriarsti abi kättesaadavuse probleemide põhjused peamiste sotsiaal-demograafiliste näitajate järgi, 2004 Table 30. Reasons of problems with access to specialised doctor by main social-demographic characteristics, 2004 (protsenti — percentage)
Probleemide põhjused majandusraskused liiga pikk ootejärjekord muud põhjused Reasons of problems economic reasons too long waiting list other reasons
Sugu Gender
mehed 47.1 21.8 25.0 males naised 33.9 29.8 34.0 females
Vanuserühm Age group 16–34 40.9 27.8 24.7 16–34 35–54 49.1 23.1 24.8 35–54 55 ja vanemad 27.4 29.7 40.2 55 and older
Rahvus Ethnic nationality eestlased 29.6 33.8 30.8 Estonian mitte-eestlased 51.3 (17.3) 30.3 non-Estonian
Elukoht Place of residence linn 39.5 26.5 30.8 urban maa 37.4 27.3 30.2 rural
Leibkonna toimetulek Household subsistence vaesusriski piirist ülalpool 30.3 32.3 32.6 above at-risk-of-
poverty threshold vaesusriski piirist allpool 58.0 (14.3) 26.2 below at-risk-of-
poverty threshold KOKKU 38.9 26.7 30.6 TOTAL
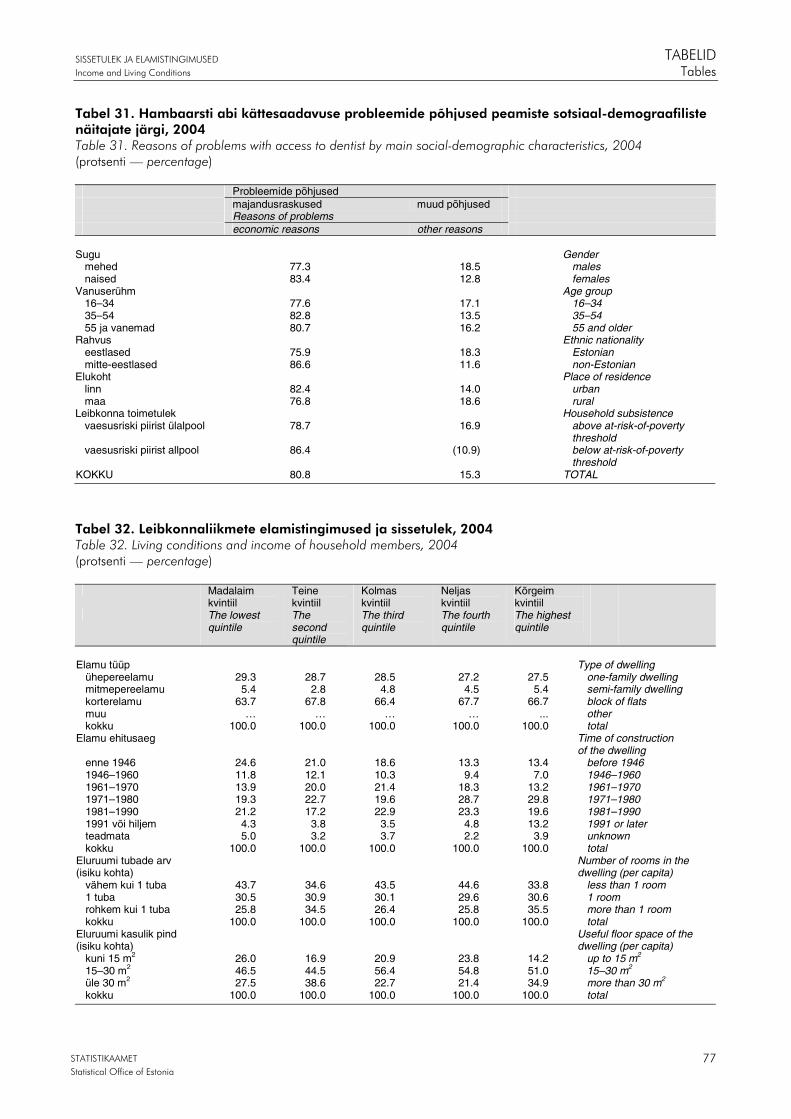
SISSETULEK JA ELAMISTINGIMUSED TABELID
Income and Living Conditions Tables
STATISTIKAAMET
Statistical Office of Estonia 77
Tabel 31. Hambaarsti abi kättesaadavuse probleemide põhjused peamiste sotsiaal-demograafiliste näitajate järgi, 2004 Table 31. Reasons of problems with access to dentist by main social-demographic characteristics, 2004 (protsenti — percentage)
Probleemide põhjused majandusraskused muud põhjused Reasons of problems economic reasons other reasons
Sugu Gender
mehed 77.3 18.5 males naised 83.4 12.8 females
Vanuserühm Age group 16–34 77.6 17.1 16–34 35–54 82.8 13.5 35–54 55 ja vanemad 80.7 16.2 55 and older
Rahvus Ethnic nationality eestlased 75.9 18.3 Estonian mitte-eestlased 86.6 11.6 non-Estonian
Elukoht Place of residence linn 82.4 14.0 urban maa 76.8 18.6 rural
Leibkonna toimetulek Household subsistence vaesusriski piirist ülalpool 78.7 16.9 above at-risk-of-poverty
threshold vaesusriski piirist allpool 86.4 (10.9) below at-risk-of-poverty
threshold KOKKU 80.8 15.3 TOTAL
Tabel 32. Leibkonnaliikmete elamistingimused ja sissetulek, 2004 Table 32. Living conditions and income of household members, 2004 (protsenti — percentage)
Madalaim kvintiil
Teine kvintiil
Kolmas kvintiil
Neljas kvintiil
Kõrgeim kvintiil
The lowest quintile
The second quintile
The third quintile
The fourth quintile
The highest quintile
Elamu tüüp Type of dwelling
ühepereelamu 29.3 28.7 28.5 27.2 27.5 one-family dwelling mitmepereelamu 5.4 2.8 4.8 4.5 5.4 semi-family dwelling korterelamu 63.7 67.8 66.4 67.7 66.7 block of flats muu … … … … ... other kokku 100.0 100.0 100.0 100.0 100.0 total
Elamu ehitusaeg Time of construction of the dwelling
enne 1946 24.6 21.0 18.6 13.3 13.4 before 1946 1946–1960 11.8 12.1 10.3 9.4 7.0 1946–1960 1961–1970 13.9 20.0 21.4 18.3 13.2 1961–1970 1971–1980 19.3 22.7 19.6 28.7 29.8 1971–1980 1981–1990 21.2 17.2 22.9 23.3 19.6 1981–1990 1991 või hiljem 4.3 3.8 3.5 4.8 13.2 1991 or later teadmata 5.0 3.2 3.7 2.2 3.9 unknown kokku 100.0 100.0 100.0 100.0 100.0 total
Eluruumi tubade arv (isiku kohta)
Number of rooms in the dwelling (per capita)
vähem kui 1 tuba 43.7 34.6 43.5 44.6 33.8 less than 1 room 1 tuba 30.5 30.9 30.1 29.6 30.6 1 room rohkem kui 1 tuba 25.8 34.5 26.4 25.8 35.5 more than 1 room kokku 100.0 100.0 100.0 100.0 100.0 total
Eluruumi kasulik pind (isiku kohta)
Useful floor space of the dwelling (per capita)
kuni 15 m2 26.0 16.9 20.9 23.8 14.2 up to 15 m2
15–30 m2 46.5 44.5 56.4 54.8 51.0 15–30 m2
üle 30 m2 27.5 38.6 22.7 21.4 34.9 more than 30 m2
kokku 100.0 100.0 100.0 100.0 100.0 total

TABELID SISSETULEK JA ELAMISTINGIMUSED
Tables Income and Living Conditions
STATISTIKAAMET
Statistical Office of Estonia 78
Tabel 33. Leibkonnaliikmete hügieenivõimalused ja sissetulek, 2004 Table 33. Possibilities of hygiene and income of household members, 2004 (protsenti — percentage)
Madalaim kvintiil
Teine kvintiil
Kolmas kvintiil
Neljas kvintiil
Kõrgeim kvintiil
The lowest quintile
The second quintile
The third quintile
The fourth quintile
The highest quintile
Tualettruumi tüüp Type of the toilet eluruumis on veeklosett
69.6 75.9 79.0 85.1 93.0 there is a flush toilet in the dwelling
eluruumis ei ole veeklosetti
30.4 24.1 21.0 14.9 7.0 there is no flush toilet in the dwelling
kokku 100.0 100.0 100.0 100.0 100.0 total Pesemisvõimalused Washing facilities
omaette vann või dušš 66.1 72.4 77.4 82.5 92.6 separate bath or shower omaette vanni või dušši ei ole
33.9 27.6 22.6 17.5 7.4 there is no separate bath or shower in the dwelling
kokku 100.0 100.0 100.0 100.0 100.0 total Saun eluruumis Sauna in the dwelling
omaette saun 22.0 21.7 23.7 24.6 25.6 separate sauna omaette sauna ei ole 78.0 78.3 76.3 75.4 74.4 there is no separate saunakokku 100.0 100.0 100.0 100.0 100.0 total
Tabel 34. Leibkonnaliikmete eluruumiga seotud probleemid ja sissetulek, 2004 Table 34. Problems of household members concerning the dwelling and income, 2004 (protsenti — percentage)
Madalaim kvintiil
Teine kvintiil
Kolmas kvintiil
Neljas kvintiil
Kõrgeim kvintiil
The lowest quintile
The second quintile
The third quintile
The fourth quintile
The highest quintile
Eluruumiga seotud probleemid
Problems concerning the dwelling
lagi laseb läbi 12.5 9.5 7.4 6.0 5.1 the ceiling leaks rõsked seinad, põrand või vundament
20.6 15.1 16.1 14.2 7.2 damp walls, floor or basement
pehkinud aknaraamid või põrand
30.1 26.4 22.6 18.8 8.5 rotten window frames or floor
liiga hämar, ei ole piisavalt valgust
12.2 8.6 9.2 9.5 4.9 too dark, not enough light
kuritegevus, vägivald või vandalism eluaseme läheduses
28.1 24.3 28.0 28.8 30.5 problems with crime, violence or vandalism in the vicinity of the dwelling
Müraallikad (kas tavaliselt kostub?)
Sources of noise (do you usually hear?)
müra kõrvalkorteritest, trepikojast, veetorustikust
34.0 29.5 31.7 33.7 29.6 noise from neighbouring apartments, water pipes
tänava- või maanteemüra 35.1 37.3 33.2 34.4 28.4 street or road noise lennuki- või raudteemüra 14.2 12.2 12.0 12.8 13.4 noise created by planes or
railway Saaste (kas eluaseme läheduses on?)
Pollution (is there in the vicinity of the dwelling?)
maanteetolmu, sõidukite heitgaase
34.5 35.0 36.3 34.7 30.4 road dust, exhaust gases of vehicles
suitsu, tolmu või eba-meeldivat lõhna tehastest
12.2 8.0 11.8 10.5 6.3 smoke, dust or unpleasant smell from factories
ebameeldivat jäätmete või kanalisatsiooni lõhna
10.6 7.1 9.7 8.1 5.4 unpleasant smell of wastes orsewerage

SISSETULEK JA ELAMISTINGIMUSED TABELID
Income and Living Conditions Tables
STATISTIKAAMET
Statistical Office of Estonia 79
Tabel 35. Leibkonna eluruumi kogukulu aastas, 2004 Table 35. Total yearly housing cost, 2004 (protsenti — percentage)
Alla 4000
4000 – 11 999
12 000 – 20 000
Üle 20 000
Kokku
Below 4,000
4,000 –11,999
12,000 –20,000
Over 20,000
Total
Leibkonnapea vanus Age of head
of the household 16–24 (13.8) 44.0 32.7 (9.5) 100.0 16–24 25–34 10.7 36.8 34.1 18.4 100.0 25–34 35–44 10.6 34.2 38.4 16.7 100.0 35–44 45–54 10.5 36.5 37.3 15.7 100.0 45–54 55–64 15.7 38.1 35.2 11.0 100.0 55–64 65 ja vanemad 17.3 55.6 23.4 (3.7) 100.0 65 and older
Leibkonnapea sugu Gender of head of the household
mees 13.6 40.5 31.2 14.8 100.0 male naine 12.8 42.3 34.7 10.2 100.0 female
Leibkonnatüüp rahvuse alusel
Ethnic nationality of the household
eesti 16.9 42.1 29.6 11.4 100.0 Estonian sega (5.4) 30.3 44.7 19.7 100.0 mixed mitte-eesti 6.5 44.1 37.3 12.2 100.0 non-Estonian
Leibkonnapea haridustase Level of education of head of the household
esimene või madalam tase
25.3 51.4 18.6 4.8 100.0 below upper secondary education
teine tase 11.7 42.7 34.7 11.0 100.0 upper secondary education
kolmas tase 7.0 32.0 40.4 20.5 100.0 tertiary education Leibkonnapea hõiveseisund Labour status of head
of the household töötav 8.1 35.7 38.8 17.3 100.0 working vanaduspensionär 20.8 55.2 20.9 (3.0) 100.0 retired muu 27.5 40.4 27.1 (5.0) 100.0 other
Leibkonna tulukvintiil Household income quintile madalaim kvintiil 23.9 44.7 25.8 5.7 100.0 the lowest quintile teine kvintiil 18.2 51.2 25.2 5.4 100.0 the second quintile kolmas kvintiil 10.2 47.7 33.0 9.1 100.0 the third quintile neljas kvintiil 7.2 38.9 39.2 14.7 100.0 the fourth quintile kõrgeim kvintiil 6.5 24.7 41.7 27.1 100.0 the highest quintile
Omandisuhe eluruumi Tenure status of household omanik või tasuta kasutaja 11.8 41.4 34.3 12.6 100.0 owner or rent free üürnik 30.1 41.8 17.7 … 100.0 tenant
Elukoht Place of residence linn 6.7 39.6 38.6 15.2 100.0 urban maa 29.2 46.0 19.2 5.5 100.0 rural
KOKKU 13.2 41.4 33.0 12.4 100.0 TOTAL
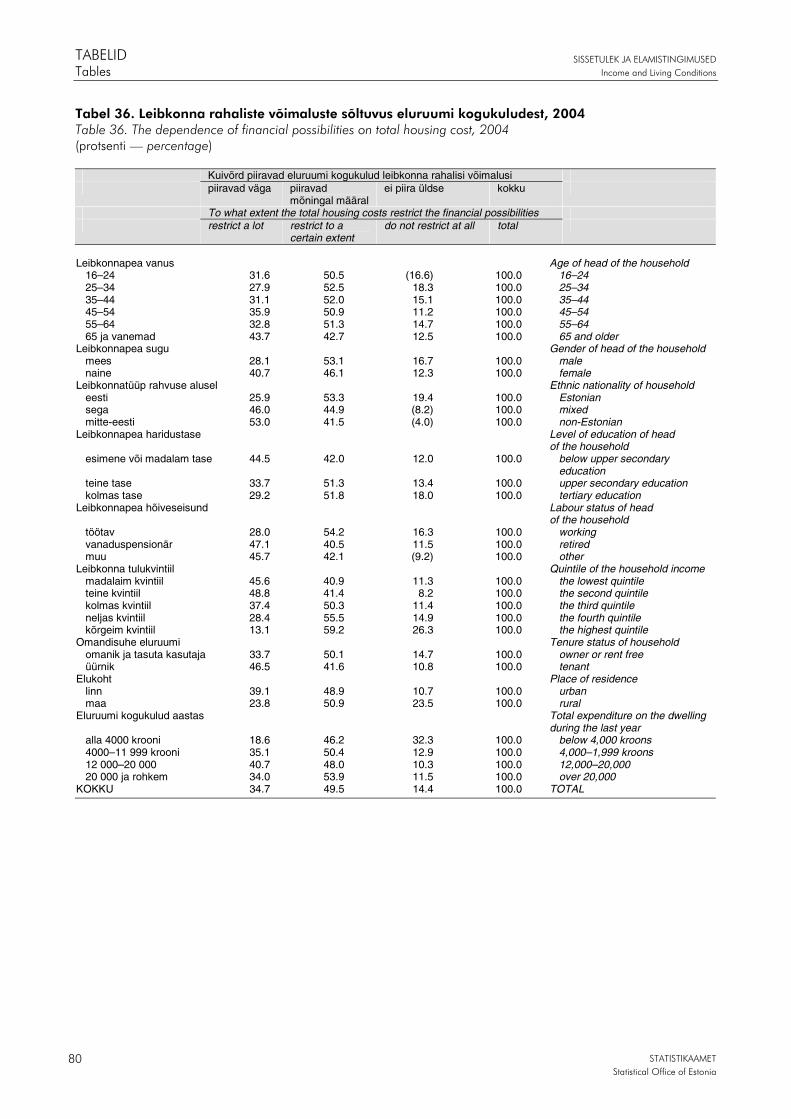
TABELID SISSETULEK JA ELAMISTINGIMUSED
Tables Income and Living Conditions
STATISTIKAAMET
Statistical Office of Estonia 80
Tabel 36. Leibkonna rahaliste võimaluste sõltuvus eluruumi kogukuludest, 2004 Table 36. The dependence of financial possibilities on total housing cost, 2004 (protsenti — percentage)
Kuivõrd piiravad eluruumi kogukulud leibkonna rahalisi võimalusi piiravad väga piiravad
mõningal määral ei piira üldse kokku
To what extent the total housing costs restrict the financial possibilities restrict a lot restrict to a
certain extent do not restrict at all total
Leibkonnapea vanus Age of head of the household
16–24 31.6 50.5 (16.6) 100.0 16–24 25–34 27.9 52.5 18.3 100.0 25–34 35–44 31.1 52.0 15.1 100.0 35–44 45–54 35.9 50.9 11.2 100.0 45–54 55–64 32.8 51.3 14.7 100.0 55–64 65 ja vanemad 43.7 42.7 12.5 100.0 65 and older
Leibkonnapea sugu Gender of head of the household mees 28.1 53.1 16.7 100.0 male naine 40.7 46.1 12.3 100.0 female
Leibkonnatüüp rahvuse alusel Ethnic nationality of household eesti 25.9 53.3 19.4 100.0 Estonian sega 46.0 44.9 (8.2) 100.0 mixed mitte-eesti 53.0 41.5 (4.0) 100.0 non-Estonian
Leibkonnapea haridustase Level of education of head of the household
esimene või madalam tase 44.5 42.0 12.0 100.0 below upper secondary education
teine tase 33.7 51.3 13.4 100.0 upper secondary education kolmas tase 29.2 51.8 18.0 100.0 tertiary education
Leibkonnapea hõiveseisund Labour status of head of the household
töötav 28.0 54.2 16.3 100.0 working vanaduspensionär 47.1 40.5 11.5 100.0 retired muu 45.7 42.1 (9.2) 100.0 other
Leibkonna tulukvintiil Quintile of the household income madalaim kvintiil 45.6 40.9 11.3 100.0 the lowest quintile teine kvintiil 48.8 41.4 8.2 100.0 the second quintile kolmas kvintiil 37.4 50.3 11.4 100.0 the third quintile neljas kvintiil 28.4 55.5 14.9 100.0 the fourth quintile kõrgeim kvintiil 13.1 59.2 26.3 100.0 the highest quintile
Omandisuhe eluruumi Tenure status of household omanik ja tasuta kasutaja 33.7 50.1 14.7 100.0 owner or rent free üürnik 46.5 41.6 10.8 100.0 tenant
Elukoht Place of residence linn 39.1 48.9 10.7 100.0 urban maa 23.8 50.9 23.5 100.0 rural
Eluruumi kogukulud aastas Total expenditure on the dwelling during the last year
alla 4000 krooni 18.6 46.2 32.3 100.0 below 4,000 kroons 4000–11 999 krooni 35.1 50.4 12.9 100.0 4,000–1,999 kroons 12 000–20 000 40.7 48.0 10.3 100.0 12,000–20,000 20 000 ja rohkem 34.0 53.9 11.5 100.0 over 20,000
KOKKU 34.7 49.5 14.4 100.0 TOTAL
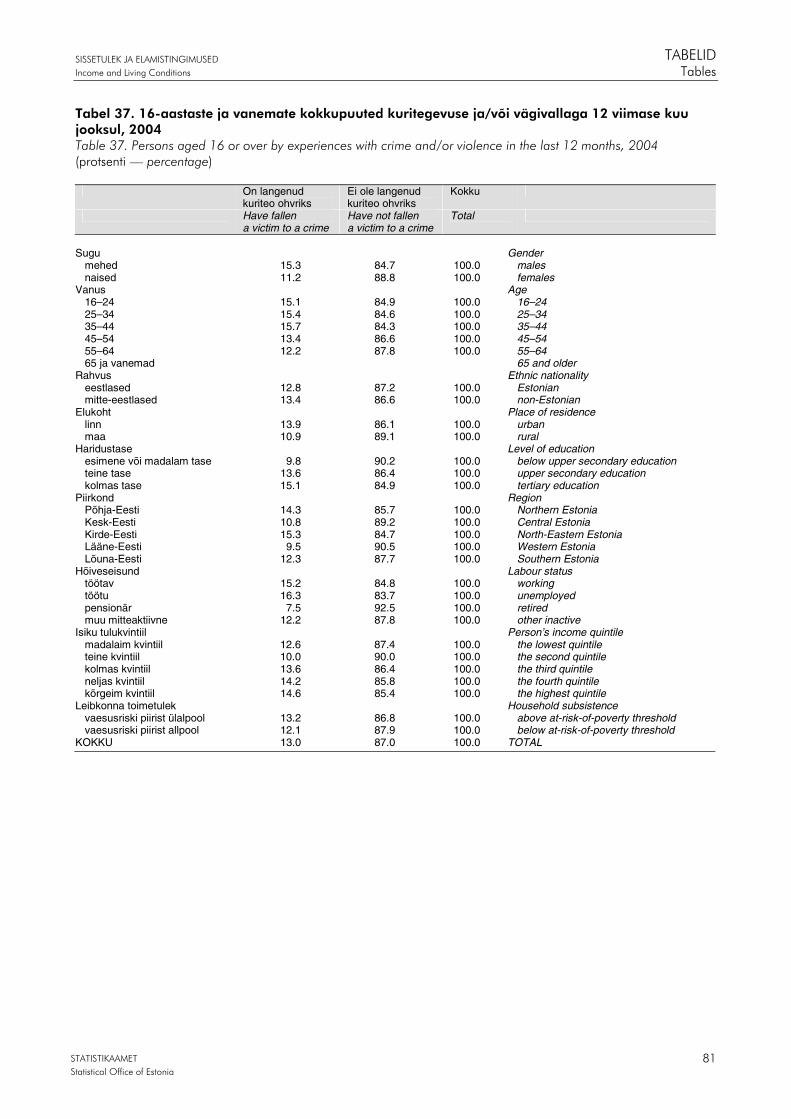
SISSETULEK JA ELAMISTINGIMUSED TABELID
Income and Living Conditions Tables
STATISTIKAAMET
Statistical Office of Estonia 81
Tabel 37. 16-aastaste ja vanemate kokkupuuted kuritegevuse ja/või vägivallaga 12 viimase kuu jooksul, 2004 Table 37. Persons aged 16 or over by experiences with crime and/or violence in the last 12 months, 2004 (protsenti — percentage)
On langenud kuriteo ohvriks
Ei ole langenud kuriteo ohvriks
Kokku
Have fallen a victim to a crime
Have not fallen a victim to a crime
Total
Sugu Gender
mehed 15.3 84.7 100.0 males naised 11.2 88.8 100.0 females
Vanus Age 16–24 15.1 84.9 100.0 16–24 25–34 15.4 84.6 100.0 25–34 35–44 15.7 84.3 100.0 35–44 45–54 13.4 86.6 100.0 45–54 55–64 12.2 87.8 100.0 55–64 65 ja vanemad 65 and older
Rahvus Ethnic nationality eestlased 12.8 87.2 100.0 Estonian mitte-eestlased 13.4 86.6 100.0 non-Estonian
Elukoht Place of residence linn 13.9 86.1 100.0 urban maa 10.9 89.1 100.0 rural
Haridustase Level of education esimene või madalam tase 9.8 90.2 100.0 below upper secondary education teine tase 13.6 86.4 100.0 upper secondary education kolmas tase 15.1 84.9 100.0 tertiary education
Piirkond Region Põhja-Eesti 14.3 85.7 100.0 Northern Estonia Kesk-Eesti 10.8 89.2 100.0 Central Estonia Kirde-Eesti 15.3 84.7 100.0 North-Eastern Estonia Lääne-Eesti 9.5 90.5 100.0 Western Estonia Lõuna-Eesti 12.3 87.7 100.0 Southern Estonia
Hõiveseisund Labour status töötav 15.2 84.8 100.0 working töötu 16.3 83.7 100.0 unemployed pensionär 7.5 92.5 100.0 retired muu mitteaktiivne 12.2 87.8 100.0 other inactive
Isiku tulukvintiil Person’s income quintile madalaim kvintiil 12.6 87.4 100.0 the lowest quintile teine kvintiil 10.0 90.0 100.0 the second quintile kolmas kvintiil 13.6 86.4 100.0 the third quintile neljas kvintiil 14.2 85.8 100.0 the fourth quintile kõrgeim kvintiil 14.6 85.4 100.0 the highest quintile
Leibkonna toimetulek Household subsistence vaesusriski piirist ülalpool 13.2 86.8 100.0 above at-risk-of-poverty threshold vaesusriski piirist allpool 12.1 87.9 100.0 below at-risk-of-poverty threshold
KOKKU 13.0 87.0 100.0 TOTAL
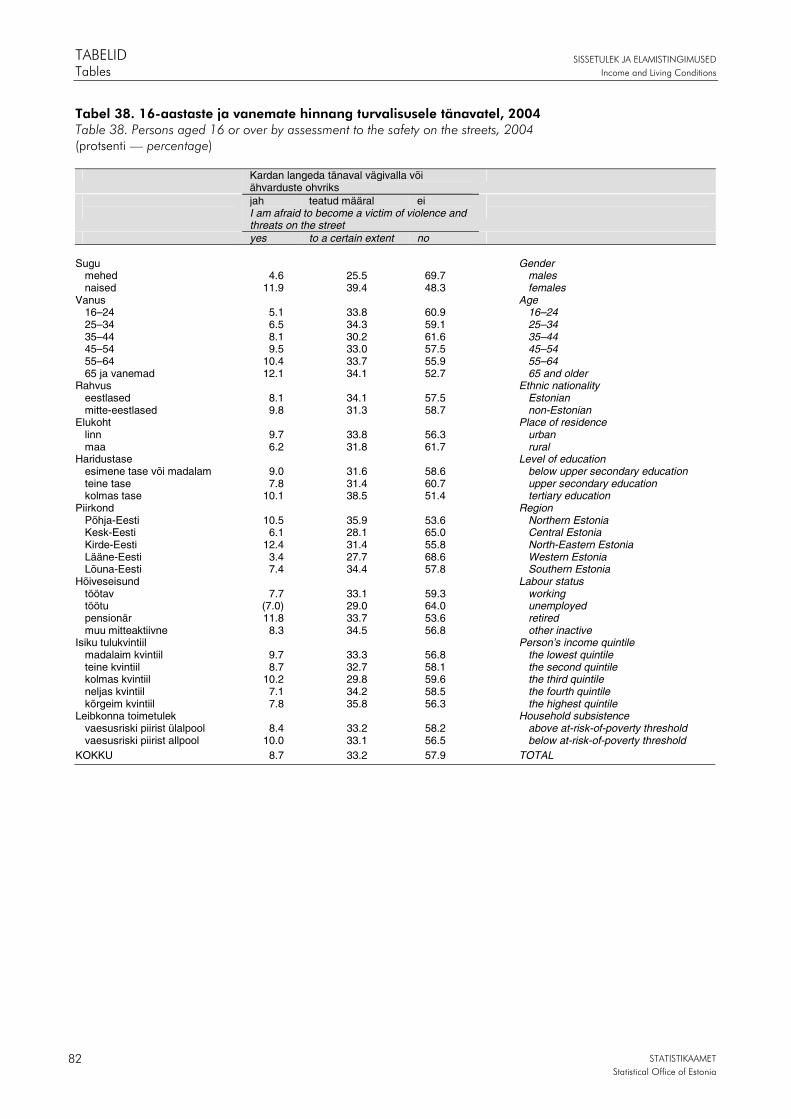
TABELID SISSETULEK JA ELAMISTINGIMUSED
Tables Income and Living Conditions
STATISTIKAAMET
Statistical Office of Estonia 82
Tabel 38. 16-aastaste ja vanemate hinnang turvalisusele tänavatel, 2004 Table 38. Persons aged 16 or over by assessment to the safety on the streets, 2004 (protsenti — percentage)
Kardan langeda tänaval vägivalla või ähvarduste ohvriks
jah teatud määral ei I am afraid to become a victim of violence and
threats on the street
yes to a certain extent no Sugu Gender
mehed 4.6 25.5 69.7 males naised 11.9 39.4 48.3 females
Vanus Age 16–24 5.1 33.8 60.9 16–24 25–34 6.5 34.3 59.1 25–34 35–44 8.1 30.2 61.6 35–44 45–54 9.5 33.0 57.5 45–54 55–64 10.4 33.7 55.9 55–64 65 ja vanemad 12.1 34.1 52.7 65 and older
Rahvus Ethnic nationality eestlased 8.1 34.1 57.5 Estonian mitte-eestlased 9.8 31.3 58.7 non-Estonian
Elukoht Place of residence linn 9.7 33.8 56.3 urban maa 6.2 31.8 61.7 rural
Haridustase Level of education esimene tase või madalam 9.0 31.6 58.6 below upper secondary education teine tase 7.8 31.4 60.7 upper secondary education kolmas tase 10.1 38.5 51.4 tertiary education
Piirkond Region Põhja-Eesti 10.5 35.9 53.6 Northern Estonia Kesk-Eesti 6.1 28.1 65.0 Central Estonia Kirde-Eesti 12.4 31.4 55.8 North-Eastern Estonia Lääne-Eesti 3.4 27.7 68.6 Western Estonia Lõuna-Eesti 7.4 34.4 57.8 Southern Estonia
Hõiveseisund Labour status töötav 7.7 33.1 59.3 working töötu (7.0) 29.0 64.0 unemployed pensionär 11.8 33.7 53.6 retired muu mitteaktiivne 8.3 34.5 56.8 other inactive
Isiku tulukvintiil Person’s income quintile madalaim kvintiil 9.7 33.3 56.8 the lowest quintile teine kvintiil 8.7 32.7 58.1 the second quintile kolmas kvintiil 10.2 29.8 59.6 the third quintile neljas kvintiil 7.1 34.2 58.5 the fourth quintile kõrgeim kvintiil 7.8 35.8 56.3 the highest quintile
Leibkonna toimetulek Household subsistence vaesusriski piirist ülalpool 8.4 33.2 58.2 above at-risk-of-poverty threshold vaesusriski piirist allpool 10.0 33.1 56.5 below at-risk-of-poverty threshold
KOKKU 8.7 33.2 57.9 TOTAL

SISSETULEK JA ELAMISTINGIMUSED TABELID
Income and Living Conditions Tables
STATISTIKAAMET
Statistical Office of Estonia 83
Tabel 39. 16-aastaste ja vanemate hinnang turvalisusele avalikes kohtades ja kodus, 2004 Table 39. Persons aged 16 or over by assessment to the safety in public places and at home, 2004 (protsenti — percentage)
Kardan langeda avalikes kohtades vägivalla või ähvarduste ohvriks
Kardan langeda kodus vägivalla või ähvarduste ohvriks
jah teatud määral ei jah või teatud määral
ei
I am afraid of falling a victim to violence or threats in public places
I am afraid of falling a victim to violence or threats at home
yes to a certain extent no yes or to a certain extent
no
Sugu Gender
mehed 3.5 22.1 74.2 8.2 91.8 males naised 8.6 34.3 56.7 16.7 83.3 females
Vanus Age 16–24 3.7 28.2 67.9 6.1 93.9 16–24 25–34 4.4 29.1 66.5 10.2 89.8 25–34 35–44 5.2 25.7 68.9 12.3 87.7 35–44 45–54 7.3 28.6 64.0 13.8 86.2 45–54 55–64 7.1 30.6 62.2 13.6 86.4 55–64 65 ja vanemad 9.8 30.8 58.3 20.1 79.9 65 and older
Rahvus Ethnic nationality eestlased 6.0 29.9 63.8 13.5 86.5 Estonian mitte-eestlased 6.9 26.8 66.1 11.5 88.5 non-Estonian
Elukoht Place of residence linn 6.9 29.1 63.6 12.5 87.5 urban maa 4.8 28.2 66.7 13.8 86.2 rural
Haridustase Level of education esimene või madalam tase 7.5 26.2 65.5 14.5 85.5 below upper secondary education teine tase 5.5 27.1 67.1 11.2 88.8 upper secondary education kolmas tase 6.8 35.1 58.2 14.7 85.3 tertiary education
Piirkond Region Põhja-Eesti 7.0 32.2 60.7 12.4 87.6 Northern Estonia Kesk-Eesti 4.9 24.9 69.4 11.4 88.6 Central Estonia Kirde-Eesti 9.0 23.4 67.1 15.7 84.3 North-Eastern Estonia Lääne-Eesti 2.4 20.9 76.2 6.7 93.3 Western Estonia Lõuna-Eesti 6.1 31.7 61.7 15.6 84.4 Southern Estonia
Hõiveseisund Labour status töötav 5.2 28.8 65.9 10.7 89.3 working töötu 4.6 23.6 71.7 14.0 86.0 unemployed pensionär 9.4 30.3 59.3 19.2 80.8 retired muu mitteaktiivne 6.3 29.0 64.3 10.5 89.5 other inactive
Isiku tulukvintiil Person’s income quintile madalaim kvintiil 7.0 27.7 65.1 15.7 84.3 the lowest quintile teine kvintiil 7.0 27.6 64.8 15.6 84.4 the second quintile kolmas kvintiil 7.8 27.2 64.6 13.3 86.7 the third quintile neljas kvintiil 4.9 29.4 65.4 10.2 89.8 the fourth quintile kõrgeim kvintiil 5.0 32.1 62.9 10.1 89.9 the highest quintile
Leibkonna toimetulek Household subsistence vaesusriski piirist ülalpool 6.0 29.3 64.4 12.1 87.9 above at-risk-of-poverty threshold vaesusriski piirist allpool 7.5 27.0 65.1 16.2 83.8 below at-risk-of-poverty threshold
KOKKU 6.3 28.8 64.5 12.9 87.1 TOTAL

TABELID SISSETULEK JA ELAMISTINGIMUSED
Tables Income and Living Conditions
STATISTIKAAMET
Statistical Office of Estonia 84
Tabel 40. 16-aastaste ja vanemate turvameetmete kasutamine, 2004 Table 40. Persons aged 16 or over by usage of the security measures, 2004 (protsenti — percentage)
Olen ettevaatlik Mul on kaitsevahendeid või koer jah ei jah ei I am careful I have an appliance or a dog for
the protection
yes no yes no Sugu Gender
mehed 54.2 45.8 16.0 84.0 males naised 83.6 16.4 17.5 82.5 females
Vanus Age 16–24 68.9 31.1 14.8 85.2 16–24 25–34 68.5 31.5 14.8 85.2 25–34 35–44 65.8 34.2 17.8 82.2 35–44 45–54 69.1 30.9 19.6 80.4 45–54 55–64 71.8 28.2 20.3 79.7 55–64 65 ja vanemad 77.6 22.4 14.6 85.4 65 and older
Rahvus Ethnic nationality eestlased 68.1 31.9 18.9 81.1 Estonian mitte-eestlased 75.2 24.8 12.6 87.4 non-Estonian
Elukoht Place of residence linn 75.0 25.0 14.0 86.0 urban maa 59.8 40.2 23.5 76.5 rural
Piirkond Region Põhja-Eesti 78.3 21.7 19.6 80.4 Northern Estonia Kesk-Eesti 63.0 37.0 14.4 85.6 Central Estonia Kirde-Eesti 77.1 22.9 11.5 88.5 North-Eastern Estonia Lääne-Eesti 46.4 53.6 16.5 83.5 Western Estonia Lõuna-Eesti 69.0 31.0 16.5 83.5 Southern Estonia
Hõiveseisund Labour status töötav 68.7 31.3 18.0 82.0 working töötu 58.3 41.7 14.6 85.4 unemployed pensionär 77.2 22.8 15.4 84.6 retired muu mitteaktiivne 71.7 28.3 15.7 84.3 other inactive
Isiku tulukvintiil Person’s income quintile madalaim kvintiil 68.0 32.0 15.4 84.6 the lowest quintile teine kvintiil 73.8 26.2 15.1 84.9 the second quintile kolmas kvintiil 70.1 29.9 15.2 84.8 the third quintile neljas kvintiil 67.8 32.2 19.1 80.9 the fourth quintile kõrgeim kvintiil 72.0 28.0 18.9 81.1 the highest quintile
Leibkonna toimetulek Household subsistence vaesusriski piirist ülalpool 70.8 29.2 17.2 82.8 above at-risk-of-poverty threshold vaesusriski piirist allpool 68.9 31.1 15.4 84.6 below at-risk-of-poverty threshold
KOKKU 70.4 29.6 16.8 83.2 TOTAL
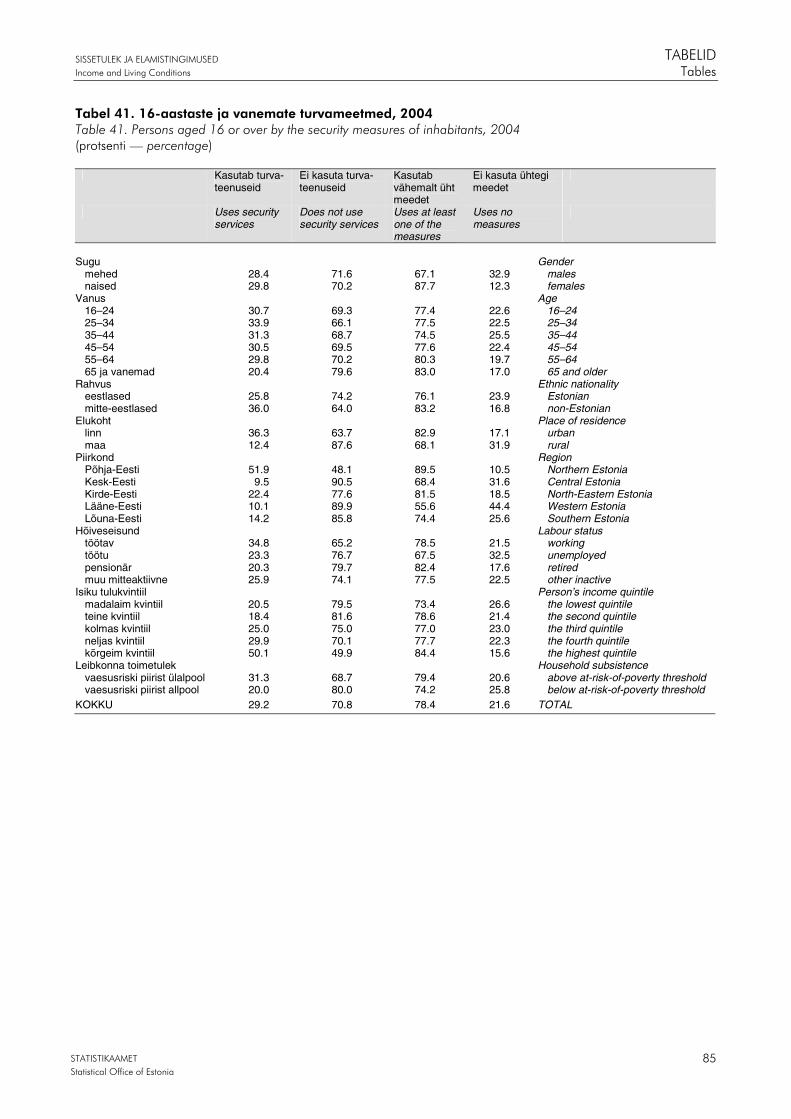
SISSETULEK JA ELAMISTINGIMUSED TABELID
Income and Living Conditions Tables
STATISTIKAAMET
Statistical Office of Estonia 85
Tabel 41. 16-aastaste ja vanemate turvameetmed, 2004 Table 41. Persons aged 16 or over by the security measures of inhabitants, 2004 (protsenti — percentage)
Kasutab turva-teenuseid
Ei kasuta turva-teenuseid
Kasutab vähemalt üht meedet
Ei kasuta ühtegi meedet
Uses security services
Does not use security services
Uses at least one of the measures
Uses no measures
Sugu Gender
mehed 28.4 71.6 67.1 32.9 males naised 29.8 70.2 87.7 12.3 females
Vanus Age 16–24 30.7 69.3 77.4 22.6 16–24 25–34 33.9 66.1 77.5 22.5 25–34 35–44 31.3 68.7 74.5 25.5 35–44 45–54 30.5 69.5 77.6 22.4 45–54 55–64 29.8 70.2 80.3 19.7 55–64 65 ja vanemad 20.4 79.6 83.0 17.0 65 and older
Rahvus Ethnic nationality eestlased 25.8 74.2 76.1 23.9 Estonian mitte-eestlased 36.0 64.0 83.2 16.8 non-Estonian
Elukoht Place of residence linn 36.3 63.7 82.9 17.1 urban maa 12.4 87.6 68.1 31.9 rural
Piirkond Region Põhja-Eesti 51.9 48.1 89.5 10.5 Northern Estonia Kesk-Eesti 9.5 90.5 68.4 31.6 Central Estonia Kirde-Eesti 22.4 77.6 81.5 18.5 North-Eastern Estonia Lääne-Eesti 10.1 89.9 55.6 44.4 Western Estonia Lõuna-Eesti 14.2 85.8 74.4 25.6 Southern Estonia
Hõiveseisund Labour status töötav 34.8 65.2 78.5 21.5 working töötu 23.3 76.7 67.5 32.5 unemployed pensionär 20.3 79.7 82.4 17.6 retired muu mitteaktiivne 25.9 74.1 77.5 22.5 other inactive
Isiku tulukvintiil Person’s income quintile madalaim kvintiil 20.5 79.5 73.4 26.6 the lowest quintile teine kvintiil 18.4 81.6 78.6 21.4 the second quintile kolmas kvintiil 25.0 75.0 77.0 23.0 the third quintile neljas kvintiil 29.9 70.1 77.7 22.3 the fourth quintile kõrgeim kvintiil 50.1 49.9 84.4 15.6 the highest quintile
Leibkonna toimetulek Household subsistence vaesusriski piirist ülalpool 31.3 68.7 79.4 20.6 above at-risk-of-poverty threshold vaesusriski piirist allpool 20.0 80.0 74.2 25.8 below at-risk-of-poverty threshold
KOKKU 29.2 70.8 78.4 21.6 TOTAL

METOODIKA SISSETULEK JA ELAMISTINGIMUSED
Methodology Income and Living Conditions
86 STATISTIKAAMET
Statistical Office of Estonia
METOODIKA
Uuringu eesmärk
EU-SILC (European Union Statistics on Income and Living Conditions) on isiku-uuring, mille eesmärk on usaldusväärselt hinnata leibkondade ja isikute sissetulekute jaotust, elamistingimusi ning sotsiaalset tõrjutust. Uuringu tulemusi kasutatakse ühiskonna sotsiaalse ja majandusliku arengu ning muutuste kajastamiseks ning seeläbi ka sotsiaalpoliitiliste meetmete kavandamiseks ning nende mõju jälgimiseks.
Uuringusse on kaasatud kõik Euroopa Liidu liikmesriigid ning mõned liitu mittekuuluvad riigid. Uuringu aluseks on riiklikul tasemel esinduslikud valimid, mis võimaldavad usaldus-väärset analüüs nii riigi kui ka Euroopa Liidu tasemel.
Kuigi uuring põhineb ühistel alustel (Euroopa Komisjoni määrused uuringute võrreldavuse tagamiseks), on liikmesriikidel võimalik valida oma uuringule sobiv disain ja korraldus. Uuringu eesmärkidest lähtuvalt on analüüsi jaoks vaja andmeid nii hetkeseisu (ristläbilõikelise analüüsi) kui ka aastate jooksul toimuvate muutuste kajastamiseks. Seetõttu küsitletakse valimisse kaasatud leibkondi ning nende liikmeid kokku nelja järjestikuse aasta jooksul.
Statistikaamet korraldab sotsiaaluuringut alates 2004. aastast, aastatel 2002–2003 toimusid pilootuuringud. Käesolev kogumik on kokkuvõte 2004. aastal uuringuga kogutud andmetest.
Kõik kogumikus esitatud hinnangud on arvutatud vastava piirkonna koguelanikkonna jaoks. Vastavad mahud isikute üldkogumi ja osakogumite jaoks on leitud Statistikaametis arvutatud arvestusliku rahvaarvu baasil.
Ümardamise tõttu ei võrdu tabelites veergude summad alati summaarse näitarvuga, erinevus võib olla kuni paar viimase koha ühikut.
Üldkogum ja valim
Uuritava üldkogumi moodustasid kõik Eestis alaliselt elavad leibkonnad. Üldkogumisse ei kuulu institutsioonilistes asutustes (lastekodud, hooldekodud, kloostrid jms) viibijad.
Valimimahu arvutamisel olid aluseks Euroopa Komisjoni määrused, mille eesmärk oli tagada teatav hinnangute täpsuse nivoo. Sellest johtuvalt on igale riigile ette antud minimaalne efektiivne valimimaht nii hetkeseisu kui ka muutuste hindamiseks. Nende määramisel on arvesse võetud hinnatavat mittevastamise määra, uuringu disaini ja teisi hinnangu kvaliteeti puudutavaid tegureid.
Eurostati analüüside jaoks määratud minimaalne efektiivne valimimaht Eesti jaoks oli
- 3500 leibkonda ja 7750 vähemalt 16-aastast isikut ristläbilõikelise analüüsi jaoks; - 2750 leibkonda ja 5750 vähemalt 16-aastast isikut ajas toimuvate muutuste
jälgimiseks.
Tegelik kasutatav valimimaht peab ettenähtud määrast olema suurem, et arvestada mitmesuguste hinnangu täpsust vähendavate tegurite mõju.
Valimi mahuks valiti eelnenud analüüsi põhjal 6000 leibkonda.
Uuringu disain
Aadressisikute valimi võtmisel oli aluseks kihitatud süstemaatiline valikuskeem, s.t sõltumatud osavalimid leiti eraldi üldkogumi mittekattuvatest osadest ehk kihtidest süstemaatilise valiku teel. Leibkondade tasemel on tegemist kihitatud ebavõrdse tõenäosusega valikuga, mille puhul suuremad leibkonnad on suurema esindatuse tõttu freimis ja valimis esindatud suurema arvuga kui väikesed.

SISSETULEK JA ELAMISTINGIMUSED METOODIKA
Income and Living Conditions Methodology
STATISTIKAAMET 87 Statistical Office of Estonia
Sotsiaaluuringu disain sarnaneb põhimõtteliselt leibkonna eelarve uuringu disainiga. Valimi moodustamisel kasutati isikuloendina AS Andmevara rahvastiku andmebaasi ning rahvaloenduse andmebaasi kuuluvaid vähemalt 14-aastasi isikuid. Kasutatavat loendit tähistatakse PR14+.
Eelkihitamist on vaja selleks, et rakendada kihtides erinevaid kaasamistõenäosusi ning tagada nii maakondade kaupa piisavalt täpsed hinnangud. Kihitamiseks jaotati maakonnad suuruse järgi kolme rühma (kihti): suured maakonnad, väikesed maakonnad ja Hiiu maakond (väikseim maakond). Kihtidest valiti isikuid valimisse erineva valikusuhtega (väiksemate maakondade puhul oli valikusuhe suurem).
Isikut, kes valiti loendist ning kes määrab ühtlasi valimisse kaasatava leibkonna, nimetatakse aadressisikuks. Valiku tulemusena saadakse isikuvalim, mis on aluseks küsitletavate leibkondade valimile. Uuringusse kaasati aadressisik ja tema leibkond juhul, kui nad elasid püsivalt Eestis ning aadressisik ei olnud surnud ega siirdunud pikemaks ajaks (enam kui kuueks kuuks) elama institutsioonilisse asutusse või välismaale (olenemata põhjusest).
Eelkihitamine maakonniti, 2004
Kiht h Maakonnad Rh nh nh/Rh %
Suur Tallinn, Harju, Ida-Viru, Lääne-Viru, Pärnu, Tartu
862 786 3 600 0,42
Väike Jõgeva, Järva, Lääne, Põlva, Rapla, Saare, Valga, Viljandi, Võru
285 106 22 200 0,77
Hiiu Hiiumaa 8 550 200 2,34
Rh tähistab vastavas kihis h elavate vähemalt 14-aastaste isikute arvu seisuga 01.01.2004, nh kihi h valimimahtu ning nh /Rh (%) valikusuhet protsentides vastavas kihis. Et rahvastiku-register on järjestatud maakondade järgi, jaotub valim kihi sees maakondadesse proport-sionaalselt maakonna elanike arvuga (tabel B).
Prognoositav valimimaht maakonniti, 2004
Piirkond Vähemalt14-aastaste elanike arv 2004. a alguse seisuga
Valimimaht
1. Suurte kihtTallinn 347 115 1 448
Harju 105 413 440
Ida-Viru 152 593 637
Lääne-Viru 55 906 233
Pärnu 75 977 317
Tartu 125 782 525
Kokku 862 786 3 600
2. Väikeste kiht
Jõgeva 31 426 242
Järva 32 194 248
Lääne 23 689 183
Põlva 26 908 208
Rapla 30 955 239
Saare 29 861 230
Valga 29 370 227
Viljandi 47 904 370
Võru 32 799 253
Kokku 285 106 2 200
3. Hiiu 8 550 200
Kõik kokku 1 156 442 6 000
Uuringumetoodika ei näinud ette asendusleibkondade kasutamist.
Tabel A
Tabel B

METOODIKA SISSETULEK JA ELAMISTINGIMUSED
Methodology Income and Living Conditions
88 STATISTIKAAMET
Statistical Office of Estonia
Iga leibkonda küsitletakse kokku neli korda, rotatsiooniperioodiks on 12 kuud. Niisiis on aasta jooksul küsitlus ristläbilõikeline — ühe aasta valimi lõikes ei ole korduvaid leibkondi. See tagab aastahinnangute suurema täpsuse sama valimimahu puhul. Leibkondade korduv küsitlemine järjestikustel aastatel võimaldab aga täpsemalt hinnata aasta jooksul üldkeskmiste tasemel toimunud muutusi.
Küsitluse korraldamine
Leibkonna sissetuleku ja elamistingimuste uurimiseks kasutas Statistikaamet oma küsitlejaid. Uuringuga oli pidevalt seotud 57 küsitlejat, kes olid saanud erikoolituse.
Küsitleja on isik, kes
- võtab leibkonnaga ühendust, - motiveerib leibkonda uuringus osalema, - teeb leibkonnaga silmast-silma-intervjuu leibkonna üldandmete ja koosseisu
kohta, - teeb kõigi vähemalt 16-aastaste leibkonnaliikmetega silmast-silma-intervjuu.
Küsitleja täidab ka vormikohase tööaruande, kuhu märgib kõik külastused leibkondadesse, mittevastamise põhjused ja muu olulise teabe.
Küsitlustulemus
Vastavalt valimiskeemile valiti 2004. aasta leibkondade valimi määramiseks 6000 aadress-isikut.
Üldistused, mis tehakse saadud vastuste põhjal üldkogumi kohta, sisaldavad teatud süstemaatilist viga ehk nihet. Mida suurem on mittevastamine, seda ebatäpsemad on leitud hinnangud. Hinnangute leidmisel pole ju teada, kuidas oleksid vastanud need, kes vastamata jätsid. Selletõttu ongi uuringu korraldamisel olulisemaid eesmärke saavutada võimalikult kõrge vastamistase.
Mittevastamine jagunes sisult kaheks: loendiviga ja kadu. Loendiviga tulenes AS Andmevara rahvastiku andmebaasi ebatäpsusest. Tegemist oli loendiveaga, kui loendist valitud aadressisik…
- oli surnud; - oli Eestist alaliselt lahkunud vähemalt pooleks aastaks; - oli elanud pikemat aega institutsioonilises asutuses; - ükski tema leibkonnaliige polnud 16-aastane või vanem; - kuulus leibkonda, kes juba oli uuringu valimis.
2004. aastal oli loendiveaga 200 leibkonda, mis teeb loendivea osatähtsuseks valimis 3,3%. Järgnev tabel näitab loendivea jaotust põhjuse järgi. Loendivea põhjused, 2004
Loendiviga Leibkondade arv Osatähtsus loendiveas, %
Aadressisik surnud 67 33.5 Aadressisik Eestist lahkunud 72 36.0 Aadressisik viibib Institutsioonilises asutuses
57 28.5
Muu loendiviga 4 2.0 Loendiviga kokku 200 100.0
Loendivead ja vastavad leibkonnad jäeti uuringust välja. Loendivead on niisuguse loendi puhul paratamatud ja nende vähendamine ei ole loendit muutmata võimalik.
Küsitluse korraldust ja vastajate hoiakuid iseloomustab kadu. Kaoks nimetatakse valimi osa, mille puhul ei leitud aadressisikut ning tema tegelikku aadressi polnud võimalik kohalike allikate (naabrid, kohalik omavalitsus, telefoniraamat jne) abil selgeks teha. Samuti on kadu valimi osa, mille aadress on välja selgitatud, kuid mis mingil muul põhjusel jääb uuringust kõrvale — osa objekte ei saada kätte, teine osa keeldub vastamast, on haige või võimetu vastama jms). Kao vähendamine nõuab küsitlejatelt ja küsitluse korraldajatelt lisajõupingutusi.
Tabel C
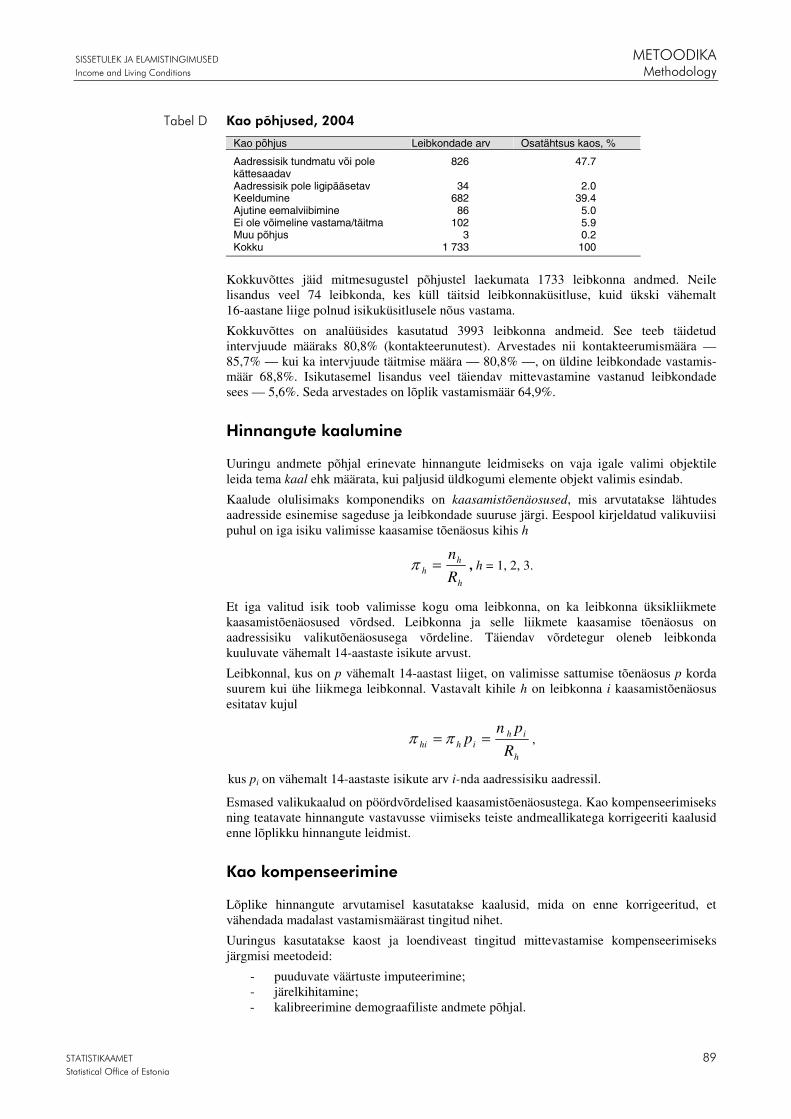
SISSETULEK JA ELAMISTINGIMUSED METOODIKA
Income and Living Conditions Methodology
STATISTIKAAMET 89 Statistical Office of Estonia
Kao põhjused, 2004
Kao põhjus Leibkondade arv Osatähtsus kaos, %
Aadressisik tundmatu või pole kättesaadav
826 47.7
Aadressisik pole ligipääsetav 34 2.0 Keeldumine 682 39.4 Ajutine eemalviibimine 86 5.0 Ei ole võimeline vastama/täitma 102 5.9 Muu põhjus 3 0.2 Kokku 1 733 100
Kokkuvõttes jäid mitmesugustel põhjustel laekumata 1733 leibkonna andmed. Neile lisandus veel 74 leibkonda, kes küll täitsid leibkonnaküsitluse, kuid ükski vähemalt 16-aastane liige polnud isikuküsitlusele nõus vastama.
Kokkuvõttes on analüüsides kasutatud 3993 leibkonna andmeid. See teeb täidetud intervjuude määraks 80,8% (kontakteerunutest). Arvestades nii kontakteerumismäära — 85,7% — kui ka intervjuude täitmise määra — 80,8% —, on üldine leibkondade vastamis-määr 68,8%. Isikutasemel lisandus veel täiendav mittevastamine vastanud leibkondade sees — 5,6%. Seda arvestades on lõplik vastamismäär 64,9%.
Hinnangute kaalumine
Uuringu andmete põhjal erinevate hinnangute leidmiseks on vaja igale valimi objektile leida tema kaal ehk määrata, kui paljusid üldkogumi elemente objekt valimis esindab.
Kaalude olulisimaks komponendiks on kaasamistõenäosused, mis arvutatakse lähtudes aadresside esinemise sageduse ja leibkondade suuruse järgi. Eespool kirjeldatud valikuviisi puhul on iga isiku valimisse kaasamise tõenäosus kihis h
h
hh R
n=π , h = 1, 2, 3.
Et iga valitud isik toob valimisse kogu oma leibkonna, on ka leibkonna üksikliikmete kaasamistõenäosused võrdsed. Leibkonna ja selle liikmete kaasamise tõenäosus on aadressisiku valikutõenäosusega võrdeline. Täiendav võrdetegur oleneb leibkonda kuuluvate vähemalt 14-aastaste isikute arvust.
Leibkonnal, kus on p vähemalt 14-aastast liiget, on valimisse sattumise tõenäosus p korda suurem kui ühe liikmega leibkonnal. Vastavalt kihile h on leibkonna i kaasamistõenäosus esitatav kujul
h
ihihhi R
pnp == ππ ,
kus pi on vähemalt 14-aastaste isikute arv i-nda aadressisiku aadressil.
Esmased valikukaalud on pöördvõrdelised kaasamistõenäosustega. Kao kompenseerimiseks ning teatavate hinnangute vastavusse viimiseks teiste andmeallikatega korrigeeriti kaalusid enne lõplikku hinnangute leidmist.
Kao kompenseerimine
Lõplike hinnangute arvutamisel kasutatakse kaalusid, mida on enne korrigeeritud, et vähendada madalast vastamismäärast tingitud nihet.
Uuringus kasutatakse kaost ja loendiveast tingitud mittevastamise kompenseerimiseks järgmisi meetodeid:
- puuduvate väärtuste imputeerimine; - järelkihitamine; - kalibreerimine demograafiliste andmete põhjal.
Tabel D
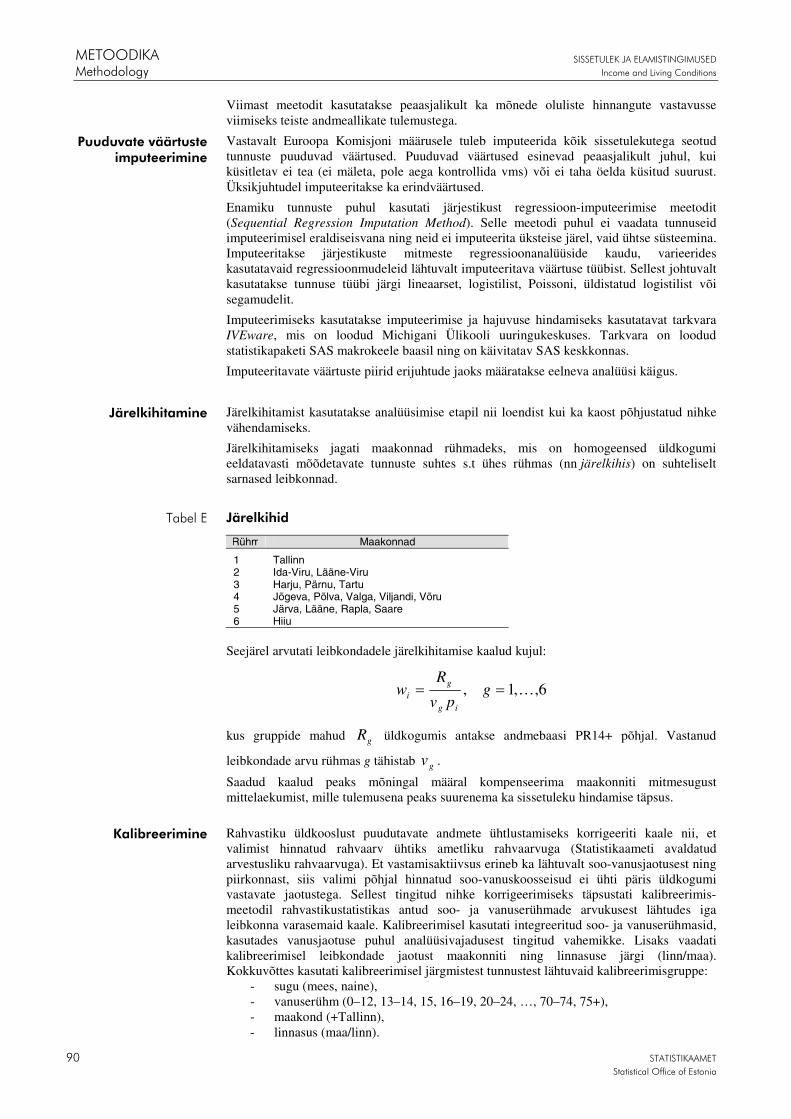
METOODIKA SISSETULEK JA ELAMISTINGIMUSED
Methodology Income and Living Conditions
90 STATISTIKAAMET
Statistical Office of Estonia
Viimast meetodit kasutatakse peaasjalikult ka mõnede oluliste hinnangute vastavusse viimiseks teiste andmeallikate tulemustega.
Vastavalt Euroopa Komisjoni määrusele tuleb imputeerida kõik sissetulekutega seotud tunnuste puuduvad väärtused. Puuduvad väärtused esinevad peaasjalikult juhul, kui küsitletav ei tea (ei mäleta, pole aega kontrollida vms) või ei taha öelda küsitud suurust. Üksikjuhtudel imputeeritakse ka erindväärtused.
Enamiku tunnuste puhul kasutati järjestikust regressioon-imputeerimise meetodit (Sequential Regression Imputation Method). Selle meetodi puhul ei vaadata tunnuseid imputeerimisel eraldiseisvana ning neid ei imputeerita üksteise järel, vaid ühtse süsteemina. Imputeeritakse järjestikuste mitmeste regressioonanalüüside kaudu, varieerides kasutatavaid regressioonmudeleid lähtuvalt imputeeritava väärtuse tüübist. Sellest johtuvalt kasutatakse tunnuse tüübi järgi lineaarset, logistilist, Poissoni, üldistatud logistilist või segamudelit.
Imputeerimiseks kasutatakse imputeerimise ja hajuvuse hindamiseks kasutatavat tarkvara IVEware, mis on loodud Michigani Ülikooli uuringukeskuses. Tarkvara on loodud statistikapaketi SAS makrokeele baasil ning on käivitatav SAS keskkonnas.
Imputeeritavate väärtuste piirid erijuhtude jaoks määratakse eelneva analüüsi käigus.
Järelkihitamist kasutatakse analüüsimise etapil nii loendist kui ka kaost põhjustatud nihke vähendamiseks.
Järelkihitamiseks jagati maakonnad rühmadeks, mis on homogeensed üldkogumi eeldatavasti mõõdetavate tunnuste suhtes s.t ühes rühmas (nn järelkihis) on suhteliselt sarnased leibkonnad.
Järelkihid
Rühm Maakonnad
1 Tallinn 2 Ida-Viru, Lääne-Viru 3 Harju, Pärnu, Tartu 4 Jõgeva, Põlva, Valga, Viljandi, Võru 5 Järva, Lääne, Rapla, Saare 6 Hiiu
Seejärel arvutati leibkondadele järelkihitamise kaalud kujul:
6,,1, K== gpv
Rw
ig
gi
kus gruppide mahud gR üldkogumis antakse andmebaasi PR14+ põhjal. Vastanud
leibkondade arvu rühmas g tähistab gv .
Saadud kaalud peaks mõningal määral kompenseerima maakonniti mitmesugust mittelaekumist, mille tulemusena peaks suurenema ka sissetuleku hindamise täpsus.
Rahvastiku üldkooslust puudutavate andmete ühtlustamiseks korrigeeriti kaale nii, et valimist hinnatud rahvaarv ühtiks ametliku rahvaarvuga (Statistikaameti avaldatud arvestusliku rahvaarvuga). Et vastamisaktiivsus erineb ka lähtuvalt soo-vanusjaotusest ning piirkonnast, siis valimi põhjal hinnatud soo-vanuskoosseisud ei ühti päris üldkogumi vastavate jaotustega. Sellest tingitud nihke korrigeerimiseks täpsustati kalibreerimis-meetodil rahvastikustatistikas antud soo- ja vanuserühmade arvukusest lähtudes iga leibkonna varasemaid kaale. Kalibreerimisel kasutati integreeritud soo- ja vanuserühmasid, kasutades vanusjaotuse puhul analüüsivajadusest tingitud vahemikke. Lisaks vaadati kalibreerimisel leibkondade jaotust maakonniti ning linnasuse järgi (linn/maa). Kokkuvõttes kasutati kalibreerimisel järgmistest tunnustest lähtuvaid kalibreerimisgruppe:
- sugu (mees, naine), - vanuserühm (0–12, 13–14, 15, 16–19, 20–24, …, 70–74, 75+), - maakond (+Tallinn), - linnasus (maa/linn).
Puuduvate väärtuste imputeerimine
Järelkihitamine
Tabel E
Kalibreerimine
SISSETULEK JA ELAMISTINGIMUSED METOODIKA
Income and Living Conditions Methodology
STATISTIKAAMET 91 Statistical Office of Estonia
Kalibreerimiseks kasutati programmi Bascula ning meetodit linear consistent weighting. Realiseeruvad kaalud peaks võimaldama hinnata rahvaarvu esitatud kaibreerimisgruppides nii, et nad erineks võimalikult vähe vastavatest rahvastikustatistika näitajatest.
Parameetrite hindamine
Üldkogumi parameetrite hindamisel kasutatakse Horvitz-Thompsoni hinnangut.
Allpool on esitatud mõned näited erinevate uuringus kasutatavate hinnangute kohta.
Kasutusel olevad tähised:
N — leibkondade koguarv üldkogumis, L — isikute arv üldkogumis, Ld — isikute arv d-ndas osakogumis,
mi — liikmete arv i-ndas leibkonnas,
wi — kaalud (üldjuhul kalibreerimisega korrigeeritud kaal iw ′′ ),
iy — uuritava tunnuse väärtus i-nda leibkonna puhul.
Kasutatavad hinnangufunktsioonid:
1. Leibkondade koguarv
∑= r iwN̂ .
2. Isikute arv üldkogumis
∑= r iimwL̂ .
3. Uuritava tunnuse keskmine ühe leibkonna liikme kohta
∑∑==
r ii
r ii
mw
yw
L
YY
ˆ
ˆˆ .
4. Uuritava tunnuse keskmine ühe leibkonna liikme kohta osakogumis d
∑∑
==d
d
r ii
r ii
d
dd mw
yw
L
YY
ˆ
ˆˆ .
Hinnangute usaldusväärsus
Sotsiaaluuring on ulatuslik statistiline uuring, mis koosneb paljudest etappidest. Valesti või hooletult tehtud töö mis tahes etapil mõjutab lõpptulemuste kvaliteeti.
Valikuuringu andmetel baseeruvad hinnangud sisaldavad mitut tüüpi vigu. Juba vaadeldud mittevastamisest põhjustatud loendivea ja kao kõrval võivad valikuuringus esineda veel mõõtmisviga ja töötlusviga. Neid vigu püütakse uuringu korraldamisel igati vältida.
Mõõtmisvigade vähendamiseks täpsustati vajaduse korral uuringus kasutatavaid mõisteid, juhendmaterjale ja korraldati küsitlejatele koolitust lähtuvalt pilootuuringute tulemustest. Töötlusvigade minimeerimiseks on kasutusel sisestusprogramm Blaise. Mõõtmis- ja töötlusvigade avastamiseks ja ennetamiseks rakendatakse andmete sisestusetapil mitmesuguseid loogilisi kontrolle.
Paratamatu on aga juhusliku vea esinemine, mille põhjuseks on valikuuringus ainult ühe osa uurimine üldkogumist. Seetõttu erinevad valimi põhjal arvutatud näitajad — hinnangud — vastavatest tegelikest näitajatest. Seda erinevust nimetatakse hinnangu juhuslikuks veaks ehk valikuveaks.
Valimi põhjal pole võimalik valikuviga täpselt määrata, kuid seda saab arvuliselt hinnata. Hinnangu valikuvea suurus sõltub valimi suurusest ja valimi võtmise viisist. Mida suurem on valim, seda väiksem on tavaliselt valikuviga. Valikuvea tõttu ei saa valimi näitajate põhjal üldkogumi kohta vahetult järeldusi teha.
METOODIKA SISSETULEK JA ELAMISTINGIMUSED
Methodology Income and Living Conditions
92 STATISTIKAAMET
Statistical Office of Estonia
Üks näitaja, millega uuringu kvaliteeti hinnata, on hinnangu suhteline viga (standardviga jagatud hinnangu endaga):
θθ
ˆ)ˆ(V̂
sv = ,
kus θ̂ tähistab uuritava parameetri hinnangut. Suhteline viga näitab, kui suure osa hõlmab hinnangu standardviga hinnangust endast. Üldjuhul esitatakse ta protsentides. See on ühikuvaba suurus ja võimaldab seetõttu võrrelda erinevate parameetrite hinnanguid nii sellesama kui ka varasemate uuringute tulemustega, olenemata mõõtühikutest. Sõltuvalt kontekstist võib 2–3% suurust suhtelist viga pidada üldjuhul vastuvõetavaks.
Kõigile leitud hinnangutele arvutatakse valikuvigade hinnangud, kuid need publitseeritakse vaid osaliselt, peamistele hinnangutele.
Andmete sisestamine ja töötlemine
Andmed kodeeritakse ja sisestatakse tsentraalselt, seda teeb osaühing Ansis. Andmesisestuses kasutatakse programmi Blaise ja see hõlmab ka esmase loogilise kontrolli. Andmetöötlusprogramm on tehtud SAS-is. Enne tabeltöötlust kontrollitakse sisestatud andmebaasi täiendavalt.
Valikuvigade arvutamiseks kasutatakse statistiliste andmete töötlemise süsteemi SAS.
SISSETULEK JA ELAMISTINGIMUSED MÕISTED
Income and Living Conditions Definitions
STATISTIKAAMET 93 Statistical Office of Estonia
MÕISTED
Ühises põhieluruumis (ühisel aadressil) elavate isikute rühm, kes kasutab ühiseid raha- ja/või toiduressursse ja kelle liikmed ka ise tunnistavad end ühes leibkonnas olevaks. Leibkonna võib moodustada ka üksikisik.
Linn ja alev.
Alevik ja küla.
Täisealine leibkonnaliige, kes on pikema aja jooksul toonud leibkonda suurima sissetuleku.
18-aastane või vanem leibkonnaliige (uuringuaasta 1. jaanuari seisuga).
0–17-aastane leibkonnaliige (uuringuaasta 1. jaanuari seisuga).
Üheliikmeline leibkond, mille liige on vähemalt 65-aastane.
Üheliikmeline leibkond, mille liige on alla 65-aastane.
Kahe pensionäri leibkond, s.t mõlemad abikaasad/elukaaslased on vähemalt 65-aastased.
Tööealine leibkond, kus vähemalt üks liige (abikaasa/elukaaslane) on vastavas vanuses.
Vähemalt ühe täisealise ja ühe lapsega leibkond, kus ühe täiskasvanu ja ülejäänud liikmete vahel on (kasu)lapse-(kasu)vanema suhe.
Ühe lapsega abielu- või vabaabielupaar, kus lapse ja täiskasvanute vahel on (kasu)lapse-(kasu)vanema suhe.
Kahe lapsega abielu- või vabaabielupaar, kus laste ja täiskasvanute vahel on (kasu)lapse-(kasu)vanema suhe.
Vähemalt kolme lapsega abielu- või vabaabielupaar, kus laste ja täiskasvanute vahel on (kasu)lapse-(kasu)vanema suhe.
Abielu- või vabaabielupaar vähemalt ühe lapsega ja ühe täisealise liikmega, kelle ema või isa kuulub sellesse leibkonda.
Leibkonnatüüp, mis ei kuulu eelloetletute hulka.
Palgatöö eest ja individuaalsest töisest tegevusest saadud sissetuleku, omanditulu, sotsiaalsete siirete, teistelt leibkondadelt saadud regulaarsete rahaliste maksete ja enammakstud tulumaksu tagastuse summa, kust on maha arvatud leibkonna poolt tehtud regulaarsed rahalised maksed teistele leibkondadele, varalt tasutud maksud ja tulumaksu juurdemaksed.
Sissetulek palgatööst ja individuaalsest töisest tegevusest.
Tööandja poolt töötajale tema töö eest makstud rahalised maksed (sh töötasu, preemiad, lisatasud jne) ning ametiauto oma tarbeks kasutamise hinnanguline väärtus.
Rahaline kasum või kahjum ettevõtlusest. Ettevõtlus võib olla nii registreeritud kui ka registreerimata.
Kollektiivsete sotsiaalkaitse skeemide, riigi või kohaliku omavalitsuse poolt leibkonnale makstud hüvitised, mille eesmärk on leevendada mitmesuguseid riske.
Harju maakond.
Järva, Lääne-Viru ja Rapla maakond.
Ida-Viru maakond.
Hiiu, Lääne, Pärnu ja Saare maakond.
Jõgeva, Põlva, Tartu, Valga, Viljandi ja Võru maakond.
Leibkond
Linn
Maa
Leibkonnapea
Täiskasvanu
Laps
Üksiku 65-aastase ja vanema leibkond
Üksiku alla 65-aastase leibkond
Lasteta üle 65-aastane paar
Lasteta paar, vähemalt üks alla
65-aastane
Ühe või enama lapsega üksikvanem
Ühe lapsega paar
Kahe lapsega paar
Kolme või enama lapsega paar
Ala- ja täisealiste lastega paar
Muu leibkond
Netosissetulek
Sissetulek töisest tegevusest
Sissetulek palgatööst
Sissetulek individuaalsest
töisest tegevusest
Siirded
Põhja-Eesti
Kesk-Eesti
Kirde-Eesti
Lääne-Eesti
Lõuna-Eesti
MÕISTED SISSETULEK JA ELAMSITINGIMSUED
Definitions Income and Living Conditions
94 STATISTIKAAMET
Statistical Office of Estonia
Leibkonna tööealiste (16–64-aastaste) liikmete poolt sissetuleku viiteperioodil töötatud kuude arv suhestatuna kuude arvu, mida leibkonnal oli maksimaalselt võimalik töötamisele kulutada. Näitaja varieerub nullist (ükski tööealine liige ei töötanud) kuni üheni (kõik tööealised liikmed töötasid kogu sissetuleku viiteperioodi jooksul). Tööealiseks liikmeks ei loeta sõltuvaid lapsi.
Leibkonna tööintensiivsus on 0.
Leibkonna tööintensiivsus on 1.
Leibkonna tööintensiivsus on suurem kui 0, kuid väiksem kui 1.
Leibkonna tööintensiivsus on suurem kui 0 ja väiksem või võrdne 0,5.
Leibkonna tööintensiivsus on suurem kui 0,5 ja väiksem kui 1.
Põhiharidus või sellest madalam haridustase.
Kutseharidus, kutsekeskharidus (põhi- ja keskhariduse baasil), keskeriharidus peale põhihariduse omandamist, üldkeskharidus.
Keskeriharidus peale keskhariduse omandamist, rakenduskõrghariduslik õpe, diplomiõpe, bakalaureuseõpe, magistri- ja doktoriõpe.
Leibkond, mille kõik liikmed on eestlased.
Leibkond, mille kõik liikmed on mitte-eestlased.
Leibkond, milles on vähemalt üks eestlane ja üks mitte-eestlane.
Leibkonna sissetulek, mis on jagatud leibkonnaliikmete tarbimiskaalude summaga.
Leibkonnaliikmele sõltuvalt tema vanusest määratud kaal, mis võtab arvesse leibkonna ühist tarbimist.
Periood, mille kohta sissetuleku andmeid kogutakse (siin 2003. aasta).
Hõiveseisund, mis iseloomustas leibkonnapead sissetuleku viiteperioodil enam kui kuus kuud. Kui ükski seisund ei kestnud üle kuue kuu, on hõiveseisundiks “muu”. Hõiveseisund (hõivatud, töötu, vanaduspensionär jne) on leibkonnapea enda määratud.
Tööintensiivsus leibkonnas
Minimaalne tööintensiivsus
Maksimaalne tööintensiivsus
Mõningane tööintensiivsus
Madal, kuid mitte minimaalne
tööintensiivsus
Kõrge, kuid mitte maksimaalne
tööintensiivsus
Esimene haridustase
Teine haridustase
Kolmas haridustase
Eesti leibkond
Mitte-eesti leibkond
Segaleibkond
Ekvivalentsissetulek
Tarbimiskaal
Sissetuleku viiteperiood
Leibkonnapea peamine
hõiveseisund
SISSETULEK JA ELAMISTINGIMUSED METOODIKA
Income and Living Conditions Methodology
STATISTIKAAMET 95 Statistical Office of Estonia
Methodology
Purpose of the survey
EU-SILC (European Union Statistics on Income and Living Conditions) is a sample survey designed to obtain comparative and reliable statistics on income distribution, living conditions and social exclusion at European level. The survey results are used to study the social and economic development of the society and to plan and evaluate socio-political decisions.
All Member States and a few countries not belonging to the EU are involved in the survey. The survey data is based on nationally representative probability samples to permit detailed analysis by population subgroups.
Regulations to ensure the overall comparability of national surveys are declared by European Commission. Still the Member States have some flexibility in the design of EU-SILC. The data are required in both cross-sectional (pertaining to a given time in a certain time period) and longitudinal (pertaining to individual-level changes over time) dimensions. Therefore households and their members are surveyed on an annual basis, maximally during 4 consequtive years.
The Statistical Office of Estonia runs the survey since the year 2004, pilot surveys were organized in the period 2002–2003. The present publication summarises the data collected by the survey in 2004.
All published estimates have been calculated for the total population (or for the population of a respective region). The sample sizes have been determined on the basis of the estimated total population provided by the Statistical Office. Due to rounding, the column sums are not always equal with the total, the difference may be up to some last decimal places.
Population and sample
All households living permanently in Estonia are considered as the surveyed population. Persons living in institutional households (children’s homes, care homes, convents) are excluded.
Required sampling precision is specified by Eurostat and it is an essential component of the data quality standards in EU-SILC. Draft EU-SILC Regulation stipulates the minimum effective sample size in country level both for cross-sectional and longitudinal parts of the surveys. The minimum sample size requirements are specified taking into account the diversity of data sources and survey designs.
The minimum effective sample sizes fixed for Estonia are:
3,500 households and 7,750 persons aged 16 and over in the cross-sectional survey;
2,750 households and 5,750 persons aged 16 and over in the longitudinal survey.
The actual sample sizes will have to be larger to the extent that the design effects exceed 1.0 and to be able to compensate for all kinds of non-response. The actual sample sizes are to be calculated by the national statistical offices.
The final sample was set to 6,000 address persons and their households.
Survey design
The sampling of address persons was carried out by stratified systematic sampling procedure, i.e. independent sub-samples were drawn separately from the non-overlapping subpopulations called strata. Within each stratum systematic sampling procedure was used. On household level the survey design is stratified unequal probability sampling of households as bigger households have bigger probabilities due their bigger coverage in the frame.

METOODIKA SISSETULEK JA ELAMISTINGIMUSED
Methodology Income and Living Conditions
96 STATISTIKAAMET
Statistical Office of Estonia
The design is basically the same that is used for the Estonian Household Budget Survey. Sampling is carried through among the records of the Population Register, whereas the sampling frame consists of people 14 years old and older (14+). In 2004, the sample was drawn from a joint database of the Population Register and Population Census. Since 2005 the data for Census is no longer available for use. The frame was denoted as PR14+.
Pre-stratification is necessary to apply different inclusion probabilities in the defined strata. This way sufficient data can be collected to produce good estimates for various levels of the population and get comparable estimates also on county level.
Pre-strata are formed geographically by grouping Estonian counties (and the capital city Tallinn) into three strata by the population size. Hiiu county forms a separate stratum as the smallest county with the population size times smaller of the next smallest. The rest of the regions are divided into two strata — big counties and small counties.
From different strata, the persons were included with different probabilities (in the case of smaller counties the sampling rate was higher to guarantee the necessary sample size for estimating important parameters).
Within each stratum systematic sampling procedure of persons is used with different sampling fractions in the defined strata. Each selected person brought its household into the sample if the household resided in Estonia and the address-person had not died or moved to an institution or abroad for more than 6 months (no matter what the reason was). All members aged 16+ of selected households were interviewed.
Stratification by counties, 2004 Stratum h Counties Rh nh nh/Rh %
Large Tallinn, Harju, Ida-Viru, Lääne-Viru, Pärnu, Tartu
862 786 3 600 0.42
Small Jõgeva, Järva, Lääne, Põlva, Rapla, Saare, Valga, Viljandi, Võru
285 106 2 200 0.77
Hiiu Hiiu county 8 550 200 2.34
Rh stands for the number of persons aged 14 and over living in stratum h as at 01.01.2004, nh is the sample size of the stratum h and nh/Rh (%) is the sampling fraction in the corresponding stratum.
Since in the Population Register, counties have been arranged in a certain order, the systematic sampling procedure inside strata results in the proportional allocation of the sample for its counties (Table B).
Sample by counties and strata, 2004 Region Population aged 14+ according to
January 2004 Sample size
1. Large Tallinn 347 115 1 448 Harju 105 413 440 Ida-Viru 152 593 637 Lääne-Viru 55 906 233 Pärnu 75 977 317 Tartu 125 782 525
Total 862 786 3 600 2. Small
Jõgeva 31 426 242 Järva 32 194 248 Lääne 23 689 183 Põlva 26 908 208 Rapla 30 955 239 Saare 29 861 230 Valga 29 370 227 Viljandi 47 904 370 Võru 32 799 253
Total 285 106 2 200 3. Hiiu 8 550 200 Grand total 1 156 442 6 000
Table A
Table B
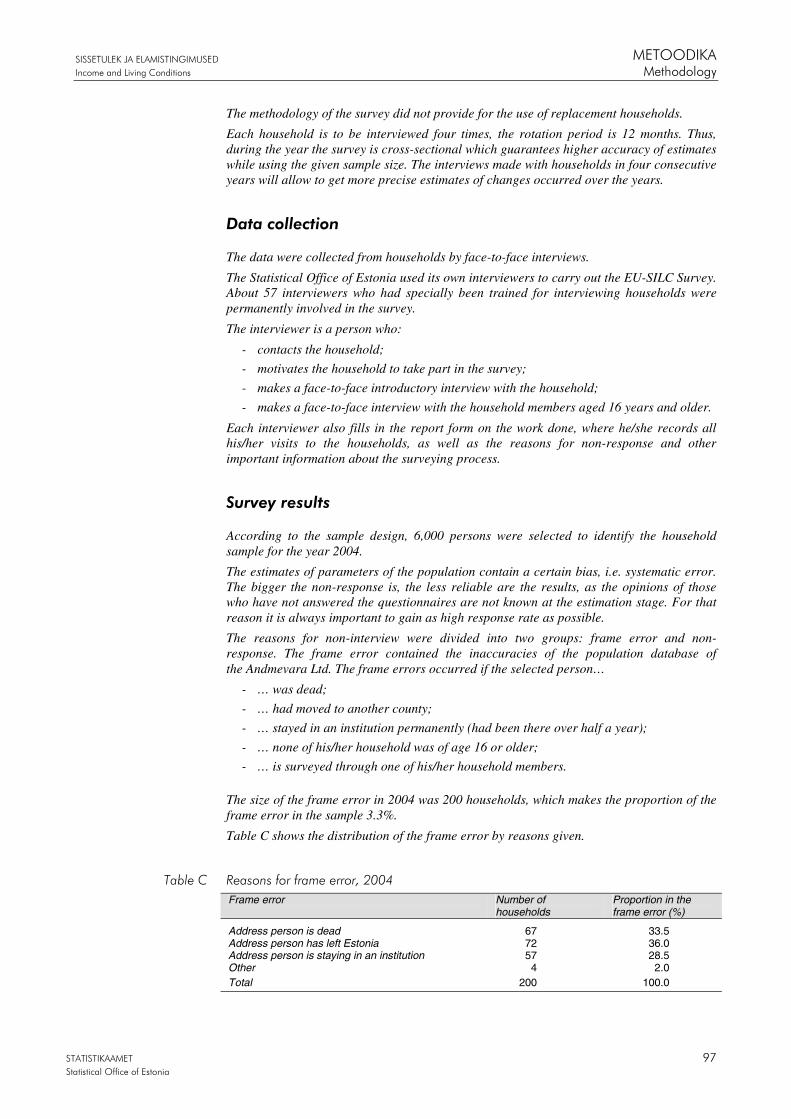
SISSETULEK JA ELAMISTINGIMUSED METOODIKA
Income and Living Conditions Methodology
STATISTIKAAMET 97 Statistical Office of Estonia
The methodology of the survey did not provide for the use of replacement households.
Each household is to be interviewed four times, the rotation period is 12 months. Thus, during the year the survey is cross-sectional which guarantees higher accuracy of estimates while using the given sample size. The interviews made with households in four consecutive years will allow to get more precise estimates of changes occurred over the years.
Data collection
The data were collected from households by face-to-face interviews.
The Statistical Office of Estonia used its own interviewers to carry out the EU-SILC Survey. About 57 interviewers who had specially been trained for interviewing households were permanently involved in the survey.
The interviewer is a person who:
- contacts the household;
- motivates the household to take part in the survey;
- makes a face-to-face introductory interview with the household;
- makes a face-to-face interview with the household members aged 16 years and older.
Each interviewer also fills in the report form on the work done, where he/she records all his/her visits to the households, as well as the reasons for non-response and other important information about the surveying process.
Survey results
According to the sample design, 6,000 persons were selected to identify the household sample for the year 2004.
The estimates of parameters of the population contain a certain bias, i.e. systematic error. The bigger the non-response is, the less reliable are the results, as the opinions of those who have not answered the questionnaires are not known at the estimation stage. For that reason it is always important to gain as high response rate as possible.
The reasons for non-interview were divided into two groups: frame error and non-response. The frame error contained the inaccuracies of the population database of the Andmevara Ltd. The frame errors occurred if the selected person…
- … was dead;
- … had moved to another county;
- … stayed in an institution permanently (had been there over half a year);
- … none of his/her household was of age 16 or older;
- … is surveyed through one of his/her household members.
The size of the frame error in 2004 was 200 households, which makes the proportion of the frame error in the sample 3.3%.
Table C shows the distribution of the frame error by reasons given.
Reasons for frame error, 2004 Frame error Number of
households Proportion in the frame error (%)
Address person is dead 67 33.5 Address person has left Estonia 72 36.0 Address person is staying in an institution 57 28.5 Other 4 2.0 Total 200 100.0
Table C
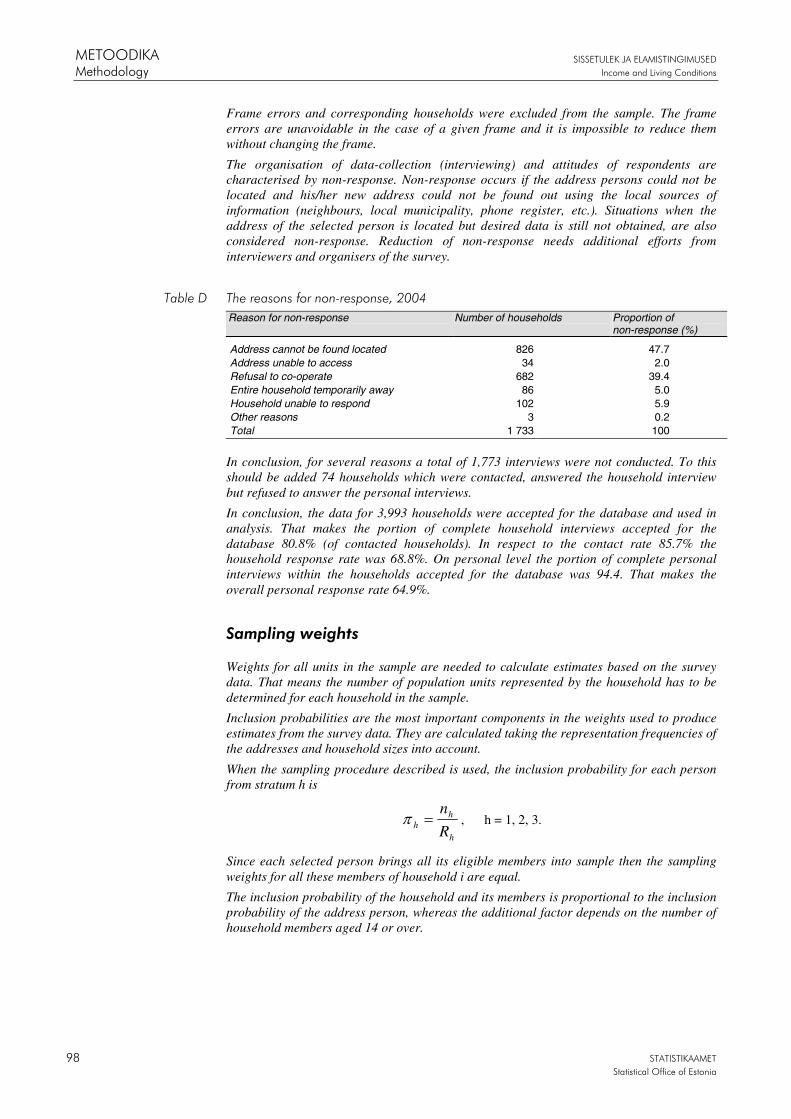
METOODIKA SISSETULEK JA ELAMISTINGIMUSED
Methodology Income and Living Conditions
98 STATISTIKAAMET
Statistical Office of Estonia
Frame errors and corresponding households were excluded from the sample. The frame errors are unavoidable in the case of a given frame and it is impossible to reduce them without changing the frame.
The organisation of data-collection (interviewing) and attitudes of respondents are characterised by non-response. Non-response occurs if the address persons could not be located and his/her new address could not be found out using the local sources of information (neighbours, local municipality, phone register, etc.). Situations when the address of the selected person is located but desired data is still not obtained, are also considered non-response. Reduction of non-response needs additional efforts from interviewers and organisers of the survey.
The reasons for non-response, 2004 Reason for non-response Number of households Proportion of
non-response (%)
Address cannot be found located 826 47.7 Address unable to access 34 2.0 Refusal to co-operate 682 39.4 Entire household temporarily away 86 5.0 Household unable to respond 102 5.9 Other reasons 3 0.2 Total 1 733 100
In conclusion, for several reasons a total of 1,773 interviews were not conducted. To this should be added 74 households which were contacted, answered the household interview but refused to answer the personal interviews.
In conclusion, the data for 3,993 households were accepted for the database and used in analysis. That makes the portion of complete household interviews accepted for the database 80.8% (of contacted households). In respect to the contact rate 85.7% the household response rate was 68.8%. On personal level the portion of complete personal interviews within the households accepted for the database was 94.4. That makes the overall personal response rate 64.9%.
Sampling weights
Weights for all units in the sample are needed to calculate estimates based on the survey data. That means the number of population units represented by the household has to be determined for each household in the sample.
Inclusion probabilities are the most important components in the weights used to produce estimates from the survey data. They are calculated taking the representation frequencies of the addresses and household sizes into account.
When the sampling procedure described is used, the inclusion probability for each person from stratum h is
h
hh R
n=π , h = 1, 2, 3.
Since each selected person brings all its eligible members into sample then the sampling weights for all these members of household i are equal.
The inclusion probability of the household and its members is proportional to the inclusion probability of the address person, whereas the additional factor depends on the number of household members aged 14 or over.
Table D
SISSETULEK JA ELAMISTINGIMUSED METOODIKA
Income and Living Conditions Methodology
STATISTIKAAMET 99 Statistical Office of Estonia
The household having p members aged 14 and over has the inclusion probability p times higher than the household having only one person in that age group. The inclusion probability of the household i in the stratum h selected by person-rule
ish
ihihhi R
pnp == ππ ,
where pi is the number of persons aged 14 and over in this household, given by the household.
Sampling weights are inverses of inclusion probabilities. The initial weights were corrected before final use to compensate for non-response and frame errors and to balance some important estimates with the ones from different data sources.
Compensation of non-response
The final estimates were not calculated using the initial weights. The weights were corrected beforehand to compensate the low response rate and also frame errors.
The following techniques are used to compensate the presence of frame errors and non-response:
- imputation of missing values;
- post-stratification;
- calibration on demographic data.
The last method is mainly used to balance the results with other data sources.
According to European Commission regulations, all of the income components are imputed if the variables are not filled. It is the case when respondents have refused to answer or they do not know the correct answer (do not remember, have no time to check, etc.).
The imputation for most variables is made using the Sequential Regression Imputation Method described by Raghunathan, Lepkowski, Van Hoewyk and Solenberger. The approach is not to consider imputation on a variable-by-variable basis but to condition on all observed variables. The imputations are created through sequence of multiple regressions, varying the type of regression model by the type of variable being imputed. The types of regression models used are linear, logistic, Poisson, generalized logistic or mixed logistic/linear, depending on the type of variable being imputed.
In practice, the imputation is carried out with the imputation and variance estimation software IVEware, developed by the Survey Research Centre at the University of Michigan. The software is built on SAS macro language.
In case of some variables the imputation is based on analytical considerations. i.e. for different social benefits the bounds are calculated for different groups of households/persons. Then the imputation method described is used to impute the actual values using the bounds found.
Post-stratification in the analysis stage is used to reduce the bias in estimates caused by frame errors and non-response.
For post-stratification the counties were divided into groups that are expected to be homogeneous in respect to the measured variables of the population, i.e. in any group (post-stratum) the households are relatively similar by the measured variables and the response activity, as well.
Imputation of missing values
Post-stratification

METOODIKA SISSETULEK JA ELAMISTINGIMUSED
Methodology Income and Living Conditions
100 STATISTIKAAMET
Statistical Office of Estonia
Post-strata Group Counties
1 Tallinn 2 Ida-Viru, Lääne-Viru 3 Harju, Pärnu, Tartu 4 Jõgeva, Põlva, Valga, Viljandi, Võru 5 Järva, Lääne, Rapla, Saare 6 Hiiumaa
After that the post-stratification weights were calculated using the following formulae:
6,,1, K== gpv
Rw
ig
gi
where population counts gR are received from PR14+. The number of responding
households in group g is denoted by gv .
Consequently, chosen post-stratification and derived weights help to some extent compensate non-response, by means of which income estimators should be improved.
The initial weights were corrected so that the population size estimated by the data of this survey would coincide with the official population number published by the Statistical Office. As the participation activity also differs depending on the age, the sex-age structure and location, the population numbers estimated by the collected data also differ from the demographic information. To correct the bias caused by this feature the weights were corrected for each household using the calibration method with integrated groups defined by sex, age, resident area and urbanity indicator (urban/rural area). The age-groups were chosen depending on the need for analysis
In conclusion the following variables were used in calibration:
─ sex (female, male) ─ age group (0–12, 13–14, 15, 16–19, 20–24, …, 70–74, 75+) ─ county (+Tallinn) ─ rural/urban area
The programme Bascula using linear consistent weighting method was used for calibration. This way the estimated totals of people in defined groups should be as close as possible to the actual number of people in these calibration groups.
Estimation of parameters
To estimate the parameters of population, the Horvitz-Thompson estimator is used.
Below, some special estimates are given as examples. The following notations are used in the formulae:
N – total number of households in the population;
L – number of people in the population;
dL – number of people in the population domain d,
im – number of members in the household i,
iy – study variable value of the household i.
wi – weight for household i (in general case the calibrated weights iw ′′ ).
Table E
Calibration
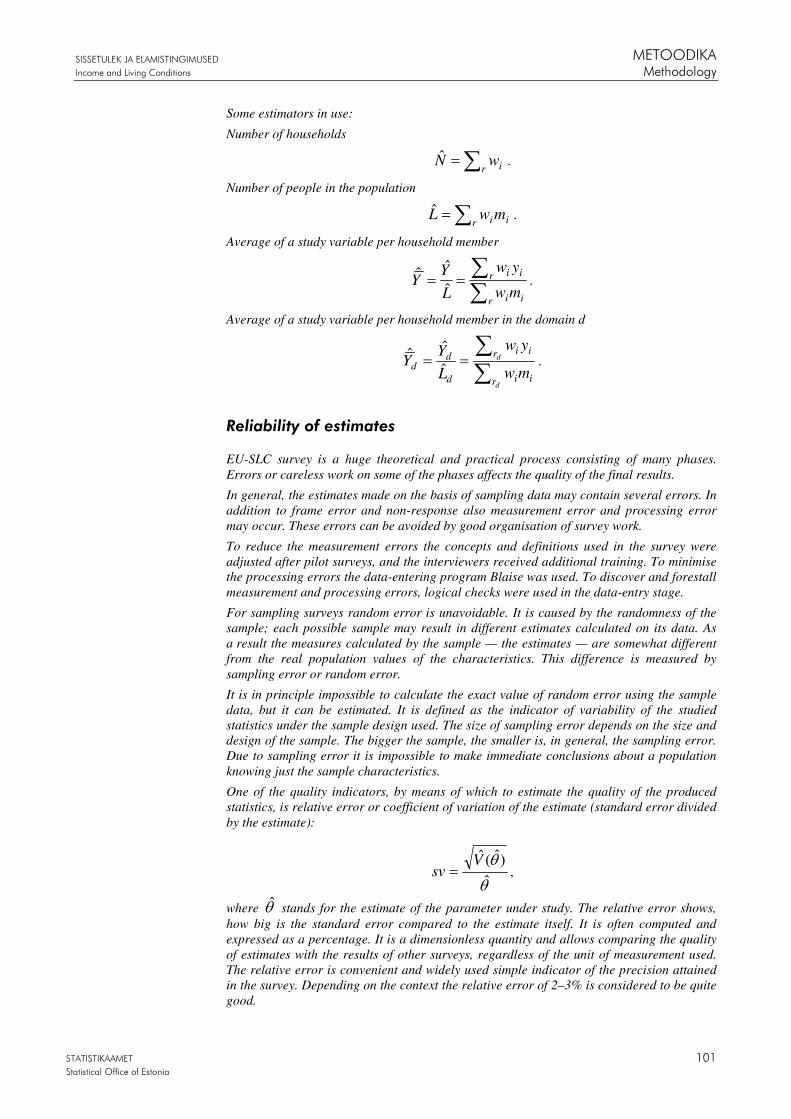
SISSETULEK JA ELAMISTINGIMUSED METOODIKA
Income and Living Conditions Methodology
STATISTIKAAMET 101 Statistical Office of Estonia
Some estimators in use:
Number of households
∑= r iwN̂ .
Number of people in the population
∑= r iimwL̂ .
Average of a study variable per household member
∑∑==
r ii
r ii
mw
yw
L
YY
ˆ
ˆˆ .
Average of a study variable per household member in the domain d
∑∑
==d
d
r ii
r ii
d
dd mw
yw
L
YY
ˆ
ˆˆ .
Reliability of estimates
EU-SLC survey is a huge theoretical and practical process consisting of many phases. Errors or careless work on some of the phases affects the quality of the final results.
In general, the estimates made on the basis of sampling data may contain several errors. In addition to frame error and non-response also measurement error and processing error may occur. These errors can be avoided by good organisation of survey work.
To reduce the measurement errors the concepts and definitions used in the survey were adjusted after pilot surveys, and the interviewers received additional training. To minimise the processing errors the data-entering program Blaise was used. To discover and forestall measurement and processing errors, logical checks were used in the data-entry stage.
For sampling surveys random error is unavoidable. It is caused by the randomness of the sample; each possible sample may result in different estimates calculated on its data. As a result the measures calculated by the sample — the estimates — are somewhat different from the real population values of the characteristics. This difference is measured by sampling error or random error.
It is in principle impossible to calculate the exact value of random error using the sample data, but it can be estimated. It is defined as the indicator of variability of the studied statistics under the sample design used. The size of sampling error depends on the size and design of the sample. The bigger the sample, the smaller is, in general, the sampling error. Due to sampling error it is impossible to make immediate conclusions about a population knowing just the sample characteristics.
One of the quality indicators, by means of which to estimate the quality of the produced statistics, is relative error or coefficient of variation of the estimate (standard error divided by the estimate):
θθ
ˆ)ˆ(V̂
sv = ,
where θ̂ stands for the estimate of the parameter under study. The relative error shows, how big is the standard error compared to the estimate itself. It is often computed and expressed as a percentage. It is a dimensionless quantity and allows comparing the quality of estimates with the results of other surveys, regardless of the unit of measurement used. The relative error is convenient and widely used simple indicator of the precision attained in the survey. Depending on the context the relative error of 2–3% is considered to be quite good.
METOODIKA SISSETULEK JA ELAMISTINGIMUSED
Methodology Income and Living Conditions
102 STATISTIKAAMET
Statistical Office of Estonia
Relative errors of EU-SILC are calculated for all estimates, but just part of them are published.
Data entry and processing
The data are coded and entered centrally by Ansis Ltd. In data entering the system Blaise data entering also includes primary logical check. The program for data processing is programmed in SAS. Before processing of tables, the database is additionally checked in the Social Statistics Department.
To calculate the weights and sampling errors the system SAS is used.

SISSETULEK JA ELAMISTINGIMUSED MÕISTEDIncome and Living Conditions Definitions
STATISTIKAAMET 103 Statistical Office of Estonia
Definitions
is a group of persons living in the common main dwelling (at the same address), who share joint financial and/or food resources and whose members consider themselves to belong to the same household. Household can also consist of one member only.
area includes cities and towns.
area includes small towns and villages.
is a household member aged 18 or more (as at 1 January of the reference year).
is a household member aged 0–17 (as at 1 January of the reference year).
is an adult household member with the largest income (long-term contribution to the household).
is a household consisting of one at least 65 year-old member.
is a household consisting of one under 65 year-old member.
is a household of two pensioners, where spouses are at least 65 years old.
is a household of two persons, where at least one member (partner) is in the respective age.
is a household consisting of at least one adult and one child, where the relationship between one adult and all other members is that of (step)child-(step)parent.
is legally married or cohabiting couple with one child, where the relationship between the adults and the child is that of (step)child-(step)parent.
is legally married or cohabiting couple with two children, where the relationship between the adults and the children is that of (step)child-(step)parent.
is legally married or cohabiting couple with at least three children, where the relationship between the adults and the children is that of (step)child-(step)parent.
is legally married or cohabiting couple with at least one minor and one adult child.
is a household, which does not belong to any of the aforementioned categories.
is a sum of income from wage labour, benefits and losses from self-employment, property income, social transfers, regular inter-household cash transfers received and receipts for tax adjustment of which inter-household cash transfers paid, taxes on wealth and repayments for tax adjustment have been subtracted.
includes income from wage labour and self-employment.
is the total remuneration in cash, payable by an employer to an employee in return for the work done by the latter, as well as the estimated value of company car used for private purposes.
defined as cash benefits or losses from self-employment, regardless whether self-employment is registered or not.
are payments made by collectively organised schemes, government or local authorities with the intension to relieve the households or persons from the financial burden of a number of risks.
includes Harju county.
includes Järva, Lääne-Viru and Rapla counties.
includes Ida-Viru county.
Household
Urban
Rural
Adult
Child
Head of the household
Single pensioner’s household
Household of a single working-
age member Couple aged 65 and
more without children
Couple without children whereas at least one partner is
aged under 65
Single parent with child(ren)
Couple with one child
Couple with two children
Couple with three or more children
Couple with minor and adult children
Other household
Disposable (net) income
Income from employment
Income from wage labour
Income from self-employment
Transfers
Northern Estonia
Central Estonia North-Eastern
Estonia
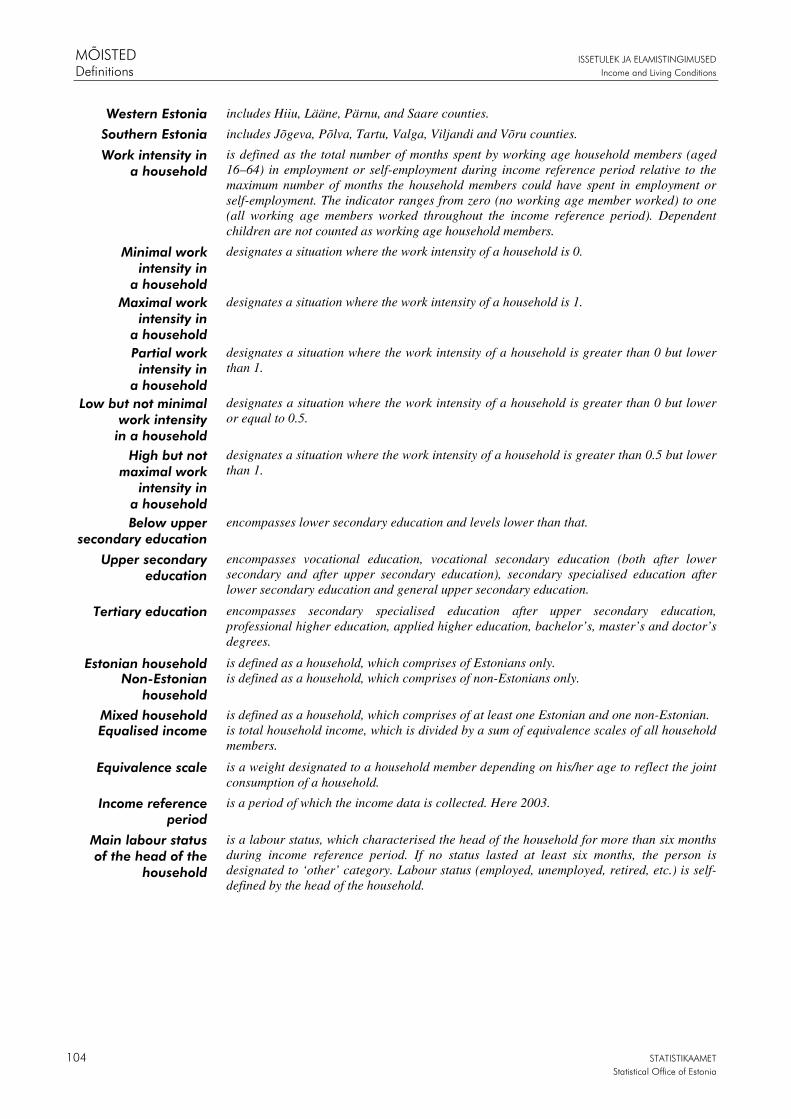
MÕISTED ISSETULEK JA ELAMISTINGIMUSED
Definitions Income and Living Conditions
104 STATISTIKAAMET
Statistical Office of Estonia
includes Hiiu, Lääne, Pärnu, and Saare counties.
includes Jõgeva, Põlva, Tartu, Valga, Viljandi and Võru counties.
is defined as the total number of months spent by working age household members (aged 16–64) in employment or self-employment during income reference period relative to the maximum number of months the household members could have spent in employment or self-employment. The indicator ranges from zero (no working age member worked) to one (all working age members worked throughout the income reference period). Dependent children are not counted as working age household members.
designates a situation where the work intensity of a household is 0.
designates a situation where the work intensity of a household is 1.
designates a situation where the work intensity of a household is greater than 0 but lower than 1.
designates a situation where the work intensity of a household is greater than 0 but lower or equal to 0.5.
designates a situation where the work intensity of a household is greater than 0.5 but lower than 1.
encompasses lower secondary education and levels lower than that.
encompasses vocational education, vocational secondary education (both after lower secondary and after upper secondary education), secondary specialised education after lower secondary education and general upper secondary education.
encompasses secondary specialised education after upper secondary education, professional higher education, applied higher education, bachelor’s, master’s and doctor’s degrees.
is defined as a household, which comprises of Estonians only. is defined as a household, which comprises of non-Estonians only.
is defined as a household, which comprises of at least one Estonian and one non-Estonian. is total household income, which is divided by a sum of equivalence scales of all household members.
is a weight designated to a household member depending on his/her age to reflect the joint consumption of a household.
is a period of which the income data is collected. Here 2003.
is a labour status, which characterised the head of the household for more than six months during income reference period. If no status lasted at least six months, the person is designated to ‘other’ category. Labour status (employed, unemployed, retired, etc.) is self-defined by the head of the household.
Western Estonia
Southern Estonia
Work intensity in a household
Minimal work intensity in
a household Maximal work
intensity in a household Partial work intensity in
a household Low but not minimal
work intensity in a household
High but not maximal work
intensity in a household Below upper
secondary education
Upper secondary education
Tertiary education
Estonian household Non-Estonian
household
Mixed household Equalised income
Equivalence scale
Income reference period
Main labour status of the head of the
household