Embed Size (px)
Citation preview
Single tube 10-color assay for sensitive detection of residual plasma cell neoplasms: MSKCC experience
Mikhail Roshal MD, PhDHematopathology ServiceMemorial Sloan-Kettering Cancer CenterNew York, NY

Rationale for 10-color MRD validation
• Consensus for using CD38, CD138, CD56, CD117, CD81, CD27, CD19, CD45 , kappa, lambda-10 currently suggested markers
• 10-color instruments are becoming more widespread (Navios/Canto 10)
• Efficient utilization of limiting resources – instrument time, sample amount, analysis time, digital
storage) vs. multi-tube panels– Acquisition of 5 million cells/tube =15-25 minutes+150 Mb
file• Reduces need for inferential reasoning and eliminates file
merging
Borrowed from EuroFlow
• Euroflow lyse/stain/fix/fix stain processing method:– Allows for standardized acquisition of appropriate number of
cells with consistent scattter (provided a good biopsy is obtained)
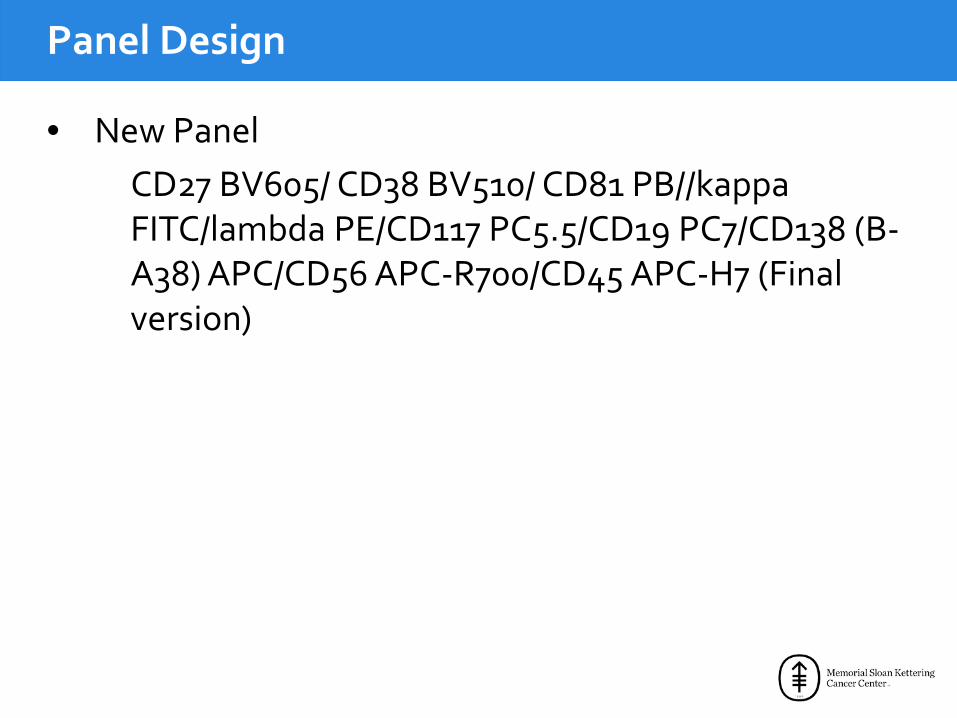
Panel Design
• New PanelCD27 BV605/ CD38 BV510/ CD81 PB//kappa FITC/lambda PE/CD117 PC5.5/CD19 PC7/CD138 (B-A38) APC/CD56 APC-R700/CD45 APC-H7 (Final version)
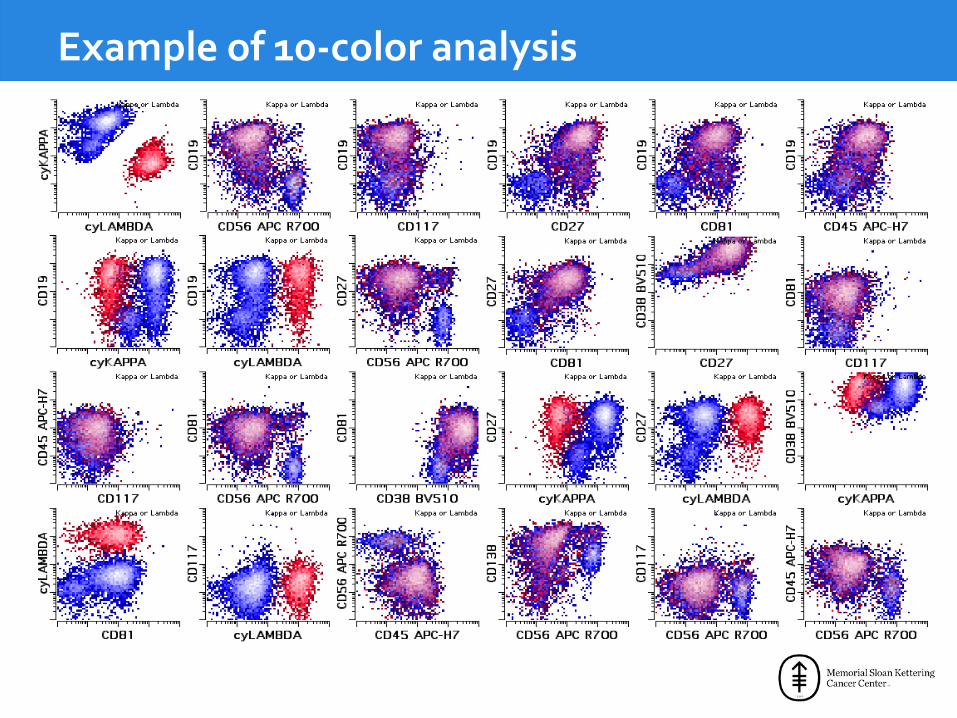
Example of 10-color analysis

Accuracy/Sensitivity Assessment
• 44 (final version) samples from patients with plasma cell disorder follow-up (20 post transplant, pre (22) and unknown (2)) unselected sample leftovers– 8 color number of cells range: (74K-596K, Mean 383K)– 10 color (38K-8700K, Mean 5900K)
• 20 samples from patients with “other “ disorders: lymphoma, MDS, thrombocytopenia
• Compare to predicate method• Analyst blinded to results obtained by another method

Accuracy PCN Patients
2 Method Comparison: % Neoplastic PC in WBC

8 color vs. 10 neg/pos
10 million acquisition, 10-color PC: 84 abnormal events
883K acquisition, 8-color PC: 6 abnormal events (<10, negative)

Sample Comparison Summary
• 8-color: 31/44 positive in PCN follow-up• 10-color 35/44 positive in PCN follow-up• 1/20 positive in “other” both methods (LPL)• Discrepancy was always due to number of cells
acquired – All in remission, low disease burden– All discrepant samples were from post transplant
patients

Precision/Linearity/Limit of Detection
• Abnormal Plasma cell sample spiked into a Normal (MDS) sample in triplicate
• 4 sequential 10X dilutions (3 points in triplicate)• All samples independently processed and stained• Measure precision at each level• Establish precision near lowest expected abnormal cell numbers • Measure recovery at each level• Range 4500-30 cells
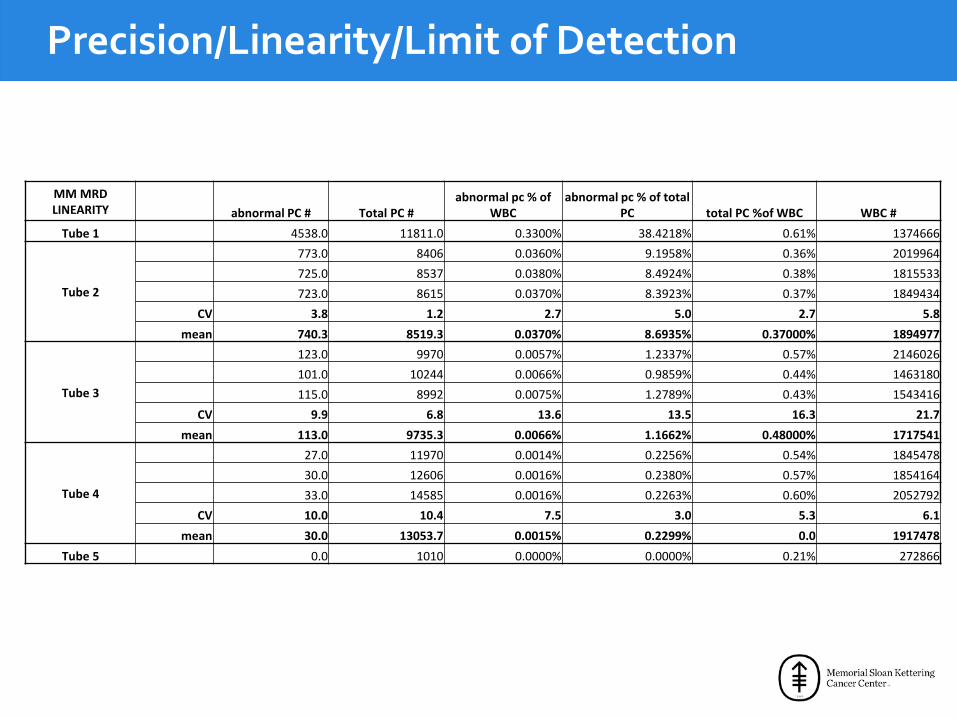
Precision/Linearity/Limit of Detection
MM MRD LINEARITY abnormal PC # Total PC #
abnormal pc % of WBC
abnormal pc % of total PC total PC %of WBC WBC #
Tube 1 4538.0 11811.0 0.3300% 38.4218% 0.61% 1374666
Tube 2
773.0 8406 0.0360% 9.1958% 0.36% 2019964725.0 8537 0.0380% 8.4924% 0.38% 1815533723.0 8615 0.0370% 8.3923% 0.37% 1849434
CV 3.8 1.2 2.7 5.0 2.7 5.8mean 740.3 8519.3 0.0370% 8.6935% 0.37000% 1894977
Tube 3
123.0 9970 0.0057% 1.2337% 0.57% 2146026101.0 10244 0.0066% 0.9859% 0.44% 1463180115.0 8992 0.0075% 1.2789% 0.43% 1543416
CV 9.9 6.8 13.6 13.5 16.3 21.7mean 113.0 9735.3 0.0066% 1.1662% 0.48000% 1717541
Tube 4
27.0 11970 0.0014% 0.2256% 0.54% 184547830.0 12606 0.0016% 0.2380% 0.57% 185416433.0 14585 0.0016% 0.2263% 0.60% 2052792
CV 10.0 10.4 7.5 3.0 5.3 6.1mean 30.0 13053.7 0.0015% 0.2299% 0.0 1917478
Tube 5 0.0 1010 0.0000% 0.0000% 0.21% 272866

Precision/Linearity/Limit of Detection
Recovery slightly increases with fewer abnormal cells
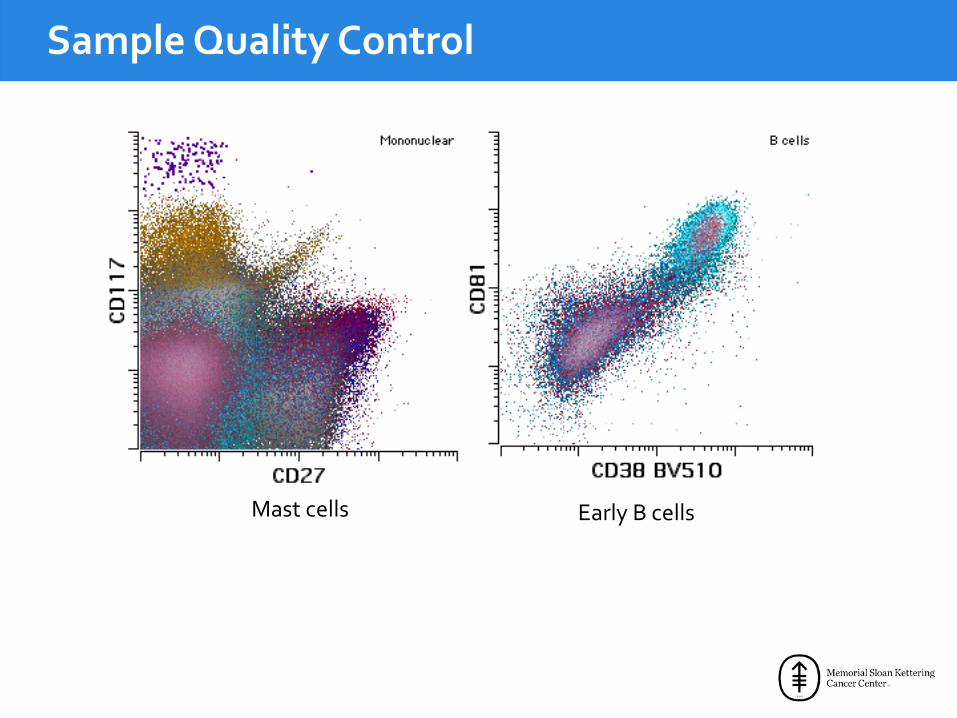
Sample Quality Control
Mast cells Early B cells

Cell Losses with Perm vs. 2 tube approach (Euroflow)
# Events 10C PC Tube # Events EuroFlow5195356 3704581 23782174767567 3192946 23229301967763 1396119 9947505225656 2857943 29345025964189 3351625 33006934840782 3692511 24157943062964 1422475 10899646000000 3443175 26385755424060 2631025 17060645076271 1835450 16403025986407 3303268 26629906000000 3566177 18759012406885 2065600 9050504860198 4575511 20857256116838 5031300 35449006000000 4602250 33839756000000 4576445 486827510000000 5729045 56601764741443 3360708 25700766041259 6000000 50936745729316 3055708 28068856000000 4661975 35844936000000 6000000 16344124607295 5351200 18030136000000 6000000 50957486114018 4485808 36452756000000 4210250 28512752299225 2126000 12763881259504 1236993 9560763473324 3539728 21456283037395 2728306 11896255807403 4351150 33941846000000 4547450 41456505017601 4335548 38682086000000 5136100 35568805600889 3900950 28617021215018 3121100 6209902085615 2588975 1746216000000 6000000 52226946941345 6183046 36275256000000 6000125 487822510000000 6104025 56690256000000 6000000 3096200
• 4 ml of marrow split in half between Euroflow and MSKCC tests
• Entire sample used unless >30 million
• 45 marrows attempted:• 39 > 3 million (10 PC)• 35 >3 million: EF1, • 20> 3 million EF2
• Approx. 30% cell loss with perm EF1vs. EF2
• Same when we compared PC# in surface only B cell tube vs. 10PC
4 ml of bone marrow
2ml: 10 PC 2ml: EF1 (surface only)
and Ef2 (surface+cytopl
asmic)

MSK flow vs. Euroflow

Practical Points
• 10-color assay is highly sensitive single tube assay• Approximately 4 hours from sample to report• 5-6 sample batch is ok• Cocktail (surface and light chain) is stable for at least 2 weeks• 15-25 minute instrument time/sample• 150 Mb file• 15 minute import/analysis/reporting time on average• Reduced reagent costs and instrument time (approx. 2X)• Limited analysis of “other” populations
– Assess presence of mast cells/immature myeloid precursors/B-cell precursors
– Dedicated tubes run for other disorders as indicated