Embed Size (px)
Citation preview

4120 SOUTH ARIZONA AVENUE CHANDLER, ARIZONA 85248
SINGLE TENANT INVESTMENT OFFERING

STEVE FERNANDEZ Investment Properties CBRE | Capital Markets602.735.5553 [email protected]
FOR MORE INFORMATION PLEASE CONTACT:
CAM STANTONInvestment PropertiesCBRE | Capital Markets602.735.5545 [email protected]

2575 East Camelback RoadPhoenix, Arizona 85016
www.cbre.us/phoenix
EXECUTIVE SUMMARY ................................... 4The Opportunity AssetProfile Financial HighlightsInvestment HighlightsLocation Overview Demographics TrafficCounts
PROPERTY OVERVIEW .................................. 8About the CenterParcel InfoPhoenix MapSite PlanAerial Maps
LEASE SUMMARY ........................................ 18
MARKET OVERVIEW .................................... 20Metro Phoenix Retail Market OverviewChandler Retail Market OverviewCity of Chandler Overview
TABLE OF CONTENTS
© 2018 CBRE, Inc. Al l r ights reserved.

Ross Dress for Less Offering Memorandum4
THE OPPORTUNITY
CBRE, Inc. has been retained as the exclusive representative on behalf of RED Development of Ocotillo, LLC, to offer the rare opportunity to acquire Ross Dress for Less (a Fortune 500 Company). Ross is a ±30,187 square foot store, strategically situated within the ±320,775 square foot Fulton Ranch Towne Center. The property is located at 4120 S. Arizona Avenue, Chandler, Arizona. The location is at the southwest corner of Arizona Avenue and Ocotillo Road, a prominent retail intersection in Chandler, Arizona.
Ross, as part of Fulton Ranch Towne Center was developed by RED Development in 2005 and is a co-tenant with Lowe’s, Dollar Tree, Staples, Petco, and Big 5. Anchor tenants on the adjacent corners are Home Depot, Target, LA Fitness, PetSmart, and many national restaurants.
Ross at Fulton Ranch Towne Center offering consists of a five-year (4.5 years remaining) triple net (NNN) single tenant lease. Ross exercised their first five-year option to renew one year prior to the expiration of their initial 10-year term, a clear indication of Ross’s desire to remain at this key location.
ASSET PROFILE
Address: 4120 South Arizona AvenueChandler, Arizona
Size: ± 30,187 SFSite Area: ± 0.78 AcresYear Built: 2007Parcel Number: 303-54-938Type: Single Tenant
FINANCIAL HIGHLIGHTS
Price: $5,945,000
Current Rent:
Less Reserves:
NOI:
$392,431
($6,000)
$386,431
Cap Rate: 6.5%
Term Expiration: 4.5 Years (1/31/2023)
You are solely responsible for independently verifying the information in this Memorandum. ANY RELIANCE ON IT IS SOLELY AT YOUR OWN RISK.

INVESTMENT HIGHLIGHTS
• 4.5 years (remaining) NNN lease• Ross exercised first five-year option to renew one
year prior to expiration of their initial 10-year term• The availability of acquiring a single tenant Ross
is rare• Rental rate at market, which will allow investor to
replace rent• Ross is an S&P, Fortune 500 and NASDAQ 100
Company with an A3 Moody’s Credit Rating• Ross is the second-largest off-price retailer in the
U.S.A. with 1,342 locations in over 34 states, the District of Columbia and Guam
• Located at a major retail intersection in Chandler, Arizona
• Surrounded by major tenants such Lowe’s, Sta-ples, Big 5 Sporting Goods, Petco, Target, LA Fit-ness, and PetSmart
• Average Household income of $99,204 in a five-mile radius*
• Major employers in submarket:
• Intel
• Wells Fargo
• PayPal
• Orbital
• GM
• ebay
• Isagenix
• Amkor
*Source: ERSI 2018

Ross Dress for Less Offering Memorandum6
LOCATION OVERVIEW
Fulton Ranch Towne Center is a part of Fulton Ranch, a ±520-acre, lake based lifestyle village in Chandler, Arizona, a high-end community in the southeast portion of metro Phoenix. Neighborhood amenities include shopping, entertainment, dining, parks, recreation and lakes. Its central location in Chandler benefits from the city’s tremendous growth with an expected population increase of 3.26% within a one-mile radius by 2022. There has been an addition to the area of over 100,000 young, educated and affluent residents over the past 10 years. The key is the strong, sta-ble and fast growing high-tech employment base. The center of the high-tech growth is ±2 miles west of Fulton Ranch along Price Road. Chan-dler’s Price Road Corridor is metro Phoenix’s leading-edge employment hub for skilled workforce with more than 25,000 employees. Companies located in the Corridor include Intel (±11,000 employees), Bank of Amer-ica, (±3,800 employees), Wells Fargo (± 4,500 employees), Ebay/Paypal (±1,750 employees), and Verizon Wireless (±2,400 employees).
FULTON RANCH TOWNE CENTERDEMOGRAPHICS
1 Mile Radius
3 Mile Radius
5 Mile Radius
2017 Estimated Population 10,597 82,017 187,1412022 Projected Population 12,441 91,577 207,147Growth 2010-2017 8.19% 2.69% 2.36%Growth 2017-2022 3.26% 2.23% 2.05%2017 Est. Average Household Income $148,776 $115,857 $99,2042017 Est. Average Housing Value $447,726 $378,395 $336,201
TRAFFIC COUNTArizona Avenue & Ocotillo Road intersection: ±49,700 VPD
Source: City of Chandler 2017
N
Source: ERSI 2017
Source: City of Chandler

N
IND
IAN
SCH
OO
L RO
AD
(±37,1
30 V
PD
)
N 38TH STREET
N 44TH STREET
*SOURCE: WWW.ARIZONAHIKINGADVENTURES.COM** SOURCE: NIELSEN
ARIZO
NA AVEN
UE
OCOTILLO ROAD
HAMILTON HIGH SCHOOL
QUEEN CREEK ROAD

STABILIZED CLASS-A POWER CENTERFulton Ranch Towne Center is an institutional quality, ±320,775 square foot power center. The Property features an attractive collection of tenants and a strong draw from its ±135,000 square foot shadow anchor, Lowe’s. Nation-al retailers include Ross Dress for Less, Petco, Dollar Tree, Staples, and Big5 Sporting Goods. Additional tenants servicing the Fulton Ranch community include Verizon Wireless, Subway, Aqua Tots Swim School, and West USA Realty.
ATTRACTIVE DESIGNFulton Ranch Towne Center offers an aesthetically pleasing design, through the use of brick, stone and stucco finishes combined with lush southwest landscaping. The developer, RED Development, has developed some of the most up-scale and pedestrian friendly shopping centers and mixed–use developments in the region. Fulton Ranch Towne Center is no exception. The Property offers multiple points of ingress and egress, including three curb cuts along Arizona Avenue and 2 along Ocotillo Road. Fulton Ranch Towne Center is situated on ±41 acres, of which ±18.9 is included in the portion that conveys. The Property offersample parking, consisting of ±1,837 stalls resulting in a parking ratio of 5.62 per 1,000 square feet.
PROPERTY OVERVIEW
ABOUT FULTON RANCH TOWNE CENTER
Ross Dress for Less Offering Memorandum8

AFFLUENT SURROUNDING DEMOGRAPHICS AND GROWING TRADE AREAThe City of Chandler’s reputation as one of the fast-est-growing high-technology manufacturing cities in the west has created an environment that is attracting skilled labor, high-end housing, strong average house-hold incomes, and rapid growth. Average Household income within three miles of Fulton Ranch Towne Center is $115,857, ±32.9% higher than metro Phoenix as a whole*. Similarly, the average housing value within three miles is ±36% higher than the overall average for metro Phoenix. The performance of the area’s retailers will receive a boost by the predicted 6% average annual growth in personal income (metro Phoenix) and 12.84% growth in 3-mile surrounding population over the next 10 years.Source: City of Chandler, *ESRI 2018
MAJOR TENANTS TENANT SIZE (±SF)Lowe’s 134,500
Ross 30,187Staples 20,390Petco 15,257Dollar Tree 10,414Big 5 9,592
Ross Dress for Less Offering Memorandum 9

Ross Dress for Less Offering Memorandum10
Ross Dress for Less Offering Memorandum 10
LOCATION
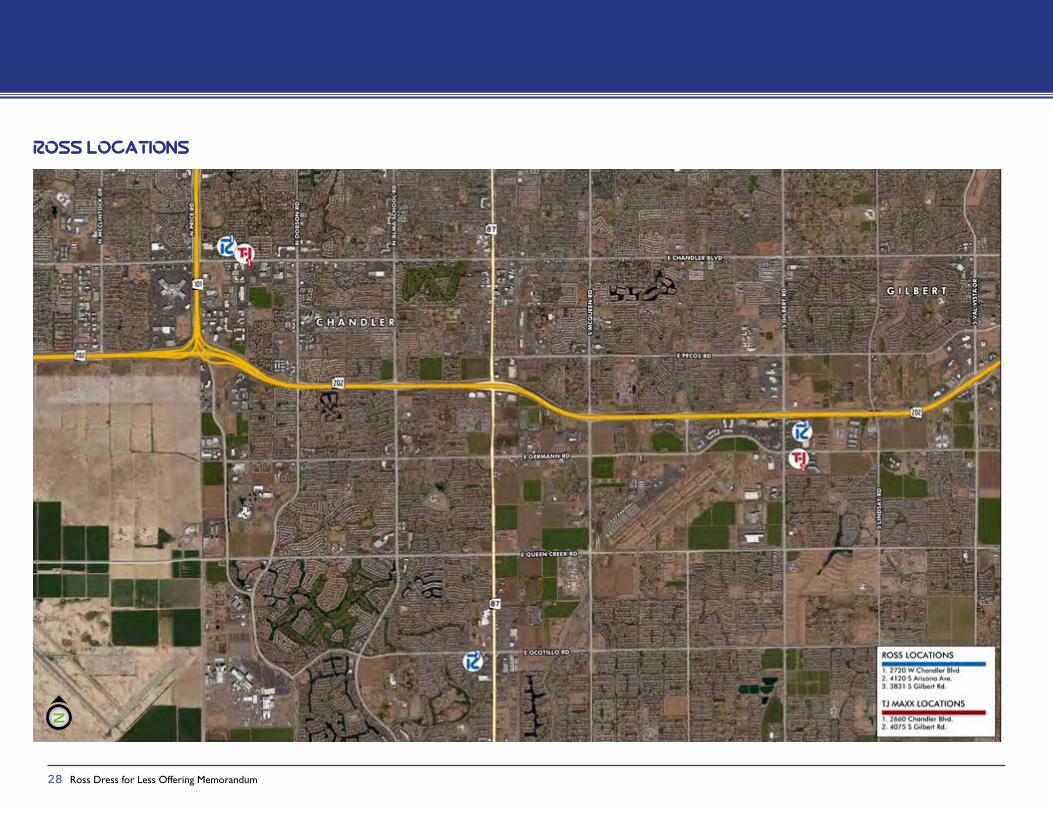
LOCATIONRoss Dress for Less is located at 4120 South Arizona Avenue, the southwest corner of Arizona Avenue and Ocotillo Road in the city of Chandler, Arizona.
PARCEL DESCRIPTION
PARCEL # ± SIZE (Acres) DESCRIPTION303-54-938 0.78 Building B
ZONING
The shopping center is zoned PAD, by the city of Chandler, AZ.
PARKING
Fulton Ranch Towne Center contains approximately 1,837 parking stalls resulting in a parking ratio of 5.62 per 1,000 square feet of improvements.
STREET FRONTAGE
The Fulton Ranch Towne Center site benefits from approximately 1,300 feet of frontage along Ocotillo Road and 1,630 feet of frontage along Arizona Avenue.
ACCESS
Fulton Ranch Towne Center has five (5) points of access, including three (3) along Arizona Avenue and two (2) along Ocotillo Road.
PROPERTY OVERVIEW
SITE
NOT TO SCALE

Ross Dress for Less Offering Memorandum 11
PROPERTY OVERVIEW
LOCATION MAP
QUEEN CREEK RD.
ALM
A S
CH
OO
L RD
.
QUEEN CRN CREEEEK RD.
ALM
A S
CH
AL
OO
L RD
.RD
.
OCOTILLO RD.
10
10
17
NOT TO SCALE
SUBJECT

Ross Dress for Less Offering Memorandum12
SITE PLAN
NOT TO SCALEN
BUILDING I
G
F
M
E2E1
CD
B
OP-2
OP-1
OP-3
OP-9
K
OP-5
A-103
A-102A-101
L-03
L-05
A-111
H-1
H-15
J-102J-104J-106
H-14
H-10H-11H-12
H-9
H-8bH-8a
H-2H-3a
H-3bH-4
H-5H-6
H-7
PROPERTY OVERVIEW
ARIZONA AVENUE
OCOTILLO ROAD
EGG ‘N’ JOE
OP-4OP-6
M

Ross Dress for Less Offering Memorandum 13
PROPERTY OVERVIEW
AERIAL
ARIZON
A AVENU
E
OCOTILLO ROAD
N

ARIZONA AVENUE
OCOTILLO ROAD
HAMILTON HIGH SCHOOL
QUEEN CREEK ROADCHANDLERMUNICIPAL
AIRPORT
GILBERT
Wells FargoCorporate

TEMPEAHWATUKEE
HAMILTON HIGH SCHOOL
ARIZONA AVENUE
OCOTILLO ROAD
Wells FargoCorporate
CHANDLER FASHION CENTER CHANDLER MEDICAL
CENTER
PHOENIX

WELLS FARGO CORPORATE
HAMILTON HIGH SCHOOL
ARIZONA AVENUEO
COTILLO
ROA
D
OCOTILLO GOLF COURSE


Ross Dress for Less Offering Memorandum18
LEASE ABSTRACT
Tenant ROSS DRESS FOR LESS, INC., a Virginia CorporationLease Type NNN±Rentable Square Feet 30,187Original Lease Term 10 yearsLease Date 9/5/2006Commencement Date 10/11/2007Original Expiration Date 1/31/2018Current Expiration Date 1/31/2023Current Annual Base Rent $392,431.00Rent Per Square Foot $13.00Rent Schedule (options) Years Annual Rent Rent PSF
2/1/-18 - 1/31/23 $392,431.00 $13.00 2/1/-23 - 1/31/28 $407,524.50 $13.50 2/1/-28 - 1/31/33 $422,618.00 $14.00
Options Remaining Two, 5-year Options with 6-months written notice.
Co-Tenancy Section 1.7.2 & Section 6.2.3: Lowe’s occupying 134,500 sf, plus 31,000 sf of Garden Area, or reasonably acceptable replacement Tenant operating no less than the Required Leasable Floor Area. Fifty percent (50%) of [The Shopping Center’s] Leasable Floor Area, which shall include two (2) Anchor Tenants (100 stores nationally), each operating not less than 15,000 sf.
CAM Admin Fee 10%Substitute Rent Payment of Reimbursements plus the lesser of: (a)
Minimum Rent, or (b) 2% OF Gross Sales. After 18 months, Tenant shall either Terminate or resume paying full rent. After an additional 12 months, Tenant can go back to substitute Rent.
Landlord’s Obligations Landlord shall maintain, not subject reimbursement, the foundation, slab, roof, exterior walls, exterior doors, storefronts, structural portions of the store, sprinkler system, concealed wiring and plumbing, pipes, conduits, and utility systems, and repairs and replacement to the HVAC system
Tenant Reimbursements Tenant shall pay its prorata share of Common Area Maintenance charges. In the event the charges result in an increase of more than 5% over the previous year, Landlord must provide justification for such charges.
Property Taxes and Insurance
Tenant has its own tax parcel and is billed by the Seller for payment.Common area maintenance costs and insurance are paid on a pro-rata basis and are prepared/billed by the Owner of the shopping center which is Whitestone REIT.
Tenant Obligations Tenant shall maintain the plate glass and interior of the Store, maintain and service the HVAC system, however repairs beyond routine maintenance of the HVAC shall be the Landlord’s responsibility.
(Exercised)
LEASE SUMMARY
You are solely responsible for independently verifying the information in this Memorandum. ANY RELIANCE ON IT IS SOLELY AT YOUR OWN RISK.

Ross Dress for Less Offering Memorandum 19
LEASE SUMMARY
• S&P 500, Fortune 500 and Nasdaq 100 company with fiscal 2017 revenues of $14.1 billion
• Ross Dress for Less® is the largest off-price apparel and home fashion chain in the U.S. with 1,409 stores in 37 states, the Dis-trict of Columbia and Guam
• Also operates 213 dd’s DISCOUNTS® in 16 states• Consistent long-term growth in both sales and EPS• Fortune 500 Statistics:
• Ranked #219 in 2016, up from #237 in 2015 and #269 in 2014• In 2016, ranked #6 out of 500 companies for total return to stockholders on a 10-year basis (±26%)• Ranked #17 out of 500 companies on 10-year annual EPS growth rate (~21%)
3
Ross Stores, Inc. Overview S&P 500, Fortune 500 and Nasdaq
100 company with fiscal 2017 revenues of $14.1 billion
Ross Dress for Less® is the largest off-price apparel and home fashion chain in the U.S. with 1,432 stores in 38 states, the District of Columbia, and Guam
Also operates 219 dd’s DISCOUNTS® in 17 states
Consistent long-term growth in both sales and EPS
Fortune 500 Statistics Ranked #219 in 2016, up from #237 in
2015 and #269 in 2014 In 2016, ranked #6 out of 500
companies for total return to stockholders on a 10-year basis (~26%)
Ranked #17 out of 500 companies on 10-year annual EPS growth rate (~21%)
* 2017 was a 53-week year; all other years were 52-week years. EPS adjusted to reflect two-for-one stock split effective June 2015.
EPS Sales
May 2018
ROSS STORES, INC. OVERVIEW
• FY 2017 sales increased 10% to $14.1 billion, with compara-ble store sales up 4% over fiscal 2016• Childrens was the best performing category• Midwest was the strongest region
• Added 89 net new locations in FY 2017• Ended the year with 1,409 Ross and 213 dd’s DISCOUNTS stores
• FY 2017 operating margin increased 50 basis points to a record 14.5%
• Earnings per share for the 53-week fiscal 2017 year grew to $3.55, up from $2.83 in the prior 52-week year• Last year’s 53rd week added approximately $.10 to EPS
• First quarter 2018 sales increased 9% to $3.6 billion, with comparable store sales up 3% over fiscal 2017
• Geographic trends were broad-based, when normalized for weather
• Added 29 net new locations in Q1 2018• Operating margin for the period was down slightly from the
prior year to 15.1% as an improvement in merchandise gross margin and favorable timing of packaway-related expenses were offset by higher freight costs and wage-related invest-ments
• Earnings per share for the first quarter of 2018 was $1.11, up from $.82 in the prior year and includes a $.17 per share benefit from recently enacted tax legislation and a $.02 per share benefit from the favorable timing of packaway-related costs
FISCAL 2017 RESULTS
FIRST QUARTER 2018 RESULTS
You are solely responsible for independently verifying the information in this Memorandum. ANY RELIANCE ON IT IS SOLELY AT YOUR OWN RISK.
Source: Rossstores.com

Ross Dress for Less Offering Memorandum20
MARKET OVERVIEW
Source: US Bureau of the Census
7M
6M
5M
4M
3M
2M
1M
0
1950
METROPOLITAN PHOENIX POPULATION
1960 1970 1980 1990 2000 2010 2020EST
2030EST
EXECUTIVE SUMMARY
Phoenix is the capital of Arizona as well as the state’s financial center. Its strategic location provides easy access to major markets and the entire western U.S. Seventy-five percent of Arizona’s economy is represented by metropolitan Phoenix. With opportunities for high-wage employment and a favorable climate, Arizona remains a national leader in population growth. The Phoenix metro area maintains a reputation for business-friendly policies. An entrepreneurial spirit backed by numerous public-private partnerships have established the Valley as a preferred location for tech-centric companies and other start-ups.
The Phoenix area benefits from robust digital and telecommunications infrastructure. Extensive highway infrastructure connects metropolitan Phoenix communities and ties them to the interstate system for easy access into and out of the area. Employment growth rates for the Valley continue to improve and are projected to grow at a pace twice that of national rates. Further bolstering prospects for a bright economic future, the cost of living and cost of doing business are low. This provides a compelling value proposition for people and businesses alike.
METROPOLITAN PHOENIX

Ross Dress for Less Offering Memorandum 21
CORPORATE HEADQUARTERS
AEROSPACE & AVIATION
E-COMMERCE/LOGISTIC CENTERS
FINANCIAL SERVICES
HEALTH CARE/BIOTECH
HIGH-TECH MANUFACTURING
DEMOGRAPHICS & ECONOMY
Metropolitan Phoenix has experienced significant population growth over the last several decades, growing from 375,000 residents in 1950 to more than 4.7 million people in 2017. It is one of the fastest growing major metropolitan areas, gaining nearly 400,000 residents from 2010 to 2015 and more than 1.3 million since 2000. For the past 21 years, population growth in the Valley has exceeded the national average. Metropolitan Phoenix is one of only 10 U.S. markets expected to see most of the nation’s growth over the next 40 years. In addition to being one of the fastest-growing metro areas, greater Phoenix also has one of the youngest populations in the nation with a median age of 34.7 years. This is almost three years younger than the national average. This young workforce offers long term stability for Phoenix employers.
Metropolitan Phoenix is home to two thirds of the state’s residents and accounts for the majority of higher paying jobs. The employment outlook in metropolitan Phoenix is bright with the Valley recording the lowest unemployment rate in Arizona at 5.4% for June 2015. Looking ahead, employment is forecasted to grow at an average annual rate of 3.3% by 2019; nearly triple the national rate of 1.3%. The strong hiring environment and labor force expansion will have positive effects on the housing market resulting in an increase in household formation and median household income growth. In 2014, the per capita personal income for metropolitan Phoenix was $40,395, and this is projected to be $48,329 by 2019.
Personal income grew by 4.4% in 2014, and is forecasted to be 6.5% by 2019. Metropolitan Phoenix’s labor force is projected to increase by 23% over the next decade compared to 14% nationally.
MAJOR EMPLOYERS IN METROPOLITAN PHOENIX
MARKET OVERVIEW
Source: CBRE Research

Ross Dress for Less Offering Memorandum22
1980 1987 1990 1994 1998
America West Arena opened in Phoenix
1992
Terminal 4 opened at Sky Harbor
International Airport
Chase Field opened in Phoenix
Phoenix-Mesa Gateway Airport opened
The population of metropolitan Phoenix
was 2.2 million
The population of metropolitan Phoenix
was 1.4 million
Mayo Hospital inScottsdale opened
1999
Tempe Town Lake completed
MAJOR MILESTONES IN PHOENIX
MARKET OVERVIEW
2000
The population of metropolitan Phoenix was 3 million
Kierland Commons opened in Scottsdale

Ross Dress for Less Offering Memorandum 23
2000 20152005 2006 2008 2010 2014
Metro Light Rail opened in Phoenix
University of Phoenix Stadium opened in Glendale
2003
Jobing.com Arena was built in Glendale
CityScape was completed in Phoenix
The population of metropolitan Phoenix was 3 million
The population of metropolitan Phoenix
was 4 million
The population of metropolitan Phoenix
estimated at 4.5 million
The Loop 303 was connected to the
I-10 freeway
Phoenix Biomedical Campus opened with TGen and IGC
Kierland Commons opened in Scottsdale
The Loop 202 was completed in the
east valley
202
Marina Heightsopens
Freeport-McMoran Center was completed in Phoenix
2017
Phoenix Rising Soccer Complex opens

Ross Dress for Less Offering Memorandum24
MARKET OVERVIEW
Source: University of Arizona, Economic & Business Reserach Center
HOUSING
The Valley’s housing market continues to strengthen as population growth gains momentum and economic fundamentals improve. Since the recession, home sales and prices have steadily improved. Despite a rise in single-family and multifamily deliveries and permitting activity, demand continues to outpace new supply, lending to a supply-constrained new home market. These positive trends are boosting the local economy and help explain why Phoenix is projected to be one of the top housing markets in 2017.
The metro’s single-family market continues to recover following the Great Recession.Foreclosureactivityhassignificantlydecreasedandnewconstructionremains low compared to historical standards, putting upward pressure on housing values. The median home price for an existing single-family home is $230,000, up 2.2% during the 12 month period ending in May 2017. Still, home prices remain
approximately 10.4% below the peak achieved in 2006. In May 2017, resale closings were up 11.6% year-to-date, compared to new home sales, which recorded a 27.8% increase. The median price of a new home remained fairly steady over the same period last year at $310,324.
Asignificantamountofactivityis occurring in the Phoenix multifamily market. Strong demand for urban housing, supported by population growth and a relatively low homeownership rate of 62.7%, has captured
METROPOLITAN PHOENIX CONT.
2016 TOTAL BOARDINGS
1.4M26
1,200
-
10,000
20,000
30,000
40,000
50,000
60,000
70,000
Metropolitan Phoenix Single & Multifamily Permits
Single-Family Multifamily
HOUSING
METROPOLITAN PHOENIX SINGLE-FAMILY & MULTIFAMILY PERMITS
permitting activity rose 68.6% to 9,748 units in 2016, but is forecasted to slow in 2017.25 Currently, more than 11,000 units are under construction with approximately 5,650 units scheduled to deliver in 2017. New, higher-priced units and healthy demand have put upward pressure on rents. In the second quarter of 2017, rents increased 4.2% annually to $983 per month.26
Q2 2017VACANCY RATE
5.2%
MULTIFAMILYAPARTMENTS
Q2 2017 AVERAGEMONTHLY RENT
$983
70,000
60,000
50,000
40,000
30,000
20,000
10,000
0
1980
1985
1990
1995
2000
2005
2010
2015
*201
7
*201
8
Single-Family Permits
Multifamily Permits
Source: Real Data 2015
*ForecastSource: University of Arizona, Economic & Business Research Center
17
SINGLE-FAMILY & MULTI FAMILY PERMITS
-
10,000
20,000
30,000
40,000
50,000
60,000
70,000
Metropolitan Phoenix Single & Multifamily Permits
Single-Family Multifamily
HOUSING
METROPOLITAN PHOENIX SINGLE-FAMILY & MULTIFAMILY PERMITS
permitting activity rose 68.6% to 9,748 units in 2016, but is forecasted to slow in 2017.25 Currently, more than 11,000 units are under construction with approximately 5,650 units scheduled to deliver in 2017. New, higher-priced units and healthy demand have put upward pressure on rents. In the second quarter of 2017, rents increased 4.2% annually to $983 per month.26
Q2 2017VACANCY RATE
5.2%
MULTIFAMILYAPARTMENTS
Q2 2017 AVERAGEMONTHLY RENT
$983
70,000
60,000
50,000
40,000
30,000
20,000
10,000
0
1980
1985
1990
1995
2000
2005
2010
2015
*201
7
*201
8
Single-Family Permits
Multifamily Permits
Source: Real Data 2015
*ForecastSource: University of Arizona, Economic & Business Research Center
17

Ross Dress for Less Offering Memorandum 25
SINGLE-FAMILY & MULTI FAMILY PERMITS
PHOENIX METRO RETAIL MARKETPhoenix retail metrics remained stable to kick off 2018, despite minor setbacks in the form of big-box move outs. Gross leasing activity continued to be strong and is on track to match recent annual levels. Though the marketwide vacancy rate ticked slightly upwards on a quarterly basis, the outlook on Phoenix retail remains optimistic.
It is important to note that although retail metrics were not all positive in Q1 2018, many factors are still fueling demand for retail space in the Valley. Two of the most significant demand-side drivers for retail space include population and employmentgrowth—both of which have been accelerating in recent years. In fact, Phoenix posted
1.8% and 3.2% growth in Q1 2018, respectively.
Additionally, a growing new housing market is boosting retail fundamentals and allowing Phoenix to remain relatively unaffected from a changing retail industry. In fact, housing starts increased roughly 11% in Q1 2018—marking the seventh straight quarter of an increase in annual housing starts in Metro Phoenix.2 Retail growth continues to occur in areas experiencing the most housing growth, such as the Southeast and West Valley.
VACANCY
8.4%RENTAL RATE
$17.35 Per Sq. Ft.NET ABSORPTION
(219,498) Sq. Ft.UNDER CONSTRUCTION
990,662 Sq. Ft.DELIVERIES
149,394 Sq. Ft.
Source: CBRE Research, Q4 2015*Directional arrows based on change from the previous quarter. Data reflects market totals.

Ross Dress for Less Offering Memorandum26
CHANDLER RETAIL MARKET OVERVIEW
METRO PHOENIX RETAIL CONSTRUCTION ACTIVITY
Fulton Ranch Towne Center is located in the Mesa/Chandler/Gilbert Submarket
(the “Submarket”) as defined by CBRE. The Submarket is the largest submarket
in metro Phoenix consisting of 275 properties (over 30,000 square feet) and over
38 million square feet, close to doubling the size of the 2nd largest submarket in
the metro area. The Submarket is bordered by Tempe/Ahwatukee and the 101
Freeway to the west, Apache Junction to the east, North Scottsdale to the north and
Pinal County to the south.
The Submarket is one of the most diverse submarkets in Metro Phoenix, consisting
of many older and some obsolete shopping centers located within the northern
boundary in Mesa and new shopping centers surrounded by growing and emerging
neighborhoods in Chandler and Gilbert. The Price Road Corridor and surrounding
area is highly desirable to residents who want to live near the Corridor’s cluster
of high-tech jobs, creating a long-term demand for nearby retail space and an
increase in residential density. The population within 3-miles of Fulton Ranch Towne
Center is expected to grow by 3% Over the next 5 years.
Over the past 10 years, the Submarket has grown from a base of more than 27
million square feet in 2004 to over 38 million square feet.
Located in the southeast portion of metropolitan Phoenix, Chandler is a city of over
250,000 residents. It is bordered to the north and west by Tempe, to the north by
Mesa, to the west by Phoenix, to the south by Gila River Indian Community, and
to the east by Gilbert. As the southernmost city in Maricopa County, Chandler
is positioned to be in the center of a new mega-region, referred to as the “Sun
Corridor.” The city is strategically located and easily accessible by several major
freeways, including U.S. 60 Superstition Freeway, Loop 101 Price Freeway and Loop
202 Freeway.
SQU
ARE
FEET
MARKET OVERVIEW
0
3,000,000
6,000,000
9,000,000
12,000,000
2006 2007 2008 2009 2010 2011 2012 2013 2014 2015 2016 2017 Q1 2018
Metro Phoenix Retail Construction Activity
COMPLETIONSSQ FT
U/CSQ FT
0
3,000,000
6,000,000
9,000,000
12,000,000
2006 2007 2008 2009 2010 2011 2012 2013 2014 2015 2016 2017 Q1 2018
Metro Phoenix Retail Construction Activity
COMPLETIONSSQ FT
U/CSQ FT
Source: CBRE Research

Ross Dress for Less Offering Memorandum 27
CITY OF CHANDLER OVERVIEW
Chandler is one of the fastest growing high-technology manufacturing cities in the west, which has
helped it earn the nickname “The Silicon Desert.” The increasing presence of quality employers has
added to the oasis of opportunity. Chandler’s pro-business character makes it one of the most desirable
cities to live and do business. The work force is well-educated and technologically skilled. More than
75% of the 30,000 manufacturing sector workers are employed in high technology fields, while the
national average is 15%. Companies such as Intel, Motorola and Microchip all have manufacturing
plants in Chandler. While it has an international reputation as a premier location for high-technology,
including semiconductor and advanced manufacturing, it is also home to a variety of other thriving
industries such as aerospace, biosciences and financial services.
Since its founding in 1912, Chandler was planned to be a welcoming destination for leading-edge
companies, innovative thinkers and lifestyle versatility. An enviable quality of life is enhanced by friendly
neighborhoods, great education, and outstanding retail, dining and entertainment experiences. Year
after year, large and small companies, along with thousands of well-educated residents (nearly 70% of
adult residents have attended college), are attracted to this vibrant community. The quality of life for
which Chandler is so
popular is anchored
by a proven work
force, a diversified mix
of industries, quality
retail establishments
and an ever-expanded
infrastructure.
CITY OF CHANDLER TOP EMPLOYERS
Intel Corp. 10,880
Wells Fargo 3,540
Bank of America 3,460
Paypal Inc 1,750
Verizon Wireless 1,460
Dignity Health 1,410
Microchip 1,280
Orbital ATK 1,200
Freescale Semiconductor Inc 1,160
Walmart 1,070
Chandler Unified School District 970
Avnet 910
Edmc Ohe 820
City of Chandler 770
CHANDLER DEMOGRAPHICS
2017 Estimated Population 267,322
2022 Estimated Population 291,247
Growth 2010-2017 1.72%
Growth 2017-2022 1.73%
2017 Est. Average Household Income $93,985
2017 Est. Average Housing Value $270,523
2017 Estimated Median Age 35.2
MARKET OVERVIEW
Source: CBRE Research
Source: ERSI 2018
Ross Dress for Less Offering Memorandum28
ROSS LOCATIONS
N

Ross Dress for Less Offering Memorandum 29
AFFILIATED BUSINESS DISCLOSURECBRE, Inc. operates within a global family of companies with many subsidiaries and related entities (each an “Af-filiate”) engaging in a broad range of commercial real estate businesses including, but not limited to, brokerage services, property and facilities management, valuation, investment fund management and development. At times different Affiliates, including CBRE Global Investors, Inc. or Trammell Crow Company, may have or represent clients who have competing interests in the same transaction. For example, Affiliates or their clients may have or express an interest in the property described in thisMemorandum (the “Property”), and may be the successful bidder for the Property. Your receipt of this Memorandum constitutes your acknowledgment of that possibility and your agreement that neither CBRE, Inc. nor any Affiliate has an obligation to disclose to you such Affiliates’ interest or involvement in the sale or purchase of the Property. In all instances, however, CBRE, Inc. and its Affiliates will act in the best interest of their respective client(s), at arms’ length, not in concert, or in a manner detrimental to any third party. CBRE, Inc. and its Affiliates will conduct their respective businesses in a manner consistent with the law and all fiduciary duties owed to their respective client(s).CONFIDENTIALITY AGREEMENTYour receipt of this Memorandum constitutes your acknowledgment that (i) it is a confidential Memorandum solely for your limited use and benefit in determining whether you desire to express further interest in the acquisition of the Property, (ii) you will hold it in the strictest confidence, (iii) you will not disclose it or its contents to any third party without the prior written authorization of the owner of the Property (“Owner”) or CBRE, Inc., and (iv) you will not use any part of this Memorandum in any manner detrimental to the Owner or CBRE, Inc. If after reviewing this Memorandum, you have no further interest in purchasing the Property, kindly return it to CBRE, Inc. This Memo-randum contains select information pertaining to the Property and the Owner, and does not purport to be all-in-clusive or contain all or part of the information which prospective investors may require to evaluate a purchase of the Property. The information contained in this Memorandum has been obtained from sources believed to be reliable, but has not been verified for accuracy, completeness, or fitness for any particular purpose. All information is presented “as is” without representation or warranty of any kind. Such information includes estimates based on forward-looking assumptions relating to the general economy, market conditions, competition and other factors which are subject to uncertainty and may not represent the current or future performance of the Property. All refer-ences to acreages, square footages, and other measurements are approximations. This Memorandum describes certain documents, including leases and other materials, in summary form. These summaries may not be complete nor accurate descriptions of the full agreements referenced.Additional information and an opportunity to inspect the Property may be made available to qualified prospective purchasers. You are advised to independently verify the accuracy and completeness of all summaries and infor-mation contained herein, to consult with independent legal and financial advisors, and carefully investigate the economics of this transaction and Property’s suitability for your needs. ANY RELIANCE ON THE CONTENT OF THIS MEMORANDUM IS SOLELY AT YOUR OWN RISK.The Owner expressly reserves the right, at its sole discretion, to reject any or all expressions of interest or offers to purchase the Property, and/or to terminate discussions at any time with or without notice to you. All offers, coun-teroffers, and negotiations shall benon-binding and neither CBRE, Inc. nor the Owner shall have any legal commitment or obligation except as set forth in a fully executed, definitive purchase and sale agreement delivered by the Owner.
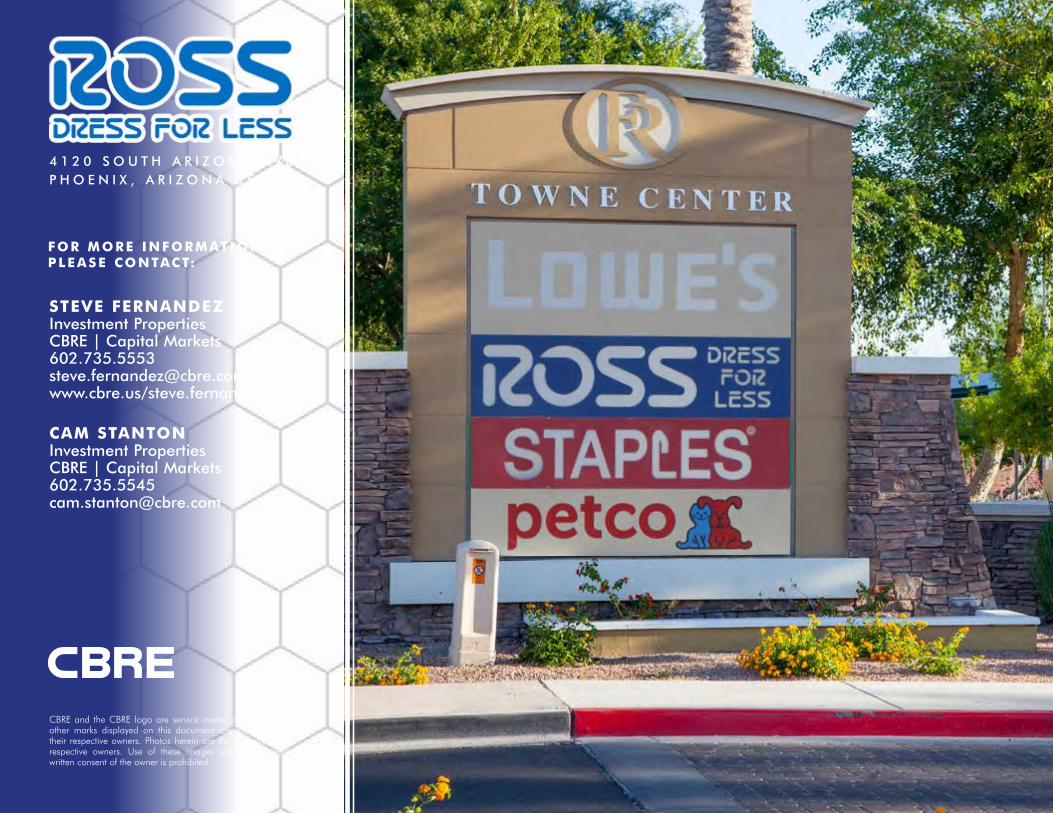
4 1 2 0 S O U T H A R I Z O N A A V EP H O E N I X , A R I Z O N A 8 5 2 4 8
CBRE and the CBRE logo are service marks of CBRE, Inc. All other marks displayed on this document are the property of their respective owners. Photos herein are the property of their respective owners. Use of these images without the express written consent of the owner is prohibited.
FOR MORE INFORMATION PLEASE CONTACT:
STEVE FERNANDEZ Investment Properties CBRE | Capital Markets602.735.5553 [email protected]/steve.fernandez
CAM STANTONInvestment PropertiesCBRE | Capital Markets602.735.5545 [email protected]