Embed Size (px)
Citation preview
1
Single-Pilot Workload Managementin Entry-Level Jets
Barbara K. Burian, Ph.D1
Shawn Pruchnicki, M.Sc.2
Jason Rogers, Ph.D.3
Bonny Christopher, M.A.2
Kevin Williams, Ph.D.3
Evan Silverman, B.S.2
Gena Drechsler, B.S.3
Andy Mead, Ph.D.3
Carla Hackworth, Ph.D.3
Barry Runnels, B.S.3
1 NASA Ames Research Center2 San Jose State University
3 FAA Flight Deck Human Factors Research Laboratory
June 24, 2013
This work was sponsored by FAA AFS-800, Flight Standards Service,General Aviation and Commercial Division, and funded through
FAA ANG-C1, Human Factors DivisionStudy: 09-AJP61FGI-0048

2
Executive Summary
Researchers from the NASA Ames Flight Cognition Lab and the FAA’s Flight Deck
Human Factors Research Laboratory at the Civil Aerospace Medical Institute (CAMI) examined
task and workload management by single pilots in Very Light Jets (VLJs), also called Entry-
Level Jets (ELJs). Fourteen certificated Cessna Citation Mustang (C510-S) pilots flew an
experimental flight with two legs involving high workload management under Instrument Flight
Rules (IFR) in a Cessna Citation Mustang ELJ level 5 flight training device1 at CAMI. Eight of
the pilots were Mustang owner-operators, and the other six flew the Citation Mustang as part of
their jobs as professional pilots. In addition to the Cessna Citation Mustang simulator, data
collection included the use of a non-invasive eye tracker (mounted to the glare shield),
instantaneous self-assessment of perceived workload, NASA Task Load Index (TLX) workload
measures, researcher observations, final debriefing interviews, and three questionnaires: Cockpit
Set-up Preferences, Demographics, and Automation Experiences and Perceptions.
This exploratory study of VLJ/ELJ single-pilot workload management and automation
use was conducted to answer the following questions:
How do single pilots in small jets manage their workload?
Where do they have problems managing their workload and what might be some
reasons why?
Are there any workload management approaches that might be characterized as “best
practices” and why?
How do automation and advanced technologies help or hinder single jet pilots in their
workload management and what might be some reasons why?
1 Although technically a flight training device, for simplification it will be referred to as a “simulator” in this report.

3
This study was also intended to generate baseline data to be used relative to future NextGen-
oriented studies.
Because of the complex nature of the study and the substantial amount of data analysis
required, overall analysis of the data was separated into phases. The analyses described in this
report pertain to the management of workload, completion of tasks, and automation use by single
pilots flying ELJs during four scripted high workload events occurring during climb out and the
en route phase of flight. The four high workload events analyzed were:
1. setting up the automation to intercept the 208o Broadway (BWZ) radial following the
completion of the departure procedure out of Teterboro, NJ (KTEB) in leg one,
2. programming a reroute while at cruise and meeting a waypoint crossing restriction on
the initial descent from cruise in leg one,
3. the completion of an expedited descent to accommodate another aircraft with an
emergency in leg two, and
4. descent to meet a crossing restriction prior to a waypoint and preparation for the
approach into Hot Springs, VA (KHSP) while facilitating communication from a lost
pilot who was flying too low for air traffic controllers to hear.
Approximately two-thirds of the major tasks in the four events were accomplished by the
participants with no difficulties. Participants who were successful or encountered no problems in
accomplishing a task tended to rate their performance much higher than those who were
unsuccessful or did have problems, often by a substantial margin. We found no differences in
performance due to pilot age or pilot type (owner-operator or professional pilot). Furthermore,
we found a significant effect on task performance success related to hours of experience only for
the first event. Some type of error using the G1000 avionics was at the root of the problem for

4
most participants who had difficulty accomplishing one or more of the tasks. All participants
committed a variety of errors during all four high workload events (e.g., readback error, airspeed
violation), but most were not directly related to overall task success. Implications of the findings
are discussed, and techniques demonstrated by our participants that we have characterized as
“best practices” have been identified. Recommended strategies for automation use and
countermeasures to task overload and workload breakdowns have also been provided.

5
Acknowledgments
This work was sponsored by the Federal Aviation Administration: AFS-800, Flight
Standards Service – General Aviation and Commercial Division, and funded through the Federal
Aviation Administration: ANG-C1, Human Factors Division. Early work on the study and
scenario design was supported by the Integrated Intelligent Flight Deck Project of NASA’s
Aviation Safety Program.
As part of this study, we relied on the experience of two air traffic control Subject Matter
Experts (SMEs), Art Gilman and Greg Elwood. In addition, we sought guidance during study
design and data analysis from our Garmin G1000/Cessna 510 Citation Mustang aircraft pilot
SME, Dave Fry. Their expertise contributed greatly to this project.
We thank Jerry Ball for programming the scenarios developed by NASA into the Cessna
510 Citation Mustang simulator, assisting with data collection, and trouble-shooting during the
experiment. Our appreciation also goes to Kali Holcomb for her support with data collection and
working behind the scenes during the experiment. Thank you is also due to Captain Randy
Phillips (ret.) and Dr. Lynne Martin, who were centrally involved in the development of earlier
versions of the experimental flight scenarios and associated task analyses. We are also grateful
for the help extended by Dr. Durand Begault for his assistance in conducting the voice analyses
for this study.
Finally, we extend our sincere appreciation to the Cessna Mustang pilots who completed
questionnaires and who served as participants in this study. Their desire to further the cause of
aviation safety, their willingness to participate, and the insights they so generously shared were
essential to the success of the study. We are very grateful.

6
Table of Contents
Executive Summary........................................................................................................................ 2Acknowledgements......................................................................................................................... 5Introduction................................................................................................................................... 11
Single Jet Pilot Workload ......................................................................................................... 12Approaches to Measuring Workload ........................................................................................ 14Automation Use ........................................................................................................................ 15The Current Report ................................................................................................................... 19
Methods......................................................................................................................................... 20Participants................................................................................................................................ 20Materials ................................................................................................................................... 20
Demographic questionnaire .................................................................................................. 20Advanced avionics and automation questionnaire................................................................ 21Citation Mustang and G1000 Cockpit Set-up Preferences questionnaire............................. 21Flight bag materials............................................................................................................... 21Flight briefing materials........................................................................................................ 22Familiarization and experimental flight scenarios ................................................................ 23Background chatter ............................................................................................................... 29Study scripts.......................................................................................................................... 29Cessna Citation 510 Mustang flight simulator...................................................................... 29Eye tracker ............................................................................................................................ 32Instantaneous Self-Assessment (ISA)................................................................................... 32NASA Task Load Index........................................................................................................ 33Data Acquisition and Storage ............................................................................................... 34
Audio recordings............................................................................................................... 34Video recordings............................................................................................................... 35Simulator data stream ....................................................................................................... 35
Experimenter’s station .......................................................................................................... 36Pilot headsets ........................................................................................................................ 36Debriefing interview ............................................................................................................. 37Task analyses ........................................................................................................................ 37Concurrent task timelines ..................................................................................................... 38
Design ....................................................................................................................................... 39Procedure .................................................................................................................................. 39
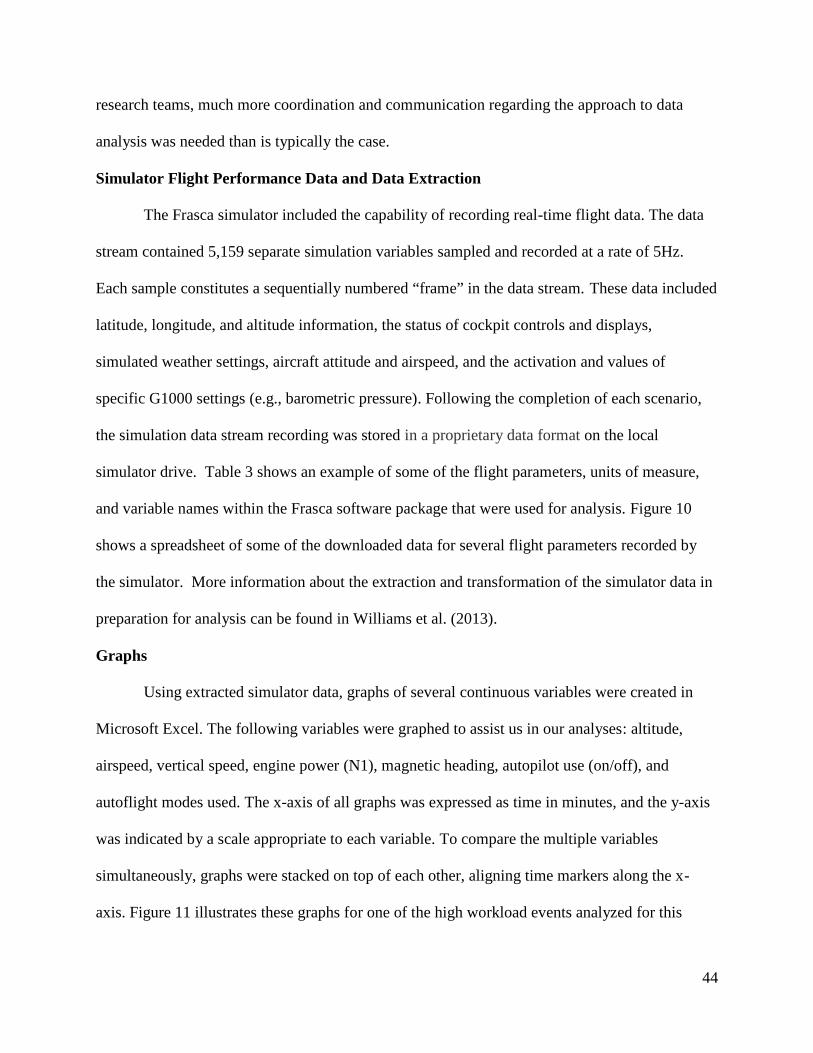
Data Management and Preparation............................................................................................... 43Simulator Flight Performance Data and Data Extraction ......................................................... 44Graphs ....................................................................................................................................... 44Google Earth Plots .................................................................................................................... 48Flight Communication Transcription........................................................................................ 49Voice Analysis .......................................................................................................................... 51Video Data ................................................................................................................................ 51
Results........................................................................................................................................... 53Participant Demographics......................................................................................................... 53Autopilot Use during the Experimental Flight.......................................................................... 56Analysis of Workload and Task Management of Four En Route Events ................................. 57

7
Interception of the Broadway (BWZ) radial ......................................................................... 58Unscripted flight director failure ...................................................................................... 61Overall flight performance during the event..................................................................... 63Automation use, flight path management, and the BWZ radial intercept ........................ 67Aircraft and FAR limitations ............................................................................................ 71Checklist and chart usage.................................................................................................. 72Pilot demeanor and general workload management ......................................................... 72Pilot background and experience ...................................................................................... 75
Reroute and descent to meet a crossing restriction at a waypoint ........................................ 78Overall flight performance during the event..................................................................... 80Automation use, flight path management, and the reroute with a crossing restriction..... 80Aircraft and FAR limitations ............................................................................................ 87Checklist and chart usage.................................................................................................. 87Pilot behavior and general workload management ........................................................... 88
Expedited descent ................................................................................................................. 92Automation use, flight path management, and the expedited descent .............................. 92Pilot and aircraft performance .......................................................................................... 97Aircraft and FAR limitations ............................................................................................ 97Checklist and chart usage.................................................................................................. 98Pilot behavior and general workload management ........................................................... 98
Communication assistance for a lost pilot .......................................................................... 100Overall flight performance during the event................................................................... 101Automation use, flight path management, and accomplishment of Event 4 tasks ......... 104Aircraft and FAR limitations .......................................................................................... 110Checklist and chart usage and PFD and MFD Displays ................................................. 110Pilot demeanor and general workload management ....................................................... 112Pilot background and experience .................................................................................... 114
Voice Analyses across the Four High Workload Events ........................................................ 119Overall Performance across the Four High Workload Events................................................ 124
Discussion ................................................................................................................................... 127Participants.............................................................................................................................. 129Workload Management........................................................................................................... 130Automation Use ...................................................................................................................... 133Successful Task Completion and Errors ................................................................................. 137Study Limitations and Recommended Future Studies............................................................ 142Recommendations for Workload Management and Automation Use .................................... 145
Conclusion .................................................................................................................................. 147References................................................................................................................................... 149Acronyms and Abbreviations ..................................................................................................... 160
8
List of Figures
Figure 1. Familiarization Scenario Route of Flight ..................................................................... 24Figure 2. Experimental Leg 1 Scenario Route of Flight .............................................................. 27Figure 3. Experimental Leg 2 Scenario Route of Flight .............................................................. 28Figure 4. Excerpt of the Familiarization Scenario Script ............................................................ 30Figure 5. Cessna Citation Mustang flight simulator and projection system ................................ 31Figure 6. Simulator G1000 avionics suite and out-the-window view ......................................... 31Figure 7. Experimenter’s station. The simulator and visual system can be seen in
the background............................................................................................................. 36Figure 8. Researchers and ATC at the experimenter’s station..................................................... 37Figure 10. Excel spreadsheet produced for eleven specific flight parameters.............................. 46Figure 11. Stacked Graphs of Simulator Data .............................................................................. 47Figure 12. Example flight trajectory plotted in Google Earth ...................................................... 48Figure 13. Flight path trajectory with additional aircraft data selected ........................................ 49Figure 14. Sample Flight Communication Transcription ............................................................. 50Figure 15. Four camera views of Cessna Mustang simulator cockpit. Starting from top left
rotating clockwise – MFD, view of pilot, pilot’s PFD, co-pilot’s PFD....................... 52Figure 16. ATC dynamic navigation map and flight parameter display....................................... 53Figure 17. Time Required to complete Expedited Descent as a function of AP use .................... 96Figure 18. ISA Workload rating during the Expedited Descent as a function of AP use............. 96Figure 19. ILS or LOC RWY 25 approach to KHSP (AOPA, 2012)........................................ 108Figure 20. Participant ratings of performance across five major tasks....................................... 127

9
List of Tables
Table 1. Experimental flight ISA rating prompts ........................................................................ 33Table 2. Experimental flight NASA TLX task rating events....................................................... 34Table 3. Sample Flight Simulator Variables................................................................................ 45Table 4. Participant Flying History.............................................................................................. 54Table 5. Personal Experience with Advanced Avionics and Automation ................................... 55Table 6. Expected Strategies for Programming the BWZ Radial Intercept................................. 60Table 7. Errors Committed During High Workload Event 1....................................................... 66Table 8. Sequences of Lateral AP Modes used by Participants during Event 1 .......................... 68Table 9. Sequences of Vertical AP Modes used by Participants during Event 1 Climb ............. 69Table 10. Strategies for setting up the BWZ 208o radial intercept ............................................... 70Table 11. Pilot Flying History in Hours by Major Task, Success Status, and Experience of
FD Failure ..................................................................................................................... 76Table 12. ISA and NASA RTLX Ratings by Major Task Success Status and Experience of
FD Failure ..................................................................................................................... 78Table 13. Correctly Copying Reroute Clearance .......................................................................... 82Table 14. Errors Committed during Event 2................................................................................. 84Table 15. Descent Performance in Event 2................................................................................... 86Table 16. Time required for programming reroute and descent to meet the DQO crossing
restriction ...................................................................................................................... 87Table 17. Pilot Demographics by Problems Encountered with the Reroute or Meeting the
Crossing Restriction at DQO ........................................................................................ 89Table 18. RTLX workload ratings for Event 2 ............................................................................. 91Table 19. Autopilot Modes Used during Expedited Descent ....................................................... 93Table 20. Timing of Autopilot Re-Engagement ........................................................................... 93Table 21. Time Lapsed for Participant Response and Altitude Gained Prior Aircraft Descent ... 94Table 22. Pilot Participant TLX-Ratings of the Expedited Descent Procedure............................ 99Table 23. Errors Committed During High Workload Event 4.................................................... 103Table 24. Relationship of timing of approach briefing and programming to encountering
difficulties in programming or conducting the ILS runway 25 approachinto KHSP ................................................................................................................... 109
Table 25. Lower Left PFD Inset Map Configurations ................................................................ 111Table 26. Pilot Demographics by Problems Encountered with the Crossing Restriction and
Instrument Approach .................................................................................................. 116Table 27. NASA RTLX Ratings by Problems Encountered with the Crossing Restriction
15 nm before MOL ..................................................................................................... 117Table 28. ISA and NASA RTLX Ratings for the Lost Pilot Scenario by Problems
Encountered with the Crossing Restriction and Instrument Approach....................... 118Table 29. ISA and NASA RTLX Ratings by Problems Encountered with the ILS or
LOC RWY 25 Instrument Approach into KHS.......................................................... 119Table 30. Fundamental Frequency Descriptive Statistics (Hz) .................................................. 121Table 31. Articulation Rate Descriptive Statistics ...................................................................... 122Table 32. Success in Accomplishing Major Tasks in the Four High Workload Events............. 125

10
Appendices
Appendix A: Demographic Data Questionnaire ........................................................................ 162Appendix B: Advanced Avionics and Automation Questionnaire ............................................ 166Appendix C: Citation Mustang And G1000 Cockpit Set-Up Preference Questionnaire........... 168Appendix D: Pilot Briefing Package.......................................................................................... 176Appendix E: Post-Study Interview Questions ........................................................................... 190Appendix F: Observed “Best Practices” and Other Things to Consider ................................... 194

11
Single-Pilot Workload Management in Entry-Level Jets
Introduction
The development and production of personal jets such as entry level jets (ELJs) and very
light jets (VLJs) have made a wider range of operations and missions available to private and
professional pilots alike. Private, corporate, and charter pilots can now fly higher and faster than
ever before. These jets, as with some of their slightly larger brethren, are typically certified for
single-pilot operations as well as for operation by crews of two pilots. The automation and
advanced technology aboard these aircraft are essential features that make flight by single pilots
possible.
However, automation and advanced technology are not a panacea. The design of glass
cockpit systems currently used in these aircraft places a heavy cognitive load on the pilot in
terms of long-term, working, and prospective memory; workload and concurrent task
management; and developing correct mental models as to their functioning (Burian & Dismukes,
2007, 2009). These cognitive demands have been found to have a direct relationship to pilot
errors committed during flight (Dismukes, Berman, & Loukopoulos, 2007). Burian (2007) found
a significant correlation between poor workload and time management (i.e., poor crew and
single-pilot resource management, which are abbreviated CRM and SRM, respectively) and
problems using advanced avionics. Additionally, almost two-thirds of the accident reports she
analyzed involved at least one of six different cognitive performance problems (e.g., distraction,
memory problems, risk perception). She found that these problems were experienced at similar
rates by pilots flying professionally and those flying for personal reasons.
Thus, workload management is a crucial aspect of SRM. Best practices for single-pilot
flight task and workload management must be better understood within the current operating

12
environment and beyond, as we move to an era of optimizing the National Airspace System as
outlined in NextGen concepts (FAA, 2012). The accessibility of these ELJs to owner-operators,
who may fly less frequently than professional pilots, compels an examination of their proficiency
in task and workload management, in addition to that demonstrated by professional pilots who
fly these jets more regularly (National Business Aviation Association, 2005).
Jet Single-Pilot Workload
An individual has to dedicate finite cognitive and physical resources towards performing
any given task. Some of these resources include visual and auditory attention, working memory,
and vast stores of declarative and procedural knowledge stored in long-term memory (Anderson,
2000). Higher order cognitive processes such as decision-making and reasoning will be required
for determining strategies to properly prioritize and perform tasks. Energy is also required to
perform tasks, both mental and physical. Cognitive resources have been conceptualized in
various ways, including as a singular shared resource or as multiple resources dedicated to
specific modalities, such as vision or hearing (Wickens, 2008).
Workload can also be associated with interrupting discrete tasks that take resources away
from ongoing tasks. Within aviation, there are a number of discrete tasks that can interrupt the
ongoing tasks associated with the aviate-navigate-communicate (ANC) task prioritization
scheme. When individuals perform a visually-intensive interrupting task, such as searching their
surroundings for obstacles or inbound traffic, they have fewer cognitive resources to attend to
ongoing tasks such as navigating along a predetermined flight path. When ATC contacts an
aircraft and provides a reroute instruction, that interruption requires that pilots devote auditory
resources as they listen, and reduces available visual resources as they write down the new
clearance. When programming the new route, pilots’ visual resources are narrowly allocated

13
toward the multifunction display (MFD) and memory resources are taxed as they recall the
procedure for inputting new waypoints.
The constant stream of interrupting and ongoing tasks requires that pilots shift attention
among them in an intricate dance commonly referred to as multitasking or concurrent task
management (Chou, Madhaven, & Funk, 1996; Hoover & Russ-Eft, 2005; Loukopoulos,
Dismukes, & Barshi, 2003). However, when performing multiple tasks there is a decrement in
performance caused by the time required to switch between tasks (Gopher, Armony, &
Greenshpan, 2000). Pilots must recall what other tasks are waiting to be performed or where they
left off when returning to an interrupted task. Thus, research has found a tendency to delay
switching tasks because of the challenges involved (Wickens & Hollands, 2000).
In modern crewed operations, two pilots divide the workload between them. One pilot
may be managing the entry of waypoint information, while another is communicating with ATC.
The result is that fewer cognitive resources are drawn from any single crew member. In single-
pilot operations, however, all of the workload must be managed alone. Part of the workload
management task for the single pilot is to determine how to best use outside resources, such as
cockpit automation, to help complete flight tasks (Burian & Dismukes, 2007, 2009). As
described below, cockpit automation is a boon to the single pilot in accomplishing many flight
tasks but one that comes with a cost. Pilots must first tell the automation what to do, through
programming, and then carefully monitor it to make sure it does what the pilot intended (Roscoe,
1992).
At first, it might seem reasonable to conclude that the addition of advanced technology
liberates the pilot by taking over the role of a second pilot. However, the automation that is
currently available is unable to completely fulfill that role. Automation generally cannot

14
recognize when an error has been made, respond to ATC instructions, reset the altimeter, and it
cannot recognize when the pilot needs assistance. Single-pilot operations, therefore, introduce a
single point of failure in an aircraft (Deutsch & Pew, 2005; Schutte et al., 2007).
Approaches to Measuring Workload
The study of workload has resulted in the development of several instruments and
measures. Often these instruments measure one’s perception of how difficult a particular task is
to perform. The information gained can be used with other, less subjective, data to improve
training, procedures, or device interfaces to reduce workload.
One of the most well-known instruments is the NASA Task Load Index (Hart &
Staveland), more commonly known as the NASA-TLX or simply, TLX. The TLX is an
instrument that originally had two main steps. The first assesses the perceived difficulty of a task
along six subscales: mental demand, physical demand, temporal demand, performance, effort,
and frustration level. The second component weights the importance of each subscale to account
for individual differences to compute a final TLX score (Hart & Staveland, 1988; Hart, 2006).
Over the years, the TLX has been implemented in a variety of ways. One of the variations has
included using the unweighted scores for each of the subscales, thereby eliminating the need to
complete a secondary rating scale. The result simplifies the analysis procedure for the researcher
and makes the scale easier to complete for the respondent without sacrificing measurement
sensitivity. This approach is referred to as Raw TLX, or simply, RTLX (Byers, Bittner, & Hill,
1989; Hart, 2006; Miller, 2001).
Another subjective measure of workload is the Instantaneous Self-Assessment (ISA)
technique (Castle & Legget, 2002). The ISA, unlike the TLX, is a unidimensional measure of
workload. ISA measures consist of a rating on a scale of one (low) to five (high) of the perceived
15
level of workload, as well as the respondents’ reaction time to provide the rating. The ISA has
the advantage of being quick to administer and is minimally intrusive, unlike the TLX (Castle &
Legget, 2002; Farmer & Brownson. 2003; Miller, 2001).
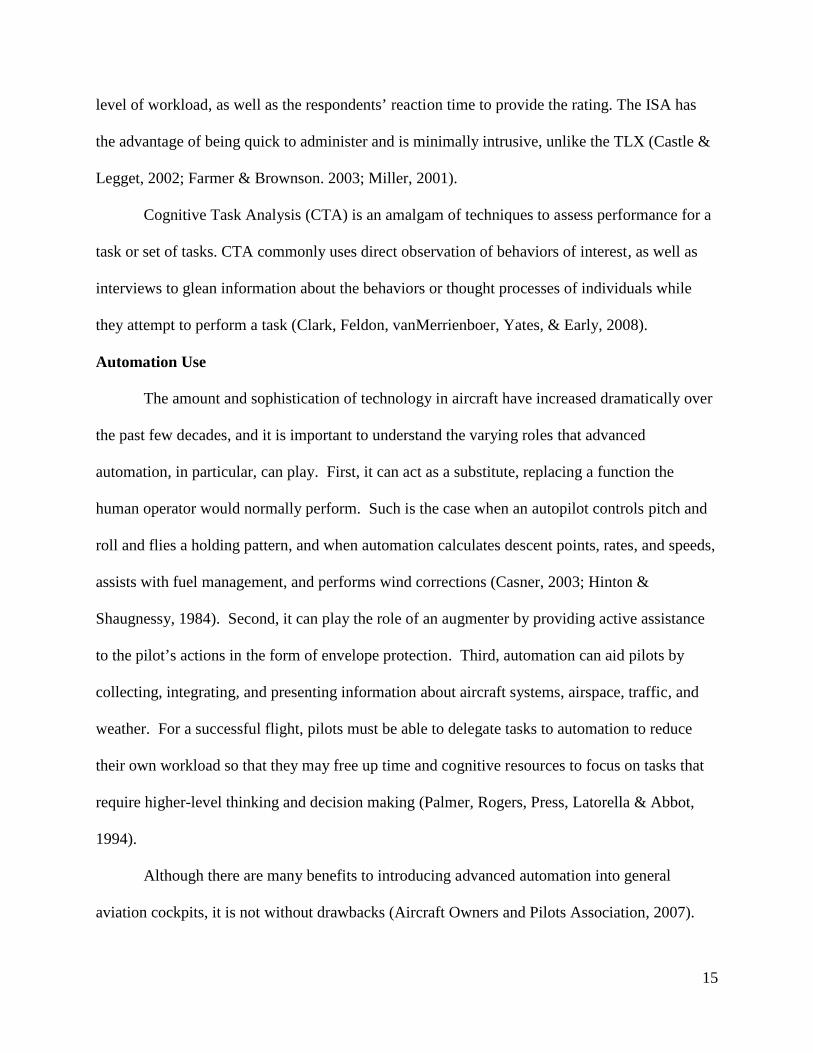
Cognitive Task Analysis (CTA) is an amalgam of techniques to assess performance for a
task or set of tasks. CTA commonly uses direct observation of behaviors of interest, as well as
interviews to glean information about the behaviors or thought processes of individuals while
they attempt to perform a task (Clark, Feldon, vanMerrienboer, Yates, & Early, 2008).
Automation Use
The amount and sophistication of technology in aircraft have increased dramatically over
the past few decades, and it is important to understand the varying roles that advanced
automation, in particular, can play. First, it can act as a substitute, replacing a function the
human operator would normally perform. Such is the case when an autopilot controls pitch and
roll and flies a holding pattern, and when automation calculates descent points, rates, and speeds,
assists with fuel management, and performs wind corrections (Casner, 2003; Hinton &
Shaugnessy, 1984). Second, it can play the role of an augmenter by providing active assistance
to the pilot’s actions in the form of envelope protection. Third, automation can aid pilots by
collecting, integrating, and presenting information about aircraft systems, airspace, traffic, and
weather. For a successful flight, pilots must be able to delegate tasks to automation to reduce
their own workload so that they may free up time and cognitive resources to focus on tasks that
require higher-level thinking and decision making (Palmer, Rogers, Press, Latorella & Abbot,
1994).
Although there are many benefits to introducing advanced automation into general
aviation cockpits, it is not without drawbacks (Aircraft Owners and Pilots Association, 2007).

16
The automation will only do what it is programmed to do, including fly the aircraft into the
ground. There are many cases of this in general and commercial aviation. For example, a
Beechcraft A-36 Bonanza crashed outside of Chapel Hill, N.C., after the pilot was unable to turn
the autopilot off and subsequently impacted terrain while trying to perform an emergency
landing with full nose-down elevator trim (NTSB, 1992). The investigation revealed that the
pilot would have been required to apply 45 lbs. of aft stick force, necessitating the use of both
hands, to counteract the nose-down trim forces of the autopilot and maintain level flight.
It is also crucial that pilots constantly monitor the automation to ensure it is doing what is
intended. In addition, pilots need to know what to do if the system is not performing as desired.
Sometimes the pilot makes a programming error and the corrective action involves entering in
the proper programming (i.e., re-programming). In other situations, abnormal or emergency
procedures exist that the pilot must remember and/or access. In the Chapel Hill accident, a
procedure to counteract a runaway trim/autopilot malfunction existed and could have likely
prevented the fatal accident. In this circumstance, however, the pilot may not have had time or
been able to physically access the procedure while struggling with an autoflight system that
would not disconnect. Stress may also have impaired his ability to recall that the procedure was
even available.
Modern glass cockpits in general aviation aircraft are able to present more information in
the same amount of space than traditional round dial gauges. They also integrate information
related to aircraft control, communication, and navigation (Air Safety Institute, 2012; NTSB,
2010) as well as allowing easier monitoring of systems, more efficient flying, and improved
situation awareness (Billings, 1997; Zitt, 2006).

17
Although glass cockpits and automated systems are able to provide large amounts of
information and assist in flying the aircraft, many suggest that pilot workload has not decreased;
it has simply changed in nature (Hoh, Bergeron, & Hinton, 1983; Howell & Cooke, 1989;
Wiener, 1988). For example, the pilot’s task has shifted from total active controller of the
aircraft to supervisory controller over the automated systems, which requires that the pilot know
how the automated system operates in order to be able to understand, predict, and manipulate its
behavior (Sarter, Woods, & Billings, 1997). If the automated systems suggest a potentially
dangerous action, it is important that pilots are able to recognize and disregard the suggested
action. Layton, Smith, and McCoy (1994) found that computer generation of a suggestion or
recommendation significantly impacted the operator’s decision even if, unbeknownst to the
operator, the recommendation was poor and had potentially harmful consequences.
Increased cognitive workload with higher levels of automation may be a function of an
increasing memory burden, with pilots having to remember how and what the machine was
programmed to do, and what it is supposed to be doing over long periods of time. Increasing
memory burden requires pilots to use prospective memory, in which they must remember to
remember when to perform a task whose execution must be delayed. In the meantime, unrelated
tasks are performed, which increases the possibility that pilots will forget to complete the
delayed task when it is time to do so (Dismukes, 2010). Furthermore, although automated
systems are able to perform procedural and predictable tasks, it is the human operator who is
ultimately responsible for tasks requiring inference, judgment, and decision making. When
pilots get overloaded with information their situation awareness, judgment and decision making
become impaired (Burian & Dismukes, 2007).

18
Mode awareness is the ability of an operator to track and anticipate the behavior of an
automated system (Sarter & Woods, 1992). A moded system is one that produces different
behaviors depending on which mode is currently in use (Casner, 2003). A major factor in the
safe use of automation lies with the operator knowing what is happening and why. Pilots must
be able to evaluate the automation’s intentions through its actions and performance. Mode errors
typically occur because the automation interface fails to provide the user with salient indications
of its status and behavior (Sarter & Woods, 1995). It is important for manufacturers of airplanes
with glass cockpits to ensure that pilots are provided the necessary cues to understand what mode
is in use and how to address issues pertaining to possible mode confusion (GAMA, 2005).
The design of modern glass cockpits must take into account how many buttons are
feasibly able to be placed on the glass panel and how many different layers of menus within
those buttons can be used until the pilot becomes confused (GAMA, 2000, 2005). With glass
cockpits having layered menus and softkeys that do different things depending on previous
button presses, there is a greatly increased demand on memory and attention (Burian &
Dismukes, 2007). An NTSB (2010) report on the introduction of glass avionics found that
complex integration of data and confusion caused by multiple display modes are some of the
leading causes of glass panel accidents.
With increased levels of automation, it is vital that pilots avoid becoming complacent in
the cockpit and are constantly ensuring that the system is providing the desired action. Wiener
(1981) defines complacency as a psychological state characterized by a low index of suspicion
that results from working in highly reliable automated environments. It has been established that
automation use can lead to complacency in monitoring and a decrease in mode awareness
(Parasuraman, Molloy & Singh, 1993; Sarter & Woods, 1995). There is also evidence for the

19
role of personality in automation use as well. In a study conducted by Prinzel (2002), it was
demonstrated that self-efficacy (i.e., the belief in oneself as competent and capable) is a
moderating variable when identifying pilots who are likely to succumb to automation-induced
complacency. Those with low self-efficacy were more likely to suffer from complacency-
induced errors.
The Current Report
This report focuses on ELJ single-pilot workload strategies and performance during four
high workload events that occurred during the climb out and en route portions of flight.
Performance was evaluated against airline transport pilot and instrument rating practical test
standard criteria (FAA, 2008a, 2010) as well as the successful completion of the scripted tasks.
Because this was an exploratory study, instead of developing a number of detailed hypotheses to
test, we designed situations that we believed would increase workload and embedded them in
experimental scenarios for our study participants to fly. These scenarios involved flight in the
relatively demanding operational environment of the U.S. east coast corridor from the New York
City area through and to the southwest of Washington, DC. We were interested in learning about
how single-pilots flying an ELJ manage their workload and use automation in such an
environment. We were interested in examining problems they encountered, determining possible
reasons why, and identifying strategies for task management and automation use that worked out
particularly well (i.e., “best practices”). We also wished to gather baseline information on
single-pilot operational behavior for reference in future studies. The data from the current study
provided an opportunity to begin constructing a model of normative behavior and workload
management strategies involved in single-pilot jet operations.

20
Methods
Participants
The FAA Airmen Certification Branch provided the names of all pilots who possessed a
C510-S type rating at the time of our request. From that list, 321 pilots were identified as living
in the contiguous 48 United States of America. These pilots were mailed recruitment letters
briefly describing the study and invited them to contact the NASA Ames Human Systems
Integration Division Testing and Participant Recruitment Office if they were interested in
participating. One hundred one pilots responded and were sent, via email, a copy of the NASA
Informed Consent form and three questionnaires: Demographics, Advanced Avionics and
Automation, and Schedule Availability. Forty-six pilots (3 females and 43 males) returned the
completed questionnaires, and 14 male pilots were selected for participation in the simulation
portion of the study. Participation in the study was voluntary, and pilots were allowed to
terminate their participation in the study at any time, though none chose to do so. They were
paid a rate of $50.00 per hour of participation and were reimbursed for all travel costs and
provided a per diem for the cost of meals.
Materials
Demographic questionnaire. Background information was solicited from potential
participants to screen for pertinent flight certification and history that was essential for the study.
A portion of this information was used to identify potential participants representing the
population of interest (Mustang owner-operators), as well as others (i.e., professional pilots) who
flew the experimental scenarios in the simulator. In addition to the type of flying performed and
hours of experience, participants were asked to rate their experience and perceived skill levels
regarding the use of various avionics packages and cockpit technologies such as the Garmin

21
G1000™ and autoflight systems. As indicated earlier, 46 participants completed the
demographics questionnaire, which can be referenced in Appendix A.
Advanced avionics and automation questionnaire. An advanced avionics and
automation questionnaire was also completed by 46 participants. This questionnaire was
designed to gather information with regard to participant attitudes toward advanced technologies
such as glass cockpits/primary flight displays and multifunction displays. The participants were
polled on which features they preferred most and least, as well as on issues related to advanced
avionics and automation design, functionality, use, training, and maintaining proficiency, among
other things. The questionnaire can be found in Appendix B.
Citation Mustang and G1000 Cockpit Set-up Preferences questionnaire. The 14
pilots who participated in the simulator portion of the study completed a questionnaire to indicate
their preferred Garmin G1000 default settings. This information was then used to set up the
G1000 in the study simulator prior to their session to match those settings in the actual aircraft
that they flew. For example, temperatures on the G1000 displays can be expressed in degrees
Celsius or degrees Fahrenheit. Similarly, pilots can choose among 12 different variables, such as
distance (DIS), estimated time of arrival (ETA), and true airspeed (TAS), for display in four
fields at the top of the G1000 Multifunction Display (MFD). The Citation Mustang and G1000
Cockpit Set-up Preferences questionnaire can be seen in Appendix C.
Flight bag materials. A flight bag was provided for pilots to use during their flights in
the simulator. Items in the flight bag included a knee-board with paper; pencils and pens; three
different types of flashlights; colored sticky tabs; a stopwatch/timer; a baseball cap; current
Visual Flight Rules (VFR) sectional and terminal charts; current paper Jeppesen high and low
altitude Instrument Flight Rules (IFR) en route navigation charts; complete Jeppesen Airway

22
Manuals with current paper departure, arrival, and approach plates; and current Airport and
Facilities Directories. Pilots were allowed to take as much or as little of the flight bag materials
with them into the simulator as desired. However, once the scenario began, pilots were not
allowed to leave the simulator to retrieve flight bag materials they had left behind in the pre-
flight briefing room.
Flight briefing materials. Prior to each scenario, pilots were provided with a binder of
briefing materials (see Appendix D). Each binder included:
The purpose of the flight, airports of departure and destination, the current date,
proposed time of departure, aircraft location on the field at the departure airport,
and planned aircraft parking at the destination airport
A departure airport diagram (downloaded from the Web) with the aircraft’s
location indicated
A completed flight plan on FAA Form 7233-1
A navigation log
Completed weight and balance information, including a weight and balance
diagram
A complete weather briefing package including an area forecast and synopsis,
current satellite conditions, significant meteorological advisories (SIGMETs) and
airmen weather advisories (AIRMETs), weather and sky conditions, pilot reports
(PIREPs), meteorological aerodrome reports (METARs), and terminal area
forecasts (TAFs) and radar returns for departure and destination airports, winds
aloft forecast for the route of flight, en route METARs and terminal area TAFs,
and a complete set of notices to airmen (NOTAMs). Some of this material was

23
downloaded (and modified as necessary) from the National Oceanic and
Atmospheric Administration (NOAA) Aviation Weather Center Aviation Digital
Data Service (ADDS) on a day with similar conditions as that in the scenarios
(see http://www.aviationweather.gov/adds/ ).
Familiarization and experimental flight scenarios. With the help of a Cessna Citation
Mustang and other jet pilot subject matter experts (SMEs) and in consultation with ATC SMEs,
two flight scenarios were designed for use in this study. The first flight was developed so that
participants could become familiar and comfortable with the research environment, including the
simulator, the panel mounted eye-tracker, and the ISA measure (described below).
The familiarization flight was an IFR flight lasting approximately 30 minutes from
Clinton-Sherman Airport (KCSM) in Oklahoma, to Will Rogers World Airport in Oklahoma
City, Oklahoma (KOKC). Pilots performed the same flight tasks that they would complete for
the experimental flight, including reviewing the pre-flight briefing packet materials, pre-flight
cockpit preparation, conducting a takeoff and an instrument departure, instrument en route
navigation, communicating with ATC, and completing an instrument approach and landing.
Although pilots were completing an IFR flight, the weather for the familiarization flight was
visual meteorological conditions (VMC). The scenario was designed to produce relatively low
workload although on two occasions the pilots were informed of traffic crossing their route of
flight that was not a conflict (i.e., “not a factor”) by ATC. Following the familiarization flight,
the participants were asked if they had any questions and if they understood how to use the ISA
device. No data from the familiarization flights were analyzed. Figure 1 illustrates the route of
flight for the familiarization scenario.

24
Figure 1. Familiarization Scenario Route of Flight.

25
The experimental flight consisted of two legs, each approximately one hour in length.
Each leg was designed to include a number of high workload tasks that would be typical of the
type experienced by pilots flying along the scripted routes. In the first leg, pilots departed from
Teterboro Airport in New Jersey (KTEB) and landed at Martin State Airport (KMTN) just
outside of Baltimore, Maryland. In addition to normal piloting tasks such as reviewing briefing
materials and conducting en route navigation, the participants were confronted with the
following high workload tasks and conditions:
TEB6 Departure off runway 24, KTEB
Intercept the Broadway (BWZ) 208o radial
In-flight reroute
Meet a crossing restriction at a waypoint
Hold at a waypoint
RNAV (GPS) Rwy 33, circle to land Rwy 15 at KMTN
IMC conditions throughout, although not down to minimums and no convective
weather
Traffic, although none was intended to be a factor for the participant pilots
After a break for lunch, lasting 30-60 minutes, pilots then completed the second leg of the
experimental flight in which they departed from Martin State Airport (KMTN) for a destination
of Hot Springs/Ingalls airport (KHSP) in Virginia.
The high workload tasks and conditions of this leg included:
Radar vector departure from KMTN
Expedited descent to accommodate another aircraft with an emergency

26
The pop of the anti-skid circuit breaker approximately half-way through the
scenario
Meet a crossing restriction 15nm prior to a waypoint
Asked to assist in relaying communication to a Washington Center controller
from a lost pilot at the same time as meeting the crossing restriction and preparing
for the approach and landing
Perform the ILS or LOC Rwy 25 approach at KHSP
Deal with a temporarily disabled aircraft on the runway at KHSP (typically by
going around or performing the missed approach procedure)
IMC conditions throughout, although not down to minimums and no convective
weather
Traffic, although none was intended to be a factor for the participant pilots with
the exception of the disabled aircraft at KHSP
Figures 2 and 3 illustrate the route of flight and major workload tasks for the
experimental flight Legs 1 and 2, respectively.

27
Figure 2. Experimental Leg 1 Scenario Route of Flight.

28
Figure 3. Experimental Leg 2 Scenario Route of Flight.
29
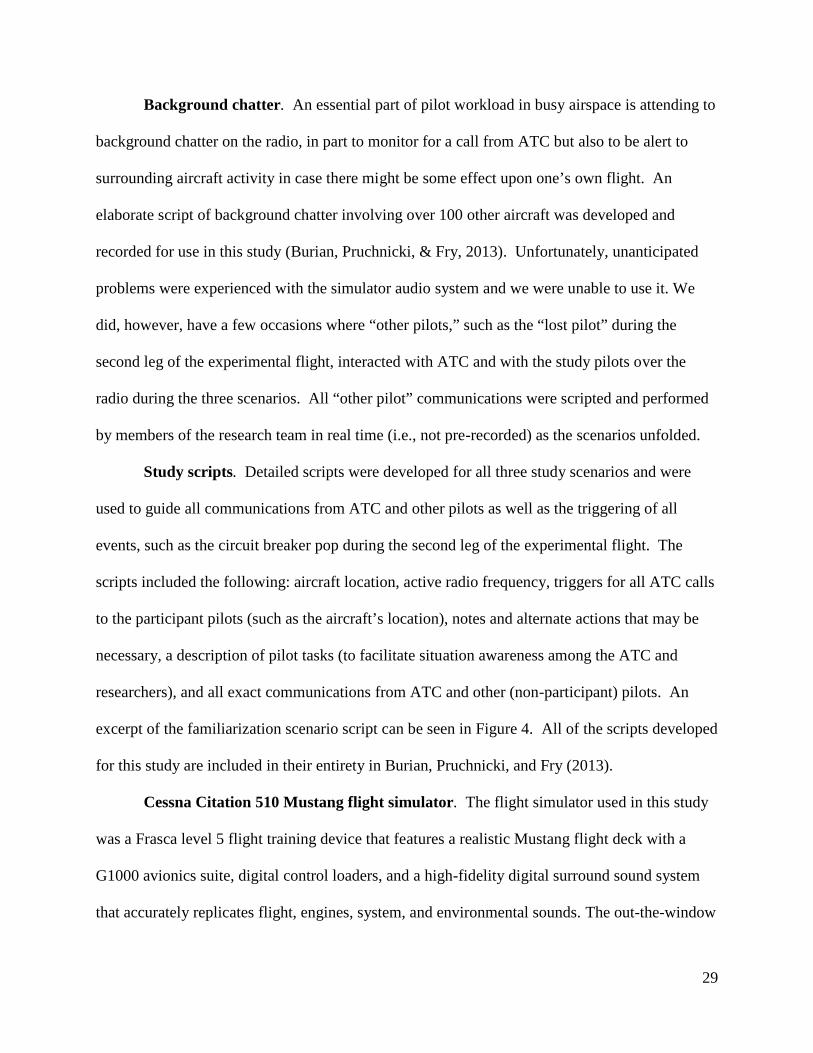
Background chatter. An essential part of pilot workload in busy airspace is attending to
background chatter on the radio, in part to monitor for a call from ATC but also to be alert to
surrounding aircraft activity in case there might be some effect upon one’s own flight. An
elaborate script of background chatter involving over 100 other aircraft was developed and
recorded for use in this study (Burian, Pruchnicki, & Fry, 2013). Unfortunately, unanticipated
problems were experienced with the simulator audio system and we were unable to use it. We
did, however, have a few occasions where “other pilots,” such as the “lost pilot” during the
second leg of the experimental flight, interacted with ATC and with the study pilots over the
radio during the three scenarios. All “other pilot” communications were scripted and performed
by members of the research team in real time (i.e., not pre-recorded) as the scenarios unfolded.
Study scripts. Detailed scripts were developed for all three study scenarios and were
used to guide all communications from ATC and other pilots as well as the triggering of all
events, such as the circuit breaker pop during the second leg of the experimental flight. The
scripts included the following: aircraft location, active radio frequency, triggers for all ATC calls
to the participant pilots (such as the aircraft’s location), notes and alternate actions that may be
necessary, a description of pilot tasks (to facilitate situation awareness among the ATC and
researchers), and all exact communications from ATC and other (non-participant) pilots. An
excerpt of the familiarization scenario script can be seen in Figure 4. All of the scripts developed
for this study are included in their entirety in Burian, Pruchnicki, and Fry (2013).
Cessna Citation 510 Mustang flight simulator. The flight simulator used in this study
was a Frasca level 5 flight training device that features a realistic Mustang flight deck with a
G1000 avionics suite, digital control loaders, and a high-fidelity digital surround sound system
that accurately replicates flight, engines, system, and environmental sounds. The out-the-window

30
(OTW) display system included a 3D Perception 225 degree (lateral angle) spherical projection
screen that gave the pilot a realistic field-of-view.
Figure 4. Excerpt of the Familiarization Scenario Script.
Six wide-quad-extended-graphics-array (WQXGA) (1920x1200) projectors were driven from six
high-end Intel server class computers at 60 Hz. The projection screen used embedded sensors to
detect the alignment, brightness, and edge blending quality of the projected images. The

31
projection system was used to display high-fidelity MetaVR™ terrain imagery and 3D computer
models of the airports that the pilots would encounter during the study. Pictures of the simulation
environment can be seen in Figures 5 and 6.
Figure 5. Cessna Citation Mustang flight simulator and projection system.
Figure 6. Simulator G1000 avionics suite and out-the-window view.

32
Eye tracker. Eye movements of participants were tracked using a FaceLab™ v5 system
consisting of non-invasive cameras, IR emitters, and software from Seeing Machines, Inc.
Camera set-up and calibration procedures were followed, as described in the FaceLab user
manual, except where modified for use in the simulator cockpit. Specifically, the dual eye
tracking cameras were mounted on the left-seat cockpit dash, above the level of the control yoke
column without blocking the view of either the outside or the cockpit instruments. In addition,
during calibration procedures, the pilot (rather than the experimenter) held the calibration target
up to the camera while seated in the cockpit to ensure that the distance to the cameras were
consistent and tailored for each pilot’s height and seating position. Image quality, camera
focusing, and calibration were confirmed by the experimenter on a computer laptop located just
outside and below the left cockpit window and initially required 10-15 minutes. Recalibration of
the eye-tracker took only a minute or less and was performed every time the participant re-
entered the simulator cockpit following a break.
Due to calibration errors, events in the simulated flight could not be related to tracked eye
movements in a manner required for monitoring time-dependent cognitive workload; therefore,
analysis of the eye tracking data was not possible. It is recommended that a system of video and
audio time-event markers, called “time hacks,” be included in future eye tracking/flight simulator
studies.
Instantaneous self-assessment (ISA). The ISA device consisted of a small rectangular
box with a red light at the top and five numbered buttons arranged vertically below it. Pilots
were prompted to perform an instantaneous self-assessment of workload by pressing one of the
five numbered buttons (with 5 being associated with “very high” workload and 1 meaning “very
low” workload) when the red light was illuminated. Researchers controlled when the light

33
would illuminate remotely from the experimenter’s station. Once illuminated, the light would
stay on for up to 60 s or until the participant pressed one of the numbered buttons. Prior to the
familiarization flight, pilots were briefed on the use of the ISA rating system and were provided
a printed card, retained for their reference during flight, which reiterated how the ISA was to be
used and described the meaning for each ISA rating. Pilots were also informed verbally and in
writing that making an ISA rating when prompted was secondary to any other task. They were
instructed to only make the rating when they were able and to not make a rating at all if there
was no break in their primary task during the 60 s that the ISA light was illuminated. Table 1
depicts checkpoints where participants were prompted to make an ISA workload rating during
the two legs of the experimental flight.
Table 1
Experimental flight ISA rating prompts
Leg 1 Leg 2
2000 foot level-off plus 60 s Aircraft reaching 2000 feet plus 60 s
Heading change for BIGGY waypoint plus60 s
Aircraft reaching 6000 feet after expediteddescent
Reaching COPES waypoint Aircraft reaching FL200 plus 60 s
Initiation of descent from FL200 Aircraft turning over CSN VOR plus 60 s
Aircraft descending through 12,000 feet Aircraft reaching MOL VOR
Aircraft turns outbound after crossingJUGMO waypoint in the hold
Aircraft turning inbound over AHLERwaypoint on the approach plus 15 s
NASA Task Load Index. Paper and pencil versions of the NASA TLX were
administered immediately after Leg 1 and again after Leg 2. Pilots were asked to give ratings on
each of the subscales for the flight overall, as well as for specific high workload tasks or phases
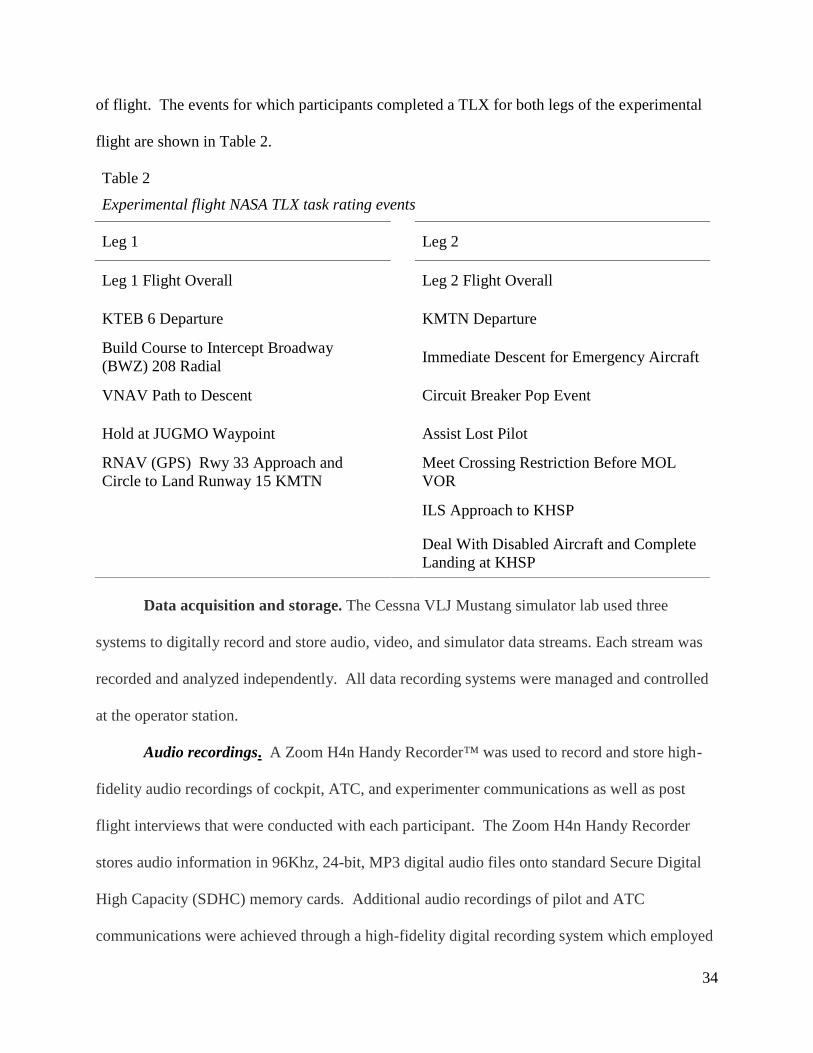
34
of flight. The events for which participants completed a TLX for both legs of the experimental
flight are shown in Table 2.
Table 2
Experimental flight NASA TLX task rating events
Leg 1 Leg 2
Leg 1 Flight Overall Leg 2 Flight Overall
KTEB 6 Departure KMTN Departure
Build Course to Intercept Broadway(BWZ) 208 Radial
Immediate Descent for Emergency Aircraft
VNAV Path to Descent Circuit Breaker Pop Event
Hold at JUGMO Waypoint Assist Lost Pilot
RNAV (GPS) Rwy 33 Approach andCircle to Land Runway 15 KMTN
Meet Crossing Restriction Before MOLVOR
ILS Approach to KHSP
Deal With Disabled Aircraft and CompleteLanding at KHSP
Data acquisition and storage. The Cessna VLJ Mustang simulator lab used three
systems to digitally record and store audio, video, and simulator data streams. Each stream was
recorded and analyzed independently. All data recording systems were managed and controlled
at the operator station.
Audio recordings. A Zoom H4n Handy Recorder™ was used to record and store high-
fidelity audio recordings of cockpit, ATC, and experimenter communications as well as post
flight interviews that were conducted with each participant. The Zoom H4n Handy Recorder
stores audio information in 96Khz, 24-bit, MP3 digital audio files onto standard Secure Digital
High Capacity (SDHC) memory cards. Additional audio recordings of pilot and ATC
communications were achieved through a high-fidelity digital recording system which employed

35
several devices that were networked together. These audio recordings were integrated into the
video recordings, discussed below.
Video recordings. Four Arecont Vision IR™ video cameras were specifically selected for
their high resolution color image streams. Two of the Arecont cameras were mounted on tripods
placed on each side of the simulator cockpit. The camera on the pilot side recorded the pilot’s
primary flight display (PFD). The camera on the co-pilot side recorded the pilot so participant
well-being could be monitored as required by FAA and NASA Institutional Review Board
protocol. A third camera was mounted at the aft of the simulator cab to record the MFD. The
fourth camera was mounted inside the cockpit on the co-pilot’s window pillar, and it recorded
the co-pilot’s PFD. All four cameras operated at 60hz NTSC signal and were infrared (IR)
sensitive.
A Plexsys™ data recording system called Enhanced Mission Record and Review System
(EMRRS™) was used in the VLJ simulator lab to record, process, and store high-quality digital
video streams. EMRRS was used to combine multiple audio, video, and data streams and store
them on a Plexsys media storage server. The Arecont Cameras and sound mixer were connected
to the Plexsys recording system through a network hub. EMRRS synchronized all the recorded
streams for accurate time-stamped playback and real-time analysis. Additionally, it provided
real-time observation of pilot activity during the recording, including pausing, rewinding, and
replay of the media without disturbing the recording.
Simulator data stream. The Frasca simulator features a data storage capability including
5159 variables. The variables are a recording of the state of the aircraft and the immediate
simulated environmental conditions. The data are stored in a Frasca proprietary file format that is
36
exported to standard, comma delimited, or comma separated value (CSV) text files, which can be
opened in a variety of spreadsheet programs.
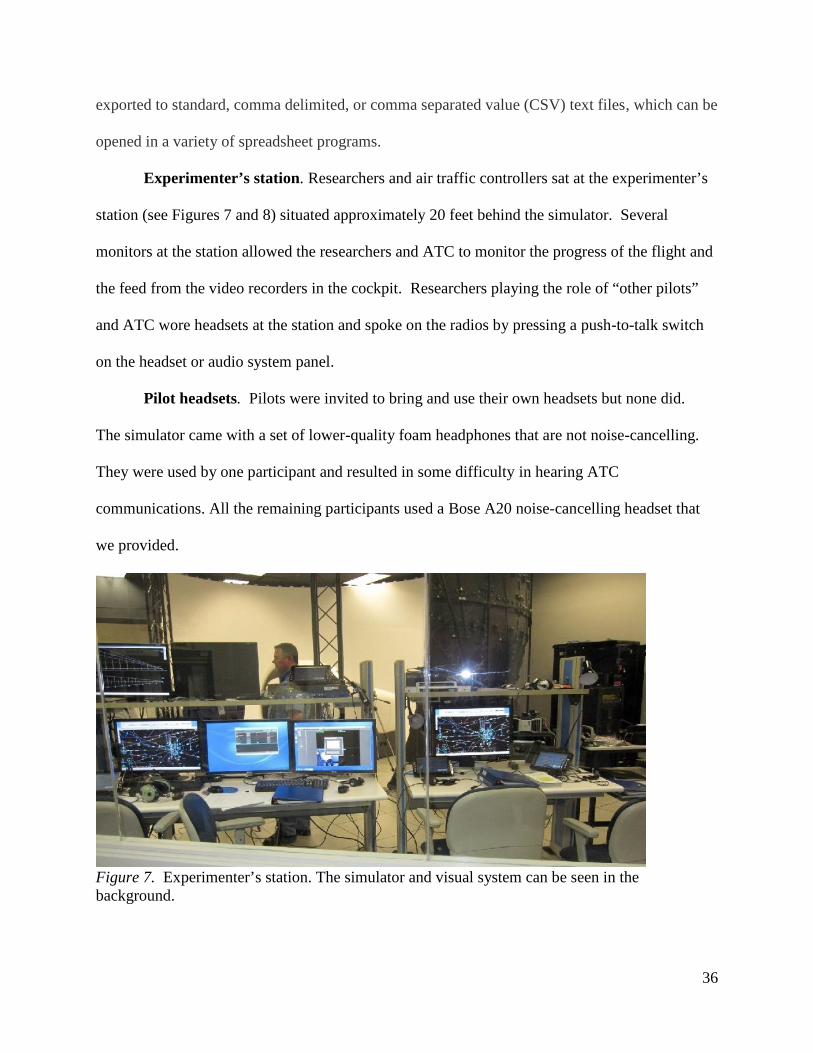
Experimenter’s station. Researchers and air traffic controllers sat at the experimenter’s
station (see Figures 7 and 8) situated approximately 20 feet behind the simulator. Several
monitors at the station allowed the researchers and ATC to monitor the progress of the flight and
the feed from the video recorders in the cockpit. Researchers playing the role of “other pilots”
and ATC wore headsets at the station and spoke on the radios by pressing a push-to-talk switch
on the headset or audio system panel.
Pilot headsets. Pilots were invited to bring and use their own headsets but none did.
The simulator came with a set of lower-quality foam headphones that are not noise-cancelling.
They were used by one participant and resulted in some difficulty in hearing ATC
communications. All the remaining participants used a Bose A20 noise-cancelling headset that
we provided.
Figure 7. Experimenter’s station. The simulator and visual system can be seen in thebackground.

37
Figure 8. Researchers and ATC at the experimenter’s station.
Debriefing interview. After a short break following the second leg of the experimental
flight, a semi-structured debriefing interview of participants was conducted. We asked pilots
about their overall impression of their experience for the day and if there were any tasks
performed during the flights that increased their workload. In addition, we asked how they felt
they managed their workload during the flights. For a complete description of the specific
questions that were asked during the semi-structured interviews, see Appendix E. These
interviews were recorded as WAV files on a digital audio recorder and were transcribed for later
analysis.
Task analyses. During the study design phase of this research, high level outlines of the
two experimental flights were constructed (Burian, Christopher, Fry, Pruchnicki, & Silverman,
2013). These outlines included all the major tasks to be completed by the participants during
those flights. Detailed tasks analyses were then conducted with the assistance of a SME who is

38
knowledgeable about the G1000 and serves as an instructor and mentor pilot in the Cessna
Citation Mustang. In these task analyses, the major tasks were broken down into subtasks, sub-
sub-tasks, and so on until each step for the completion of a task was identified down to the level
of pressing a button or turning a knob. To the extent possible, cognitive tasks associated with
some of these physical tasks (e.g., “recall that ATC gave direction to report when reaching
assigned altitude”) were also included. These task analyses were developed to classify the
correct way in which each task must be completed or—when multiple ways of accomplishing a
task exist—classifying one way of accomplishing the scripted tasks that represents the correct
action and a superior approach to workload management and task completion, as determined by
our SME. The task analyses were used during data analysis when reviewing approaches to task
completion and workload management employed by the study participants. The task analyses
for the two experimental flights can be seen in their entirety in Burian et al. (2013).
Concurrent task timelines. Following the completion of the task analyses for the two
experimental flights, we developed Concurrent Task Timelines (CTTs) in which bars (or lines)
representing the first three levels of tasks and sub-tasks included in the analyses were drawn
relative to each other (the horizontal axis on the page indicates time; see Figure 9). The purpose
of these timelines was to depict concurrent tasks in a format that indicted their expected length
relative to each other. Again, our Cessna Citation Mustang SME assisted in the development of
these timelines, which were used by researchers during the data analysis phase of the study for
identifying and evaluating participant performance and workload management strategies. The
complete CTTs for both experimental flights can be seen in Burian et al. (2013).

39
Figure 9. Sample portion of a concurrent task timeline.
Design
This exploratory study of jet single-pilot workload management was observational in
nature. As described earlier, detailed scripted flight scenarios which included a variety of typical
but high workload tasks were developed, and pilots representing the population of interest agreed
to fly the scenarios. Recently retired air traffic controllers who had experience directing traffic
in the US northeast corridor (where the experimental flights took place) were hired to play all the
roles of ATC in the scenarios (e.g., ground controller, local controller, departure, center, etc.).
Procedure
The evening before each of the participants was scheduled to complete the study, they
met with one of the researchers to review the study procedures and purpose. Participants were
given an opportunity to ask any questions, and they signed the FAA Informed Consent Form.
40
They were given the flight briefing materials and associated charts and maps for the
familiarization flight. Participants conducted whatever pre-flight planning they felt necessary for
the familiarization flight that evening in their hotel rooms. Participants were told that they
should both prepare for and fly the scenarios in the same ways as they normally did when flying
in the real-world.
The following morning, participants were picked up from their hotel rooms and driven to
the simulator facility at CAMI. The pilots first completed a flight around the pattern at KOKC to
begin getting familiar with the simulator environment. During this circuit (on downwind), pilots
were cued to read a series of words printed on a card. This provided baseline audio data for use
in later analyses of pilot voice communications and workload during the experimental flight. All
pilot communications in the simulator (once their headset was on) were captured in WAV files.
Tail numbers of the participant’s own Mustang aircraft were used during all ATC radio
communications throughout familiarization and experimental flights to further a sense of
familiarity for the pilots in the simulation environment.
Following the completion of the circuit at KOKC, pilots were given an opportunity to
review the briefing materials for the familiarization flight from KCSM to KOKC and were
provided the flight bag materials. Pilots then re-entered the simulator cockpit, were briefed on
the use of the ISA, participated in the initial calibration of the eye-tracker, and flew the
familiarization flight, which lasted approximately 30 minutes.
Pilots were then provided a brief break, typically around 10 minutes, and were offered a
choice of beverages and snacks. They were given the briefing materials for the experimental
flights and were told that they could review the materials for both legs or only the first,
whichever they preferred. The amount of time taken by participants to complete this pre-flight

41
briefing varied according to whether both legs or only the first leg was briefed and ranged from
12 to 90 minutes. Those participants who only briefed the first leg took approximately 30
minutes to review the materials.
When pilots expressed that they were ready, they flew the first leg of the experimental
flight, which lasted approximately 60 minutes. In this flight, they departed from Teterboro, New
Jersey (KTEB) with a destination of Martin State Airport (KMTN), near Baltimore, MD, during
daylight hours in September on a moderate IMC day. The aircraft was fully fueled. Following
cockpit setup and G1000 initialization, the flight was cleared to Martin State Airport via the
Teterboro Six Departure.
An IFR flight plan was filed and the departure weather consisted of rain and a slight
crosswind at KTEB. Due to proximity to New York City, the departure procedure was complex.
IMC was encountered during the initial climb. Once established en route with New York Center,
radar vectors and route modifications were assigned. Altitude restrictions were applied as well to
avoid simulated traffic conflicts in busy airspace. The flight evolved normally and was
representative of a typical flight in the USA Northeastern Corridor. After handoff to Washington
Center, and following a brief hold, the single pilot completed the RNAV (GPS) RWY33 non-
precision approach in marginal VFR conditions and circled to land on runway 15. After landing,
the participant shut down the aircraft.
At the completion of the flight, participants left the simulator, completed the NASA TLX
measures for the first leg, and were then provided lunch. Following the lunch break, pilots were
given an opportunity to review the briefing materials (or conduct a pre-flight briefing if not done
earlier) for the second leg of the experimental flight. Participants’ review of the second leg
briefing material ranged from 4 minutes to 45 minutes and varied according to whether the

42
second leg had been briefed earlier as part of the Leg 1 review. When pilots indicated they were
ready, they flew Leg 2 of the experimental flight.
In Leg 2, the participants departed from Martin State airport (KMTN) with a destination
of Ingalls Field at Hot Springs, Virginia (KHSP). This flight took place during daylight hours in
September on a moderate IMC day. Following the cockpit setup and G1000 initialization, the
aircraft was cleared to Ingalls Field via the radar vectors to PALEO, the Nottingham (OTT) VOR
and then as filed. Runway 15 was in use for departure with an initial altitude assigned of 2000’
MSL.
An IFR flight plan was filed for the KMTN departure and a slight crosswind existed. The
departure procedure was straight out and simple, but the airspace in the D.C. Metroplex is
complex. IMC was encountered during the initial climb, and altitude restrictions were applied to
avoid traffic conflicts. During the climb to cruise altitude, the aircraft was instructed by ATC to
descend immediately to accommodate another aircraft with an emergency. Once established en
route with Washington Center, the flight evolved normally and was representative of a typical
flight in the USA Northeastern Corridor. However, a relatively minor non-normal event
occurred (the popping of a circuit breaker) which required reference to a non-normal procedure
in the aircraft Quick Reference Handbook (QRH). In the final third of the flight, the pilot was
asked to assist with communication between Washington Center ATC and a pilot who was lost
and flying too low to be heard by ATC. Upon receipt of the Automated Weather Observation
System (AWOS) for KHSP, the pilot was instructed to prepare for a precision ILS approach with
an expected break-out from the overcast at 600 ft above decision height (DH). As part of the
experimental design, an aircraft landing prior to the participant’s aircraft was temporarily
43
disabled on the runway, forcing the participant to go around or complete a missed approach
procedure. Following the second landing attempt, the pilot secured and shut down the aircraft.
NASA TLX measures for the second leg were then completed, and the participant was
provided a short break before participating in the debriefing interview. At the completion of the
debriefing interview, participants were thanked for their participation and provided a certificate
and CAMI promotional pen as thank you gifts. Participants were reminded of reimbursement
procedures for their travel expenses and were driven back to their hotels.
Data Management and Preparation
This report focuses on single-pilot workload management and performance during four
high workload events that occurred during the en route phase of flight from the completion of the
departure procedure/ initial climb to the initiation of an instrument approach procedure. We spent
several months downloading and organizing data from the simulator itself, the audio and video
recordings, the ISA data, and the eye tracker data. CAMI personnel placed these data on
external hard drives, some of which were shipped to NASA collaborators. We also transcribed
the recorded debriefing interviews conducted with participants and recorded Mustang SME
comments made while reviewing the recordings of the experimental flight. We also developed
and populated four databases with information from three questionnaires and NASA TLX
workload measures. NASA personnel shared updated documents outlining data to be analyzed,
research questions to be answered, and hypotheses to be evaluated.
Biweekly, weekly, and sometimes daily teleconferences were held among NASA and
CAMI research team members to discuss data management and preparation, data analysis,
findings, writing assignments (which were distributed among the team), and to edit this report.
Because of the qualitative nature of much of the data and the large and distributed nature of the
44
research teams, much more coordination and communication regarding the approach to data
analysis was needed than is typically the case.
Simulator Flight Performance Data and Data Extraction
The Frasca simulator included the capability of recording real-time flight data. The data
stream contained 5,159 separate simulation variables sampled and recorded at a rate of 5Hz.
Each sample constitutes a sequentially numbered “frame” in the data stream. These data included
latitude, longitude, and altitude information, the status of cockpit controls and displays,
simulated weather settings, aircraft attitude and airspeed, and the activation and values of
specific G1000 settings (e.g., barometric pressure). Following the completion of each scenario,
the simulation data stream recording was stored in a proprietary data format on the local
simulator drive. Table 3 shows an example of some of the flight parameters, units of measure,
and variable names within the Frasca software package that were used for analysis. Figure 10
shows a spreadsheet of some of the downloaded data for several flight parameters recorded by
the simulator. More information about the extraction and transformation of the simulator data in
preparation for analysis can be found in Williams et al. (2013).
Graphs
Using extracted simulator data, graphs of several continuous variables were created in
Microsoft Excel. The following variables were graphed to assist us in our analyses: altitude,
airspeed, vertical speed, engine power (N1), magnetic heading, autopilot use (on/off), and
autoflight modes used. The x-axis of all graphs was expressed as time in minutes, and the y-axis
was indicated by a scale appropriate to each variable. To compare the multiple variables
simultaneously, graphs were stacked on top of each other, aligning time markers along the x-
axis. Figure 11 illustrates these graphs for one of the high workload events analyzed for this
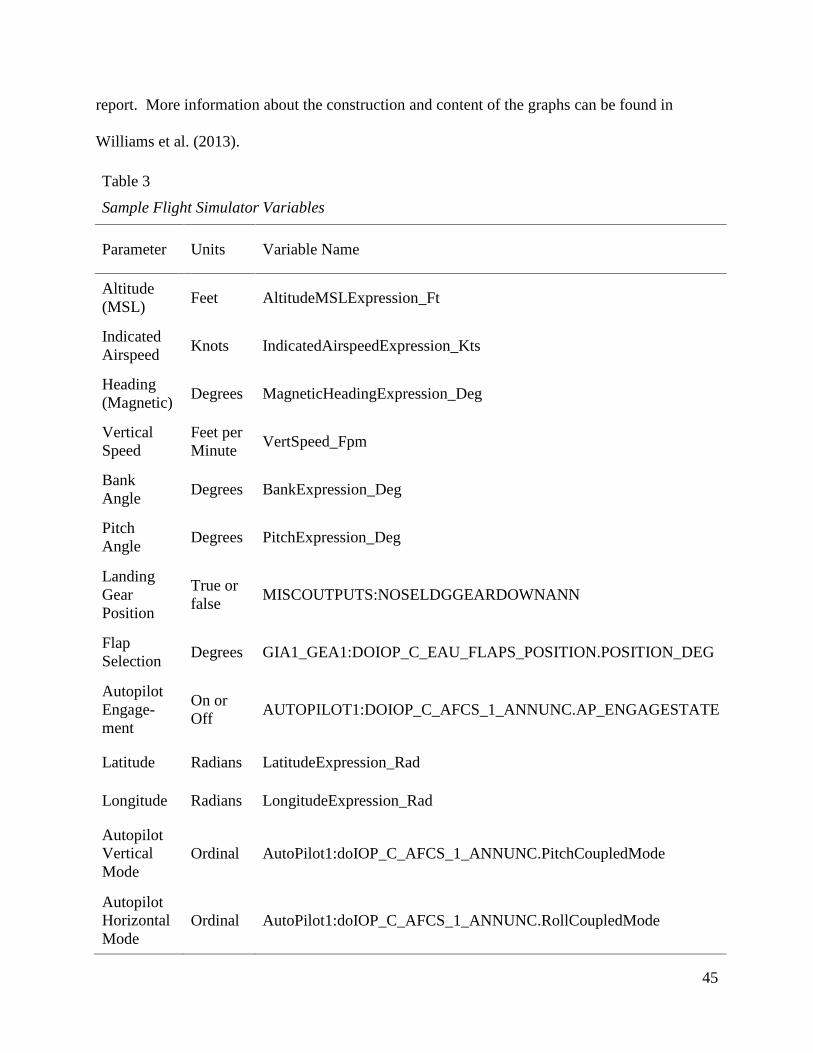
45
report. More information about the construction and content of the graphs can be found in
Williams et al. (2013).
Table 3
Sample Flight Simulator Variables
Parameter Units Variable Name
Altitude(MSL)
Feet AltitudeMSLExpression_Ft
IndicatedAirspeed
Knots IndicatedAirspeedExpression_Kts
Heading(Magnetic)
Degrees MagneticHeadingExpression_Deg
VerticalSpeed
Feet perMinute
VertSpeed_Fpm
BankAngle
Degrees BankExpression_Deg
PitchAngle
Degrees PitchExpression_Deg
LandingGearPosition
True orfalse
MISCOUTPUTS:NOSELDGGEARDOWNANN
FlapSelection
Degrees GIA1_GEA1:DOIOP_C_EAU_FLAPS_POSITION.POSITION_DEG
AutopilotEngage-ment
On orOff
AUTOPILOT1:DOIOP_C_AFCS_1_ANNUNC.AP_ENGAGESTATE
Latitude Radians LatitudeExpression_Rad
Longitude Radians LongitudeExpression_Rad
AutopilotVerticalMode
Ordinal AutoPilot1:doIOP_C_AFCS_1_ANNUNC.PitchCoupledMode
AutopilotHorizontalMode
Ordinal AutoPilot1:doIOP_C_AFCS_1_ANNUNC.RollCoupledMode

46
Figure 10. Excel spreadsheet produced for 11 specific flight parameters.

47
Figure 11. Stacked graphs of simulator data

48
Google Earth Plots
To assist in the analysis of the data, the flight path trajectories were plotted in Google
Earth™. Figure 12 shows a sample flight trajectory for a circling approach and landing on
runway 15 at KMTN, with a 1.3 nautical mile radius circle around the runway threshold as an
obstacle clearance safe area, plotted in Google Earth.
Figure 12. Example flight trajectory plotted in Google Earth.
The identification of specific events during the flight such as the use of the autopilot was
indicated by uniquely formatted place marks so they could be easily distinguished within the
flight path trajectory. Figure 13 shows a Google Earth plot of a flight trajectory with one of the
place marks selected, showing the additional information available.
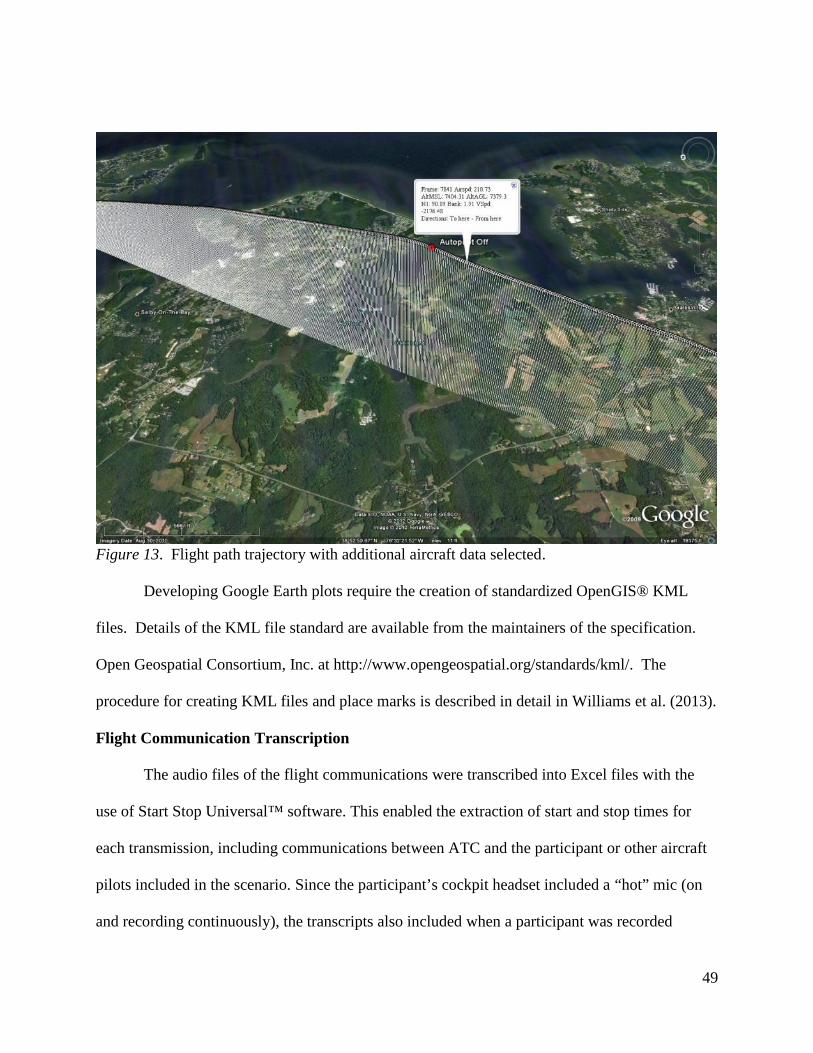
49
Figure 13. Flight path trajectory with additional aircraft data selected.
Developing Google Earth plots require the creation of standardized OpenGIS® KML
files. Details of the KML file standard are available from the maintainers of the specification.
Open Geospatial Consortium, Inc. at http://www.opengeospatial.org/standards/kml/. The
procedure for creating KML files and place marks is described in detail in Williams et al. (2013).
Flight Communication Transcription
The audio files of the flight communications were transcribed into Excel files with the
use of Start Stop Universal™ software. This enabled the extraction of start and stop times for
each transmission, including communications between ATC and the participant or other aircraft
pilots included in the scenario. Since the participant’s cockpit headset included a “hot” mic (on
and recording continuously), the transcripts also included when a participant was recorded

50
thinking aloud, and the simulator voice aural alerts heard in the cockpit. Each transcribed file
started at zero hours, minutes, and seconds (00:00:00). Figure 14 illustrates what a transcription
might look like; more information about the transcription process can be found in Williams et al.,
(2013).
Figure 14. Sample flight communication transcription

51
Voice Analysis
Previous research has found a relationship between different vocal qualities and stress or
workload. For example, it has been found that speech fundamental frequency (pitch) and vocal
intensity (loudness) increase significantly as workload increases and tasks become more complex
(Brenner, Doherty, & Shipp, 1994; Griffin & Williams, 1987). Speech or articulation rate has
also been shown to increase when the speaker is under stress associated with high workload
(Ruiz, Legros, & Guell, 1990). Therefore, we decided to conduct various voice analyses as
possible objective indicators of participant workload in this study.
To prepare each participant’s audio files for the fundamental frequency (FO) and
articulation rate analyses, audio files containing the flight communications of each participant
were exported into Sound Forge Audio Studio (Version 10). Sections of communication for
each participant to be used in the analyses, described later, were identified, and labeled; all audio
of the ATC, experimenter, other pilots, and simulator noises were deleted from the file. Each
identified section of communication was then cut and pasted into a single WAV file so that each
participant had one audio file containing all audio sections to be analyzed.
For the FO analyses, these same audio sections were exported into WaveSurfer™
(Version 1.8.8p4) and FO was calculated at a rate of .01 s. The average articulation rate per
section was then calculated using Praat™ software (Version 5.3.22; Boersma & Weenink, 2012;
de Jong & Wempe, 2009). Articulation rates were then calculated by dividing the number of
syllables by the total speaking time.
Video Data
Two types of video data were collected, cockpit camera footage and a recording of a
navigational map combined with limited flight parameter data. During data analysis, the recorded

52
cockpit video feed from the four cameras could be viewed on one screen, as shown in Figure 15,
or video from just one of the cameras could be selected to make it easier to see what was
recorded. Although post-collection examination of the cockpit video data revealed a lower video
quality than expected, they still served as valuable sources to confirm simulator flight parameter
data by helping to place other data in context.
Figure 15. Four camera views of Cessna Mustang simulator cockpit. Starting from top leftrotating clockwise – MFD, view of pilot, pilot’s PFD, co-pilot’s PFD.
During data collection, video of a dynamic display of a navigation map, including a
depiction of the participants’ aircraft position, was used as a radar screen for ATC and was only
available at the experimenter’s station. A limited set of 40 flight parameters was displayed on the
right hand side of the screen (see Figure 16), which allowed researchers and ATC to monitor
participant performance in real-time. Video recordings of the navigation maps with the flight
parameters were also used during data analysis.

53
Figure 16. ATC dynamic navigation map and flight parameter display.
Results
Participant Demographics
Fourteen male pilots, type-rated to fly the Mustang as a single pilot, participated in the
simulator portion of this study. During data collection, we discovered that one of the participants
had no prior experience flying as a single pilot, so data from his flights were not included in any
of the analyses reported below. In addition to a C510-S type rating, participants were either
owner-operators of a Cessna Citation Mustang (n=7) or flew the Mustang as part of their jobs as
corporate or contract pilots (n=6). Their ages ranged from 29 to 61 years, with a mean age of
48.9 years. In the year prior to the study, our participants reported flying the Cessna Mustang a
mean of 153.7 hours (range: 68-350 hours) and flying the Mustang as a single pilot for a mean of
138.5 hours (range: 15-350 hours). General flying and Citation Mustang-specific flying history
can be seen in Table 4. No significant differences in flight hours were found between study
owner-operators and professional pilots.

54
Table 4
Participant Flying History
Mean Median Range SD
General Flying
Total number of flight hoursOwner-operatorsProfessional pilots
3998.923507.854571.83
3950.002500.004425.00
1000 - 81301000 - 81302900 - 6381
2087.842590.751294.58
Flight hours in the past yearOwner-operatorsProfessional pilots
230.53201.14264.83
170.00170.00247.00
90 - 52890 - 528
100 - 515
152.57151.09160.79
Total number of jet hours as a single pilotOwner-operatorsProfessional pilots
331.61287.86382.66
210.00230.00168.00
100 - 1345100 - 475100 - 1345
329.36136.98481.69
Flight hours in the past 3 monthsOwner-operatorsProfessional pilots
52.6151.4354.00
40.0040.0045.00
20 - 12125 - 10020 - 121
30.2628.0935.31
Citation Mustang Specific
Flight hours with a mentor pilotOwner-operatorsProfessional pilots
11.1613.578.36
5.0015.000.00
0 - 35.000 - 35.000 - 25.20
12.6212.8212.96
Flight hours in the past yearOwner-operatorsProfessional pilots
153.69161.43144.66
125.00125.00119.00
68 - 35075 - 35068 - 325
89.6193.7592.45
Flight hours in the past year as a single pilotOwner-operatorsProfessional pilots
138.46160.71112.50
100.00120.0083.50
15 - 35075 - 35015 - 325
99.7894.09
108.49
Pilots were asked to fill out a questionnaire assessing their experience with advanced
avionics and automation. Analysis revealed that the pilots were fairly experienced in using the
G1000, as well as other types of advanced avionics (e.g., Avidyne, Chelton). Some of the
questions asked, along with rating means, standard deviations and ranges are presented in Table
5 (see Appendix B for the complete questionnaire). Ratings were given from 1 to 5, with a rating
of 1 referring to having little experience and 5 being very experienced. No significant

55
differences in self-reported experience or skill with advanced avionics and automation were
found between the owner-operators and the professional pilots.
Table 5
Personal Experience with Advanced Avionics and Automation
Questions Assessed Mean Median SD
Overall Experience using different types ofadvanced avionics/ glass cockpits
Owner-operatorsProfessional pilots
3.073.282.83
3.004.002.50
1.551.381.83
Experience using the G1000 in the CitationMustang or any other aircraft
Owner-operatorsProfessional pilots
4.004.143.83
4.004.003.50
1.08.90
1.32
Skill level using the G1000 in the CitationMustang or any other aircraft
Owner-operatorsProfessional pilots
4.084.283.83
4.004.004.00
0.951.17
.75
Experience using the G430/G50 or other similarGarmin IFR avionics systems
Owner-operatorsProfessional pilots
3.773.294.33
4.003.005.00
1.421.501.21
Experience using the other types of advancedavionics (e.g. Avidyne, Chelton, etc.)
Owner-operatorsProfessional pilots
2.832.573.20
3.003.004.00
1.691.512.04
Experience with using the FMSOwner-operatorsProfessional pilots
2.692.712.67
2.003.002.00
1.601.791.50
Experience using stand-alone autopilot/autoflight systems
Owner-operatorsProfessional pilots
3.853.574.16
4.004.004.50
1.401.72
.98
1 = little experience/skill, 5 = very experienced/skilled
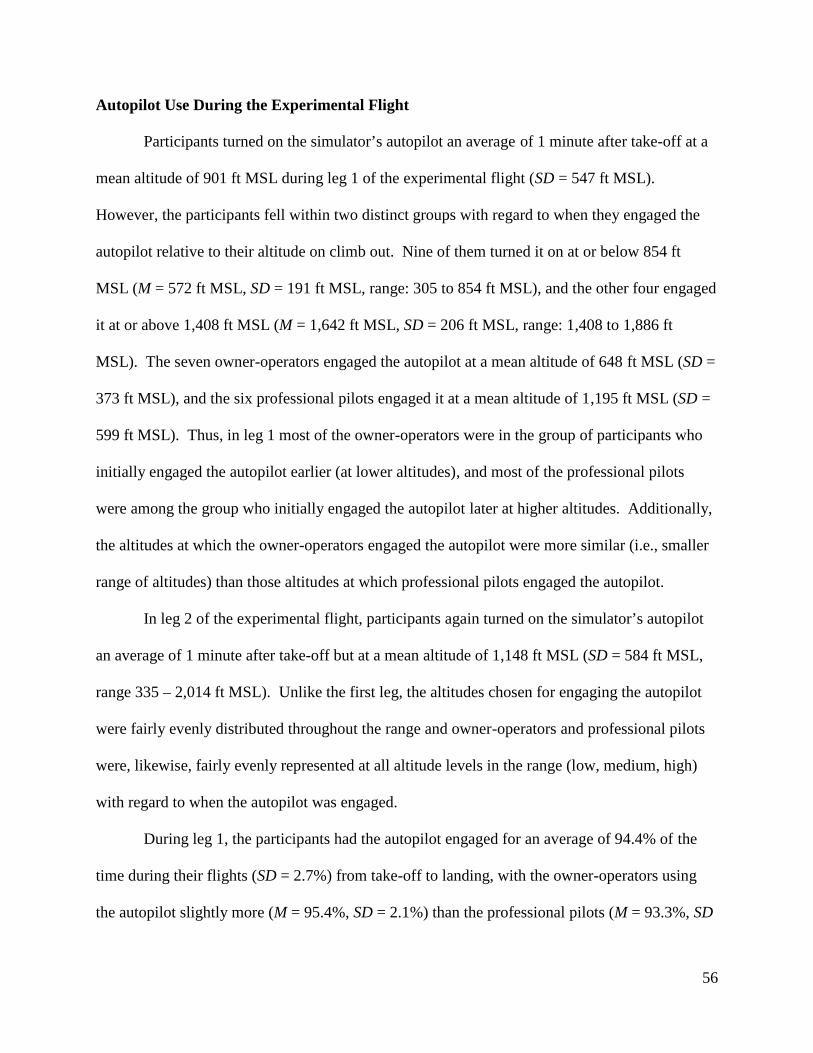
56
Autopilot Use During the Experimental Flight
Participants turned on the simulator’s autopilot an average of 1 minute after take-off at a
mean altitude of 901 ft MSL during leg 1 of the experimental flight (SD = 547 ft MSL).
However, the participants fell within two distinct groups with regard to when they engaged the
autopilot relative to their altitude on climb out. Nine of them turned it on at or below 854 ft
MSL (M = 572 ft MSL, SD = 191 ft MSL, range: 305 to 854 ft MSL), and the other four engaged
it at or above 1,408 ft MSL (M = 1,642 ft MSL, SD = 206 ft MSL, range: 1,408 to 1,886 ft
MSL). The seven owner-operators engaged the autopilot at a mean altitude of 648 ft MSL (SD =
373 ft MSL), and the six professional pilots engaged it at a mean altitude of 1,195 ft MSL (SD =
599 ft MSL). Thus, in leg 1 most of the owner-operators were in the group of participants who
initially engaged the autopilot earlier (at lower altitudes), and most of the professional pilots
were among the group who initially engaged the autopilot later at higher altitudes. Additionally,
the altitudes at which the owner-operators engaged the autopilot were more similar (i.e., smaller
range of altitudes) than those altitudes at which professional pilots engaged the autopilot.
In leg 2 of the experimental flight, participants again turned on the simulator’s autopilot
an average of 1 minute after take-off but at a mean altitude of 1,148 ft MSL (SD = 584 ft MSL,
range 335 – 2,014 ft MSL). Unlike the first leg, the altitudes chosen for engaging the autopilot
were fairly evenly distributed throughout the range and owner-operators and professional pilots
were, likewise, fairly evenly represented at all altitude levels in the range (low, medium, high)
with regard to when the autopilot was engaged.
During leg 1, the participants had the autopilot engaged for an average of 94.4% of the
time during their flights (SD = 2.7%) from take-off to landing, with the owner-operators using
the autopilot slightly more (M = 95.4%, SD = 2.1%) than the professional pilots (M = 93.3%, SD

57
= 3.0%). The flights, from take-off to landing, lasted an average of 50.2 minutes (SD = 3.81
minutes) with the average length of the flights flown by the owner-operators and the professional
pilots being almost exactly the same.
During leg 2, the participants had the autopilot engaged for an average of 94.9% of the
time during their flights (SD = 1.6%) from take-off to landing, again with the owner-operators
using the autopilot slightly more (M = 95.7%, SD = 0.5%) than the professional pilots (M =
93.7%, SD = 1.9%). From take-off to landing, the leg 2 flights lasted an average of 57.11
minutes (SD = 4.93 minutes). When the two pilots who did not complete a missed approach
procedure at KHSP are removed, the average length of the leg 2 flights rises to 58.92 minutes
(SD = 2.82 minutes), with the professional pilots (M = 57.58 minutes, SD = 1.43 minutes)
generally completing the leg only slightly faster than the owner-operators (M = 59.81 minutes,
SD = 3.28 minutes).
Analysis of Workload and Task Management of Four En Route Events
Due to time and resource limitations, we focused our analyses on four events in the two
experimental flights that were specifically scripted to involve high pilot workload. In the first
leg from KTEB to KMTN, the two events subjected to detailed scrutiny were 1) the instruction
from ATC to intercept the 208o Broadway (BWZ) radial following the completion of the
departure procedure out of KTEB and 2) programming a reroute while at cruise and meeting a
waypoint crossing restriction on the initial descent from cruise. In the second leg from KMTN to
KHSP, we focused our analyses on 3) the completion of an expedited descent to accommodate
another aircraft with an emergency, and 4) task completion and preparation for the approach into
KHSP while facilitating communication from a lost pilot who was flying too low for ATC to
hear.

58
Below are the findings of the analyses associated with these four events, individually, as
well as a review of some overall findings across the two experimental legs. Due to the very
small number of participants in our study, we were unable to generate sufficient statistical power.
Therefore, our analyses were susceptible to type II errors, which are defined as accepting the null
hypothesis when it is in fact false—meaning that significant differences between groups may not
have been detected. Additionally, due to the small number of participants, the statistically
significant differences found among our participants, reported below, illustrate true differences
among the study participants (i.e., our sample). However, caution should be exercised when
generalizing our findings to other pilots who were not participants in this study (i.e., the
population of single pilots flying VLJs/ELJs as a whole). In describing our findings, for the most
part, we only report differences observed in the performance of owner-operators and professional
pilots if the differences were statistically significant or, in the case of frequency data, appeared to
be relatively large.
Event 1: Interception of the Broadway (BWZ) radial. Upon completing the TEB6
departure off runway 24 at KTEB, the aircraft should have been on a heading of 280o and level at
2000 ft MSL. In our scenario, the participants were then told to continue to fly at 2000 ft MSL
to accommodate crossing traffic descending into LaGuardia International Airport. At 15 nm
DME from TEB, ATC told them to “fly heading 270o to intercept the Broadway, Bravo,
Whiskey, Zulu, 208o radial to BIGGY, then as filed.” After reading the clearance back
correctly, the participants were also given the instructions to “Climb and maintain 6000, contact
New York Departure on 132.80.”
Thus, in addition to looking for the crossing traffic headed to LaGuardia, there were four
main tasks that had to be accomplished: a heading change, intercepting a radial off a VOR, a

59
climb to a new altitude, and a change in radio frequency and requirement to check in with a new
controller. The participants had to remember each of these tasks with their associated numbers
(heading, radial, altitude, frequency) and consider how to accomplish them and in what order.
Three of the tasks (change in heading, altitude, and frequency) are commonly performed during
IFR flight, and each can be accomplished fairly quickly by proficient pilots. Therefore, we
thought it likely that the subtasks required for each would be completed in their entirety before
moving on to those associated with a new task, rather than interleaving them across the three
tasks. For example, we expected that a pilot would verify the radio in use and then switch to
another task, such as dialing in a new heading, before going back to the original task and dialing
in the new radio frequency. However, one exception to our expectation that these three tasks
would be performed sequentially, rather than interleaved, was that we thought some pilots, after
having changed to the new radio frequency, might choose to complete other tasks, such as
dialing in the new altitude and initiating the climb to 6000 ft, prior to checking in with the new
departure controller.
The fourth task in this clearance, intercepting the BWZ radial, is quite different from the
other three tasks with regard to its cognitive and temporal demands. There are a number of ways
to accomplish a radial intercept using the G1000, although none of them is as simple as pressing
a button or two or locating the option in a dropdown menu. As a consequence, the participants
had to consider how to use the automation, if at all, to complete an unexpected task, which is
relatively uncommon. The three most likely strategies pilots were expected to employ to
accomplish this task using the G1000 are presented in Table 6.

60
Table 6
Expected Strategies for Programming the BWZ Radial Intercept
Using the GPS OBSFunction
While in heading mode, bring up the flight plan
Select (highlight) BIGGY on the flight plan
Press the Direct button and press Enter
Select OBS function using the OBS soft key on thePFD
Turn the CRS knob to select 208o
After the G1000 displays the course, select NAV modeon the autopilot
Altering the Flight Plan While in heading mode, bring up the flight plan
Select (highlight) BIGGY on the flight plan
Enter BWZ, which inserts BWZ prior to BIGGY on theflight plan
Select (highlight) BIGGY on the flight plan
Press the Menu button
Select Activate Leg and press Enter
Select NAV mode on the autopilot
Using VOR Navigation While in heading mode, dial in the frequency for theBWZ VOR (114.2) in a nav radio (1 or 2) and make itthe active nav frequency
Press the CDI button on the PFD to switch to theappropriate VOR (1 or 2) to match the nav radio withthe BWZ VOR frequency (1 or 2)
Set the OBS to 208o on the CDI
Select NAV mode on the autopilot
In the first strategy, OBS function in the G1000 is used in conjunction with the selection
of the BIGGY waypoint and the desired arrival course. In the second strategy, the pilot alters the
flight plan by entering the BWZ VOR prior to BIGGY, thereby creating a flight plan leg to
intercept. The third strategy duplicates traditional navigation to VOR radials using the CDI and
the HSI display on the PFD. The first two require an understanding of unique G1000

61
functioning (the first: OBS function with NAV mode, and the second: altering a flight plan)
whereas the third strategy requires knowledge of how to set up the G1000 to navigate using
ground-based navaids. The steps for the third strategy are not that different from those for VOR
navigation in aircraft without glass cockpits and advanced avionics.
Unscripted flight director failure. Flight simulators are notoriously challenging to work
with in research settings. Inaugural studies, such as ours, tend to reveal completely unexpected
behaviors. Despite pre-study preparations, including multiple shakedown runs, a malfunction
manifested itself within the first week of data collection in the form of a flight director (FD)
failure. As the aircraft approached maximum operating velocity (Vmo) or “redline” on the
airspeed indicator, the FD began to bounce up and down in an unpredictable fashion.
Subsequent observation of the video showed that the degree of amplitude appeared to be within
± 10 degrees of the horizon. The MAXSPD flag above the airspeed indicator tape also flashed
intermittently. This problem was evident from time to time throughout the experimental flights,
typically recurring whenever the pilot used the autopilot (AP) in vertical speed (VS) mode.
However, it was only a significant issue affecting participant performance during the departure
and initial climb out from KTEB.
Several pilots who experienced this behavior actually stated out loud that they had an AP
failure or a problem with their FD. The majority of pilots who experienced this malfunction
immediately came “out of role” and asked the researchers if the failure was intentional; they
were told that it was not. Unfortunately, this malfunction added a significant amount of
distraction to the challenges of flying an already difficult departure procedure. Many pilots
chose to focus on trying to solve this problem either by themselves, while staying in role as a
pilot subject, or out of role in conversation with researchers seated at the experimenter station.

62
Despite attempts to resolve the FD problem, such as AP disengagement/reengagement
and mode changes, none were successful and, in hindsight, actually only served to further
confuse the issue. Halfway through data collection, we postulated that the tailwind experienced
on climb out might somehow be confusing the program logic to thinking that the aircraft was
beyond Vmo when it was in fact still below. We removed the wind programming from the takeoff
and climb out segment, noted a cessation of the erroneous FD/AP behavior, and believed we had
solved the issue. However, only after the study was completed did we discover that the FD was
responding correctly to an incorrect “gain” related to an unintentional turbulence setting. This
increased gain manifested itself by producing a very high vertical turbulence component. As
such, the FD was trying to manage this exaggerated component while maintaining congruence
with the modes and values selected on the autopilot control panel.
Because of the significant challenge produced by this apparent malfunction, many pilots
were unable to control the aircraft and still adhere to the requirements of the departure out of
KTEB or sustain a level of flight precision as described in the practical test standards for ATP.
However, in all cases the pilots remained focused on the number one priority of flying the
aircraft and several advised ATC of their situation and requested help in the form of vectors or a
change in altitude.
Of the eight participants who experienced the unscripted FD failure, four (three owner-
operators and one professional pilot) encountered quite a bit of difficulty in managing the failure;
the other four (two owner-operators and two professional pilots) managed the failure fairly well,
although all eight committed errors of various types during the event (discussed later). All four
pilots who had significant difficulty with the failure, one who managed the FD failure fairly well,
and one who did not experience the failure at all (n = 6) were unable to successfully accomplish

63
the major task during this first event (i.e., set up to intercept the BWZ 208o radial). All of the
other participants, three with the FD failure and four without it, successfully accomplished the
Event 1 task (n = 7). Detailed descriptions of participant performance and completion of tasks in
Event 1 follow.
Overall flight performance during Event 1. The initiation of this event began when the
pilots leveled out at 2,000 ft MSL at the completion of the TEB6 departure procedure and ended
when the aircraft was 30 nm from the TEB VOR and the participants were given the clearance
from ATC to fly direct to BIGGY. The amount of time the event lasted was associated with the
speed with which the participant was flying and ranged from 03:01 to 06:02 (M = 04:51, SD =
01:08). Those who successfully accomplished the task took an average of almost five minutes to
do so (M = 04:59, SD = 0:22, range = 04:42 to 05:39).
Although the workload during this event was high, and even more so for those
experiencing the unscripted FD failure, most flew the aircraft within the parameters expected of
experienced pilots. All participants maintained engine interstage turbine temperature (ITT)
below the limit of 830o, responded to all radio calls from ATC, achieved the heading turn to
270o, and climbed to 6,000 ft MSL. No one forgot to raise the gear or retract the flaps, no
excessive yaw was observed, and only one pilot had pitch inputs that exceeded 16o nose up
(25.91o nose up). Those whose performance on a particular parameter exceeded what might be
expected were typically those dealing with the FD failure. For example, pilots began the event
on a heading of 280o and were instructed to turn left to a heading of 270o by ATC during the
event; four of the five pilots who exceeded 30 degrees of bank were dealing with the FD failure
and did so while actually correcting to the right. Similarly, two of the three pilots whose vertical
speed during the event exceeded 3,500 fpm. (5,399 and 8,766 fpm) had the unscripted failure.

64
It was obvious that the unscripted FD failure was a distraction that was likely associated
with the (sometimes significantly) diminished performance of a few pilots; however, while
addressing the problem, none of them flew the aircraft in a way which put them in danger with
regard to loss of control. Nonetheless, heading and altitude excursions were common and
several errors or difficulties were observed such as reporting their heading to ATC incorrectly,
readback errors, dialing in the wrong communication frequency, neglecting to check in with a
new controller, forgetting to select/enter a vertical or lateral mode, and keeping the autopilot
engaged and/or leaving the FD on while hand flying during response to the FD failure (see Table
7 for a list of all errors observed during Event 1).
Additionally, the ability to accomplish the overall task (set up the aircraft to intercept the
BWZ 208o radial to BIGGY) was seriously compromised for a few participants with the FD
failure due to task saturation (n = 5). Even so, four of those participants appropriately attempted
to reduce the workload associated with this task by requesting vectors from ATC. Most
participants with the FD failure maintained their overall composure and professionalism,
including during radio calls to ATC, and at no point during their difficulties did any participant
give up or stop trying to fly the simulator.
Eleven participants used only the Com 1 radio, one participant used only the Com 2
radio, and one participant alternated between Com 1 and Com 2 radio for all communications
with ATC during this event. One participant who used only the Com 1 radio had the emergency
frequency (121.5) dialed into the Com 2 radio but was not monitoring the frequency. During the
event, participants were instructed to change frequency and check in with a new departure
controller. Many participants dialed in the new frequency as it was being given but took

65
between 10 s and 2 min.10 s from the end of the clearance until actually contacting the new
controller (M = 00:52, SD = 00:40 , median = 00:36).
Eleven participants also entered in the new heading of 270o while ATC was giving the
clearance so that their aircraft had already initiated the turn before communication with ATC was
completed. The other two participants, both professional pilots, initiated the turn to the new
heading 3 s and 10 s after the end of the radio call with ATC. The amount of time from the end
of ATC’s request that the aircraft climb to 6000 until the climb was initiated ranged from 4 to 51
s (M = 00:22, SD = 00:15, median = 00:21); The professional pilot who took 51 s to initiate his
climb had not set up the automation correctly and did not catch his error until contacted by ATC
about his failure to climb as directed.
Observable errors committed during the event are shown in Table 7. All pilots made at
least one error during the event, although one professional pilot made only one error (exceeded
200 KIAS under the Class B veil for 10 s). All other participants made two or more errors
during the event. An owner-operator who was dealing with the FD failure committed the
greatest number of errors, including various airspeed violations (n = 9).

66
Table 7
Errors1 Committed During High Workload Event 1
AllParticipants
(n=13)
Owner-Operators
(n=7)
ProfessionalPilots(n=6)
UnscriptedFD Failure
(n=8)
No FDFailure(n=5)
Exceeded Vmo 3 2 1 2 1
>200 KIAS below Class Bveil
7 3 4 3 4
>250 KIAS in Class B 2 2 0 2 0
>200 KIAS in Class D 7 4 3 3 4
Leveled off at incorrectaltitude
2 1 1 1 1
Incorrect heading (<3o) 6 3 3 2 4
Incorrect heading (>10o) 6 4 2 5 1
Forgot to check in withDeparture ATC
2 1 1 1 1
Comm/readback errors2 17 7 10 11 6
Wrong ATC frequency 1 1 0 1 0
Wrong Nav radio selected 1 1 0 1 0
Lack of sufficient thrust forclimb
2 2 0 2 0
Forgot to climb 1 0 1 1 0
Vertical mode errors 2 1 1 1 1
Lateral mode errors 4 3 1 3 1
Does not/delays disconnectAP with FD failure
2 2 0 2 0
Reverse sensing whensetting up OBS
1 1 0 1 0
Total errors 66 38 28 42 24
Average error rate perparticipant
5.08 5.43 4.67 5.25 4.80
1 “Errors” includes only those that were observable and does not include some difficulties with flight pathmanagement described elsewhere in this report.
2 Number of communication (e.g., reports on wrong heading) or readback errors over a total of 10 pilots

67
A factorial MANOVA was conducted and no significant differences in the number of
errors committed during Event 1 were found between owner-operators and professional pilots,
F(1,10) = 2.27, p = .16, or between those who did and did not experience the FD failure, F(1,10)
= 1.37, p = .27. Although no significant interaction effect between pilot type and experience
with the FD was found, Wilk’s λ = .84, F(2,8) = 0.78, p = .49, it should be noted that a greater
number of owner-operators (n = 5) were confronted with the FD failure than were professional
pilots (n = 3). Table 7 reveals that airspeed violations in different types of airspace and small
heading errors (less than 3o) were fairly prevalent, even among those participants who did not
experience the FD failure. Most of the other errors associated with flight path management (i.e.,
lack of sufficient thrust to climb, vertical and lateral mode errors) as well as most readback or
communication errors with ATC were not present in flights without the unscripted failure.
Automation use, flight path management, and the BWZ radial intercept. All G1000
inputs were made without hesitation and only one input error, which was quickly corrected, was
observed during the event. All pilots had turned their autopilots on prior to the start of this event,
but two pilots who were dealing with the unscripted FD failure had the autopilot turned off when
the event began and two others, also dealing with the failure, had it on but turned it off not long
after the event began. Five participants, four of whom experienced the FD failure, had the FD
engaged when the AP was not also engaged at some point during this event. Three of these
pilots, including the one who did not have the FD failure, had the FD displayed but it was not
programmed. Consequently, the FD was prompting flight control inputs that differed
substantially from those actually being made. This FD behavior could be distracting and
potentially dangerous. One participant with the FD failure attempted to get the displayed, but
unprogrammed, FD to match his control inputs by changing his VS climb rate.

68
One pilot left the AP engaged and another was slow to disengage it when the FD failure
problems were encountered. Although no Cessna Citation Mustang emergency or abnormal
checklist for a FD failure existed when this study was conducted, disengaging the AP when the
FD has failed is necessary so that the AP does not follow erroneous FD data. All pilots who
turned off the AP while responding to the unscripted failure, turned it back on within a few
minutes of experiencing the failure and were able to use the AP and FD fairly uneventfully for
the remainder of their flights even though the FD failure momentarily reappeared on occasion.
At the initiation of this event (level off at 2,000 ft MSL), 12 pilots had heading mode
engaged and one was using NAV mode. The sequence of lateral and vertical modes used by
pilots during this event can be seen in Tables 8 and 9.
Table 8
Sequences of Lateral AP Modes Used by Participants During Event 1
Lateral ModeSequences1
AllParticipants
(n=13)
Owner-Operators
(n=7)
ProfessionalPilots(n=6)
HadUnscriptedFD Failure
(n=8)
Successfullyset up BWZ
radialintercept
HDG 4 3 1 3 no
HDG-NAV(GPS) 3 1 2 2 yes
HDG-NAV(GPS)-ROL
1 1 0 1 no
NAV(GPS)-HDG-ROL-HDG
1 1 0 1 no
HDG-NAV(VOR) 3 1 2 1 yes
ROL-HDG-NAV(GPS) 1 0 1 0 yes
1 HDG=Heading mode, NAV=Navigation mode, ROL=Roll mode, GPS=navigation signal provided byglobal positioning satellites, VOR=navigation signal provided by very high omnidirectional radio range

69
Table 9
Sequences of Vertical AP Modes Used by Participants During Event 1 Climb
Vertical ModeSequences1
AllParticipants
(n=13)
Owner-Operators
(n=7)
ProfessionalPilots(n=6)
Had UnscriptedFD Failure
(n=8)
VS 7 3 4 6
FLC 3 2 1 0
VS-FLC 2 1 1 1
VS-PIT 1 1 0 11 VS=Vertical Speed mode, FLC=Flight Level Change, PIT=Pitch mode
The rate of climb selected by those participants who used VS mode for all or part of the
climb from 2,000 to 6,000 ft MSL ranged from 300 fpm to 2,700 fpm; four participants set the
rate of climb at just one value during the event (300 fpm, 1,000 fpm, 2,000 fpm, and 3,000 fpm),
whereas seven participants set the initial rate of climb and then adjusted it higher once (n = 6) or
even twice (n = 1) when dissatisfied with the climb performance. One participant selected 300
fpm and only increased to 400 fpm but the other six initially selected a much higher rate of climb
(range = 1,200 to 3,000 fpm, M = 1,700 fpm, SD = 699 fpm) and increased the rate of climb an
average of 700 fpm (SD = 255 fpm, range = 2,000 to 2,700 fpm).
When FLC was used to accomplish all or part of the climb from 2,000 to 6,000 ft MSL,
the five participants utilizing this mode selected airspeeds ranging from 171 KIAS to 219 KIAS
(M = 195 KIAS, SD = 22 KIAS).
Findings in Table 7, presented earlier, suggest that several of the automation errors
committed during this event may have been at least partly associated with the very high
workload experienced by pilots during the unscripted FD failure. These errors included such
things as forgetting to engage the NAV mode after setting up the avionics for the BWZ radial
intercept, selecting VS for the climb but neglecting to set the number of feet per minute at which

70
to climb, or forgetting to select a vertical or lateral mode entirely. Four participants (two with
and two without the FD failure) demonstrated very poor flight path control while in manual
flight such as inability to maintain straight and level flight—multiple descents, climbs, and
lateral deviations were common.
As described above, we expected that one of three strategies would be used by pilots to
accomplish the task of setting up the aircraft to intercept the BWZ 208o radial. Table 10
indicates the strategies actually employed.
Table 10
Strategies for Setting up the BWZ 208o Radial Intercept
AllParticipants
(n=13)
Owner-Operators
(n=7)
ProfessionalPilots(n=6)
Experienced FDFailure(n=8)
Used the GPS OBSfunction
1 0 1 0
Altered the flight plan 3 1 2 2
Used VOR navigation 3 1 2 1
Never attempted or didnot complete task
6 5 1 5
Seven participants completed the task successfully. However, two first made errors they
later corrected. The first was a professional pilot who originally tried to go direct to BWZ but
realized it was an error after the aircraft turned toward BWZ; he then successfully accomplished
the task by using the GPS OBS function. The second was an owner-operator who set up the
automation to intercept a course line between BIGGY and a waypoint that followed in the flight
plan (COPES). ATC cleared him back to a heading of 270o and the pilot realized his mistake
and altered his flight plan by inserting BWZ prior to BIGGY. The shortest amount of time
required for programming was 51 s for a professional pilot who altered his flight plan. The
longest amount of time needed for programming was 05:11 by an owner-operator who also

71
altered his flight plan but interleaved a number of other tasks (e.g., dialing in 6000 ft climb)
while doing so. The median time required for successfully completing this task was 01:07
(excluding the participant who took the longest: M = 01:10, SD = 00:40).
As stated earlier, six participants were unsuccessful in completing the task. Five of them
had the unscripted FD failure (though three who were successful also had FD failure problems).
Two of the six unsuccessful participants attempted to use VOR navigation; one forgot to
complete the final step of selecting NAV on the AP panel and the other was not able to finish
configuring the avionics because of the high workload associated with the FD failure. Another
participant programmed direct to BIGGY rather than setting up for the BWZ radial intercept.
When ATC queried about the aircraft’s heading the pilot was unable to respond and correct due
to high workload. The other three unsuccessful participants appeared cognitively saturated with
the failure and either never attempted or did not have a chance to attempt to complete the task;
all three did request vectors direct to BIGGY though, as did one other who was unsuccessful in
completing the task and was dealing with the FD failure.
To summarize, over half of the participants (n = 8) were initially unsure as to how to
accomplish the clearance to intercept a VOR radial using the G1000. After first making an error,
two corrected and adopted a successful strategy; one attempted a correct strategy but did not
engage the correct AP mode so was ultimately unsuccessful. Five participants were task
saturated in dealing with the unscripted FD failure and were also unsuccessful in completing the
task although four did ask for vectors in an attempt to comply with the clearance.
Aircraft and FAR limitations. While addressing the unscripted flight director failure,
three pilots exceeded the aircraft maximum operating speed (Vmo), one of them on two separate
occasions 90 s apart. Three of these excursions were momentary lasting 6 s or less but the fourth

72
lasted 24 s. Surprisingly, all participants except for one, an owner-operator who experienced the
FD failure, also violated various airspeed limitations relative to airspace or altitude during this
event: two exceeded 250 KIAS while in class B airspace and below 10,000 ft MSL, seven
exceeded 200 KIAS while flying under the class B veil, and seven exceeded the 200 KIAS speed
restriction while flying through Morristown New Jersey’s class D airspace on their way to
intercepting the BWZ radial to BIGGY. Four participants violated two different types of
airspace speed restrictions. Three of the airspace speed violations only lasted between 10 and
20 s. Table 7, presented earlier, summarizes the various types of speed violations committed by
participants during Event 1.
Checklist and chart usage. Only one participant could be observed using a paper
checklist (most likely the climb checklist) during this event, and he appeared to either complete
or suspend it when workload increased. It is possible that some participants completed this
checklist either before or after the event, may have completed it during the event but silently
from memory (so it was not obvious that it was being performed) or forgot to complete it. Given
the high degree of workload during this event, postponing the climb checklist, if they in fact they
did postpone it, was probably a good decision in terms of prioritizing tasks. This was
particularly true for those participants who also had the unscripted flight director failure.
During this event, four participants referred to paper en route charts, at least two referred
to charts on Apple iPads™ they had brought with them, and four appeared to only be referring to
the MFD with regard to confirming their position and/or the location of the BWZ VOR and its
NAV frequency.
Pilot demeanor and general workload management. A majority of the pilots displayed
very professional behavior and appeared relaxed, confident, and calm during the event—even the

73
eight who experienced the unscripted FD failure. Nonetheless, it was clear that instrument scan
tended to break down for those experiencing the FD failure, and one owner-operator in particular
focused intently on something on the PFD and experienced significant altitude and heading
excursions in manual flight while doing so. A few others with the FD failure also displayed
some signs of stress such as rocking back and forth in the seat and pressing on the right rudder
pedal, causing a significant slip, as indicated by the slip/skid indicator.
An owner-operator wrote down the clearance to intercept the BWZ 208o radial when
ATC first gave it—the only participant to do so; seven participants asked for the clearance to be
repeated and five of them wrote it down during that repetition. The two participants who did not
write down the repeated clearance appeared task-saturated with the FD failure and were two of
the four participants who requested radar vectors instead. Only one of the participants who
experienced a FD failure and was not successful in setting up the BWZ 208o radial intercept did
not request radar vectors.
All of the participants during this event employed a workload management strategy
characterized by quickly completing common tasks that involved few steps and taking care of
those that required more thought and/or effort later. For example, 11 of the 13 pilots dialed the
new heading of 270o as the controller gave the clearance to turn so that the aircraft, which were
all in heading mode, had already begun the turn to the new heading by the end of the radio call.
Similarly, several pilots entered 6,000 ft in the altitude reference window as ATC was issuing the
clearance to climb. However, there was a longer delay in pilots actually initiating the climb (M =
00:22, SD = 00:15) as a vertical mode had to also be selected, which some did after
accomplishing other tasks (or forgot to do, in the case of two participants). Interestingly, a few
pilots read components of ATC clearances back not in the order that they were given by ATC,

74
but in the order in which they intended to, or had already started to, complete the tasks. For
example, when ATC said “Climb and maintain 6000, Contact New York Departure on 132.80”
several participants read back the new frequency first, as they were dialing it into the standby
radio, and then the clearance to climb to 6000 ft.
The most time-consuming discrete task during Event 1 was setting up the aircraft to
intercept the BWZ 208o radial.2 All pilots who used or attempted to use one of the three
strategies identified earlier to accomplish this task outlined earlier did so by interleaving other
tasks or subtasks. Some of these other subtasks pertained to initiating the climb or adjusting the
rate of climb, making the radio call to check in with the new departure controller, dealing with
aircraft anomalies associated with the FD failure, and scanning the cockpit instruments, among
others. When interleaving subtasks in this way, pilots must recall what steps they have and have
not yet accomplished for the various tasks under completion. Distractions, poor concentration,
and poor memory can impair the ability to keep track of task status. Apparent problems with
cognitive processing were seen in a few of the cases where pilots completed several of the
subtasks associated with a task but forgot to complete all of them, such as pressing NAV as the
final step in setting up the autoflight system or by selecting VS mode but not entering in a rate of
climb. One participant, in particular, chose somewhat unusual places to segment tasks into
subtasks and this may have contributed to errors he made in completing some of them. For
example, he started to dial in a new altitude to climb to but stopped before it was fully entered
and then switched to typing in the first letter of the BWZ VOR in his flight plan but then
switched to a third task before the entire VOR name had been entered.
2 A discrete task is one which involves one or more steps which, once accomplished, mark the end of that task. Incontrast, continuous tasks are those whose steps must be repeated over and over again throughout a particular phaseor flight. Changing a radio frequency is a discrete task; monitoring cockpit instruments is a continuous task.

75
Workload strategies employed by some of those who were faced with the unscripted FD
failure included interleaving of tasks but also included attempting to lessen the amount of work
associated with accomplishing a task, such as asking ATC for vectors instead of trying to
program the G1000 for the BWZ radial intercept. A few of these participants also clearly shed
tasks, such as simply acknowledging ATC’s call of crossing traffic rather than also looking for it
on cockpit traffic displays. Those who were most task-saturated with the FD failure focused
appropriately on maintaining aircraft control and shed varying amounts of other tasks associated
with ATC clearances. However, in some cases it was more likely a case of forgetting to
accomplish some step (e.g., neglecting to press the flip-flop button to move the new ATC
frequency from standby to active) rather than consciously choosing not to perform it. As
described earlier, most of those experiencing the FD failure mentioned experiencing a problem
over the radio, but some of those comments were directed to the researchers rather than to ATC.
None of the participants declared an emergency or requested a hold or some other delaying tactic
from ATC to give them time to sort out the problems they were experiencing.
During the post-flight debriefing interviews, several participants said they subscribed to
the “aviate-navigate-communicate” prioritization of tasks in the cockpit and that they tried to
complete short and easy tasks first to get them out of the way. A few also said that they tried to
accomplish as many tasks as they could early in a flight to reduce the number of tasks to be
completed later.
Pilot background and experience. Table 11 presents the piloting experience of
participants who were and were not successful in setting up the G1000 to intercept the BWZ
radial and for participants who did and did not experience the unscripted FD failure.

76
Table 11
Pilot Flying History in Hours by Major Task,1 Success Status, and Experience of FD Failure
Successful(n=7)
Unsuccessful(n=6)
FD Failure(n=8)
No FD Failure(n=5)
M SD M SD M SD M SD
Gen
eral
Fly
ing
Total 4637.29a 2010.21 3254.17a 2090.03 4554.50 2338.71 3110.00 1378.59
Pastyear
302.43b 177.31 146.67b 49.67 272.88 170.76 162.80 97.40
Past 3months
62.00c 34.93 41.67c 21.60 62.00 34.88 37.60 12.70
Singlepilot jet
385.14 439.77 269.17 139.94 296.38 133.53 388.00 536.45
Cit
atio
n S
peci
fic Past
year170.43 117.69 134.17 42.48 185.88 100.04 102.20 34.53
Singlepilotpastyear
142.86 135.43 133.33 42.74 185.25 100.49 63.60 28.50
1 The major task to be completed in this high workload event was setting up the aircraft for intercepting theBWZ 208o radial.
a p = .05b p = .002c p = .03
A MANOVA was conducted and main effects were found for the total number of flight hours
accrued, F(1,10) = 4.91, p = .05 , partial η2 = .33, the number of hours flown in the past year,
F(1,10) = 18.32, p = .002 , partial η2 = .65, and the number of hours flown in the previous three
months, F(1,10) = 6.36, p = .03, partial η2 = .39, on success with the Event 1 task. Not surprisingly,
pilots who had successfully completed the Event 1 task had flown a significantly greater number of hours
overall, in the past year, and in the previous three months, than those who were unsuccessful. This effect
was found for hours flown in all types of aircraft, not just those flown in a Cessna Citation Mustang or as

77
a jet single-pilot. Despite how disruptive the unscripted FD failure appeared to be for many participants,
the MANOVA revealed no interaction effects between having had the failure (or not) with whether or not
the pilot was successful in accomplishing the task, Wilk’s λ = .69, F(4,6 ) = 0.69, p = .63.
Table 12 presents differences among the same four subgroups in their subjective ratings
of workload as indicated by the ISA and NASA TLX measures; a MANOVA was again
conducted and no significant main effects for success, F(1,10) = 4.32, p = .06, or FD failure,
F(1,10) = 0.04, p = .86, or interaction between the two were found, Wilk’s λ = .76, F(3,7) = 0.73,
p = .57. Not surprisingly, pilots who successfully accomplished the Event 1 task rated their
performance significantly better on the NASA TLX than those who were unsuccessful, F(1, 11)
= 13.40, p = .004.

78
Table 12
ISA and NASA RTLX1 Ratings by Major Task2 Success Status and Experience of FD Failure
Successful(n=7)
Unsuccessful(n=6)
FD Failure(n=8)
No FD Failure(n=5)
M SD M SD M SD M SD
ISA Rating
Level at 2000ft plus 60 s
3.00 0.58 3.25 1.71 3.14 1.21 3.00 0.82
NASA TLXRatings - BuildCourse tointercept BWZ208o radial
MentalDemand
73.71 22.09 91.50 12.24 87.38 11.58 73.20 28.03
PhysicalDemand
38.00 31.52 61.00 36.00 45.00 27.83 54.40 45.99
TemporalDemand
80.14 12.33 85.17 21.87 81.38 16.89 84.20 18.46
Performance3 34.71a 28.67 86.33a 20.66 67.88 28.17 43.60 45.57
Effort 70.86 18.72 86.00 19.52 81.25 16.31 72.40 25.73
Frustration 49.71 27.63 72.83 29.88 63.63 24.37 55.20 39.98
AverageRTLX ratingfor event
57.86 18.15 80.47 19.36 71.08 14.01 63.83 31.49
1 Analyses were performed using raw TLX (RTLX) ratings rather than weighted ratings.2 The major task to be completed in this high workload event was setting up the aircraft for intercepting the
BWZ 208o radial.3 Reverse Scored so direction is consistent with all ratings of other subscales (low numerical rating = lower
perception of workload demand). With reverse scored performance ratings, low ratings indicate betterevaluations of one’s performance.
a p = .004
Event 2: Reroute and descent to meet a crossing restriction at a waypoint. The
second high workload event involved programming and performing a reroute while en route to
Martin State. Rerouting the aircraft requires the pilot to remember the new routing instructions
from ATC, readback the instructions correctly, and select a strategy to enter the route

79
instructions into their flight plan on the MFD while maintaining situation awareness and control
of the aircraft. Imbedded in these tasks is the need to comprehend where the new routing will be
taking the aircraft, so pilot knowledge of the location of waypoints and navaids included in the
new routing is also required. Clearly, participants who were unfamiliar with the Northeast
corridor and the various waypoints and navaids there would be at a disadvantage, even though
we allowed all participants as much time as they desired for their pre-flight briefing.
We asked participants to reroute from their original flight path that led from Teterboro,
NJ (KTEB) to Martin State Airport (KMTN), just outside of Baltimore, MD. The original
routing included in their pre-departure clearance was “Teterboro 6 departure, radar vectors,
BIGGY, J75, MURPH, Baltimore direct.” When programming in the clearance, the G1000
would have automatically populated all of the intermediate waypoints and navaids between
BIGGY and MURPH on J75 on their flight plans: BIGGY, COPES, Modena VOR (MXE),
STOEN, SACRI, and MURPH.
In Event 2, when the participants reached COPES, they were contacted by ATC and
given the following reroute: “Citation XXXX is now cleared to Martin State Airport via J75,
Modena, direct Dupont, Victor 214 to KERNO, direct JUGMO, direct Martin State.” Only 18.6
nm separates COPES and MXE, where participants would now need to turn toward the Dupont
(DQO) VOR instead of proceeding straight on J75 to STOEN.3 Further adding to their
workload, when participants read the reroute clearance back correctly to ATC, they were
provided the additional clearance to “cross Dupont at or below 17,000, maintain 12,000.”
The most efficient programming strategy is to quickly input DQO as the waypoint after
MXE (MXE should already be in the flight plan). The aircraft will turn when reaching MXE
3 According to ATC SMEs we consulted during the design phase of this study, 19 nm is about the minimum amountof distance most controllers would require when giving a reroute clearance necessitating a close turn off the originalrouting.

80
thereby giving the pilot enough time to enter in the rest of the reroute instructions, including the
crossing restriction, into the flight plan. Pilots should erase the original waypoints that are no
longer appropriate. Presuming that not too much time is required to delete old waypoints and/or
add new ones with the crossing restriction, the order in which these two subtasks are
accomplished can vary as long as DQO has already been entered in the flight plan so the aircraft
makes the required turn at MXE. This strategy optimizes the use of the automation, keeps the
aircraft safely within the bounds of the revised ATC instructions, and minimizes the need to hand
fly the aircraft.
Most of our participants attempted to use this approach, though with substantial variation
in success. Five programmed the reroute and met the crossing restriction without difficulty. The
other eight participants experienced a variety of problems including continuing to STOEN or
some other waypoint along the original route and/or not making the crossing restriction at DQO.
Detailed descriptions of pilot performance of the Event 2 tasks are provided below.
Overall flight performance during Event 2. When the pilots were given their reroute
instructions they were cruising at an altitude of 20,000 ft MSL and had standard barometric
pressure (i.e., 29.92) in the altimeter. Their descent to meet the 17,000 ft crossing restriction at
DQO took them through transition altitude and required changing to a local altimeter setting.
Although all but two pilots read the barometric information back correctly to ATC, eight
participants did not set the barometer to the local setting until quite some time after they passed
through the transition altitude, and three did not set it at all during the event. Only two pilots set
the barometric pressure before they passed through transition altitude.
Automation use, flight path management, and the reroute with a crossing restriction.
ATC called to provide the pilots with their reroute instructions as they were crossing COPES and

81
en route to MXE, a distance of 18.6 nm. One professional pilot had significant difficulty with the
rerouting and did not cross DQO. ATC repeated the reroute clearance three times before he had
it copied correctly, 8.3 nm away from MXE. He then copied the DQO crossing restriction
placing him 5 nm and 54 s away from the turn at MXE. Time spent referencing a paper chart
and a programming error (entering MXE which was already listed in the flight plan) resulted in
his missing the turn to DQO and continuing straight toward STOEN, an error that he did not
identify until 20 s later when he was 6.2 nm from STOEN.
Unfortunately, his situation was not that unusual. In our observation, one of the critical
factors for correctly navigating the reroute was to quickly enter DQO as the next waypoint.
When that was not accomplished quickly, it often set off a chain of delays and mistakes in
programming or flying the reroute. Five of the participants did not enter DQO as the next
waypoint after MXE until they had already passed MXE and continued toward STOEN. One of
the five, a professional pilot, actually arrived at STOEN before turning toward DQO; he traveled
7.5 nm in the wrong direction. It was not until ATC had instructed him to “turn left to 120,
direct to Dupont, now” that he was able to get back on the correct routing. None of the other
four pilots was able to correctly enter all the new waypoints in the reroute instructions though
they did eventually arrive at DQO.
The distance from MXE at which participants properly understood the reroute clearance
was critical in their ability to enter DQO into their flight plan in time to stay on course. Pilots
who had problems entering DQO before arriving at MXE understood the clearance correctly
when they were a mean distance of 4.5 nm from MXE. In contrast, the pilots who were able to
enter DQO before arriving at MXE understood the clearance correctly at a mean distance of 10.8
nm from MXE.

82
During the post flight debriefing interview some participants reported having had
difficulty hearing ATC instructions and several, including a professional pilot who told ATC that
communications were “garbled,” requested that all or part of the reroute clearance be repeated.
Table 13 shows the distances from MXE where the pilots appeared to correctly understand the
reroute clearance and the number of times all or part of the reroute clearance was given. The
table shows little difference between owner-operators and professional pilots in their average
distance from MXE or the number of times the instructions had to be given. However, there was
far less variability for professional pilots, as compared to owner operators in their distance from
MXE where they correctly understood the reroute clearance.
Table 13
Correctly Copying Reroute Clearance
Number of timesinstructions were given
Distance from MXE (nm)
Mean Median Min Max SD Mean Median Min Max SD
Owner-operator
2.29 2 1 3 0.76 9.67 11.20 0.60 16.10 5.32
Professional 3.17 3 2 5 1.17 8.28 8.30 8.00 8.50 0.21
Overall 2.69 3 1 5 1.03 9.20 8.50 0.60 16.10 4.20
An independent samples t-test was performed to test the effect of distance from the turn
when the reroute clearance was understood on successfully programming the reroute. Data from
three participants were not included in this analysis because the time when the clearance was
correctly understood could not be determined or it was never understood correctly. Therefore,
the analysis was performed for data from three participants who passed MXE and continued
toward STOEN before entering DQO and seven who entered DQO in their flight plans prior to
reaching MXE.

83
The resultant two-tailed t-test was significant, t(8) = -2.785, p = .024, suggesting that
understanding the clearance with ample time to enter it into the flight plan is essential to the
orderly management of a flight. However, simply understanding the clearance well ahead of an
en route waypoint did not guarantee success. For example, seven of our thirteen pilots had
problems with their route of flight because of unwanted waypoints left in their flight plans after
programming the new ones for the reroute. As a consequence, they found themselves turning
toward at least one unexpected location. Another pilot selected “Direct to” CIROM, a waypoint
which was not part of either the original or revised clearance instructions. The errors identified
during the second event are summarized in Table 14. A one-way ANOVA revealed no
significant differences in the number of errors committed by owner-operators as compared to
professional pilots, F(1,11) = 0.001, p = .97.
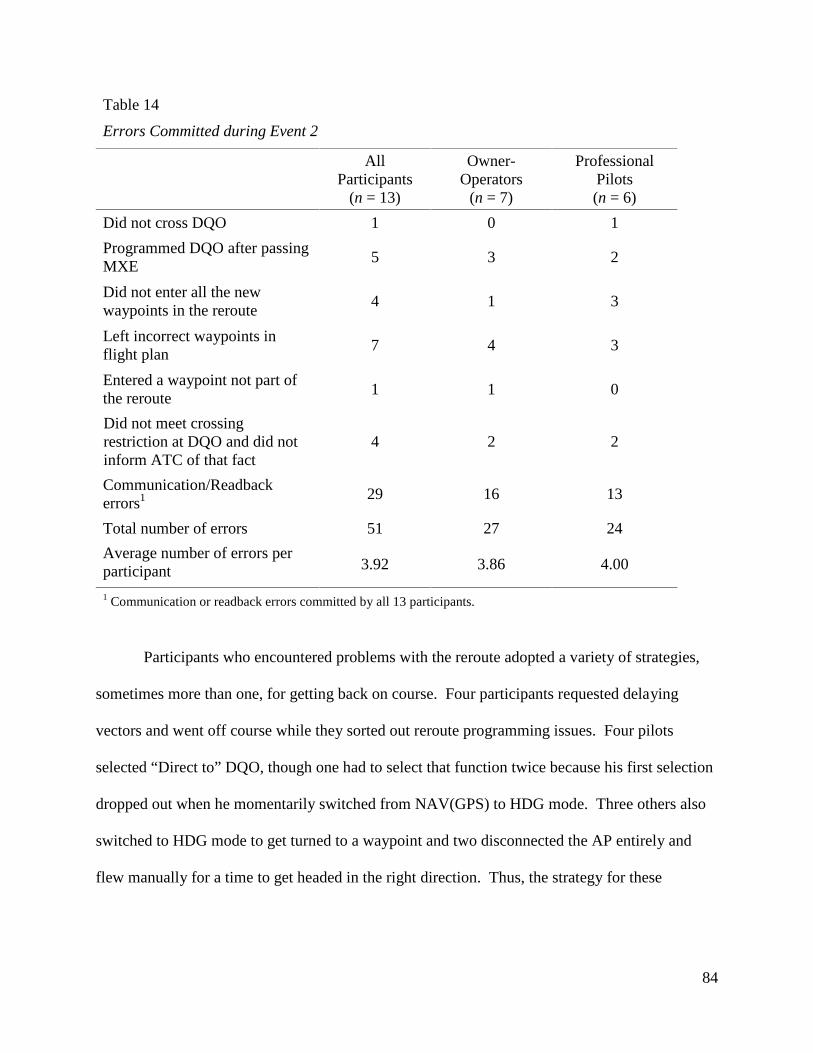
84
Table 14
Errors Committed during Event 2
AllParticipants
(n = 13)
Owner-Operators
(n = 7)
ProfessionalPilots(n = 6)
Did not cross DQO 1 0 1
Programmed DQO after passingMXE
5 3 2
Did not enter all the newwaypoints in the reroute
4 1 3
Left incorrect waypoints inflight plan
7 4 3
Entered a waypoint not part ofthe reroute
1 1 0
Did not meet crossingrestriction at DQO and did notinform ATC of that fact
4 2 2
Communication/Readbackerrors1 29 16 13
Total number of errors 51 27 24
Average number of errors perparticipant 3.92 3.86 4.00
1 Communication or readback errors committed by all 13 participants.
Participants who encountered problems with the reroute adopted a variety of strategies,
sometimes more than one, for getting back on course. Four participants requested delaying
vectors and went off course while they sorted out reroute programming issues. Four pilots
selected “Direct to” DQO, though one had to select that function twice because his first selection
dropped out when he momentarily switched from NAV(GPS) to HDG mode. Three others also
switched to HDG mode to get turned to a waypoint and two disconnected the AP entirely and
flew manually for a time to get headed in the right direction. Thus, the strategy for these

85
participants was to simplify the tools they were using and engage a “lower level” of automation
(or none at all). No one appeared to reduce their airspeed to gain more time.
The second part of the reroute clearance included a crossing restriction of 17,000 ft MSL
or below at DQO and then maintain 12,000 ft MSL. One of the methods for flying a descent is to
use the vertical path autopilot mode (VPTH). The VPTH profile optimizes the descent rate to
meet a specified altitude at a particular waypoint, making it ideal for meeting the crossing
restriction at DQO. The pilot must select the desired waypoint, enter the required altitude, and
press the VNV button on the autoflight control system (AFCS) panel.
Four of the pilots programmed a VPTH descent but one of them only used it to provide
guidance information and flew the descent using VS mode. This participant had significant
difficulty managing the reroute however, and he failed to make the crossing restriction at DQO.
Of the nine other pilots, all of whom used VS mode, three also failed to make the crossing
restriction at DQO. The mean altitude at DQO of those who did not make the crossing
restriction was 18,725 ft MSL (SD = 853 ft MSL); one pilot crossed DQO at nearly 20,000 ft
MSL. None of the four participants who failed to make the crossing restriction contacted ATC
to let them know.
Table 15 shows the descent performance of the pilots in our study. The six pilots who
used VS and made the crossing restriction did not just meet the requirement but had descended to
a mean altitude of 12,340 ft MSL at DQO, preparing them for the rest of the journey to the
Martin State Airport. On average, these pilots flew the descent more quickly, though a lower
percentage of them had disproportionate speed (i.e., 10 KIAS or more over speed at cruise),
compared to those who did not meet the crossing restriction.
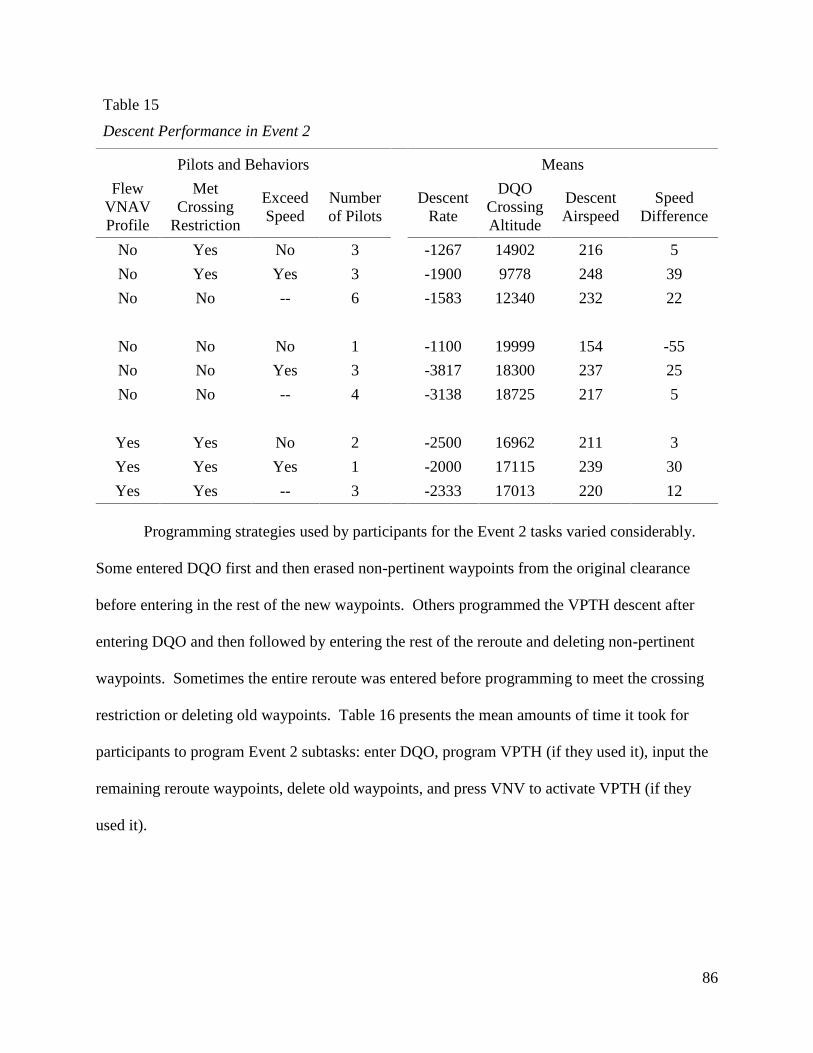
86
Table 15
Descent Performance in Event 2
Pilots and Behaviors Means
FlewVNAVProfile
MetCrossing
Restriction
ExceedSpeed
Numberof Pilots
DescentRate
DQOCrossingAltitude
DescentAirspeed
SpeedDifference
No Yes No 3 -1267 14902 216 5
No Yes Yes 3 -1900 9778 248 39
No No -- 6 -1583 12340 232 22
No No No 1 -1100 19999 154 -55
No No Yes 3 -3817 18300 237 25
No No -- 4 -3138 18725 217 5
Yes Yes No 2 -2500 16962 211 3
Yes Yes Yes 1 -2000 17115 239 30
Yes Yes -- 3 -2333 17013 220 12
Programming strategies used by participants for the Event 2 tasks varied considerably.
Some entered DQO first and then erased non-pertinent waypoints from the original clearance
before entering in the rest of the new waypoints. Others programmed the VPTH descent after
entering DQO and then followed by entering the rest of the reroute and deleting non-pertinent
waypoints. Sometimes the entire reroute was entered before programming to meet the crossing
restriction or deleting old waypoints. Table 16 presents the mean amounts of time it took for
participants to program Event 2 subtasks: enter DQO, program VPTH (if they used it), input the
remaining reroute waypoints, delete old waypoints, and press VNV to activate VPTH (if they
used it).

87
Table 16
Time required for programming reroute and descent to meet the DQO crossing restriction1
All Participants Owner-Operators Professional Pilots
N Mean SD N Mean SD N Mean SD
Total timerequired forprogramming(did notinterleaveother tasks)
2 0:02:20 0:00:45 1 0:02:52 N/A 1 0:01:48 N/A
Total timerequired forprogramming(didinterleaveother tasks)
5 0:03:31 0:01:28 3 0:03:21 0:01:49 2 0:02:57 0:01:28
1 Times were determined using data only from those participants who had successfully completed all reroute anddescent programming, including deleting old waypoints, by the time they had reached DQO.
As would be expected, on average those who interleaved other tasks while programming
(range = 01:33 to 05:04) took more time to complete the programming than those who did not
(range = 01:48 to 02:52). Interestingly, one owner-operator who used VPTH interleaved other
tasks and was the fastest in completing all of the Event 2, programming at 01:33.
Aircraft and FAR limitations. At no point in time did any participant exceed any aircraft
or FAR limitations during the second event although two owner-operators did come close to Vmo
(250 KIAS) for a period of time (247 KIAS and 249 KIAS).
Checklist and chart usage. Only one pilot was observed using a checklist (most likely
the descent checklist) and another pilot was heard verbalizing the status of the autopilot, though
no checklist was visible. The other pilots were observed with something in their lap or on the
seat next to them, which may have included a checklist, though it could not be confirmed
through the video.

88
As for charts, the one owner-operator and three professional pilots who were unable to
successfully enter the full flight plan into the MFD used paper charts while the rest (n = 9) made
extensive use of the navigation maps that are part of the G1000 MFD. Of those using the MFD
charts, five were able to complete programming the reroute at a mean distance of 8.46 nm from
DQO. Only one of these participants, a professional pilot, completely entered the reroute and
deleted all unwanted waypoints before reaching MXE. That pilot was at a distance of 19.1 nm
from DQO by the time his route was completely edited. The remaining four entered the reroute
clearance but made errors such as failing to delete waypoints from the original clearance or
neglecting to enter JUGMO
Pilot behavior and general workload management. Table 17 shows the flight
experience of participants relative to encountering problems in accomplishing the reroute and
meeting the crossing restriction at DQO.
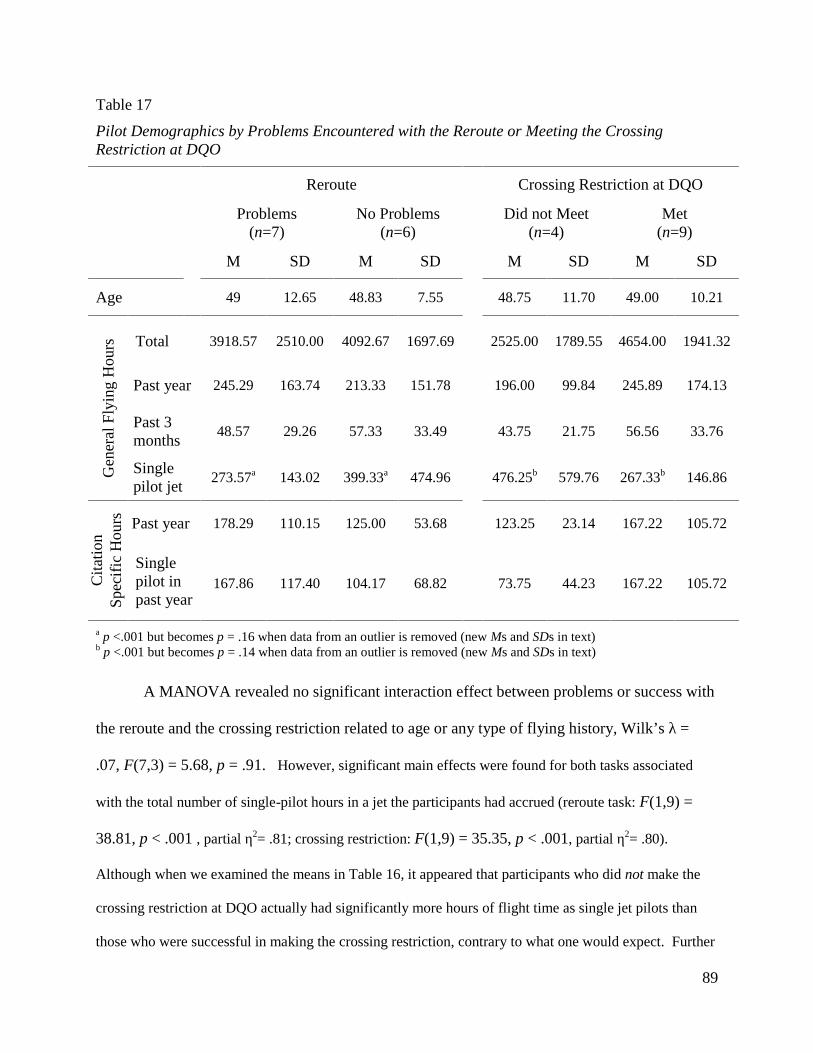
89
Table 17
Pilot Demographics by Problems Encountered with the Reroute or Meeting the CrossingRestriction at DQO
Reroute Crossing Restriction at DQO
Problems(n=7)
No Problems(n=6)
Did not Meet(n=4)
Met(n=9)
M SD M SD M SD M SD
Age 49 12.65 48.83 7.55 48.75 11.70 49.00 10.21
Gen
eral
Fly
ing
Hou
rs Total 3918.57 2510.00 4092.67 1697.69 2525.00 1789.55 4654.00 1941.32
Past year 245.29 163.74 213.33 151.78 196.00 99.84 245.89 174.13
Past 3months
48.57 29.26 57.33 33.49 43.75 21.75 56.56 33.76
Singlepilot jet
273.57a 143.02 399.33a 474.96 476.25b 579.76 267.33b 146.86
Cit
atio
nS
peci
fic
Hou
rs Past year 178.29 110.15 125.00 53.68 123.25 23.14 167.22 105.72
Singlepilot inpast year
167.86 117.40 104.17 68.82 73.75 44.23 167.22 105.72
a p <.001 but becomes p = .16 when data from an outlier is removed (new Ms and SDs in text)b p <.001 but becomes p = .14 when data from an outlier is removed (new Ms and SDs in text)
A MANOVA revealed no significant interaction effect between problems or success with
the reroute and the crossing restriction related to age or any type of flying history, Wilk’s λ =
.07, F(7,3) = 5.68, p = .91. However, significant main effects were found for both tasks associated
with the total number of single-pilot hours in a jet the participants had accrued (reroute task: F(1,9) =
38.81, p < .001 , partial η2= .81; crossing restriction: F(1,9) = 35.35, p < .001, partial η2= .80).
Although when we examined the means in Table 16, it appeared that participants who did not make the
crossing restriction at DQO actually had significantly more hours of flight time as single jet pilots than
those who were successful in making the crossing restriction, contrary to what one would expect. Further

90
analysis indicated that one participant who had no problems with the reroute but did not make the
crossing restriction had accrued an exceptionally high number of single jet pilot hours as compared with
the rest of the sample. When data from this outlier are removed, the mean number of single-pilot jet
hours of those who had no difficulties with the reroute falls to 210.20 hrs. (SD = 117.05 hrs.) and the
mean single jet pilot hours of those who did not make the crossing restriction falls to 186.67 hrs. (SD =
32.15 hrs.). Without the data from this outlier, the significant main effects found for both the reroute and
the crossing restriction relative to single jet pilot hours disappear (reroute task: F(1,9) = 2.40, p = .16 ;
crossing restriction: F(1,9) = 2.59, p = .14).
We submitted the RTLX workload ratings for the reroute and descent to meet a crossing
restriction (see Table 18) to a within-subjects repeated measures ANOVA to determine if any
construct represented by the TLX subscales was of particular importance to performing the task.
More specifically, we expected mental demand ratings to be higher than those for physical
demand. Also, since the reroute instructions had to be entered in a timely manner, the temporal
demand subscale was also expected to be higher as an indicator of time pressure. However,
using a Greenhouse-Geisser correction, no significant differences were found across the TLX
subscales for this task, F(2.334, 25.677) = 2.64, p = .083.

91
Table 18
RTLX Workload Ratings for Event 2
Flew CorrectPath
(n=6)
Flew IncorrectPath
(n=6)
Owner-Operator
(n=6)
Professional(n=6)
Mean SD Mean SD Mean SD Mean SD
NASA TLXRatings - Rerouteand descent tomeet a crossingrestriction at awaypoint
MentalDemand
50.83 17.42 55.67 26.98 54.67 27.81 51.83 16.34
PhysicalDemand
39.50 22.47 21.50 17.47 18.67 5.20 42.33 25.33
TemporalDemand
47.33 26.03 44.50 33.31 38.33 34.47 53.50 21.58
Performance 28.83 31.30 55.83 41.37 45.00 40.80 39.67 38.04
Effort 54.83 16.39 58.00 30.05 57.83 24.73 55.00 23.68
Frustration 36.33 25.22 44.67 29.92 37.50 32.39 43.50 22.42
Average RTLXRating for Event 42.94 19.73 46.69 22.24 42.00 23.61 47.64 17.77
Six of the 13 pilots were seen making visible gestures and vocalizations indicative of
frustration and high workload while they were receiving the reroute instructions. For example, an
owner-operator was only 0.6 nm before reaching MXE when he appeared to understand the
reroute clearance. He then used paper charts to locate the waypoints rather than enter them into
the flight plan, suggesting his need to understand the changes to his routing before accepting it.
Due to the delay, he ended up off course and accommodated by switching to HDG mode but
overshot DQO. His frustration was readily apparent. Other pilots could be heard mumbling or
groaning or saying, “This is really high workload,” calling ATC several times for clarification, or

92
requesting delaying vectors because he was “having trouble getting all this.” It was clear that at
least four of the 13 demonstrated behavior that indicated their workload was high.
Event 3: Expedited descent. The third major event occurred approximately 18 minutes
after the second leg began as the pilots were climbing to 12,000 ft MSL from 2,000 ft MSL, with
traffic converging on their location. The traffic in our scenario was an A320 with an emergency
descending to land at Dulles International Airport. When the participants reached approximately
7000 ft MSL during their climb, ATC instructed them to “descend immediately and maintain
6000 feet for emergency traffic.” We were interested in observing the pilots’ behavior and
performance during this situation. Key to that was assessing the speed with which they complied
with the instruction to initiate a descent, the amount of altitude gain before a descent was
initiated, the technique used to descend, and the possible role or use of automation during their
descent. For example, did the pilots quickly disengage the autopilot and get clear of the
emergency traffic or did they try to use the automation to descend to the new assigned altitude?
Twelve of the participants initially disengaged the automation to initiate the expedited
descent and all participants generally completed the task successfully although some errors were
noted. Detailed descriptions of the findings for this event follow.
Automation use, flight path management, and the expedited descent. As with the other
events, autopilot use was common throughout this segment. Prior to ATC calling with the
clearance to climb from 2,000 ft MSL (before the start of Event 3), all 13 of the pilots were using
ALT Hold mode; 12 of those pilots were using NAV(GPS) mode to maintain their heading with
the remaining pilot using ROLL mode. The climb to 12,000 ft MSL was accomplished using
FLC by nine of the pilots and the other four used VS.
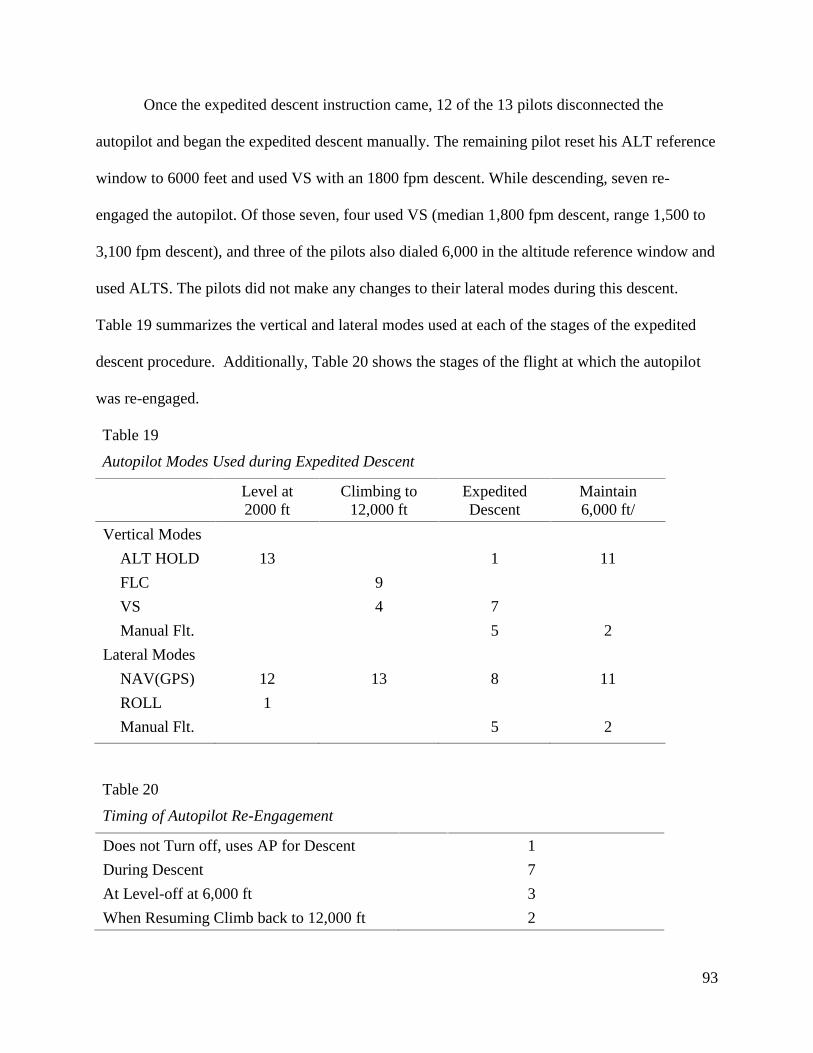
93
Once the expedited descent instruction came, 12 of the 13 pilots disconnected the
autopilot and began the expedited descent manually. The remaining pilot reset his ALT reference
window to 6000 feet and used VS with an 1800 fpm descent. While descending, seven re-
engaged the autopilot. Of those seven, four used VS (median 1,800 fpm descent, range 1,500 to
3,100 fpm descent), and three of the pilots also dialed 6,000 in the altitude reference window and
used ALTS. The pilots did not make any changes to their lateral modes during this descent.
Table 19 summarizes the vertical and lateral modes used at each of the stages of the expedited
descent procedure. Additionally, Table 20 shows the stages of the flight at which the autopilot
was re-engaged.
Table 19
Autopilot Modes Used during Expedited Descent
Level at2000 ft
Climbing to12,000 ft
ExpeditedDescent
Maintain6,000 ft/
Vertical Modes
ALT HOLD 13 1 11
FLC 9
VS 4 7
Manual Flt. 5 2
Lateral Modes
NAV(GPS) 12 13 8 11
ROLL 1
Manual Flt. 5 2
Table 20
Timing of Autopilot Re-Engagement
Does not Turn off, uses AP for Descent 1
During Descent 7
At Level-off at 6,000 ft 3
When Resuming Climb back to 12,000 ft 2

94
During an expedited descent, the goal of the pilot is to get down to the required altitude
as quickly and as safely as possible. Thus, we were interested in two primary aspects related to
how this was achieved: 1) the amount of time that elapsed and the amount of altitude gained
from when ATC gave the instruction to descend until the aircraft actually began to descend, and
2) how quickly and precisely the descents occurred. Table 21 presents findings related to the
first aspect: how long it took for pilots to initiate a response (timed from the end of the ATC
instruction to descend) and how much altitude was gained before the aircraft started to descend
(again, timed from the end of the ATC call to the pilot).
Table 21
Time Lapsed for Participant Response and Altitude Gained Prior Aircraft Descent
Mean Min Max SD
Time Lapsed (seconds)1
All Participants 1.85 -2 5 2.34
Owner Operators 2.86 1 5 1.77
Professional Pilots 0.67 -2 5 2.5
Altitude Gained (ft)
All Participants 273.58 39.88 601.31 155.05
Owner Operators 260.84 155.86 376.43 72.49
Professional Pilots 288.44 39.88 601.31 225.611 Negative time indicates that the pilot was taking action before ATC finished providing instructions to
expedite a descent.
As can be seen in Table 21, some participants initiated a response (often disengaging the
AP) before the end of the radio call from ATC. Also evident in the table is the large range of
altitudes gained by pilots following the radio call before the aircraft started down. This large
range was primarily due to one professional pilot who did not disengage the AP during the
descent. In the time it took him to reset his ALT reference window to 6000 ft MSL, select VS
with an 1800 fpm descent, and for the aircraft to actually stop climbing, he had gained 601.31 ft.

95
Excluding his data, the other professional pilots gained an average of 225.86 ft MSL (SD =
185.09 ft MSL, range = 39.88 ft MSL to 494.30 ft MSL) before their aircraft started to descend.
Although turning the AP off and manually initiating the descent clearly reduced the
amount of altitude gained prior to descent, it was unclear if continuing to fly manually or re-
engaging the AP during the descent had any effect on the second expedited descent aspect of
interest: how quickly and precisely the descent was flown. To test this, the descent durations of
pilots who used the autopilot were compared with the descent durations of those who flew the
descent manually using an independent samples t-test. For the purpose of this analysis, data
from two pilots were first removed from the sample. One was removed because he never
disabled the autopilot. The second was removed because, due to an ATC error, he had very little
time to make a descent before the traffic was at his position. This resulted in a group of six
participants who re-engaged the autopilot during their descent and five who did not.
It was found that re-engaging the autopilot (M = 54.83, SD = 15.2) during the descent
significantly increased the time it took to make the descent versus disabling the autopilot and
descending manually (M = 32.80, SD = 10.32, t(9) = 2.75, p = .022; see Figure 17). Although
this result suggests a decrement related to automation use, it did not help us to evaluate workload
as a function of automation use during the expedited descent. To determine that we used an
independent samples t-test for the ISA ratings made when the aircraft reached 6,000 ft MSL
following the descent. Again, there was a significant effect (t(7) = 0.21, p = .21); the ISA ratings
for those who re-engaged the autopilot were lower (M = 1.75, SD = 0.5) than the ISA ratings of
pilots who hand flew the descent (M = 3, SD = 0.71) indicating a perception of significantly
lower workload by those who re-engaged the autopilot (see Figure 18).

96
Figure 17. Time Required to complete Expedited Descent as a function of AP use.
Figure 18. ISA Workload rating during the Expedited Descent as a function of AP use.
Therefore, re-engaging the autopilot during the descent resulted in an increased mean time to
achieve the descent by 40%, but doing so significantly decreased perception of workload.
0.00
10.00
20.00
30.00
40.00
50.00
60.00
70.00
80.00
90.00
100.00
Automation Used No Automation Used
Automation Use During Expedited Descent
Desc
ent D
urat
ion
(sec
s)
0
1
2
3
4
5
Automation Used No Automation Used
Automation Use During Expedited Descent
ISA
Ratin
g

97
Although, on average, the five participants who flew the entire descent manually
achieved their descents more quickly, the accuracy with which they flew suffered as compared to
those who re-engaged the AP. Three participants flew through the 6000 ft MSL level-off by an
average of 286.67 ft MSL and another briefly exceeded Vmo by a few kts. twice during the
descent. Thus, our study found a speed versus precision tradeoff with regard to AP use once the
expedited descent began. From an operational perspective, it is hard to say which is of greater
importance. SMEs who we have consulted have suggested that as long as an expedited descent
is initiated quickly, the accuracy of flying the descent may be of greater importance and advocate
using automation even if it lengthens the amount of time required to arrive at the descent
altitude.
Pilot and aircraft performance. All pilots correctly acknowledged and read back the
instructions to climb to 12,000, at which time they were instructed to contact Potomac Departure
on frequency 124.55. All pilots were successful in making the required frequency change and
making contact with the new controller. However, during Event 3, four participants made a
readback or some other communication error.
Aircraft and FAR limitations. As mentioned earlier, one pilot briefly exceeded Vmo
while hand-flying the descent. The excess speed took place in two back-to-back periods. The
first lasted for 1.4 s and reached a maximum speed of 251 KIAS. That was followed by a 10 s
period where the participant pitched the aircraft up to reduce airspeed to 244 KIAS. The pilot
then pitched back down to continue his descent and retarded the thrust levers. However, he
again exceeded the speed limitations of the aircraft for 5.4 s and reached a maximum speed of
252 KIAS. No other participants exceeded aircraft or FAR limitations during Event 3.
98
Checklist and chart usage. There did not appear to be any checklist and/or chart usage
during the expedited descent and none was expected. Pilots appeared to be primarily concerned
with descending to the instructed 6,000 foot altitude as quickly as possible and using a checklist
could have created a lag in participants’ ability to avoid emergency traffic. A Citation Mustang
emergency checklist labeled “Emergency Descent” does exist; however, none of our participants
used it or appeared to have completed the memory items from it. This checklist is written to
expedite descent to a lower altitude, typically due to a pressurization problem, rather than simply
to get quickly out of the way of another aircraft.
Pilot behavior and general workload management. The RTLX ratings for the expedited
descent procedure are summarized in Table 22. Recall that, after reverse-scoring the
performance scale for consistency in directionality with the other scales, a lower score indicates
lower perceived workload and higher perceived performance.
The ratings indicate that the pilots perceived a high temporal demand during the
expedited descent. This is to be expected because the objective was for pilots to get out of the
way of the emergency traffic as quickly as they could safely manage. The low performance
scores indicate that the participants felt they had performed the expedited descent quite well; this
is consistent with their relatively low levels of frustration. The other subscales are roughly
equivalent in terms of the average score. These results, taken together, indicate that pilots
thought that the task was relatively easy to accomplish without any significant mental demand,
physical demand, or extraordinary effort.

99
Table 22
Pilot Participant TLX-Ratings of the Expedited Descent Procedure
Owner-Operator(n=7)
Professional(n=6)
All(n=13)
Mean SD Mean SD Mean SD
NASA TLX Ratings -Expedited Descent
Mental Demand 52.86 31.01 48.33 22.60 50.77 26.44
Physical Demand 38.14 29.74 50.00 33.07 43.62 30.59
Temporal Demand 60.57 37.67 83.67 15.67 71.23 30.91
Performance 15.57 8.10 19.33 10.52 17.31 9.10
Effort 44.86 34.43 68.33 17.82 55.69 29.55
Frustration 24.29 22.98 39.17 21.01 31.15 22.53
Average RTLX Ratingfor Event 39.38 19.63 51.47 11.01 44.96 16.81
1 Reverse-scored so that low scores indicate perceived high performance.
As before, we submitted the RTLX data to a within-subjects repeated measures ANOVA
to determine if one or more of the constructs represented by the TLX subscales was of particular
importance relative to performing an expedited descent. The design of the ANOVA was the
same as described earlier. The ANOVA was found to be significant, F(5, 60)=9.902, p < .000,
partial ή2 = .452.
Pairwise comparisons were conducting using a Bonferroni correction to control for
family-wise error inflation. We found that Performance was ranked significantly lower (where
lower scores indicate better performance) than Mental Demand (p = .002), Temporal Demand (p
< .000), and Effort (p = .014). Also, Temporal Demand was significantly higher than Frustration
(p = .019). This confirms that participants believed they had performed the expedited descent
well and did not find the task to be particularly demanding but were aware of the need to
complete it quickly. The mean ISA rating for the event was 2.55, indicating a low to fair level of
workload (Castle & Leggatt, 2002), which is consistent with the RTLX workload ratings.
100
Event 4: Communication assistance for a lost pilot. Prior to the initiation of this fourth
high workload event, pilots were presented with an abnormal condition, a circuit breaker (cb)
pop accompanied with an amber alert message “ANTISKID FAIL.” Although this occurred 30
nm before the start of Event 4, we expected that some pilots might still be considering this
condition and could possibly be referring to the abnormal checklist for an antiskid failure or
landing tables when Event 4 began.
High workload Event 4 began approximately three-quarters of the way through the
second leg of the experimental flight, as the participants were crossing WITTO level at 16,000 ft
MSL, when ATC gave them the following instruction: “Descend pilot’s discretion, cross 15
northeast of Montebello at one-zero, 10,000.” Thirteen nautical miles past WITTO, as
participants were crossing MITRE, a “lost pilot” in another aircraft, played by one of the
researchers, was heard on the radio having difficulty communicating with ATC. The lost pilot
was VFR and trapped under a thick cloud deck looking for a place to land. After several
transmissions from the Center controller and the lost pilot, it was clear that the lost pilot could
hear the controller but the controller could not hear the lost pilot. The controller then asked the
participant pilots if they could hear the lost pilot on the frequency and if they would be willing to
transmit communication from the lost pilot to ATC. Although our participants could have
declined the request for assistance, none chose to do so. Three owner-operators and three
professional pilots even offered assistance before they were asked. Event 4 ended at the
conclusion of the lost pilot scenario, which occurred just prior to the approach and landing at
KHSP.
During Event 4, the participants needed to adhere to the instruction to descend when
desired to meet a crossing restriction 15 nm prior to a VOR, in addition to helping to facilitate

101
the communication from the lost pilot. Unlike meeting the crossing restriction at Dupont in
Event 2, this clearance required that the participants identify an unmarked point on the
navigation charts (i.e., not a predefined waypoint or VOR) at which to meet the crossing
restriction and to determine when they wanted or needed to initiate their descent to meet it.
Furthermore, during the “lost pilot scenario” it was also expected that participants would also
need to check or verify the weather conditions at KHSP and set up the cockpit in preparation for
the approach at KHSP. Thus, even though the approach and landing at KHSP occurred just after
high workload Event 4 ended, aspects of participants’ approach and landing performance that
could have been influenced by tasks within Event 4 were also subjected to analysis.
Four of the 13 pilots had some sort of difficulty in programming the crossing restriction
or in descending, but only one actually failed to make the crossing restriction. Approximately
half (n = 6) had some sort of problem associated with programming or flying the precision
approach at KHSP. Detailed findings related to pilot performance during Event 4 are described
below.
Overall flight performance during Event 4. Almost all pilots reported during post-flight
debriefings that the second leg of the experimental flight involved less workload than the first.
However, it should also be noted that no unscripted FD failures occurred during the second leg.
As mentioned above, the timing and analyses for high workload Event 4 began with the call from
ATC and their crossing WITTO. High workload Event 4 ended when ATC handed the
participant pilots off to another controller at the end of the lost pilot scenario which generally
occurred around the time participants crossed MOL. Event 4 lasted an average of 7 min and 55
s(SD = 31 s, range = 0:07:11 to 0:08:53).

102
Although at least one error was committed by each of the participants during Event 4 or
during the approach into KHSP, they generally flew within appropriate parameters. For
example, all participants maintained engine ITT below the limit of 830o and responded to all
radio calls from ATC. Twelve pilots met the crossing restriction, and no excessive bank angles,
yaw, or unusual attitudes were observed. All participants flew close to Vmo (250 KIAS) during
the event and their airspeeds ranged from 193 KIAS (M = 210.85 KIAS, SD = 14.51 KIAS) to
248 KIAS (M = 243.23 KIAS, SD = 4.36 KIAS) with an overall average airspeed of 228.30
KIAS (SD = 8.80 KIAS). Those flying slower airspeeds tended to be participants who reduced
their speeds purposefully near the end of the lost pilot scenario to increase the amount of time
they had available to finish preparing for the approach at KHSP.
With regard to communications with ATC during Event 4, 12 participants used only the
Com 1 radio and one participant used only the Com 2 radio; however, all participants had the
CTAF and ASOS frequencies for KHSP dialed into the other radio. No one had the emergency
frequency (121.5) dialed into either radio. The only time participants were instructed to change
frequencies to contact a new controller marked the end of Event 4.
The observable errors committed during the event or the approach to KHSP can be seen
in Table 23. One professional pilot committed only one error when he neglected to report the
initiation of his descent from 16,000 ft to ATC; all other participants made two or more errors
during the event.

103
Table 23
Errors1 Committed During High Workload Event 4
All Participants(n=13)
Owner-Operators(n=7)
Professional Pilots(n=6)
Communication/readback errors2 4 1 3
Did not report when leaving 16,000ft MSL for 10,000 ft MSL3 10 6 4
Minor error when programming thecrossing restriction
1 1 0
Substantial error(s) whenprogramming the crossingrestriction
4 2 2
Failed to make crossing restriction 1 0 1
Misunderstood ATC/lost pilotcommunication capabilities4 5 4 1
Minor error when programming theILS rwy 25 approach at KHSP
1 0 1
Substantial error(s) whenprogramming the ILS Rwy 25approach at KHSP
7 4 3
Landed at KHSP with incorrectaltimeter setting
8 3 5
Total errors 41 21 20
Mean number of errors 3.15 3.00 3.331 “Errors” includes only those that were observable and does not include some difficulties with flight path
management described elsewhere in this report.2 Communication or readback errors committed by 4 participants3 One participant, a professional pilot, did report late at around 15,000 ft MSL. It is not a requirement that pilots
report when leaving an assigned altitude for another one but it is suggested as good practice.4 Participant had difficulty understanding that the “lost pilot” could hear ATC but that ATC could not hear the
lost pilot—the participant needed to transmit comms from the lost pilot to ATC but did not need to transmitcomms from ATC to the lost pilot.
A one-way ANOVA revealed no significant differences between owner-operators and
professional pilots with regard to the number of errors committed during Event 4 and the
approach to KHSP, F(1,11) = 0.54, p =.48. However, two surprising findings were the large
number of pilots who neglected to contact ATC to report they had initiated their descent from

104
16,000 ft MSL (n = 10) and the large number who landed at KHSP with an incorrect altimeter
setting (n = 8).
Automation use, flight path management, and accomplishment of Event 4 tasks. All
participants typically made G1000 inputs without hesitation. The AP and FD were used by all
participants throughout the event from beginning to end. All pilots used NAV(GPS) mode
throughout Event 4 with the exception of one professional pilot who switched to HDG mode at
the very end of the event when he requested to stay on his current heading (rather than turn to the
initial approach fix [IAF]) to gain some time to complete preparation for the approach. Other
lateral modes used by some participants during the approach (after Event 4 had ended) will be
described later. Two different vertical modes (VPTH and/or VS) were used by participants to
descend to meet a crossing restriction in Event 4 and are discussed below.
There were three major high workload tasks to be accomplished during, and just after,
Event 4: 1) meet the crossing restriction, 2) assist lost pilot communications, and 3) execute the
approach at KHSP. The lost pilot scenario ended very close to the point where participants
would be turning toward the IAF for the approach at KHSP, so we were interested in how the
tasks in Event 4 may have influenced participants’ preparation and execution of the approach.
In our review of participant performance of these three major tasks, we first turn our
attention to the ways in which participants handled the instruction from ATC to begin a descent
from 16,000 MSL, at a time of their choosing (i.e. “at their discretion”), so that they were at
10,000 ft MSL 15 nm prior to reaching the MOL VOR. This clearance was given by ATC when
the participants were 44 nm from MOL (29 nm from the point where they had to meet the
crossing restriction). Participants began their descents when they were an average of 32.96 nm

105
(SD = 4.44 nm) from MOL (about 18 nm from the crossing restriction point) and were traveling
an average of 224.69 KIAS (SD = 10.21 KIAS).
Twelve of the 13 participants programmed VPTH to accomplish this task although two of
them did not couple VPTH to the AP and just used its guidance to support their descent using VS
(one of them did not make the crossing restriction—was 1,180 ft high). Additionally, VPTH did
not capture for one participant because he forgot to change the target altitude in the altitude
reference window on the PFD so he ended up using VS instead. The remaining participant used
VS with no VPTH guidance as a back-up.
It took the 12 participants an average of 53 s (SD = 42 s; range = 00:20 to 02:09) to
program the VPTH descent although there were two distinct clusters of time it took to do this
programming. These clusters appeared unrelated to participant subgroup (owner-operator or
professional pilot) or whether the VPTH was used for the descent or only for back-up
information. The participants with the lowest programming times (n = 8, range = 20 to 38 s)
took an average of 29 s (SD = 7 s) to do so; those with the longest programming times (n = 4,
range = 01:35 to 02:09) took an average of 1 min 58 s (SD = 10 s) to complete the programming.
As expected, those taking more time to complete the programming interleaved other tasks while
doing so.
One of the four participants who used VS for the descent set just one descent rate (1700
fpm). The other three set an initial descent rate (1,500 to 2,500 fpm) and increased it 500 to 600
fpm during the descent. One participant who unsuccessfully used VS with VPTH guidance chose
an initial descent rate of 2,500 fpm and continued to fly close to Vmo. When it started to become
apparent that he might not make the crossing restriction, he compensated by pulling back some
power but waited almost a minute before increasing his descent rate to 3,000 fpm (passing

106
through 12,700 ft MSL 2.58 nm from the crossing restriction point). Although it seemed clear
that the participant knew he had not met the crossing restriction, he did not inform ATC. Two
pilots, including the one who was unsuccessful, initially made an error when programming
VPTH by placing the point where the crossing restriction was to be met 15 nm past MOL instead
of 15 nm before MOL. Both caught their errors fairly quickly and corrected them.
The second major task of Event 4 involved assisting with transmitting communications
from a lost VFR pilot to ATC. Due to problems with the simulator audio system, one participant
was not presented with the lost pilot scenario during leg 2. As mentioned earlier, all the other
participants agreed to assist and six volunteered before ATC could even ask. All the participants
continued to offer assistance until the situation had been resolved with the exception of one who
did not transmit the final two comms from the lost pilot to ATC because he was preparing for his
approach into KHSP. Five participants had at least some initial confusion as to who could hear
whom during the scenario; in those cases, the lost pilot clarified that she could hear ATC and
only one participant continued to transmit ATC comms to the lost pilot, in addition to lost pilot
comms to ATC, throughout the scenario.
The lost pilot situation was typically resolved about the time that participants crossed
MOL, which is 17.3 nm from the IFAVU IAF for the ILS or LOC RWY 25 approach into KHSP
(see Figure 19). Some participants appeared to become a bit concerned about being ready for the
impending approach into KHSP during the lost pilot scenario, and five did such things as slow
down or ask for vectors or some other alternate routing that would give them added time to
prepare (e.g., stay on current heading a bit longer past MOL, requested the EXRAS IAF which
was 5 miles further away from MOL, etc.). Contrary to what was expected, most pilots did not
actively engage in preparing for the approach during the lost pilot scenario. Three did query

107
ATC about aspects of the approach while assisting with the lost pilot comms (e.g., which
approach could be expected), and one was observed looking at aircraft weights on the MFD;
however, very little of their preparation for the approach occurred during the lost pilot scenario.
The other nine participants were not engaged in any observable approach preparation during the
scenario.
Further analysis revealed that six pilots (three owner-operators and three professional
pilots), including two who queried ATC during the scenario, had actually completed most or all
of their approach preparations (e.g., reviewing/briefing the approach) before Event 4 or the lost
pilot scenario began. Additionally, six participants were observed entering in the KHSP CTAF
and ASOS frequencies into the radios quite early during the leg (e.g., before they departed
KMTN, on climb out from KMTN).
Four participants briefed the approach (i.e., reviewed the approach plate for the first time)
between MOL and the IAF, and one professional pilot briefed the approach very late, just before
arriving at the AHLER intermediate fix. An owner-operator was never observed briefing the
approach by reviewing the approach plate prior to conducting the approach, though he did scroll
down to the DH information at the bottom of the Jeppesen chart displayed on the MFD when he
was 252 ft above DH.
Interestingly, of the six participants who briefed the approach before the start of Event 4,
two actually programmed the approach at that time; the other four waited until after passing
MOL when the specific approach in use was confirmed by ATC. During the post-flight
debriefings, the two who programmed the approach quite early spoke of their preference to get
the programming out of the way as early as possible, even if it meant having to change it later.
Both of them completed the approach without difficulty.

108
Figure 19. ILS or LOC RWY 25 approach to KHSP (AOPA, 2012).
Eleven participants programmed the approach after the end of the lost pilot scenario.
Table 24 shows the relationship between the time during flight when participants prepared for or
programmed the approach with difficulties they encountered while programming or conducting
the approach. The more significant difficulties encountered included such things as incorrectly
programming the G1000 such that the aircraft turned back toward MOL instead of toward the

109
IAF, selecting the incorrect IAF, not activating or arming the approach, being in the wrong mode
to capture the approach (i.e., HDG instead of NAV(GPS), 2 dot deflection to the right of course
before being corrected, and using the AP and pitch mode to unsuccessfully chase the glideslope.
Table 24
Relationship of Timing of Approach Briefing and Programming to Encountering Difficulties inProgramming or Conducting the ILS Runway 25 Approach into KHSP
All Participants(n=13)
Owner-Operators(n=7)
Professional Pilots(n=6)
ProblemNo
ProblemProblem
NoProblem
ProblemNo
Problem
Timing of Briefing1
Very early prior tostart of Event 4
2 4 1 2 1 2
Between MOL andIAF2 3 2 2 1 1 1
After IAF 1 0 0 0 1 0
No briefing observed 1 0 1 0 0 0
Totals2 7 6 4 3 3 3
Timing of Programmingthe Approach
Very early prior tostart of Event 4
0 2 0 2 0 0
Between MOL andIAF2 6 4 4 1 2 3
After IAF 1 0 0 0 1 0
Totals2 7 6 4 3 3 3
1 When the majority of briefing activities occurred2 Two problems encountered were relatively minor: one participant could not locate the IAF on his IPad and did
not look at other charts to find it. Another participant momentarily selected the wrong altitude for AHLER butcorrected it right away.
As can be seen in Table 24, there was a fairly even split between those who did and did
not encounter difficulty in programming or executing the approach. Not surprisingly, those who
briefed the approach quite early in the leg tended to have fewer difficulties programming or

110
executing the approach than participants who completed most of their briefing activities just
before conducting the approach. Similarly, participants, particularly owner-operators, who
programmed the approach just before or even after they had begun executing it tended to have
more difficulties than those who programmed the approach earlier.
Interestingly, six of the nine participants who reported to ATC that they had obtained the
weather at KHSP by checking the KHSP ASOS, landed at KHSP with an incorrect altimeter
setting (29.86 instead of 29.84). Two other participants who did not report to ATC as having
gotten the KHSP weather also landed with an incorrect altimeter setting (see Table 23). The
incorrect altimeter setting these eight participants landed with was the Culpepper altimeter
setting which was given to them when they descended through the transition altitude of 18,000 ft
MSL much earlier in the flight, before Event 4 began.
Aircraft and FAR limitations. At no point in time did any participant exceed any aircraft
or FAR limitations during Event 4. However, several flew quite fast, flying close to Vmo (250
KIAS). In fact, a couple of participants’ speeds were close to the barber pole at various times,
but no one exceeded Vmo during the event.
Checklist and chart usage and PFD and MFD Displays. There was no evidence that
any of the participants completed any normal checklists during Event 4 and we would not have
expected any. The descent checklist would likely have been performed as they started their
initial descent from cruise and passed through the transition altitude of 18,000 ft MSL, which
occurred before Event 4 began. Similarly, approach checklists would have been performed after
Event 4 ended, at the completion of the lost pilot scenario.
However, three participants, all professional pilots, were still reviewing the abnormal
checklist for ANTISKID FAIL when ATC called with the crossing restriction at the start of

111
Event 4, and at least one pilot appeared to be thinking about this condition during Event 4 as he
consulted the runway length at KHSP on the MFD to make sure he would have adequate length
for landing.
Ten of the 13 pilots had a small map inset displayed on the lower left hand side of the
PFD, and several of them also had traffic information (TIS) on the map. Inset map display
selections can be seen in Table 25. As can be seen in this table, professional pilots were more
likely than owner-operators to have either no map inset displayed or to have less information
depicted on the map if it was displayed.
Table 25
Lower-Left PFD Inset Map Configurations
All Participants(n = 10 out of 13)
Owner-Operators(n = 6 out of 7)
Professional Pilots(n = 4 out of 6)
Map only 3 1 2
Map with TISinformation
3 2 1
Map with TIS andtopographicinformation
1 1 0
Map with waypointsand TIS information
1 0 1
Map with waypointsand topographicinformation
1 1 0
Map with waypoints,TIS, and airspaceinformation
1 1 0
In the lower right corner of the PFD, seven participants had nothing displayed during
Event 4. Of the remaining six participants, two displayed the timer/reference window (which
displays Vref speeds), one displayed airport information for KHSP (later switching to a small
map with waypoints depicted), and three participants displayed their flight plan during Event 4.

112
Two of these pilots also had a larger rendition of their flight plan depicted on part of the MFD at
the same time. Participants made almost no changes to their PFD inset box selections on the PFD
during the event.
By far the most popular MFD display used by participants (n = 9) during the event was a
screen split (either left-right or top-bottom) between their flight plan and a map—seven pilots
chose to show topographical information on the map, and two others chose the map view with no
topographical information. The remaining four participants, all professional pilots, chose to have
a large topographic map only depicted on the MFD; two of these professional pilots did not have
a flight plan displayed on their PFD during the event either.
Seven participants used the Jeppesen charts on the MFD, with own-ship depiction, when
conducting the ILS runway 25 approach into KHSP. Four owner-operators used electronic
approach charts on an iPad. (Because the study was conducted in a simulator, no own-ship
depiction could be used on the iPad approach chart as might be possible during real flights). The
remaining two participants used paper approach charts. During the debriefing interviews, six
mentioned that they typically have one or more backup sources for approach charts for use in the
event that their primary source is not available.
Pilot demeanor and general workload management. A majority of the pilots displayed
very professional behavior and appeared relaxed, confident, and calm during Event 4. A few
displayed some minor frustration (e.g., a sigh) when encountering difficulty with programming
the crossing restriction or the approach, but these displays were brief and generally mild in
nature.
Three professional pilots were still referring to the ANTISKID FAIL checklist and
landing data when they received the clearance for the crossing restriction at the beginning of

113
Event 4. Two of the pilots made errors that were corrected when programming the crossing
restriction—both initially placed the waypoint for the crossing restriction 15 nm after MOL
instead of 15 nm before MOL. Similarly, one pilot had not finished programming the crossing
restriction when the lost pilot scenario began. He also had difficulty with subsequent tasks such
as correctly programming the approach at KHSP.
Over half of the participants (n = 8), four owner-operators and four professional pilots,
wrote down the crossing restriction clearance, and five participants wrote down information
spoken by the lost pilot or ATC during the lost pilot scenario. One participant was also observed
looking on his MFD for the VORs ATC was asking if the lost pilot could receive. One owner-
operator was initially confused by the fundamental problem in the lost pilot scenario (i.e., ATC
had lost communication and radar contact with the VFR pilot) and suggested that ATC provide
vectors to the lost pilot. This same participant was also quick to ask for vectors for himself
whenever he encountered a problem, we presume, as a strategy for reducing his workload.
Requesting vectors was also a workload-reducing tactic employed by a professional pilot to
allow more time to set up for the approach.
As described earlier, five other participants employed similar tactics during or after the
lost pilot scenario to give them more time to prepare for the approach at KHSP. These tactics
included pulling the power back to slow down and requesting alternate routing (vectors, a
different IAF, maintaining current heading and delay turn toward the IAF). Two professional
pilots offered to hold at MOL to allow for the resolution of the lost pilot scenario, although that
was unnecessary; one did request a different approach fix (EXRAS) to give him more time to
prepare for the approach. Despite expressing concern about not being ready for the approach,
one owner-operator did very little preparation for the approach during the lost pilot scenario and

114
employed no delaying tactics, such as reducing his speed or requesting alternate routing—he
encountered quite a bit of difficulty when it came time to conduct the approach.
During leg 2, about half of the participants completed some tasks, like dialing in KHSP
radio frequencies and starting to brief the probable approach, quite early. This was consistent
with comments made during the debriefing interviews that their approach to workload
management was to take care of as many tasks as they could as early as possible, even if it meant
that some of these tasks had to be repeated later because of plan changes.
Seven participants, both owner-operators and professional pilots, seemed quite
comfortable multitasking and dividing their attention between things such as talking to ATC and
making power adjustments during the descent. All seven of these participants, as well as two
other owner-operators, tended to interleave tasks, such as interrupting programming to make a
radio call or scan the instruments, though, on occasion, an error was committed.
The remaining four participants appeared less comfortable with multitasking and
approached tasks such as programming the crossing restriction and the approach in a fairly
sequential and linear way. Despite this focused attention to the tasks, two of the four made
errors programming the crossing restriction, and three of the four made errors programming the
approach. Conversely, their focused and sequential approach to programming the crossing
restriction and approach could be interpreted as an appropriate response to their programming
problems, though the errors made in programming the approach were only evident after the
programming had been completed and the aircraft and automation failed to behave as expected.
Pilot background and experience. Table 26 presents the piloting experience of
participants who did and did not encounter problems with the crossing restriction prior to MOL

115
and the approach into KHSP. A factorial MANOVA revealed no significant main effects4 for
differences in any type of flight hours assessed associated with encountering problems with the
crossing restriction before MOL, problems with the approach at KHSP, or an interaction between
the two, Wilk’s λ = .54, F(6,4) = 0.57, p = .74.
4 Statistics for non-significant main effects are available upon request.

116
Table 26
Pilot Demographics by Problems Encountered With the Crossing Restriction and InstrumentApproach
Crossing Restriction before MOL Approach at KHSP
Problems(n=5)
No Problems(n=8)
Did not Meet(n=7)
Met(n=6)
M SD M SD M SD M SD
Age 53.16 6.91 46.00 11.19 51.14 11.54 46.33 8.62
GeneralFlyingHours
Total 4560.00 1192.90 3648.25 2508.82 3400.00 1831.21 4697.67 2312.95
Pastyear
137.00 44.10 289.00 169.23 160.71 92.58 312.00 175.49
Past 3months
35.00 15.00 63.63 32.88 37.86 18.90 69.83 33.30
Singlepilotjet
484.00 510.73 236.38 99.81 401.43 438.77 250.17 120.60
CitationMustangSpecificHours
Pastyear
127.00 47.38 170.38 107.97 139.29 84.82 170.50 100.06
Singlepilot inpastyear
102.00 67.51 161.25 113.67 120.71 96.93 159.17 108.01
Tables 27, 28, and 29 present differences among the same four subgroups in their
subjective ratings of workload as measured by the ISA and NASA TLX measures. These
ratings are presented relative to how well the pilots accomplished the crossing restriction,
assisted the lost pilot, and performed the instrument approach at KHSP, respectively. Factorial

117
MANOVAs revealed no interaction or main effects of participant problems with the crossing
restriction or the instrument approach at KHSP on any of the ISA or RTLX ratings of workload.5
Table 27
NASA RTLX Ratings by Problems Encountered with the Crossing Restriction 15 nm BeforeMOL
Problems(n=5)
No Problems(n=8)
M SD M SD
Mental Demand 51.20 32.24 37.00 23.44
Physical Demand 32.20 26.82 25.50 19.77
Temporal Demand 40.60 33.59 38.50 21.66
Performance1 37.80 27.52 23.88 10.85
Effort 46.20 27.68 34.00 16.86
Frustration 42.40 30.96 18.63 16.69
Average RTLX rating for event 41.73 25.26 29.58 16.58
1 Reverse scored so direction is consistent with all ratings of other subscales (low numerical rating = lowerperception of workload demand). With reverse scored performance ratings, low ratings indicate betterevaluations of one’s performance.
5 Non-significant interaction and main effect statistics are available upon request.

118
Table 28
ISA and NASA RTLX Ratings for the Lost Pilot Scenario by Problems Encountered With theCrossing Restriction and Instrument Approach
Crossing Restriction before MOL Approach at KHSP
Problems(n=5)
No Problems(n=7)
Problems1
(n=6)No Problems
(n=6)
M SD M SD M SD M SD
ISA Rating
MOL VOR 2.40 1.14 2.33 1.03 2.33 1.03 2.40 1.14
NASA TLX Ratings -Assist Lost Pilot andATC with Comms
Mental Demand 57.40 24.61 54.86 25.61 57.00 24.56 54.83 26.04
Physical Demand 32.60 29.36 32.00 28.13 28.50 27.91 36.00 25.77
Temporal Demand 50.20 21.15 46.86 21.20 52.17 22.70 44.33 16.22
Performance2 25.60 7.30 14.71 7.66 22.50 7.82 16.00 10.87
Effort 58.00 24.57 53.29 21.81 54.67 26.88 55.83 15.12
Frustration 35.60 23.42 37.14 17.46 38.33 23.97 34.67 14.95
Average RTLX ratingfor event
43.23 15.75 39.81 16.46 42.19 17.26 40.28 13.96
1 Problems experienced by two participants during the approach were relatively minor.2 Reverse Scored so direction is consistent with all ratings of other subscales (low numerical rating = lower
perception of workload demand). With reverse scored performance ratings, low ratings indicate betterevaluations of one’s performance.

119
Table 29
ISA and NASA RTLX Ratings by Problems Encountered with the ILS or LOC RWY 25Instrument Approach into KHSP
Problems1
(n=7)No Problems
(n=6)
M SD M SD
ISA Rating 2.33 0.82 2.83 0.98
AHLER + 15 s
NASA TLX Ratings - InstrumentApproach at KHSP
Mental Demand 52.86 25.65 53.33 27.04
Physical Demand 35.43 32.11 40.33 25.75
Temporal Demand 44.43 28.13 41.83 17.72
Performance2 30.00 27.83 20.17 5.72
Effort 57.43 24.12 52.00 27.18
Frustration 36.14 33.69 38.17 22.13
Average RTLX rating for event 42.71 26.60 40.97 18.91
1 Problems experienced by two participants during the approach were relatively minor.2 Reverse scored so direction is consistent with all ratings of other subscales (low numerical rating = lower
perception of workload demand). With reverse scored performance ratings, low ratings indicate betterevaluations of one’s performance.
Voice Analyses Across the Four High Workload Events
Voice analyses during pilot communication across the high workload events were
conducted. In addition to the four high workload events, four events we expected to be of
relatively lower workload (LW) were also identified.6 Participant’s fundamental frequency
(vocal pitch) during the high workload (HW) events was compared to their fundamental
frequency (FO) during 1) the low workload (LW) events, 2) a baseline vocal sample taken while
6 LW1: Pilots readback to ATC saying, “Clear of traffic, climb FL200, call NY” and Pilots call to NY and reply toreport reaching
LW2: Pilots reply to ATC saying, “Contact Potomac departure” and pilots call to Potomac approach and readbackto ATC instructions for landing
LW3: Pilot reply to ATC, “Climb back to 12000 and call NY” and pilot call to NYLW4: Pilot call to Unicom at KHSP

120
the pilot flew a pattern prior to completing the familiarization and experimental flights, and 3) a
probe from ATC asking the participant to confirm his remaining route of flight during leg 2 of
the experimental flight. The baseline sample was taken early in the simulator session, when
fatigue would not be a factor, during a relatively low workload period when the participant was
performing a highly practiced task (flying around the pattern at an airport). The probe sample
was also taken during a relatively low workload period but occurred later in the day, during the
second leg of the experimental flight. The baseline and probe samples both included part of the
participants’ cleared route of flight to allow for comparison of the words spoken. Findings from
previous literature examining FO (Huttunen, Keränen, Väyrynen, Pääkkänen, & Leino, 2011;
Mendoza & Carballo, 1998; Patil & Hansen, 2007) led us to hypothesize that participant’s FO
during the four HW events would be significantly higher than their FO during any of the other
three (LW, baseline, and probe), which were each expected to involve less workload. Table 30
provides descriptive statistics for FO used in analyses across the various events.

121
Table 30
Fundamental Frequency Descriptive Statistics (Hz)
N MeanStandardDeviation
Maximum Minimum
Baseline 11 115.26 14.16 137.96 96.93
Probe 13 118.97 12.69 144.18 99.74
HW Event 1 11 112.44 9.16 128.46 100.31
HW Event 2 12 114.07 14.41 140.85 92.84
HW Event 3 13 118.84 12.63 137.95 97.63
HW Event 4 12 115.94 143.77 143.97 98.37
Average HW 13 116.28 12.75 139.19 97.43
LW Event 1 12 115.58 15.54 140.36 91.86
LW Event 2 12 114.10 14.54 138.19 90.80
LW Event 3 13 120.03 14.69 142.09 98.68
LW Event 4 12 116.83 14.06 137.9 92.35
Average LW 13 115.64 13.59 138.03 93.01
LW = low workload, HW = high workload
Two repeated measures ANOVAs were conducted to determine if any significant
differences in FO existed between the four events classified as HW and the four events classified
as LW. The results of the two ANOVAs revealed that no significant differences existed within
the high and low workload events (HW: F(3,27) = 2.248, p = .106; LW: F(3,33) = 1.396, p =
.262). Since neither finding was significant, the four HW events were combined, and the four
LW events were combined for subsequent analyses.
A repeated measures ANOVA was then conducted to investigate our hypotheses that high
levels of workload would yield greater fundamental frequencies than lower workload. The results
of the ANOVA, with the Greenhouse-Geisser correction, did not support our hypothesis, and no
significant differences in FO were found to occur between the HW events, LW events, baseline,
or probe, F(1.597,15.972) = 0.412, p = .625.

122
As with the FO analysis, a series of repeated measures ANOVAs were conducted to
compare the articulation rates of participants in HW and LW events, as well as to the baseline
and probe. Based on findings from previous studies (Brenner, Doherty, & Shipp, 1994;
Gorovoy, Tung, & Poupart, 2010) it was hypothesized that participants’ articulation rates during
the four HW events would be significantly higher than rates during the LW events, baseline, and
probe (i.e., participants would speak faster during higher workload events). Table 31 provides
descriptive statistics for the articulation and speech rates across the various events.
Table 31
Articulation Rate Descriptive Statistics
N MeanStandardDeviation
Maximum Minimum
Baseline 11 3.72 0.38 4.44 3.19
Probe 13 3.60 0.30 4.06 3.15
HW Event 1 13 4.03 0.34 4.64 3.39
HW Event 2 13 4.04 0.24 4.43 3.71
HW Event 3 13 4.10 0.57 5.23 3.04
HW Event 4 12 4.04 0.26 4.39 3.63
Average HW 13 4.05 0.37 5.23 3.04
LW Event 1 13 4.24 0.52 4.96 3.53
LW Event 2 13 3.91 0.43 4.44 3.23
LW Event 3 13 4.18 0.51 4.89 3.19
LW Event 4 12 3.72 0.46 4.49 2.94
LW = low workload, HW = high workload
Two repeated measures ANOVAs were conducted to determine if any significant
differences in articulation rate among the HW events and among the LW events existed. No
differences in articulation rate were found to exist for the HW events, again using the

123
Greenhouse-Geisser correction, F(1.613, 17.743) = 0.304, p = .695. However, a significant
difference in articulation rate was found to occur in the LW events, F(3,33) = 7.370, p = < .01,
partial η2 = .401. As a result of this significant finding, the data from the LW events could not be
combined, and the hypothesis that higher levels of workload would yield greater articulations
rates, as compared to rates during the LW events, could not be investigated.
However, since no significant differences were found to exist among the four HW events,
the HW data from the four events were combined and comparisons to the baseline and probe
were conducted. A repeated measures ANOVA was conducted and a statistically significant
difference in articulation rates was found to exist among the three groups, F(2,20) = 5.522, p <
.05, partial η2 = 0.522. Post-hoc analysis with a Bonferroni adjustment revealed that articulation
rates were significantly greater during the HW events than the probe (p < .05); however, no
differences were found in articulation rate between the HW events and the baseline (p = .184) or
between the baseline and the probe (p = 1.00).
Although the results of the analyses do not support our hypotheses that FO and
articulation would increase during high workload, they may indicate that our sections of low
workload were not truly low workload. Throughout the flight, there were several time periods
that could have been considered low workload, such as when the pilot was en route during
cruise; however, at these times the ATC and pilot made no verbal exchanges which were
required for a vocal analysis to take place. During each of the LW sections used in the analysis,
the pilots either had to read back an instruction, state their route, or state their future intentions.
Although we believed these exchanges to be of lower workload than those occurring during the
HW sections, it could be argued that the increase in cognitive load caused by the LW tasks could
have influenced FO and articulation rate.

124
We did find a significant difference in articulation rate between the HW sections and the
probe, however, which may validate a difference in pilot’s workload between the tasks. Finally,
it should be noted that the baseline was taken when the pilots were performing a circuit around
the pattern to become familiar with the simulator. Even though the baseline was sampled after
they rolled out on downwind performing a task with which they are highly familiar, but because
it was a new flying environment for them, the level of workload they experienced could have
been higher than we anticipated.
Results of the analysis of pilot communications with ATC (i.e., what was actually said by
the participants, as opposed to the vocal qualities of spoken communication discussed above) is
described in Christopher (2013).
Overall Performance across the Four High Workload Events
The number of participants who were and were not successful or who did and did not
experience problems in completing the major tasks within the four high workload events varied.
Table 32 summarizes those numbers but only considers errors that were directly associated with
a significant problem encountered while completing a task. Recall that all participants, both
owner-operators and professional pilots, committed a variety of errors during all four high
workload events (e.g., readback error, airspeed violation), but most were not directly related to
overall task success. Also recall that it is possible that earlier problems, such as difficulty with
the FD failure, may have led to later problems or caused stress whose residual effects may have
made later problems more likely; however, we have no way of determining the degree to which
this may have occurred.

125
Table 32
Success in Accomplishing Major Tasks in the Four High Workload Events
All Participants(n=13)
Owner-Operators(n=7)
Professional Pilots(n=6)
Successful/No Problem
Unsuccessful/Problem
Successful/No Problem
Unsuccessful/Problem
Successful/No Problem
Unsuccessful/Problem
Set upBWZ radialintercept
7 6 2 5 5 1
Reroutewithcrossingrestrictionat DQO
5 8 3 4 2 4
ExpeditedDescent 13 0 7 0 6 0
CrossingrestrictionbeforeMOL
9 4 5 2 4 2
ILSapproach atKHSP
7 6 3 4 4 2
Totals: n 41 24 20 15 21 9
Totals:percent 63 37 57 43 70 30
As can be seen in Table 32, approximately two-thirds of the major tasks in the four
events were accomplished by the participants with no difficulties. Overall, a greater percentage
of professional pilots than owner-operators were successful, but we did not find differences in
the success rates between these two groups to be statistically significant. Furthermore, the only
event for which task success had a significant relationship with flight experience was Event 1,
setting up the BWZ radial intercept. There were no other significant differences found in task
success in the other three high workload events related to hours of flight time accrued.

126
The difficulties associated with the FD failure aside, most of the problems participants
encountered with the successful completion of these tasks involved some sort of G1000
programming error. Consistent with that finding is the result that half or more of the participants
were unsuccessful or had problems accomplishing the three major tasks that involved the
greatest amount of programming: setting up for the BWZ radial intercept, programming the
reroute with the crossing restriction at DQO, and setting up for the ILS approach at KHSP. The
high degree of distraction caused by the unscripted FD failure likely contributed to the lack of
success in setting up for the BWZ radial intercept for five participants. It is also possible that
residual stress related to the FD failure contributed to some of the difficulties five of the eight
participants had in programming the reroute and meeting the crossing restriction at DQO, though
we have no observations or evidence to support or refute that. However, such “downstream”
effects of stress and workload have been noted by other aviation researchers (e.g., Dismukes et
al., 2007; Stokes & Kite, 1994). The difficulties approximately half of the participants had in
programming and/or executing the ILS approach at KHSP is more difficult to understand,
especially given that this is a commonly executed procedure that the automation design was
intended to support well. As this task came at the end of two fairly demanding experimental
flights and a long day in the simulator, it is possible that fatigue may have played some role but
again, we have no data to confirm or negate this assertion.
Figure 20 shows the relative NASA TLX subjective ratings made by participants who
were or were not successful across the five major tasks in the four events. Readers are reminded
that the performance ratings had to be reversed-scored so that lower ratings are indicative of
higher, or better, estimation of performance.

127
Figure 20. Participant ratings of performance across five major tasks.
It is not surprising to note that participants who were successful or encountered no problems in
accomplishing a task tended to rate their performance much higher than those who were
unsuccessful or did have problems, often by a substantial margin.
Discussion
This exploratory study examined workload management in single-pilot VLJ/ELJ
operations. Our analyses for this report focused on workload strategies and performance during
four high workload events that occurred during the en route portion of flight—after initial climb
out and before initiation of approach and landing. As an exploratory study, we did not develop a
number of detailed hypotheses to test but rather constructed experimental flight scenarios with
realistic tasks in a relatively demanding operational environment. We were interested in learning
about how single pilots flying an ELJ managed their workload and how they used automation for
0.00
10.00
20.00
30.00
40.00
50.00
60.00
70.00
80.00
90.00
100.00
110.00
Build course to interceptBWZ radial
Reroute with descent andcrossing restriction
Expedited descent Crossing restrictionbefore MOL
ILS approach to HSP
Tasks
RTL
X Pe
rfor
man
ce S
ubsc
ale
Successful/no problemsUnsuccessful/had problems

128
accomplishing various flight tasks. We were especially interested in problems they had, and
possible reasons why, as well as in identifying strategies for task management and automation
use that worked out particularly well (i.e., “best practices”). This study was also conducted to
gather baseline information on single-pilot operational behavior for reference in future studies.
Therefore in the Results section, we have reported findings related to such things as G1000 PFD
and MFD features used, radio set-up, and checklists in addition to the topics of primary interest
here (i.e., automation use and workload management). Although they each pertain to pilot
workload and task management, for the most part we will not discuss those ancillary findings
here.
We remind readers that our discussion of findings related to single-pilot workload
management and automation use pertains only to the tasks presented in the scenarios.
Additionally, caution should be exercised when generalizing our findings to the population of
VLJ/ELJ pilots as a whole because of our small sample size and potential confounds: participant
self-selection, participant willingness and ability to travel to the experiment site, and a lack of
representative participant gender distribution. Furthermore, our small sample size contributed to
low statistical power, so our analyses were susceptible to type II errors (i.e., significant
differences that truly existed were not identified by the statistics). However, findings that were
found to be statistically significant do indicate true differences among the pilots who participated
in this study.

129
Participants
When manufacturers’ intent to produce VLJs came to the fore almost a decade ago, some
in the industry expressed concern that owner-operators, in particular, might have some
difficulties in managing workload in such advanced high performance aircraft (FSF, 2005;
NBAA, 2005). Professional pilots, by the very nature of their jobs, tend to accrue more hours of
flying each year and often undergo recurrent training more frequently than owner-operators.
Therefore, when we planned this study we intended to study workload management strategies
and automation use by owner-operators, rather than by professional pilots. However, due to
scheduling issues and the rates at which owner-operators volunteered to participate, we ended up
with a participant pool representing half of each pilot type.
Interestingly, we found few significant differences between the two groups with regard to
flight experience in all aircraft or in the Citation Mustang alone (total hours flown, hours flown
in the past year or preceding three months, single-pilot hours) or in their reported experience and
skill with different types of advanced avionics. We found no significant differences in
performance, errors made, or success rates in accomplishing the major tasks analyzed due to
pilot type.
It is possible that the owner-operators in our study were more experienced than most
and/or that owner-operators with less experience or skill did not volunteer to participate. It is
also possible that the professional pilots who participated in the study fly less frequently or are
less capable than those who did not participate. We have no evidence or reason to believe that
this is so and can only reiterate that, as groups, the owner-operators and the professional pilots in
our study performed equally well. Additionally, unlike in other studies (Kennedy, Taylor,

130
Reade, & Yesavage, 2010; Tsang & Shaner, 1998) we found no significant difference in task
success as a function of age, which ranged from 29 to 61 years (M = 48.9 years).
Workload Management
The two legs of the experimental flight were designed to involve a fairly high degree of
workload but various conditions that were unplanned and unexpected added to the workload
experienced by our participants. Eight participants had to deal with an unscripted FD failure at
the same time they were accomplishing the scripted tasks. Additionally, many pilots reported
difficulty hearing ATC because of problems with the simulator audio system, and most pilots
occasionally used a flashlight when referring to paper checklists and charts due to insufficient
lighting in the simulator. Although certainly not intended, these conditions replicated the less
than ideal conditions that exist from time-to-time in the real operational environment. All
participants in our study persisted and responded to these problems with professionalism.
Workload management when piloting technologically advanced aircraft involves the
allocation of mental resources to accomplish multiple tasks concurrently. There are three main
theories in cognitive psychology with regard to how this might be done. According to the single
channel theory (SCT; Broadbent, 1958), individuals complete tasks sequentially and only move
on to a new task when all of the steps for the first task have been completed. In contrast, the
single resource theory (SRT; Kahneman, 1973) suggests that an individual can allocate mental
resources to multiple tasks concurrently. Multiple resource theory (MRT; Wickens, 2002, 2008)
extends SRT by proposing that concurrent tasks can be most efficiently accomplished when they
do not require the same resource, such as vision, and instead utilize two different resources, such
as vision and hearing. We witnessed approaches to workload and task management in this study
supportive, to some degree, of all three theories.

131
Most participants completed short tasks in their entirety, such as dialing in a new altitude,
before moving on to other tasks (SCT). Some participants also demonstrated a similarly focused
method when programming the G1000 (also SCT). Almost all performed other tasks
concurrently such as dialing in a new heading while listening to the rest of an ATC clearance
(MRT). Many participants also interleaved the steps associated with two or more tasks, both
requiring the same resource, such as when they interrupted programming the G1000 to perform
an instrument scan (“SRT”,7 both requiring vision). As would be expected, most participants
chose to interleave more lengthy automation programming with other cockpit tasks. This
generally increased the amount of time required to complete the programming as compared to
not attending to other tasks concurrently and focusing on programming alone. However,
contrary to what one might expect, those who programmed the G1000 without interruption, e.g.,
for the approach at KHSP or to meet a crossing restriction, made just as many programming
errors as those who interleaved other tasks while programming.
Participants utilized a variety of techniques to deal with workload that had increased to
such a degree as to threaten task completion. Some, but not all, participants experiencing high
workload chose to slow the aircraft down to buy time. Likewise, on occasion we witnessed
someone shedding or truncating a task, such as acknowledging an ATC traffic alert with only
one’s aircraft call sign and then not personally scanning for the traffic. These two strategies
tended to be used less often than others we witnessed such as requesting vectors or alternate
routing from ATC. In future studies, it would be informative to evaluate the use of strategies for
excessive workload management that are controlled by the pilot (e.g., slowing the aircraft,
shedding tasks) as compared to those involving assistance from the outside (i.e., ATC). Both are
7 SRT posits that two tasks can be performed at the same time; whereas here, pilots performed two tasksconcurrently, both requiring the same resource—vision, by interleaving the steps associated with each andalternating between them.

132
certainly necessary and appropriate in various situations. We found that those who utilized
methods under their own control, such as by reducing airspeed, often accomplished the scripted
tasks successfully. Please note, however, that rarely were participants in our study given vectors
they requested from ATC as we did not want them to shortcut the flights and bypass scripted
tasks.
Almost all participants were proactive in reducing later workload by taking care of some
tasks as early in the flight as possible. This longstanding principle of completing as many tasks
as possible during low workload periods to reduce the number that must be performed during
periods of higher workload (FAA, 2008b; Jeppesen Sanderson, 2002) generally worked well for
our participants, particularly the two who programmed the approach at KHSP very early. It
would be interesting to examine, in a future study, the efficacy of this strategy for programming
instrument approaches even if it means that changes are required later.
An important part of workload management involves the ways in which tasks and
subtasks are prioritized relative to each other (Funk et al., 2003; Hoover, & Russ-Eft, 2005;
Morris & Leung, 2006). During post-flight debriefings, most pilots reported that they subscribe
to the aviate-navigate-communicate (ANC) scheme for prioritizing tasks and structuring the
management of workload, even though some of them did not demonstrate this in practice during
the study. ANC has long been taught and may have made sense as an approach to task
prioritization in legacy cockpits with traditional round dials and primitive or no autopilots.
However, we were curious about whether this scheme still makes sense in glass cockpits, with
advanced autoflight systems and high AP use. The lack of eye tracking data in our study kept us
from being able to test any hypotheses, but we believe that this is certainly a question that
warrants further research.

133
ANC aside, we found that task prioritization relative to the amount of time available was
essential in leading to task success. Nowhere was this more evident than in the reroute task in
which participants were given minimal time to understand the reroute clearance and enter in the
first new waypoint before the AP was to direct a turn. Time available was also a factor related to
task success for those participants who had not adequately briefed and prepared for the
instrument approach at KHSP prior to the end of the lost pilot scenario. In both cases, delaying
actions or a request for vectors or alternate routing often became necessary because the
participants had not or had not been able to conceptualize the tasks in terms of their temporal
demands and respond accordingly.
Automation Use
There are three main types of automation that exist on highly automated aircraft such as
the Cessna Citation Mustang: information, control, and management (Billings, 1997).
Information automation pertains to all of the sources of information available and presented to
the pilot on the PFD and MFD such as airspeed, traffic, engine parameters, moving maps, and
alerts. Control automation pertains to actual aircraft control through stick, rudder, and yoke
inputs in a fly-by-wire aircraft, which was not a factor in this study, and control of the aircraft
through the autoflight system which was.8 Also of interest in this study was pilot use of
management automation, such as G1000 programming for directing aircraft flight path.
As would be expected in a jet, participants in this study used the autoflight system 90%
or more of the time when flying the two legs of the experimental flight. Professional pilots
tended to use it slightly less and engaged the AP at somewhat higher altitudes after takeoff than
did the owner-operators, but the differences between the two groups of pilots were not great.
8 There is not uniform agreement within the industry whether the autoflight system should be considered controlautomation or management automation. In this report, we consider it to be a type of control automation.

134
When performing common activities using the G1000, our participants generally made inputs
that were quick and sure, and they appeared to have little difficulty finding information they
desired through the MFD. Exceptions to this were the difficulties some participants had in
programming the reroute and the instrument approach at KHSP, both relatively common tasks.
These results will be discussed later.
There were multiple ways in which our participants could use the control and
management automation to accomplish the major tasks analyzed for this report, each
representing different levels at which the automation or the pilot was responsible for managing
the task (Billings, 1997; Parasuraman, Sheridan, & Wickens, 2000). For example, when
descending to make a crossing restriction, the participants who used VPTH were using the most
advanced G1000 function for accomplishing the task. After the participant programmed the
VPTH descent correctly, the automation was responsible for initiating and managing the descent
and ensuring the aircraft was at the proper altitude to make the crossing restriction. In contrast,
participants who used VS for the descent had few steps to complete when setting up and
engaging VS mode but were responsible for deciding when to initiate the descent and for
choosing the descent rate. These participants also had to monitor the closure rate with the
waypoint where the crossing restriction was to be met and make adjustments to airspeed and/or
descent rate if it appeared they would end up high. Thus, less “advanced” automation functions
tend to result in higher ongoing workload for the pilots but required less workload initially in
programming or setting up the automation.
We found that when participants were confronted with high workload, they tended to opt
for a lower level of automation to reduce their workload in the moment, even though that meant
their overall ongoing workload might be greater. During post-flight debriefings some

135
participants who chose less advanced automation functions (e.g., VOR navigation rather than the
GPS OBS function for the BWZ radial intercept) expressed some distrust of the automation or of
“not wanting to mess up what they already had in there” indicating some lack of comfort with
setting up or using the G1000 management automation to its fullest extent or in the most
advanced ways possible.
We suggest that a related factor integrally connected to level of automation chosen with
regard to workload management is the level or layer at which the automated function is
accessible to the pilot through the avionics interface. Automated functions that are operated
using the mode control panel (i.e., control automation) could be thought of as being at the zero
layer of accessibility—the mode control panel is presented directly in front of the pilot at all
times and no buttons must be pressed or menus selected for the mode control panel to be
displayed for use. Thus, to select VS mode for the descent to meet a crossing restriction, such as
in Event 4, the pilot has only to reach up and, using only the mode control panel, select VS
mode, a rate of descent and, ideally, an altitude at which one desires to stop. In contrast, to use
management automation such as VPTH for a descent to meet a crossing restriction in the G1000,
one must first bring up the flight plan on the screen, if not already displayed—down one layer of
accessibility. To activate the cursor to manipulate the flight plan, the FMS button must be
pressed—down a second layer. Presuming the waypoint where the crossing restriction to be met
is already in the flight plan, the altitude for the restriction can be set at this accessibility layer. In
the case where the waypoint is not already in the flight plan, further layers of accessibility must
be reached to add the waypoint or, in the case of the task in Event 4, create an along track offset.
Working through the layers of an interface has a cognitive cost. One must first remember
the proper actions to take to get to the desired layers and then determine the proper inputs to be

136
made—both require memory (declarative and procedural) as well as other higher executive
cognitive functions, such as reasoning (Anderson, 2000; Fennell, Sherry, Roberts, & Feary,
2006; Norman & Shallice, 1986). Sometimes, through design, the interface helps to prompt the
pilot to get to the needed layers for making the necessary inputs. Other times, the pilot must
recall how to navigate the various interface layers without such prompts or guidance. Therefore,
it is highly possible that when workload was high in the current study, some participants selected
a particular automation strategy based not upon level of automation (how much control the pilot
or the automation had for accomplishing the task), but rather on how easily accessible the
automated function was and the cognitive demand involved. Therefore, it is possible that easy
accessibility with less mental effort to decrease immediate workload took precedence even if it
meant that workload downstream would be greater.
When confronted with a task not commonly performed, and one for which the G1000
was not designed to support with minimal inputs, such as the BWZ radial intercept, over half of
the participants seemed initially unsure how to approach programming. Of the seven participants
who successfully completed the task, only one used the most advanced strategy (GPS OBS
function), one with which some of the participants may have been less familiar. So again,
participants may have chosen a strategy involving less cognitive demand, greater familiarity,
and, in the case of VOR navigation, fewer steps to minimize their workload. It appears that
efficiency in management automation use, resulting in reduced workload, is more complex than
simply choosing the strategy that involves the fewest number of inputs or steps. It may also
involve comfort level and familiarity with the levels of automation and programming
requirements, as well as temporal and cognitive demands of the overall task. These are certainly
questions requiring future study.

137
Successful Task Completion and Errors
Previous flight experience was only found to have a significant association with task
success in Event 1, setting up the G1000 to intercept the BWZ 208o radial. For that task,
participants who were successful had accrued significantly more total flight hours, as well as
more hours over the previous 12 and 3 months, in all types of aircraft, compared with those who
were not successful. Thus, our overall results for all four events are not strongly supportive of
the notion that greater flight experience yields better overall flight performance. It is possible
that we lacked sufficient statistical power to identify any other real effects of experience on
performance that might have existed, though we are unable to know for sure.
Some of the tasks analyzed for this report are relatively common, such as programming
the reroute and the instrument approach at KHSP, and the number of participants who had
problems accomplishing them was unexpected. It is possible that a variety of factors contributed
to these difficulties including lack of familiarity with the geographical area, residual stress
associated with earlier difficulties, fatigue, and/or poor management of workload relative to the
temporal demands of the tasks. If so, these factors may have required more effortful, and time
consuming, controlled cognitive processing rather than the faster automatic cognitive processing
typically seen when experts perform highly practiced tasks (Leach, 2005; Norman & Shallice,
1986).
When acquiring and performing a complex skill such as flying a high-performance jet as
a single pilot, evidence suggests that the transition from controlled processing to automatic
processing is neither a one-time event nor a permanent change (Shebilske, Goettl, & Regian,
1999). After an aspect of a task has been automated, it is sometimes necessary to bring it back
under controlled processing to alter its performance or to more fully integrate it with other

138
components of the task. Even when the entire task can be performed automatically, the operator
may have to revert to controlled processing when various anomalies occur. This reversion to
controlled processing was likely occurring at a higher frequency among the pilots in this study
because the routes and airfields were unfamiliar to most of them, the overall workload of the
flights was greater than many reported being used to, and performance difficulties generally
require more effortful controlled processing to sort out (Norman & Shallice, 1986).
Some of the problems participants experienced and errors they committed evidenced
various cognitive failures. For example, forgetting to delete non-pertinent waypoints from a
flight plan or enter in all the new waypoints in a reroute, forgetting to check in with a new
controller, and forgetting to select a lateral or vertical mode or complete a step in using the
autoflight system are all examples of prospective memory failure—forgetting to perform an
intended action at some later point (Boer, 1997; Dismukes, 2010). Many, if not all of the
prospective memory failures, may have occurred because of distraction or interruptions (Dodhia
& Dismukes, 2009). Distraction, sometimes self-induced, was also likely a factor in participants
making some programming errors, particularly when experiencing the FD failure, and in not
catching some errors for several seconds after the aircraft behaved differently than intended.
Although Wiener (1989) found that in highly automated aircraft, pilot capacity and
productivity increases along with a decreasing manual workload, more precise handling of the
systems is required and there is more room for input errors. Wioland & Doireau (1995) found
that pilots were able to detect 70% of their own input errors; however the detection rate fell to
40% when pilots were tasked with detecting automation errors and errors committed by their co-
pilots.

139
In addition to input or programming errors, in the current study we also observed some
related problems with cognitive processing (e.g., not understanding who could hear whom in the
lost pilot scenario). Other errors appeared associated with some confusion about how the
automation worked (e.g., reversion to roll mode when the AP is on but a lateral mode has not
been chosen). Obviously all the errors just described that are of a cognitive nature provide
further support for the idea that highly automated aircraft place a heavy cognitive load on the
pilot (e.g., Burian & Dismukes, 2007; Sarter, Woods, & Billings, 1997).
However, the way in which the automation is designed can increase or decrease this load.
For example, the reroute clearance in Event 2 was “Citation XXXX is now cleared to Martin
State Airport via J75, Modena, direct Dupont, Victor 214 to KERNO, direct JUGMO, direct
Martin State.” After entering Dupont (DQO), more than one participant was clearly attempting
to add the Victor 214 airway to their flight plan. However, in the Mustang G1000, an airway can
be added to a flight plan only after a waypoint following the airway entry point has been
chosen—in this case, KERNO (Garmin Ltd., 2006). In other words, the option for adding Victor
214 to the flight plan was only presented to participants after they selected KERNO; it was not
available after their selection and addition of DQO. Flight plans are chronological by their
nature and it is not surprising that some participants may not have remembered that an airway is
inserted before a selected waypoint (i.e., going “backwards” in the flight plan) rather than after
one.
Earlier, we suggested that distraction may have been a factor when some participants did
not catching programming errors until the aircraft behaved in unintended ways. It is also
possible that, rather than distraction, a certain amount of automation-induced “complacency”
was to blame (Funk et al., 1999; Parasuraman, Molloy, & Singh, 1993). Highly automated

140
aircraft have a high degree of reliability and over time, experienced pilots flying them may
become over-reliant on the aircraft and automation to perform as expected. Many in the industry
have emphasized the need for pilots to fight that urge and actively monitor automation—never
just “set it and forget it” (Sarter, Woods, & Billings, 1997). It is somewhat ironic though, that
automation is a boon to workload reduction, particularly in single-pilot operations, and yet, the
pilot’s reduced workload is increased by the need to monitor the very thing that reduced it in the
first place. Despite this, we certainly found evidence that active monitoring was essential for
catching programming errors. Our findings support the need, particularly in single-pilot
operations, for achieving a balance between monitoring the automation and deferring to the
automation to manage things so the pilot may attend to other tasks. Future research could help
identify an optimal balance between these activities, as well as determine if there are some
aspects of automated functioning that might require less or more monitoring overall or during
certain tasks.
Some of the errors committed by participants were unexpected. For example, we were
surprised by the high number of airspeed violations in Event 1. Distraction due to the unscripted
FD failure may account for some, but even among those who did not experience the failure,
airspeed violations were prevalent, particularly exceeding 200 KIAS below the Class B veil and
in Class D airspace. Only one participant had airspace boundaries depicted on his navigation
map display, and he could be heard making comments about airspace and speed limits as he
flew. It is possible that the others were not as attentive to airspace as they might normally be
because this was a simulation study. They may have assumed that such restrictions were not
important in a study and/or have expected to be given airspeed restrictions from ATC if they
were.

141
We were also surprised by the high number of participants who neglected to contact ATC
to inform them that they had initiated their descent from 16,000 ft MSL in Event 4 (n = 10; not a
requirement but considered good practice) and that none of the participants who failed to meet
the crossing restrictions in Events 2 or 4 contacted ATC to inform them (n = 4 and n = 1,
respectively). These behaviors could represent prospective memory failures or, again, be
associated with the somewhat artificial nature of a study where the participant is really the only
pilot in the sky, and traffic conflicts are not truly a concern. Nonetheless, participants were
instructed to fly as they normally do so it was troubling that these important radio calls were not
made.
More than half of the participants (n = 8) also landed at KHSP with an incorrect altimeter
setting. We suspect that something other than study complacency might be related to this error.
The highest cruise altitude that participants flew during leg 2 was FL200, but they were cleared
to the lower cruise altitude of 16,000 ft MSL, due to traffic, when they were still 120 nm away
from KHSP. When they transitioned through FL180 they were given the local altimeter setting
for that area (Culpepper, VA: 29.86 mmHg). Although most participants were informed of the
KHSP 29.84 altimeter setting through the KHSP ASOS, many did not note the difference and
reset it. Of course, distraction could be a factor as workload was high. We also do not know if
participants routinely skip adjusting the altimeter for such a small change. Another possibility is
that expectations ingrained from experience, where the descent through FL180 occurs much
closer to the destination airport and the altimeter setting given by ATC at that time is the setting
for that airport, contributed to participants not attending to the change—a type of expectation
bias. Furthermore, the descent checklist, which prompts participants to check the altimeter
setting, was likely completed when they descended from FL200. This item is not repeated on
142
either the approach or before landing checklists for the Citation Mustang. In this scenario where
atmospheric changes were fairly small and gradual and visibility at the airport was relatively
good, such an error made little difference. However, we believe that it is generally good practice
for pilots to regularly check the local altimeter setting just prior to initiating an instrument
approach for those times when conditions are not so stable or benign (e.g., NTSB, 1996).
Finally, we noted that poor flying skills were demonstrated when some participants flew
manually, particularly associated with the FD failure. Our participants were not unusual in that.
It has been demonstrated that after the introduction of highly automated flight systems, transport
category aircraft crews were also observed with reduced proficiency in manual flying
(Helmreich, Hines & Wilhelm, 1996). The concern about reduced manual flying proficiency has
been echoed by many in the industry (Abbott, 2012; Masson, 2011; Turner, 2009).
During debriefing interviews and conversations during breaks, several participants
discussed the importance of the autoflight system for managing their workload as single pilots.
A few also expressed concerns that their manual flying skills were not as sharp as they once
were. When participants were asked what they could do about that, they suggested flying the
simulator manually more during recurrent training. In his research, Wiener (1988) found that
airline transport pilots flying highly automated aircraft routinely fly portions of their flights
manually because of a fear of losing their basic flight skills. The Commercial Aviation Safety
Team (2008) recommended that pilots of all aircraft avoid over-reliance on automation because
of its potential detriment to manual flying skills. They also recommended that pilots manually fly
their aircraft to maintain proficiency when flight conditions permit.
Study Limitations and Recommended Future Studies

143
There are limitations in all research and this study is no exception. The pilots in our
study volunteered to participate (i.e., they were self-selected), so they may not be representative
of VLJ/ELJ owner-operators and professional pilots at large. And, because this was an
exploratory study, the number of pilots participating was fairly small. Therefore, statistical
power was limited, which precludes our ability to generalize our findings beyond the pilots who
participated.
As described earlier, there is some artificiality in flying a simulator as part of a study, so
some of the ways in which our participants flew may not perfectly match the ways they fly in
real life. Finally, although we allowed participants as much time to prepare for the experimental
flights as they wanted, many were not familiar with the busy East Coast corridor where the
flights took place. Had they undertaken those flights in real life, they might have taken
considerably longer to prepare for them, perhaps even spread out over several days, and might
have taken along a second pilot to help manage some of the workload. A few pilots said as much
during the debriefing interviews.
Based on our findings and observations, we have a number of questions and suggestions
for future research. Some have already been mentioned earlier, but all are summarized here.
When workload is very high, does task success rate vary as a function of the type of
workload management strategy employed (pilot controlled vs. asking for outside
assistance from ATC)? Are some workload management strategies more or less
successful for different kinds of tasks, for different phases of flight, or for single
pilots vs. crews? Do the strategies differ for pilots flying jets as compared to piston
aircraft?

144
What is the efficacy of loading an expected instrument approach into the automation
very early during a flight (i.e., while still en route)? Does any advantage found still
remain if the expected approach is incorrect and the automation must be
reprogrammed? Do the cost-benefit tradeoffs suggest that this is a good workload
management strategy and if so, under what conditions is that true?
Does the ANC workload prioritization scheme for single pilots make sense in glass
cockpits with advanced autoflight systems and high AP use?
Will the findings in this study that single pilots tend to revert to lower levels or more
easily accessible control automation to reduce workload in the short term, even
though it might entail higher levels of ongoing workload management, be found in
other studies with other participants? If so, which appears to be the more significant
driver in automation selection: level of control or layer of accessibility/cognitive
demand?
How does pilots’ baseline knowledge of control and management automation use and
their mental models about automation functionality relate to different levels or types
of automation actually employed to accomplish flying tasks and the rates at which
they are successful in accomplishing those tasks in single-pilot operations?
Assuming that greater automation efficiency leads to better workload management,
further explore what comprises automation efficacy and does this change for different
tasks? Consider the following aspects, among others:
o level or type of automation
o level of familiarity/degree of comfort with both the task and the automation
employed

145
o layer of accessibility through the avionics interface
o number of steps required for programming/setting up the automation
o cognitive demands for completing the programming/set-up tasks (e.g.,
recognition vs. recall steps; Fennell et al., 2006)
o cognitive and temporal demands of the task
Determine, if possible, the optimal balance between time spent monitoring
automation and time spent focusing on other tasks, and identify if this optimal
balance changes as a function of task or phase of flight
Examine the efficacy of using instrument charts on paper vs. MFD vs. iPad/PDD or
some combination of two or all three of them for navigating an IFR flight by a single
pilot
Are pilot automation use and errors committed associated with frequency of use or
the use of different avionics systems in other aircraft?
Recommendations for Workload Management and Automation Use
We were quite privileged to witness some very fine flying by our participants in this
study. Techniques observed, which we have characterized as “best practices,” as well as some
other things for pilots to consider, are summarized in Appendix F. Some of those best practices
are also captured below in our list of recommended strategies for automation use and
countermeasures to task overload and workload breakdowns. By their very nature, findings from
observational studies, such as this one, do not lend themselves to generating of a lot of definitive
recommendations. In the list of recommendations below, some are tentative and should be
verified through future research.

146
To the extent that it is feasible, pilots should consider completing short, easily
performed tasks associated with ATC clearances quickly, such as dialing in a new
heading while listening to the rest of the ATC clearance.
Pilots should be prepared to copy (in writing) or audio-record an ATC clearance
involving a reroute or hold and not try to rely upon their memory.
When considering a task involving automation programming, participants should
consider any time constraints related to intended automation function and time
available to guide decisions about programming strategy and level or type of
automation to select.
Pilots should complete as many tasks as possible early during periods of low
workload. Research is needed to evaluate the cost-benefit trade-offs of pilots
programming an expected, but not confirmed, instrument approach while still at
cruise.
Pilots should avail themselves of the full range of workload management strategies
such as reducing airspeed (with notification to ATC as required), being intentional
when shedding or truncating tasks, altering type of control or management
automation selected, and asking for ATC assistance (vectors, a hold, etc.).
In times of high workload when faced with needing to select a type of automation,
pilots might consider the option of selecting a lower level of automation (i.e., control
automation) initially to begin the task or maneuver and, if appropriate, program a
higher level of automation (i.e., management automation) to complete the maneuver
as soon as possible to reduce their ongoing workload. Further research is needed first
to evaluate the efficacy and safety of this strategy.

147
During periods of automation mode changes (e.g., level off at top of climb) pilots
should briefly refrain from other tasks and monitor the automation and aircraft
behavior to make sure the aircraft performs the action as intended.
When leveling off from a climb or descent, we suggest that pilots establish a practice
of putting their hands on the thrust levers to make necessary speed adjustments as
they monitor the automation and aircraft behavior.
If the autopilot is not in use, the flight director should either be programmed or
disengaged to eliminate distracting flight control prompts that do not match those
actually being made.
We suggest that pilots dial in the frequency for the instrument approach in use at their
departure airport, if applicable, prior to departure, and have the charts easily
accessible in case they need to immediately return to the airport after takeoff.
When deferring a task until a later time, we suggest that pilots take a moment and
form an explicit intention about completing the task and when. For example, say to
yourself, “Report to ATC when I level out at cruise.” External memory aids or cues,
such as placing an incomplete checklist between the throttle levers or on your lap, can
also assist with recalling the need to perform deferred actions (Dismukes, 2010).
Conclusion
Technology is intended to make our lives easier and more productive. However, there are
always unintended consequences involved with the introduction and use of technology. When it
is incorporated into the cockpit of an aircraft, advanced cockpit displays and automated flight
systems can relieve the pilot of many of the immediate tasks associated with navigating and
flying the aircraft. At the same time, these systems also introduce a need to learn and memorize a

148
bewildering amount of procedures and information for interacting with the automation and the
aircraft. Well-designed automation is required to support an effective human-automation
partnership and reduce the cognitive load associated with automation use. The current study has
demonstrated that the presence of advanced technology in the cockpit does not necessarily
eliminate high workload events during a flight. These events can tax a pilot’s cognitive
resources to the point that errors in navigation and flight control occur. We hope that the
recommendations and research generated from this study will lead to safety and efficiency
enhancements for single-pilot operation of technologically advanced aircraft.

149
References
Abbott, K. (2012). FAA automation workshop. Presented at the August 2012 meeting of the
CNS Task Force, Boston, MA.
Air Safety Institute. (2012). The Accident Record of Technologically Advanced Aircraft.
Frederick, MD: Aircraft Owners and Pilots Association.
Aircraft Owners and Pilots Association [AOPA] (2007). Technologically advanced aircraft:
Safety and training. Frederick, MD: AOPA Air Safety Foundation. Frederick, MD.
Aircraft Owners and Pilots Association [AOPA] (2012, August 6). Retrieved from
http://download.aopa.org/ustprocs/current/NE-3/hsp_ils_or_loc_rwy_25.pdf
Anderson, J. R. (2000). Cognitive psychology and its implications, 5th ed. New York: Worth.
Billings, C. E. (1997). Aviation automation: The search for a human-centered approach.
Mahwah, NJ: Lawrence Erlbaum Associates.
Boer, L. C. (1997). Remembering to do a task: An element of cockpit management. In H.M.
Soekkha (Ed.), Aviation safety: Human factors, system engineering, flight operations,
economics, strategies, management (pp 455-464). Utrecht, the Netherlands: VSP.
Boersma, Paul & Weenink, David (2012). Praat: doing phonetics by computer (Version 5.3.22)
[computer software]. Available from http://www.praat.org/
Brenner, M., Doherty, E. T., & Shipp, T. (1994). Speech measures indicating workload
demand. Aviation, Space, and Environmental Medicine, 65(1), 21-26.
Broadbent, D. (1958). Perception and communications. New York: Permagon.
Burian, B. K. (2007). Very light jets in the national airspace system. Proceedings of the 14th
International Symposium on Aviation Psychology. Dayton, OH.

150
Burian, B. K., Christopher, B., Fry, D. G., Pruchnicki, S., & Silverman, E. (2013). Single jet
pilot simulation study scenario overviews, task analyses, and concurrent task timelines.
NASA Technical Memorandum.
Burian, B. K., & Dismukes, R. K. (2007). Alone at 41,000 feet: Single-pilot operations in
technically advanced aircraft. Aero Safety World, (11), 30-34.
Burian, B. K., & Dismukes, R. K. (2009). Single-pilot VLJ operations. The Aerospace
Professional, 2, 17-21.
Burian, B. K., Pruchnicki, S., & Fry, D. G. (2013). Entry-level jet single-pilot human-in-the-
loop simulation research: Study scripts and radio background chatter dialogue. NASA
Technical Memorandum.
Burin, J. (2011). Keys to a safe arrival. Aero Safety World, (10), 14-17.
Byers, J. C., Bittner, A. C., and Hill, S.G. (1989). Traditional and raw task load index (TLX)
correlations: are paired comparisons necessary? In A. Mital (Ed.), Advances in Industrial
Ergonomics and Safety (pp. 481-485). London: Taylor & Francis.
Casner, S. M. (2003). Learning about cockpit automation: From piston trainer to jet transport.
NASA Technical Memorandum, NASA/TM-2003-212260.
Castle, H. and Leggatt, H. (2002). Instantaneous self assessment (ISA) validity & reliability. JS
14865 (1). Bristol, United Kingdom: BAE Systems.
Cessna Aircraft Compnay. (ND). Maneuvers and Procedures. Citation Mustang Operating
Manual. Wichita, KS: Cessna Aircraft Company
Chou, C., Madhavan, D., & Funk, K. (1996). Studies of cockpit task management errors.
International Journal of Aviation Psychology, 6(4), 307-320.

151
Christopher, B. (2013). An analysis of speech factors as indictors of cognitive
workload. Manuscript in preparation.
Clark, R. E., Feldon, D., vanMerrienboer, J., Yates, K, & Early, S. (2008). Cognitive task
analysis. In Spector, J. M., Merrill, M. D., van Merriënboer, J. J. G., & Driscoll, M. P.
(Eds.) Handbook of research on educational communications and technology (3rd ed.).
Mahwah, NJ: Lawrence Erlbaum Associates.
Commercial Aviation Safety Team [CAST]. (2008). Mode awareness and energy state
management aspects of flight deck automation. Safety Enhancement 30 (5th rev.).
Washington DC: CAST.
de Jong, N.H. & Wempe, T. (2009). Praat script to detect syllable nuclei and measure speech rate
automatically. Behavior Research Methods, 41(2), 385 – 390.
Deutsch, S., & Pew, R. W. (2005). Single Pilot Commercial Aircraft Operation (BBN Report
No. 8436). Cambridge, MA: BBN Technologies.
Dismukes, R. K. (2010). Remembrance of things future: Prospective memory in laboratory,
workplace, and everyday settings. In D. H. Harris (Ed), Reviews of Human Factors and
Ergonomics, 6(1), 79-122. Santa Monica, CA: Human Factors and Ergonomics Society.
Dismukes, R. K., & Berman, B. (2010). Checklists and monitoring in the cockpit: Why crucial
defenses sometimes fail. NASA Technical Memorandum, NASA/TM—2010-216396.
Dismukes, K., Berman, B. A., & Loukopoulos, L. D. (2007). The limits of expertise : rethinking
pilot error and the causes of airline accidents. Aldershot, Hampshire, England: Ashgate.
Dodhia, R. M., & Dismukes, R. K. (2009). Interruptions create prospective memory tasks.
Applied Cognitive Psychology, 23(1), 73-89.

152
Farmer, E. and Brownson, A. (2003). Review of workload measurement, analysis and
interpretation methods (CARE-Integra-TRS-130-02-WP2). European Organisation for
The Safety of Air Navigation.
Federal Aviation Administration [FAA] (2008a). Airline transport pilot and aircraft type rating
practical test standards for airplane. FAA-S-8081-5F. Washington, DC: U.S.: GPO.
Federal Aviation Administration [FAA] (2008b). Instrument flying handbook. FAA-H-8083-
15A. Washington, DC: U.S. Government Printing Office.
Federal Aviation Administration [FAA] (2010). Instrument rating practical test standards for
airplane, helicopter, and powered lift. FAA-S-8081-4E w/ changes 1 and 2. Washington,
DC: U.S. Government Printing Office.
Federal Aviation Administration [FAA] (2012). NextGen Implementation Plan. Washington,
DC: U.S. Government Printing Office.
Fennell, K., Sherry, L., Roberts, R. J., & Feary, M. (2006). Difficult access: The impact of
recall steps on flight management system errors. International Journal of Aviation
Psychology, 16(2), 175-196.
Flight Safety Foundation (FSF). (2005). Here come the very light jets. Flight Safety Digest,
24(7), 1-34.
Funk, K. H., Colvin, K., Bishara., S., Nicolalde, J., Shakeri, S., Chen, J. Y., & Braune, R.
(2003). Training pilots to prioritize tasks: Theoretical foundations and preliminary
experiments. Final Report, NASA Grant NAG 2-1287. Corvallis, OR: Oregon State
University.

153
Funk, K., Lyall, B., Wilson, J., Vint, R., Niemczyk, M., Suroteguh, C., & Owen, G. (1999).
Flight deck automation issues. International Journal of Aviation Psychology, 9(2), 109-
123.
Garmin Ltd. (2006). Garmin G1000 pilot’s guide for the cessna citation mustang. Olathe, KS:
Garmin International, Inc.
General Aviation Manufacturers Association [GAMA] (2000). Recommended practices and
guidelines for part 23 cockpit/flight deck design. GAMA Publication No. 10.
Washington, DC: author.
General Aviation Manufacturers Association [GAMA] (2005). Recommended practices and
guidelines for an integrated cockpit/flight deck in a 14 CFR part 23 certificated airplane.
GAMA Publication No. 12. Washington, DC: author.
Gopher, D., Armony, L., & Greenshpan, Y. (2000). Switching tasks and attention policies.
Journal of Experimental Psychology: General, 129(3), 308-339.
Gorovoy, K., Tung, J., & Poupart, P. (2010). Automatic speech feature extraction for cognitive
load classification. Conference of the Canadian Medical and Biological Engineering
Society (CMBEC), Vancouver, BC.
Griffin, G. R., & Williams, C. E. (1987). The effects of different levels of task complexity on
three vocal measures. Aviation, Space, and Environmental Medicine, 58(12), 1165-1170.
Hart, S. G. (2006). NASA-Task Load Index (NASA-TLX); 20 Years Later. Proceedings of the
Human Factors and Ergonomics Society 50th Annual Meeting, 904-908. Santa Monica:
HFES.
154
Hart, S. G. & Staveland, L. E. (1988) Development of NASA-TLX (Task Load Index): Results
of empirical and theoretical research. In P. A. Hancock and N. Meshkati (Eds.), Human
Mental Workload (pp. 139-183). Amsterdam: North Holland Press.
Helmreich, R. L., Hines, W. E., & Wilhelm, J. A. (1996). Issues in crew resource management
and automation use: Data from line audits (Technical Report No. 96-2). Austin, TX:
University of Texas Aerospace Crew Research Project.
Hinton, D. A. & Shaughnessy, J. D. (1984). The pilot interface with cockpit automation and
advanced avionics systems. NASA Technical Memorandum, NASA/TM-1984-2241.
Hoh, R., Bergeron, H. P., Hinton, D. A. (1983). Practical guidance for the design of controls and
displays for single pilot IFR. Proceedings from the Second Aerospace Behavioral
Engineering Technology Conference. Warrendale, PA.
Hoover, A. L., & Russ-Eft, D. F. (2005). Effect of concurrent task management training on
single pilot task prioritization performance. International Journal of Applied Aviation
Studies, 5(2), 233-251.
Howell, W.C., & Cooke, N. J. (1989). Training the human information processor: A look at
cognitive models. In I. Goldstein (Ed.), Training and Development in Work
Organizations: Frontier Series of Industrial and Organizational Psychology, Volume 3,
(pp. 121-182). New York: Jossey Bass.
Huttunen, K., Keränen, H., Väyrynen, E., Pääkkönen, R., & Leino, T. (2011). Effect of
cognitive load on speech prosody in aviation: Evidence from military simulator flights.
Applied Ergonomics, 42(2), 348-357.
Jeppesen Sanderson (2002). Instrument commercial manual. Englewood, CO: Author.

155
Kahneman, D. (1973). Attention and effort. Englewood Cliffs, NJ: Prentice Hall.
Kennedy, Q., Taylor, J. L., Reade, G., & Yesavage, J. A. (2010). Age and expertise effects in
aviation decision making and flight control in a flight simulator. Aviation, Space, and
Environmental Medicine, 81(5), 489-497.
Layton, C., Smith, P.J. & McCoy, C.E. (1994). Design of a cooperative problem-solving system
for en-route flight planning an empirical evaluation. Human Factors, 36(1), 94-119.
Leach, J. (2005). Cognitive paralysis in an emergency: The role of the supervisory attentional
system. Aviation, Space, and Environmental medicine, 76(2), 134-135.
Loukopoulos, L. D., Dismukes, R. K., & Barshi, I. (2003). Concurrent task demands in the
cockpit: Challenges and vulnerabilities in routine flight operations. Proceedings of the
12th International Symposium on Aviation, Psychology. Dayton, OH: Wright State
University.
Masson, M. A. (2011). EASA Automation Policy. Staying in control – Loss of control
prevention and recovery, EASA Conference, Cologne, Germany.
Mendoza, E. & Carballo, G. (1998). Acoustic analysis of induced vocal stress by means of
cognitive workload tasks. Journal of Voice, 12(3), 263-273.
Miller, S. (2001). Literature review: Workload measures (Document ID: N01-006). Iowa City,
IA: National Advanced Driving Simulator.
Morris, C. H., & Leung, Y. K. (2006). Pilot mental workload: How well do pilots really
perform? Ergonomics, 49(15), 1581-1596.
National Business Aviation Association [NBAA] (2005). Training guidelines for very light jets
and technically advanced aircraft. Retrieved from http://web.nbaa.org/ops/safety/vlj/

156
National Transportation Safety Board [NTSB] (1992). Beechcraft A-36 Bonanza accident
report, Chapel Hill, NC, August 11, 1989. Aircraft Accident Report
NTSB/ATL89FA196. Washington, DC: author.
National Transportation Safety Board [NTSB] (1996). Collision with trees on final approach,
American Airlines flight 1572, McDonnell Douglass MD-83, N566AA, East Granby,
Connecticut, November 12, 1995 (Report No. NTSB/AAR-96/05, PB96-910405).
Washington, DC: author.
National Transportation Safety Board [NTSB] (2010). Introduction of glass cockpit avionics into
light aircraft. Safety study NTSB/SS-10/01. Washington, DC: Author.
Norman, D. A., & Shallice, T. (1986). Attention to action: Willed and automatic control of
behavior. In R.J. Davidson, G.E. Schwartz, & D. Shapiro (Eds.), Consciousness and self-
regulation, (Vol. 4, pp 1-18), New York: Plenum Press. (Originally published in 1980).
Palmer, M. T., Rogers, W. H., Press, H. N., Latorella, K. A., & Abbot, T. S. (1994). A crew-
centered flight deck design philosophy for high-speed civil transport (HSCT) aircraft.
NASA Technical Memorandum, NASA/TM-1994-109171.
Parasuraman, R., Molloy, R., & Singh, I. L. (1993). Performance consequences of automation-
induced “complacency.” International Journal of Aviation Psychology 3(1), 1 – 23.
Parasuraman, R., Sheridan, T. B., & Wickens, C. D. (2000). A model for types and levels of
human interaction with automation. IEEE Transactions on systems, man and cybernetics,
Part A: Systems and humans, 30(3), 286-297.
Patil, S.A., & Hansen, J.H.L. (2007). Speech under stress: Analysis, modeling and recognition.
In C. Müller (Ed.), Speaker classification I: Fundamentals, features, and methods
(pp.108-137). Berlin, Heidelberg: Springer-Verlag.

157
Prinzel, L. J. (2002). The relationship of self-efficacy and complacency in pilot-automation
interaction. NASA Technical Memorandum, NASA/TM-2006-211925.
Roscoe, A. H. (1992, April). Workload in the glass cockpit. Flight Safety Digest, 1-20.
Ruiz, R., Legros, C., & Guell, A. (1990). Voice analysis to predict the psychological or physical
state of a speaker. Aviation, Space, and Environmental Medicine, 61(3), 266-271.
Sarter, N. B., & Woods, D. D. (1992). Pilot interaction with cockpit automation: Operational
experience with the flight management system. International Journal of Aviation
Psychology, 2(4), 303-321.
Sarter, N. B., & Woods, D. D. (1995). “From tool to agent”: The evolution of (cockpit)
automation and its impact on human-machine coordination. Proceedings of the Human
Factors and Ergonomics Society 39th Annual Meeting, 79-83.
Sarter, N. B., Woods, D. D., & Billings, C. E. (1997). Automation surprises. In G. Salvendy
(Ed.), Handbook of Human Factors and Ergonomics (2nd ed.). New York: Wiley.
Schutte, P. C., Goodrich, K. H., Cox, D. E., Jackson, B., Palmer, M. T., Pope, A. T., Schlecht, R.
W., Tedjojuwono, K. K., Trujillo, A. C. , Williams, R. A., Kinney, J. B., and Barry, J. S.
Jr. (2007). The naturalistic flight deck system: An integrated system concept for improved
single-pilot operations. NASA Technical Memorandum. NASA/TM-2007-215090.
Shebilske, W., Goettl, B., & Regian, J. W. (1999). Executive control and automatic
processes as complex skills develop in laboratory and applied settings. In D. Gopher &
A. Koriat (Eds.), Attention and performance XVII: Cognitive regulation of performance:
Interaction of theory and application (pp. 401-432). Cambridge, MA: The MIT Press.
Stokes, A., & Kite, K. (1994). Flight stress: Stress, fatigue, and performance in aviation.
Aldershot, England: Ashgate.
158
Turner, T. P. (2009). You are the backup to safety enhancing aircraft avionics. Aviation Safety.
Retrieved from http://www.aviationsafetymagazine.com/issues/28_8/features,8955-
1.html
Tsang, P. S., & Shaner, T. L. (1998). Age, attention, expertise, and time-sharing performance.
Psychology of Aging, 13(2), 323-347.
Wickens, C. D. (2002). Multiple resources and performance prediction. Theoretical Issues in
Ergonomic Science, 3 (2), 1-19.
Wickens, C. D. (2008). Multiple resources and mental workload. Human Factors, 50 (3), 449-
455.
Wickens, C. D. & Hollands, J. G. (2000). Engineering psychology and human
Performance (3rd ed.). Upper Saddle River, New Jersey: Prentice Hall.
Wiener, E. L. (1981). Complacency: Is the term useful for air safety? Proceedings of the 26th
Corporate Aviation Safety Seminar (pp.116-125). Denver: Flight Safety Foundation, Inc.
Wiener, E. L. (1988). Cockpit automation. In E. L. Wiener & D. C. Nagel (Eds.), Human factors
in aviation (pp.433-461). San Diego, CA: Academic Press.
Wiener, E. L. (1989). The human factors of advanced technology (“glass cockpit”) transport
aircraft. NASA Contractor Report. NASA/CR-1989-177528.
Williams, K., Christopher, B., Drechsler, G., Pruchnicki, S., Rogers, J., Silverman, E., Gildea,
K., Cotton, S., Mead, A., Hackworth, C., & Burian, B. K. (2013). Aviation human-in-
the-loop simulation studies: Data management and transformation approaches in
preparation for analysis. NASA Technical Memorandum.

159
Wioland, L. & Doireau, P. (1995). Detection of human error by an outside observer: A case
study in aviation. 5th European conference on cognitive science approaches to process
control, Espoo, Finland, 54-62.
Zitt, D. (2006). Flying with glass cockpits in general aviation. Proceedings from AOPA Expo
2006. Palm Springs, CA: Aircraft Owners and Pilots Association.

160
Acronyms and Abbreviations
AC Advisory CircularAC_ID Aircraft IdentifiersADDS Aviation Digital Data ServiceAFM Aircraft Flight ManualAGL Above Ground LevelAIM Aeronautical Information ManualAIRMETS Airmen’s Meteorological InformationALAR Approach and Landing Accident ReductionAOM Aircraft Operating ManualAOPA Aircraft Owners and Pilots AssociationARTCC Air Route Traffic Control CentersASOS Automated Surface Observation SystemATC Air Traffic ControlATIS Automated Terminal Information ServiceATP Airline Transport PilotAWOS Automated Weather Observing Systemb/t BetweenCAMI Civil Aerospace Medical InstituteCFIT Controlled Flight Into TerrainCFR Code of Federal RegulationsCRM Crew Resource ManagementCSV Comma-Separated ValueDH Decision HeightDIS DistanceDME Distance Measuring EquipmentELJs Entry Level JetsEMRRS Enhanced Mission Record and Review SystemETA Estimated Time of ArrivalFAA Federal Aviation AdministrationFAF Final Approach FixFARs Federal Aviation RegulationsFL Flight LevelFMS Flight Management SystemFPL Flight PlanFPM Feet Per minuteFSF Flight Safety FoundationFSI Flight Safety InternationalGA General AviationG/A Go AroundGPS Global Positioning SystemIAF Initial Approach FixICAO International Civil Aviation OrganizationIF Intermediate Fix

161
ILS Instrument Landing SystemIFR Instrument Flight RulesIMC Instrument Meteorological ConditionsISA Instantaneous Self-AssessmentKML Keyhole Markup Languagekts KnotsLAN Local Area NetworkLINE Line Number VariableLOSA Line Operations Safety AuditMDA Minimum Descent AltitudeMETARs Meteorological Aerodrome ReportMFD Multi-functional DisplayMOE Margin Of ErrorMSL Mean Sea-LevelMTS Movable Type ScriptNextGen Next Generation Air Transportation SystemNMT Not More ThanNOAA National Oceanic and Atmospheric AdministrationNOTAMs Notices to AirmenPFD Primary Flight DisplayPIREPs Pilot ReportsPOM Pilots Operating ManualPTS Practical Test StandardsQRH Quick Reference HandbookRNAV Area NavigationRTLX Raw NASA Task Load Index ScoresSDHC Secure Digital High-CapacitySIGMETS Significant Meteorological InformationSRM Single Pilot Resource ManagementTAFs Terminal Area ForecastsTAS True AirspeedTDZ Touchdown ZoneTDZE Touchdown Zone ElevationTERPS Terminal Instrument Approach ProceduresTLX Task Load IndexUNK UnknownVBA Visual Basic for ApplicationsVFR Visual Flight RulesVLJs Very Light JetsVMC Visual Meteorological ConditionsVOR Very High Frequency Omni Directional Radio RangeVref Landing Reference SpeedWAV Waveform Audio File FormatWPT WaypointWQXGA Wide Quad Extended Graphics Array

162
Appendix A
Demographic Data Questionnaire
Background Data
1. Age: Click here to enter age.
2. Gender (Please check one): Male Female
3. (This question is being asked to make sure you will be able to fly in the simulator withoutproblems.) When you fly, do you wear bi/tri focal glasses that have lined lenses (i.e. notprogressive lenses) or those with anti-glare coating or transition lenses (automaticallylighten or darken in different lighting conditions)?
Yes No
a. If so, do you have the option of wearing glasses with lenses other than those listedabove or contact lenses? Please check one.
Yes No
4. What is the aircraft configuration code/serial number of your Citation Mustang? Pleasecheck one:
AF – Airplanes 510-00041 and onAG – Airplanes 510-001 thru -0040AH – 510-0001 thru -0065 incorporating SB510-34-02AI – Airplanes 510-0001 thru -0065 not incorporating SB510-34-02
5. What optional equipment do you have in your Citation Mustang? Check all that apply.Automatic direction finder (ADF)Chart viewTraffic advisory systemSynthetic vision systemXM Radio / Audio Input PanelIridium Handheld Satellite Phone Antenna and PortSeat customization (describe): Click here to enter text.
General Flying history1. Check the type(s) of flying you currently do (check all that apply):
Professional (e.g., airline transport pilot, corporate pilot)Instructional (i.e., flight instructor, mentor pilot)Personal BusinessRecreationalOther (Please specify): Click here to enter text.
2. Number of total flying hours: Click here to enter total flying hours.

163
3. Number of jet hours flown as a single pilot: Click here to enter single pilot jet hoursflown.
4. List all ratings and certificates held: Click here to enter ratings and certificates held.
5. What aircraft do you currently fly on a regular basis?Click here to enter aircraft.
6. How many hours have you flown in the last 3 months?Click here to enter hours.
7. How many hours have you flown in the past year?Click here to enter hours.
8. When was the last time you flew as a single pilot in a jet?Click here to enter date.
9. What geographical areas (parts of the country) do you generally fly in?Click here to enter areas.
Citation Mustang Flying History
1. When did you take delivery of your Citation Mustang jet?Click here to enter date.
2. When did you complete your initial training?Click here to enter date.
3. Have you completed any Citation Mustang recurrent training?
Yes No
a. If so, when? Click here to enter date.
4. How many hours, if any, have you flown your/a Citation Mustang with a mentor pilot?Click here to enter hours.
5. How many hours have you flown your/a Citation Mustang in the last 3 months?Click here to enter hours.
6. How many hours have you flown your/a Citation Mustang in the past year?Click here to enter hours.
7. How many hours have you flown your/a Citation Mustang in the past year as a singlepilot (without a mentor pilot on board)?

164
Click here to enter hours.
Personal experience with Advanced Avionics and Automation
1. Please rate your overall experience using different types of advanced avionics/glasscockpits. (1=little experience to 5=very experienced) Please select only one.
1 2 3 4 5
2. Please rate your experience using the G1000 in the Citation Mustang or any otheraircraft. (1=little experience to 5=very experienced) Please select only one.
1 2 3 4 5
3. Please rate your skill level using the G1000 in the Citation Mustang or any other aircraft.(1=little experience to 5=very experienced) Please select only one.
1 2 3 4 5
4. Please rate your experience using the G430/G530 or other similar Garmin IFR avionicssystems. (1=little experience to 5=very experienced; if not applicable, please jump toquestion 5) Please select only one.
1 2 3 4 5
Please list each type of Garmin IFR avionics system currently or previously used,in addition to the G1000: Click here to enter type.
a. Please rate your skill level in using these other Garmin IFR avionics (notincluding the G1000). (1=not very skilled to 5=very skilled) Please select onlyone.
1 2 3 4 5
5. Please rate your experience using other types of advanced avionics (e.g. Avidyne,Chelton, etc.). (1=not very experienced to 5=very experienced; if not applicable, pleasejump to question 6) Please select only one.
1 2 3 4 5
a. Please list each type of other advanced avionics system currently or previouslyused (not including any of the Garmin products).Click here to enter avionics systems.

165
b. Please rate your skill level in using these other advanced avionics systems (notincluding any of the Garmin products). (1=not very skilled to 5=very skilled)Please select only one.
1 2 3 4 5
6. Rate your experience with using Flight Management Systems (FMS). (1=not veryexperienced to 5=very experienced; If not applicable, please jump to question 7) Pleaseselect only one.
1 2 3 4 5
a. Please rate your skill level in using FMSs. (1=not very skilled to 5=very skilled)Please select only one.
1 2 3 4 5
7. Rate your experience with stand alone autopilot/auto flight systems. (1= not veryexperienced to 5=very experienced; If not applicable, please place in return envelope &mail back to NASA). Please select only one.
1 2 3 4 5
a. Please rate your skill level in using autopilot/auto flight systems (1=not veryskilled to 5=very skilled) Please select only one.
1 2 3 4 5

166
Appendix B
Advanced Avionics and Automation Questionnaire
Please answer these questions with regard to any and all types of advanced automation anddisplays with which you have experience – not just the automation and displays in your CitationMustang.
1. Overall, how satisfied are you with advanced avionics (glass cockpits, i.e., PFDs andMFDs) (1=very unsatisfied to 5 = very satisfied)? Please select only one.
1 2 3 4 5
2. How would you rate the design of PFDs (1=poor to 5=excellent)? Please select only one.
1 2 3 4 5
3. What do you like best about PFDs?Click here to enter text.
4. What do you like least about PFDs?Click here to enter text.
5. If you could change anything with the design or functioning of PFDs, what would youchange and how would you change it?Click here to enter text.
6. How would you rate the design of MFD (1=poor to 5=excellent)? Please select only one.
1 2 3 4 5
7. What do you like best about the MFD?Click here to enter text.
8. What do you like least about the MFD?Click here to enter text.
9. If you could change anything with the design or functioning of MFDs, what would youchange and how would you change it?Click here to enter text.
10. What resources available through MFDs do you use the most?Click here to enter text.

167
11. What resources available through MFDs do you use the least?Click here to enter text.
12. Describe a situation, if any, where advanced avionics or automation kept you out oftrouble or was a significant help in dealing with the situation or a problem and how theavionics or automation helped.Click here to enter text.
13. Describe a situation, if any, where advanced avionics or automation caused you problemsor inhibited your ability to deal with the situation or a problem and how the avionics orautomation caused problems.Click here to enter text.
14. What is/are the easiest things about learning to use advanced avionics and automation?Click here to enter text.
15. What is/are the biggest hurdle(s) in learning to use advanced avionics and automation?Click here to enter text.
16. How challenging is it for the typical pilot to remain proficient in the use of advancedavionics and automation, and if so, why?Click here to enter text.
17. What strategies do you use or recommend to maintain proficiency in the use of advancedavionics and automation?Click here to enter text.

168
Appendix C
Citation Mustang And G1000 Cockpit Set-Up Preference Questionnaire
TIME/DATE
TIME FORMAT: LOCAL 12hr LOCAL 24hr
DISPLAY UNITS AND MAP DATUM
NAV ANGLE: MAGNETIC(o) TRUE (oT)
DIS, SPD: NAUTICAL (NM, KT) METRIC (KM, KPH)
ALT, VS: FEET (FT, FPM) METERS (MT, MPM)
PRESSURE: INCHES (IN) HECTOPASCALS(HPA)
TEMP: CELSIUS (oC) FARENHEIT (oF)
FUEL: GALLONS (GL,GL/HR)
LITERS (LT, LT/HR)
POSITION: HDDDoMM’SS.S” HDDDoMM.MM’
AIRSPACE ALERTS
ALTITUDEBUFFER:
Factory Default(200ft)
Preferred buffer: Click here to enter buffer.
CLASS B/TMA: Factory Default ON OFF
CLASS C/TCA: Factory Default ON OFF
CLASS D: Factory Default ON OFF
RESTRICTED: Factory Default ON OFF
MOA(MILITARY):
Factory Default ON OFF

169
OTHERAIRSPACE:
Factory Default ON OFF
ARRIVAL AND AUDIO ALERTS
ARRIVALALERT:
Factory Default ON OFF
ARRIVAL ALERTDISTANCE:
Factory Default(at destination)
Preferred Distance: Click here to preferred distance.
VOICE: MALE FEMALE
NAVIGATION STATUS BAR (MFD)
FIELD 1: DTK ESA ETA ETE GS MSA TKE TRK VSR XTK
FIELD 2: DTK ESA ETA ETE GS MSA TKE TRK VSR XTK
FIELD 3: DTK ESA ETA ETE GS MSA TKE TRK VSR XTK
FIELD 4: DTK ESA ETA ETE GS MSA TKE TRK VSR XTK
CDI, COM CONFIGURATION
GPS CDI: AUTO MANUAL
SYSTEM CDI(if MANUAL):
1.0nm 3.0nm 5.0nm
ILS CDICAPTURE:
AUTO MANUAL
NEAREST AIRPORT
RNWY SURFACE: ANY HARD ONLY HARD/SOFT
RNWY MINLENGTH:
Factory Default(0 ft)
Preferred Length (0 ft to 25,000 ft): Click here to enterpreferred length.

170
FLIGHT INSTRUMENTS
PFD 1 WINDINDICATOR:
Factory Default HEAD/X-WIND
ARROW/SPEED
ARROW/SPD/DIR
OFF
PFD 2 WINDINDICATOR:
Factory Default HEAD/X-WIND
ARROW/SPEED
ARROW/SPD/DIR
OFF
BEARING 1POINTER:
Factory Default NAV 1 GPS ADF OFF
BEARING 2POINTER:
Factory Default NAV 1 GPS ADF OFF
MAP SETUP
PFD INSET: Factory Default ON OFF
ORIENTATION: Factory Default NORTH up Track up DTK up HDG up
AUTO ZOOM: Factory Default OFF MFD Only PFD Only All On
Please fill out MFD ORIENTATION if you selected “PFD only” for previous AUTO Zoom setting.
MFDORIENTATION: Factory Default
NORTHup Track up DTK up HDG up
MAX LOOKFWD:
Factory Default Preferred Number (0 to 99 minutes): Click here to enterpreferred number.
MIN LOOK FWD: Factory Default Preferred Number (0 to 99 minutes): Click here to enterpreferred number.
TIME OUT: Factory Default Preferred Time: Click here to enter preferred time.
LAND DATA: Factory Default ON OFF
TRACK VECTOR: Factory Default(60sec) 30 sec 2 min 5 min 10 min 20 min
WIND VECTOR: Factory Default ON OFF
NAV RANGERING:
Factory Default ON OFF

171
TOPO DATA: Factory Default ON OFF
If you selected “ON” for “TOPO DATA” please indicateyour preferred MAX TOPODATA RANGE (500ft -2000nm): Click here to enter range.
TOPO SCALE: Factory Default ON OFF
TERRAIN DATA: Factory Default ON OFF
If you selected “ON” for “TERRAIN DATA” please indicate your preferred TERRAINDATA MAX RANGE: Click here to enter range.
OBSTACLEDATA:
Factory Default ON OFF
If you selected “ON” for “OBSTACLE DATA” please indicated your preferredOBSTACLE DATA MAX range: Click here to enter range.
FUEL RING(RSV):
Factory Default(00:45 minutes)
ON OFF
If you selected “ON” for “FUEL RING (RSV)” please indicate your preferred FUELRING RANGE: Click here to enter range.
FIELD OF VIEW Factory Default ON OFF
PFD INSET: Factory Default ON OFF
PFD INSETDCLTR:
Factory Default NO DCLTR DCTLR (-1) DCTLR (-2) DCLTR (-3)
PFD INSETFUNCTIONS:
FactoryDefault TRAFFIC TOPO TERRAIN
STRMSCP NEXRAD
XMLTNG
MAP SETUP (OTHER)
MFD FLIGHT PLANVIEW:
Factory Default Narrow Wide CUM Leg-Leg
TRAFFICSYSTEM:
Factory Default TIS

172
CHART FULLSCREEN:
Factory Default Large Small
SYMBOL SETUP (LAND)
LAT/LON TEXT: Factory Default None Small Medium Large
LAT/LONGRANGE:
Factory Default(OFF)
Max Display Range (up to 2000nm): Click here to enter maxdisplay range.
FREEWAYRANGE:
Factory Default(300nm)
Max Display Range (up to 800nm): Click here to enter maxdisplay range.
NATIONAL HWYRANGE:
Factory Default(30nm)
Max Display Range (up to 80nm): Click here to enter maxdisplay range.
LOCAL HWYRANGE:
Factory Default(15nm)
Max Display Range (up to 30nm): Click here to enter maxdisplay range.
LOCAL ROADRANGE:
Factory Default(8nm)
Max Display Range (up to 15nm): Click here to enter maxdisplay range.
RAILROADRANGE:
Factory Default(15nm)
Max Display Range (up to 30nm): Click here to enter maxdisplay range.
LARGE CITYTEXT:
Factory Default None Small Medium Large
LARGE CITYRANGE:
Factory Default(800nm)
Max Display Range (up to 1500nm): Click here to enter maxdisplay range.
MEDIUM CITYTEXT:
Factory Default None Small Medium Large
MEDIUM CITYRANGE:
Factory Default(100nm)
Max Display Range (up to 200nm): Click here to enter maxdisplay range.
SMALL CITYTEXT:
Factory Default None Small Medium Large
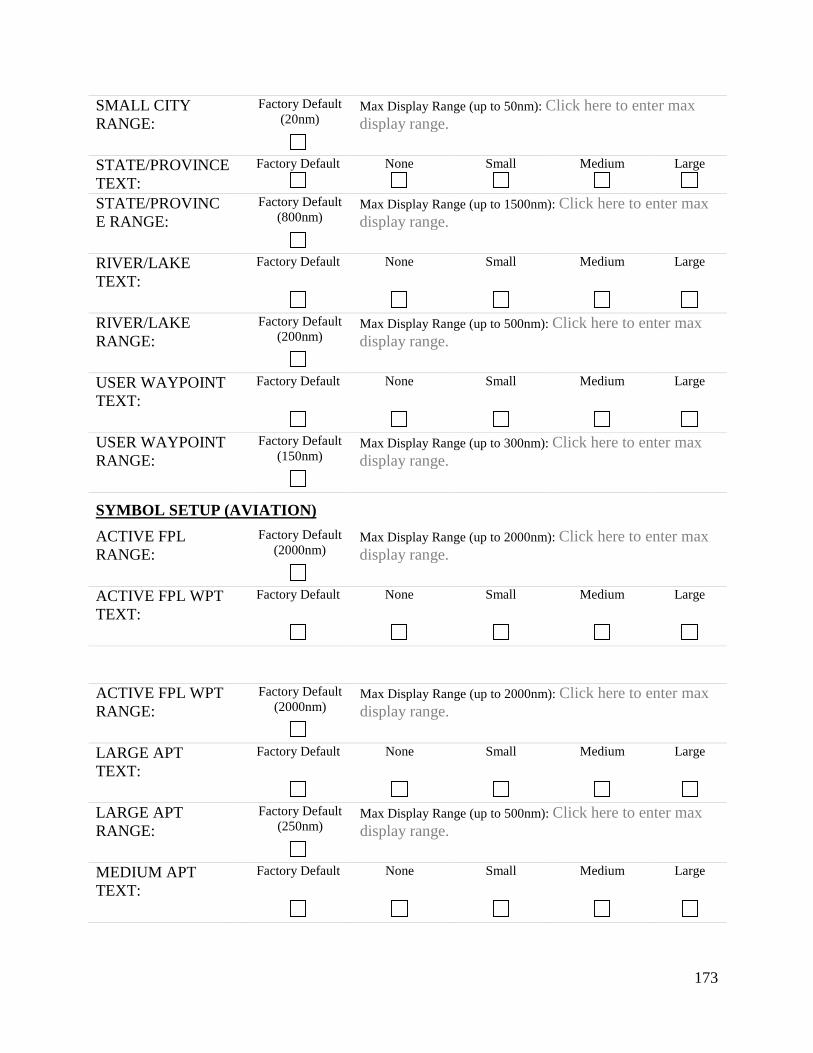
173
SMALL CITYRANGE:
Factory Default(20nm)
Max Display Range (up to 50nm): Click here to enter maxdisplay range.
STATE/PROVINCETEXT:
Factory Default None Small Medium Large
STATE/PROVINCE RANGE:
Factory Default(800nm)
Max Display Range (up to 1500nm): Click here to enter maxdisplay range.
RIVER/LAKETEXT:
Factory Default None Small Medium Large
RIVER/LAKERANGE:
Factory Default(200nm)
Max Display Range (up to 500nm): Click here to enter maxdisplay range.
USER WAYPOINTTEXT:
Factory Default None Small Medium Large
USER WAYPOINTRANGE:
Factory Default(150nm)
Max Display Range (up to 300nm): Click here to enter maxdisplay range.
SYMBOL SETUP (AVIATION)
ACTIVE FPLRANGE:
Factory Default(2000nm)
Max Display Range (up to 2000nm): Click here to enter maxdisplay range.
ACTIVE FPL WPTTEXT:
Factory Default None Small Medium Large
ACTIVE FPL WPTRANGE:
Factory Default(2000nm)
Max Display Range (up to 2000nm): Click here to enter maxdisplay range.
LARGE APTTEXT:
Factory Default None Small Medium Large
LARGE APTRANGE:
Factory Default(250nm)
Max Display Range (up to 500nm): Click here to enter maxdisplay range.
MEDIUM APTTEXT:
Factory Default None Small Medium Large

174
MEDIUM APTRANGE:
Factory Default(150nm)
Max Display Range (up to 300nm): Click here to enter maxdisplay range.
SMALL APTTEXT:
Factory Default None Small Medium Large
SMALL APTRANGE:
Factory Default(50nm)
Max Display Range (up to 100nm): Click here to enter maxdisplay range.
SAFE TAXIRANGE:
Factory Default(3nm)
Max Display Range (up to 20nm): Click here to enter maxdisplay range.
INTERSECTIONWPT TEXT:
Factory Default None Small Medium Large
INTERSECTIONWPT RANGE:
Factory Default(15nm)
Max Display Range (up to 30nm): Click here to enter maxdisplay range.
NDB WAYPOINTTEXT:
Factory Default None Small Medium Large
NDB WAYPOINTRANGE:
Factory Default(15nm)
Max Display Range (up to 30nm): Click here to enter maxdisplay range.
VOR WAYPOINTTEXT:
Factory Default None Small Medium Large
VOR WAYPOINTRANGE:
Factory Default(150nm)
Max Display Range (up to 300nm): Click here to enter maxdisplay range.
CLASS B/TMARANGE:
Factory Default(200nm)
Max Display Range (up to 500nm): Click here to enter maxdisplay range.
CLASS C/TMARANGE:
Factory Default(200nm)
Max Display Range (up to 500nm): Click here to enter maxdisplay range.
CLASS D RANGE: Factory Default(150nm)
Max Display Range (up to 300nm): Click here to enter maxdisplay range.
RESTRICTEDAIRSPACERANGE:
Factory Default(200nm)
Max Display Range (up to 500nm): Click here to enter maxdisplay range.

175
MOA(MILITARY)RANGE:
Factory Default(200nm)
Max Display Range (up to 500nm): Click here to enter maxdisplay range.
OTHER/ADIZRANGE:
Factory Default(200nm)
Max Display Range (up to 500nm): Click here to enter maxdisplay range.
TFR RANGE: Factory Default(500nm)
Max Display Range (up to 2000nm): Click here to enter maxdisplay range.

176
Appendix D
Pilot Briefing Package
Flight Package for Leg 1 KTEB-KMTN
Introduction to flight
Flight: This is a two leg flight taken for personal business from Teterboro,NJ (KTEB) to Martin State Airport (KMTN) in Baltimore, MD to pick up apackage and then on to Hot Springs/Ingalls Field, VA (KHSP) for leg two. Youare the only person on board, there are no passengers.
Today’s Date is: Tuesday, September 18, 2010
Propose Time of Departure from KTEB: 9:00 a.m. (local) (1300Z)
Aircraft location at KTEB: Parked on ramp close to runway for the sake ofcommunications (red spot). However, position of the simulator will be onrunway 24 at the intersection of runway 19 (green spot). See the airportdiagram on the next page depicting your location starting point.
Planned aircraft parking at KMTN: Transient parking

177
Location on the Ramp at KTEB
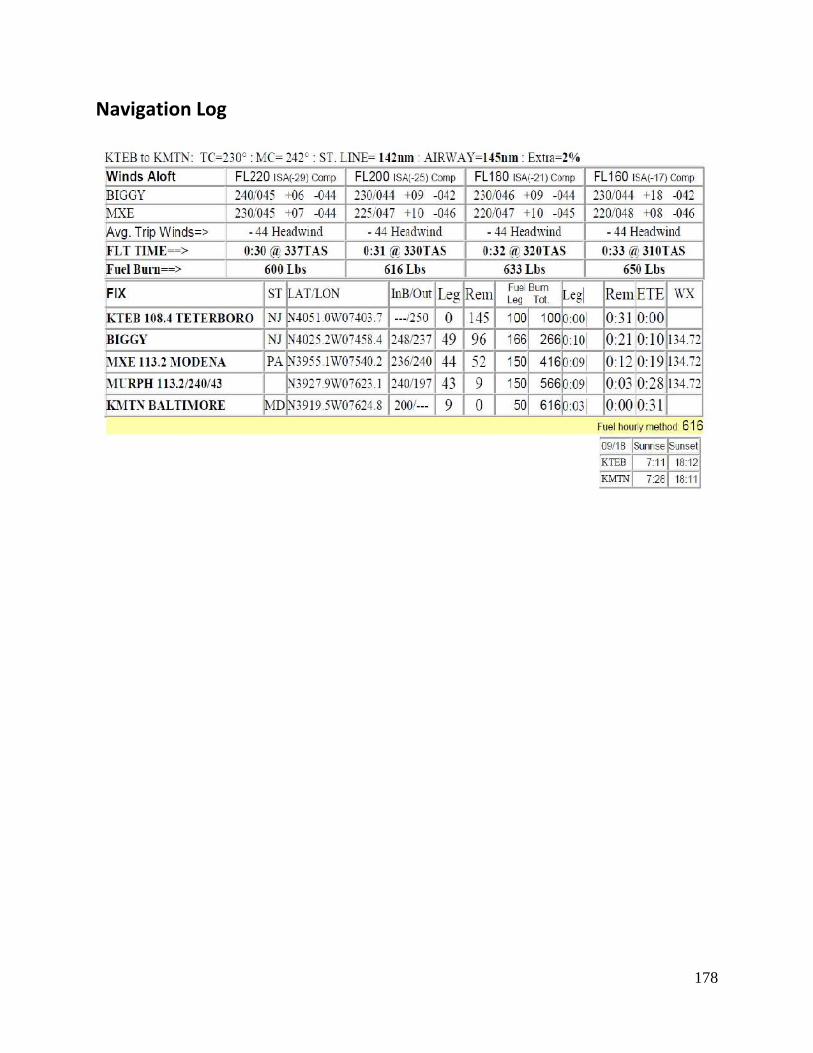
178
Navigation Log

179
Weight and Balance

180
Boston Area Forecast (FA)Forecast updated: 1200 UTC
BOSC FA 181200SYNOPSIS AND VFR CLDS/WXSYNOPSIS VALID UNTIL 191200CLDS/WX VALID UNTIL 191200...OTLK VALID 181200-191200ME NH VT MA RI CT NY LO NJ PA OH LE WV MD DCDE VA AND CSTL WTRS
SEE AIRMET SIERRA FOR IFR CONDS AND MTNOBSCN.TS IMPLY SEV OR GTR TURB SEV ICE LLWS AND IFRCONDS.NON MSL HGTS DENOTED BY AGL OR CIG.
SYNOPSIS...BROAD UPR TROF CONTS FM THEMID/LWR MS VLY INTO THEGLFMEX. TROF WL SHFT SLOLY EWD. STNR FNTCONTS FM THE MD/VA CSTLWTRS-VA/NC BORDER-ERN TN-SRN MS. BY 12Z WKLOW WL BR OVR SWRN NCWITH STNR FNT ENEWD TO MD/VA CSTL WTRS. WKCDFNT WL EXTD FM THELOW SWWD TO SRN AL. DEEP MOIST AIRMASSEXTDS FM THE MID ATLC RGNTO THE SERN US. MSTR WL SPRD SLOLY NWD INTOPA/NJ-EXTRM SE NY AFT 06Z.
ME NH VTSCT060 SCT CI. 00Z SCT CI. OTLK...VFR.MA RI CTSERN MA...BKN010-020. TOPS 040. BKN CI.OTLK...MVFR CIG.CT/RI...SCT050 BKN CI. 05Z SCT050 BKN120. TOPSFL180. OYLK...VFR.RMNDR MA...SCT CI. 04Z BKN CI. OTLK...VFR.
NY LONERN NY...SCT050 SCT CI. 00Z SCT CI. OTLK...VFR.LONG ISLAND/EXTRM SERN NY...SCT010 BKN020.TOPS FL200. 05Z SCT030BKN120. OTLK...VFR.RMNDR SERN NY...BKN CI. OTLK...VFR.WRN NY/LO...SCT CI. OTLK...VFR.
PA NJSERN PA/SRN NJ...SCT010-020 OVC030. TOPS FL200.WDLY SCT -SHRA.BECMG 1218 BKN010-020 OVC030. OCNL VIS 3-5SM-RA BR. OTLK...IFRCIG RA BR.NERN PA/NRN NJ...SCT010 BKN CI. BECMG 0306BKN010. TOPS FL200.OTLK...VFR BECMG MVFR CIG SHRA AFT 11Z.SWRN PA...BKN040-050. TOPS 080. BKN CI. BECMG0306 BKN030 OVC100.TOPS FL220. OCNL VIS 3-5SM -SHRA BR. OTLK...IFRCIG SHRA BR.NWRN PA...SCT050-060 BKN CI. 05Z SCT-BKN040-050. TOPS 080. BKNCI. OTLK...MVFR CIG.
OH LESERN OH...BKN020-030 OVC100. TOPS FL200. OCNLVIS 3-5SM -SHRA BR.OTLK...MVFR CIG SHRA BR.SWRN OH...SCT120 OVC CI. OTLK...VFR.NRN OH/LE...BKN CI. OTLK...VFR.
WVBKN-OVC030-040 LYRD TO FL220. OCNL VIS 3-5SM -RA BR. TIL 02Z ISOL-TSRA EXTRM S. CB TOPS FL400. OTLK...IFR CIG SHRABR.
MD DC DE VAWRN MD/NWRN VA...OVC020-030 LYRD TO FL250.OCNL VIS 3-5SM -RA BR.OTLK...IFR CIG RA BR.SWRN VA...BKN010-020 OVC030. TOPS 250. SCT -SHRA/-TSRA. CB TOPSFL420. BECMG 0003 OVC030-040 LYRD TO FL250.OCNL VIS 3-5SM -SHRABR. OTLK...IFR CIG SHRA BR.FAR S CNTRL/SERN VA...BKN020 BKN100. TOPS 150.SCT -SHRA/-TSRA.CB TOPS FL420. BECMG 1218 BKN010-020 OVC100.TOPS FL240. OCNL VIS3-5SM -SHRA BR. OTLK...IFR CIG SHRA BR.RMNDR ERN VA/ERN MD/DC/DE...BKN-OVC010-020LYRD TO FL250. OCNLVIS 3-5SM -RA BR. OTLK...IFR CIG RA BR.

181
CSTL WTRSS OF CYN...BKN010-020 BKN-OVC100. TOPS FL200.SCT -SHRA.OTLK...IFR CIG SHRA BR.BTN CYN AND ACK...BKN015-025 OVC100. TOPSFL200. WDLY SCT -SHRA.OTLK...MVFR CIG SHRA BR.N OF ACK...SCT-BKN010-020. TOPS 040. OTLK...IFRCIG OFSHR..VFRNEARSHR.
AIRMET MTN OBSCN...PA WV MD VAFROM HAR TO 40SSE PSK TO HMV TO 40S HNN TO40SE AIR TO HARMTNS OBSC BY CLDS/PCPN/BR. CONDS CONTG BYD21Z.
AIRMET TURB...VT NY LO PA OH LE WVFROM YSC TO 20SSW ALB TO 30SSW PSB TO HNN TOCVG TO FWA TO DXOTO MSS TO YSCMOD TURB BLW FL180. CONDS CONTG BYD 21ZTHRU 03Z.
FRZLVL...RANGING FROM 120-140 ACRS AREA120 ALG 40S FWA-20ENE ERI-MSS-40NE MSS140 ALG 30S HNN-30W SAX-20SSE MLT-30ENE HUL

182
Current Conditions: Satellite

183
Current Conditions: METAR

184
KTEB Terminal Weather
METAR KTEB 181253Z 22009G15KT 2SM -RA BKN005 OVC008 20/17 A29.85
Teterboro 1253 Zulu automated weather, wind is 220° at 9 gusting to 15,visibility 2 miles in light rain, 500 broken, 800 overcast, temperature 20, dewpoint 17, altimeter 29.85.
KTEB 181200Z 1812/1912 23009KT 2SM -RA BKN005 OVC008FM181500 23012KT 5SM -RA SCT010 OVC020FM190100 24010KT 5SM BKN010 OVC020FM190800 26015KT P6SM BKN010 OVC020
Teterboro NJ [KTEB] terminal forecast issued at 8:00am EDT (1200Z), valid for 24 hours
8:00am EDT (12Z) wind 230 at 9 knots, visibility 2 miles, light rain, 500 feet broken, 800 feetovercast
11:00am EDT (1500Z) wind 230 at 12 knots, visibility 5 miles, light rain, 1000 feet scattered,2000 feet overcast
9:00pm EDT (0100Z) wind 240 at 10 knots, visibility 5 miles, 1000 feet broken, 2000 feetovercast
4:00am EDT (0800Z) wind 260 at 15 knots, visibility 6 miles, 1000 feet broken, 2000 feetovercast

185
KTEB NOTAMS
TEB 11/031 TEB AD ALL IN PAVEMENT LGTS AND ELEVATED GUARD LGTS OTS
TEB 04/069 TEB RWY 1 REIL CMSND
TEB 07/065 TEB RWY 1 PAEW 1300 S AER 1030-2100 MON-FRI WEF 1007191030
TEB 02/065 TEB OBST BRIDGE UNKN (624 AGL) 5 E (4051N7357W) LGT OTS WEF 0902231208
TEB 11/006 TEB OBST CRANE 237 (230 AGL) 1 S AER 6 FLAGGED/LGTD
TEB 11/032 TEB OBST CRANE 65 (60 AGL) .6 SSW AER 1 LGTD/FLAGGED 1200-2100 DLY TIL1011122100
TEB 11/030 TEB NAV RWY 19 ILS LLZ OTS WEF 1011101139
UAR 04/009 TEB AIRSPACE JAIKE TWO ARRIVAL... EXPECT TO CROSS JAIKE WAYPOINT AT 13,000FEET.
USD 07/209 TEB AIRSPACE TETERBORO SIX DEPARTURE CHANGE RWY 24 DEPARTURE ROUTEDESCRIPTION TO READ: TAKE-OFF RWY 24: CLIMB HEADING 240 TO 1500, THEN RIGHT TURNVIA HEADING 280, CROSS TEB 4.5 DME AT 1500 (NON-DME AIRCRAFT CROSS COL R-011 AT1500), CLIMB AND MAINTAIN 2000, THENCE...
TEB 05/146 TEB TWY K NONMOVEMENT AREA BOUNDRY NONSTD MARKING
TEB 11/020 TEB TWY B EDGE LINES W RWY 1/19 NONSTD
TEB 08/037 TEB RAMP ATLANTIC AVIATION RAMP FENCING 56 FT LONG BY 160 FT WIDE ADJHANGER 3 LGTED

186
Weather En route METARs
KCDW 181253Z 23010G14 3SM -RA BKN006 OVC009 20/16 A2984
KSMQ 181253Z 22010KT 4SM SCT020 BKN030 21/16 A2985 RMK AO2
KDYL 181253Z 210KT 4SM RA SCT010 BKN030 OVC040 20/15 A2985 RMK AO2
KTTN 181253Z 20009KT 2SM BR BKN007 OVC015 18/16 A2988
KPTW 181253Z 00000KT 1SM OVC008 15/14 A2984 RMK AO2
KPHL 181253Z 17010KT 4SM BR BKN009 OVC020 20/15 A2990
KMQS 181253Z 16015KT 5SM FEW035 OVC040 15/09 A2990 RMK AO2
KILG 181253Z 14009KT 2SM BR BKN005 OVC015 18/16 A2985
KAPG 181253Z 14009KT 2SM BR BKN005 OVC015 18/16 A2985
KBWI 181253Z 13013KT 3SM BR SCT008 OVC010 18/16 A2989
KDCA 181253Z 14008KT 4SM BR SCT009 OVC011 17/13 A2989

187
Weather En route TAFs
KTTN 181200Z 1812/1912 17009KT 2SM BR BKN005 OVC015FM181500 18010KT 4SM -RA SCT008 OVC020FM190100 17010KT 5SM BKN010 OVC020FM190800 16010KT P6SM BKN010 OVC020
KRDG 181200Z 1812/1912 17009KT 3SM BR BKN006 OVC008FM181500 18010KT 4SM -RA SCT008 OVC010FM190100 16010KT 4SM BKN080 OVC010FM190800 16010KT 5SM BKN080 OVC010
KILG 181200Z 1812/1912 17012KT 3SM BR BKN006 OVC008FM181500 18010KT 4SM -RA SCT008 OVC010FM190100 17010KT 4SM BKN080 OVC015FM190800 16010KT 5SM BKN080 OVC015
KBWI 181200Z 1812/1912 22012KT 5SM BR BKN020 OVC060FM181500 18010KT 5SM SCT020 OVC070FM190100 21010KT 5SM SCT050 OVC090FM190800 21010KT P6SM SCT080 BKN100
KDCA 181200Z 1812/1912 22012KT 5SM BR BKN020 OVC060FM181500 17015KT 5SM SCT020 OVC070FM190100 22010KT P6SM SCT040 OVC080FM190800 22005KT P6SM SCT080 BKN100

188
Notices to Airmen: FAA Plotweb Airway
NEW YORK ARTCC
FDC 8/5594 ZNY FI/T AIRWAY ZNY ZOB. J190 SLATE RUN (SLT) VORTAC, PA TO BINGHAMTON(CFB) VORTAC, NY MAA FL380 EXCEPT FOR AIRCRAFT EQUIPPED WITH SUITABLE RNAV SYSTEMWITH GPS.
FDC 8/4929 ZNY FI/T AIRWAY ZBW ZNY. V408 LAKE HENRY (LHY) VORTAC, PA TO SAGES INT, NYMAA 15000 EXCEPT FOR AIRCRAFT EQUIPPED WITH SUITABLE RNAV SYSTEM WITH GPS.
FDC 8/2384 ZNY NY.. FI/T AIRWAY ZNY. J95 GAYEL INT, NY TO BUFFY INT, PA NA.
FDC 8/1389 ZNY FI/T AIRWAY ZDC ZNY. J42- 191 DAVYS INT, NJ TO ROBBINSVILLE (RBV)VORTAC, NY MAA 29000 EXCEPT FOR AIRCRAFT EQUIPPED WITH SUITABLE RNAV SYSTEM WITHGPS.
FDC 6/8776 ZNY CT.. FI/T AIRWAY ZBW ZNY. J42 DME REQUIRED AT SANTT INT.
FDC 6/1470 ZNY NY.. FI/T AIRWAY ZNY. V433 TICKL INT, NY TO LA GUARDIA (LGA) VOR/DME, NYLGA R-225 UNUSEABLE. LA GUARDIA (LGA) VOR/DME, NY TO DUNBO INT, NY LGA R-06UNUSEABLE.
FDC 6/1269 ZNY FI/T AIRWAY ZNY. V36 HAWLY INT, PA TO NEION INT, NJ LGA R-322UNUSEABLE.
FDC 6/1267 ZNY FI/T AIRWAY ZNY. J106 STILLWATER (STW) VOR/DME, NJ TO LA GUARDIA (LGA)VOR/DME, NY LGA R-298 UNUSEABLE.
FDC 6/1266 ZNY FI/T AIRWAY ZNY. J70 STILLWATER (STW) VOR/DME, NJ TO LA GUARDIA (LGA)VOR/DME, NY LGA R-298 UNUSEABLE. LA GUARDIA (LGA) VOR/DME, NY TO KENNEDY (JFK)VOR/DME, NY LGA R-166 UNUSEABLE.
FDC 6/1247 ZNY NY.. FI/T AIRWAY ZNY. V451 LA GUARDIA (LGA) VOR/DME, NY TO NESSI INT,NY LGA R-075 UNUSEABLE.
FDC 6/1245 ZNY NY.. FI/T AIRWAY ZBW ZNY. V6- 445 NANCI INT, NY TO LA GUARDIA (LGA)VOR/DME, NY LGA R225 UNUSEABLE.
FDC 6/1243 ZNY NY.. FI/T AIRWAY ZNY. V475- 487 LA GUARDIA (LGA) VOR/DME, NY TO DUNBOINT, NY LGA R-068 UNUSEABLE.

189
FDC 6/1238 ZNY NY.. FI/T AIRWAY ZNY. V123 RENUE INT, NY TO LA GUARDIA (LGA) VOR/DME,NY LGA R-225 UNUSEABLE. LA GUARDIA (LGA) VOR/DME, NY TO RYMES INT, NY LGA R-044UNUSEABLE.
FDC 6/1237 ZNY NY.. FI/T AIRWAY ZNY. V157 RENUE INT, NY TO LA GUARDIA (LGA) VOR/DME,NY LGA R-225 UNUSEABLE. LA GUARDIA (LGA) VOR/DME, NY TO HAARP INT, NY LGA R-044UNUSEABLE.
FDC 4/9357 ZNY NY.. FI/T AIRWAY ZNY ZBW. V139-268-308 DUNEE INT, NY TO SARDI INT, NYDEER PARK (DPK) VOR/DME MRA 5000 AT KOPPY INT, NY.
FDC 4/9343 ZNY NY.. FI/T AIRWAY ZNY V374 VOLLU INT, NY TO GAYEL INT, NY MEA 5000.
FDC 4/9182 ZNY NJ FI/T AIRWAY ZNY V312 LEGGS INT, NJ TO PREPI INT, OA FOR NON-DMEEQUIPPED AIRCRAFT MEA 3000.
FDC 4/6630 ZNY PA.. FI/T AIRWAY ZNY. V36 DOMVY INT, PA TO HAWLY INT, PA NA.
FDC 4/3616 ZNY FI/T AIRWAY ZNY ZDC V210 PROPP INT, PA TO YARDLEY (ARD) VOR/DME, PAMOCA 1700.

190
Appendix E
Post-Study Interview Questions
Advanced Automation and Single-Pilot Operationsin Very Light/Entry Level Jets
Post-Study Interview and Debriefing
Overall Feedback:
1. How does the amount and kind of planning/preparation you did for the familiarization flightcompare with the amount and kind of planning/preparation you did for the study flights?(more/less/the same – if more or less, ask why)
2. How does the amount and kind of planning/preparation you did for the two study flightscompare with what you normally do when you are going to make an IFR flight? (if differentfrom what they normally do, ask how different and why)
3. Have you ever flown in the Oklahoma area and/or landed at Clinton-Sherman or OKCbefore?
a. If so, how did this scenario flight compare with the flight(s) you took? (weather,traffic, operational environment and tasks, etc?)
4. Have you ever flown in the New York or Washington, DC areas and/or landed at TEB or MTNbefore?
a. If so, which airports/airspace and how did this scenario compare with theflight(s) you took? (weather, traffic, operational environment and tasks, etc?)
5. Do you have much experience flying in mountainous terrain/landing at mountain airports?Have you ever landed at Hot Springs/Ingalls Airport (HSP) before?
a. If yes (to either question), how did that portion of the study scenario comparewith your previous experiences? (weather, traffic, operational environment andtasks, etc?)

191
6. Overall, how do you feel about your flights today, both the Oklahoma flight and the studyflights on the east cost? (looking for an assessment of their own performance)
a. Oklahoma (familiarization) flight:
b. East coast (study) flights (both legs):
7. In the study scenario, you flew two legs, the first from TEB to MTN and the second fromMTN to HSP. How would you compare the two legs in terms of workload?
a. How about in terms of difficulty of flight or operational tasks?
8. In the first leg from TEB to MTN, were there any tasks that you found to be particularlychallenging, and if so, why?
a. How about in the second leg from MTN to HSP?
9. In the first leg (TEB to MTN), were there any tasks that you found to be particularly easy,and if so, why?
a. How about the second leg (MTN to HSP)?
Workload:10. In this study we were particularly interested in how single pilots manage workload in jets
during flights. Overall, how do you think that went?
11. How would you describe your approaches to workload management during the two flights(get information about each flight and study scenario leg separately, and/or compare orcontrast the approaches within the flights and legs, were any differences intentional/planned, etc.)?
a. How does this compare with the way that you typically approach workloadmanagement when flying IFR? (make sure you get information about how theytypically approach workload management during regular IFR flights)
12. Was there anything about the tasks you had to complete in the familiarization scenario thatchanged your approach to workload management in the study scenario? (If yes, what werethe tasks and how did they influence your workload management strategy?)

192
a. Was there anything about the tasks you had to complete in the first leg (TEB toMTN) that changed your approach to workload management in the second leg(MTN to HSP)? (If yes, what were the tasks and how did they influence yourworkload management strategy?)
13. (with regard to responses to Question 12) What techniques or strategies worked best?
14. (with regard to responses to Question 12) What techniques or strategies didn’t work out aswell as hoped?
15. Were there times you felt behind or task saturated?
a. If so, when,
b. why do think that was, and
c. what did you do to deal with it?
Automation:16. As you know, we are also very interested in how automation and advanced technology is a
help or hindrance. To what degree (and how) would you say that automation andadvanced technology helped you with the tasks you faced while flying the two legs of thestudy scenario?
17. Were there specific features or resources within the G1000 or the Mustang that wereparticularly helpful? If so, what were they and how were they helpful?
18. To what degree (and how) did automation and advanced technology cause you problems orhinder you with the tasks you faced while flying the study scenario legs?
19. Were there specific features or resources within the G1000 or the Mustang that wereparticularly problematic? If so, what were they and how were they problematic?

193
20. To what degree would you say you are familiar with the full range of resources availablethrough the G1000 and the multiple ways to use the G1000 to accomplish the same tasks?
21. To what degree would you say you use the full range of resources available through theG1000?
a. Which features do you use the most?
b. Which features do you use the least?
c. Are there any particular features of the G1000 that you find particularly easy touse? If so, what are they and why do you feel they are easy?
d. Are there any particular features of the G1000 that you find particularly difficultto use? If so, what are they and why do you feel they are difficult?
e. If you were going to re-design the G1000 what would you change, add, or deletefrom it and why?
Closing:22. If you were to fly these flights again, would you do anything differently? If so, what would
you do differently and why?
23. Before coming here to participate in this study, did you do any sort of special preparation,study, or review that you wouldn’t normally have been doing already? If so, what did youdo?
24. Do you have any other comments, thoughts, or suggestions you would like to makeregarding single-pilot workload management, automation use, or this study in general?
Thank you very much for participating in this study and providing us this very importantinformation. Your involvement and feedback will benefit the industry greatly. Thanks!

194
Appendix F
Observed “Best Practices” and Other Things to Consider
Best Practices
Non-event specific observations:
Speed control:o The Cessna Citation Mustang, like any other turbine aircraft, has the potential to
exceed required airspeeds. Several pilots, when approaching a level off altitude,placed their hands on the thrust lever. This is a great practice as it helps remindthe pilot to be mindful of airspeed upon reaching altitude.
o When using FLC for a vertical mode altitude change, and already flying at aspeed well above the desired FLC speed, many pilots appeared to understand thatif they simply selected a lower climb speed and engaged the autopilot, the aircraftwould abruptly pitch in an attempt to reach that speed. To prevent this, theyselected VS mode and began the climb in that mode. Once they were within 10knots or so of their desired target climb speed, they then changed to FLCproviding a smooth transition and one that was more predictable for ATC.
Altitude awareness:o In an effort to be mindful of altitude awareness, a few participants called out loud
“one to go” or “one thousand” to go. Airlines teach their crews this method tohelp instill awareness that they should be closely watching the AP to see if it isgoing to capture the level off. When flying manually, an audible call-out alsoserves as a reminder to pilots that in a few seconds (depending on climb rate) theysoon need to begin leveling off the aircraft. Many instructors teach that when thiscall is made, no other tasks are to be completed until the level off is complete.
o After receiving a new altitude clearance, most of our participants not only placedthe new altitude in the altitude reference window as quickly as possible but alsobegan to climb or descend immediately to get the aircraft heading in the properdirection. Then they read back the clearance to the controller and/or completedother chores as required. This is a good workload management technique and hasthe added benefit of being quickly responsive to ATC.
Workload management:o When a clearance contained multiple directions (e.g., change, altitude, heading,
and contact a new controller) some participants did not always complete these

195
tasks in the order that they were given. They had a workload strategy that entailedcompleting those tasks that could be completed quickly first, such as entering anew radio frequency in the standby selector, and then focused on other morecomplicated tasks such as route or AP mode changes.
o If the participant was unable to correctly program the G1000 (such as for thereroute or instrument approach) or needed more time, he often requested vectorsuntil programming could be completed. Although possibly not always desirablefrom the standpoint of ATC, this strategy was an appropriate response to theproblems encountered.
o Several participants chose to reduce their airspeed at different points to providemore time to complete a task.
Positional awareness:o Many participants utilized the large map on the MFD with “own ship” displayed
to help maintain positional and geographic awareness. Similarly, several had“own ship” displayed on the MFD instrument approach plate for KHSP.
Flight path control:o When in heading mode and receiving clearance for a new heading from ATC,
most participants immediately and typically while the controller was still talking,changed the heading bug to the new heading. Thus, before the controller evenfinished talking, the aircraft was already turning to the new heading. Not onlydoes this rapid response help ATC with separation, but this places one of the mostimportant components of common ATC clearances “off the table,” so to speak,and prevents forgetting.
o Prior to departure several pilots dialed in the frequency of the instrumentapproach being used at the departure airport into a navigation radio. This practicecan greatly reduce workload should the need for an immediate return to theairport after takeoff arise.
General aircraft operation:o A few pilots used quietly audible “self-talk” during their flights. This can help to
better encode ATC instructions in memory and create a specific intention tocomplete a task at a later time as a countermeasure to prospective memory failure.Audible self-talk may also reinforce monitoring for expected AP/aircraft behaviorand set requirements, such as those for a stabilized approach. We believe thatsuch a technique is particularly beneficial during single pilot operations.

196
Automation:o There was a very high use of the autoflight system by our participants. Many
remarked that the use of an AP was paramount in such a high performanceaircraft. Using this system appropriately greatly reduced the workload for ourparticipants, particularly in busy airspace such as the northeast corridor.
o When most participants input a new altitude or heading, they entered the targetvalue in its entirety right away. For example, when cleared climb to 8,000 ftMSL, the participant did not interrupt entering in the altitude until 8,000 ft wasdisplayed in the altitude reference window. We think this is a good practice, eventhough other tasks may be waiting to be performed. Some who interrupted thistask before completion (for example, suspending altitude entry when having onlydialed in up to 6,800 ft), sometimes forgot to come back to finish the task. Animportant part of workload management is in deciding which tasks should becompleted in their entirety before moving on to the next and which should bebroken into subtasks and interleaved with other tasks.
Event 1 – Setting up for a BWZ VOR radial intercept:
G1000 programming:o Those pilots who simply placed BWZ VOR in front of BIGGY in their flight plan
had the fastest correct method of programming the radial intercept. Afteraccepting this change and selecting NAV mode on the AP control panel theaircraft was ready to intercept.
FD malfunction:o If the participants were unable to correctly fly the departure out of KTEB because
of the unscripted FD malfunction, most wisely reported their problems to thecontroller and requested vectors for the departure. They also asked for vectors toBIGGY instead of trying to program the radial intercept. This was a good use ofload shedding to manage an unexpected event. Additionally, reporting such aproblem can prompt ATC to monitor the aircraft a bit more closely to ensureseparation and ATC will generally be more prepared to offer additional help, ifrequested.
o During the FD malfunction, it appeared that all pilots so afflicted load shed therequirement to complete the climb checklist so they could focus on controlling theaircraft. This represented good task prioritization.

197
o When the FD malfunctioned and the AP followed suit, several participantsimmediately disconnected the AP. This was prudent as it clearly could not betrusted and continuing to change modes or other settings would have beenpotentially dangerous, especially so close to the ground. Priorities were wellplaced by controlling the aircraft first then trouble-shooting.
o When the FD failure occurred, at least one participant very quickly tried to gainaltitude to get the aircraft as far away from the ground as possible to troubleshootthe problem.
Departure:o Although the TEB 6 departure was a vector departure that is loaded into the
G1000, many participants had the TEB VOR tuned in to a navigation radio incase there was a problem or loss of GPS signal (e.g., momentary jamming such asthose sometimes reported by aircraft at Newark Liberty International Airport).
Event 2 - Course reroute at MXE and meeting a crossing restriction at DQO:
G1000 programming:o Given the close proximity to MXE when the reroute clearance was given, time to
program the reroute was of the essence. Some participants realized that theywould not be able to enter the entire route before the turn to DQO at MXE, sothey first just entered DQO after MXE in their flight plans so that the turn wouldbe caught. They seemed to appreciate that the most important part of getting thereroute entered was to insert the next fix. When time is short and workload ishigh, inserting new waypoints one at a time while interleaving other tasks may benecessary. Unless the legs between waypoints are very short, pilots will generallybe able to enter them faster than they can be crossed, even when interleavingother tasks. Although this strategy may be necessary on occasion, it is probablynot ideal, since it increases vulnerability to forgetting to insert all the newwaypoints.
o Some participants programmed a VPTH descent to meet the crossing restriction atDQO at the same time that they added DQO to their flight plans. This eliminatedthe need to reselect DQO later after completing other tasks associated with thereroute (e.g., entering the rest of the reroute, deleting old waypoints) to completethat programming. This also ensured the descent to meet the crossing restrictionwas initiated on time, even if the pilot was engaged in other tasks.

198
Event 3 - Expedited Descent:
Traffic avoidance:o When ATC alerted the participants to traffic, after looking outside and seeing they
were in IMC, most looked at the traffic display to determine their proximity to theother aircraft.
Automation use:o Several of the participants disconnected the AP when issued the expedited descent
and manually flew the reversal of the vertical profile. Although it is possible thatrapidly “coming off” of automation and quickly reversing the vertical profilecould lead to a loss of control from vestibular illusions, a trained instrument pilotshould probably be able to do this safely. None of our participants appeared tohave any difficulty with this maneuver.
o Most of the participants who disconnected the AP when issued the expediteddescent re-engaged the automation after the descent was initiated to preventdescending through the level-off altitude and to provide a more stable descentprofile for ATC.
o Turning off the autopilot and manually initiating the expedited descent resulted ina more timely response and smaller altitude gain than leaving the AP engaged andprogramming the descent via the AP. Additionally, the time compression whenfirst initiating an expedited descent may make a participant vulnerable to makingan error in AP mode selection or level off altitude selection.
Event 4 - Meeting a crossing restriction and preparing for an instrument approach whileassisting with lost pilot communications to ATC:
Crossing restriction:o The majority of pilots chose to program the crossing restriction prior to MOL
using VPTH. This left additional cognitive bandwidth to focus on helping the lostpilot and/or preparing for the approach.
Approach into KHSP & Lost Pilot:o In order to better control the tempo of the events occurring while assisting the lost
pilot and the pending approach at KHSP, a few participants slowed their airspeedwhile descending from 16,000 ft. MSL. Additionally, one considered asking for ahold and others requested vectors or a different IAF to give them more time toprepare for the approach at KHSP.

199
Other Things to Consider
Automation utilization:o During manual flight, if the FD is displayed but unprogrammed through the mode
control panel, it will command the last programming that it received in bothlateral and vertical modes. For example, when heading mode was last used, if theheading bug is not moved to a new position, the FD will command a turn in thedirection where the heading bug was set. Similar FD commands will be maderelative to altitude changes and aircraft pitch. Hence, a pilot could be manuallyflying a climbing turn to the right with the FD commanding a descending turn tothe left. This can be extremely disorienting and, when in IMC, it could possiblylead to a loss of control. When manually flying, we suggest either de-selecting theFD and using raw data on the PFD for both vertical and lateral awareness orprogramming the FD.
o We observed some participants allowing the autoflight system to default to ROLor PTCH mode because they had not selected either a lateral or vertical modewhen engaging the AP. This suggested that they did not verify two things on thenavigation status box at the top of the PFD: 1) that the mode selected wasaccepted, and, 2) that the mode selected made sense with the other modesdisplayed. Automation use can be thought of as having a two-way conversation.The autoflight buttons are the way the pilot communicates with the automation;the navigation status box is the automation’s way of communicating with thepilot.
Checklist use:o From our observations, it appeared that several participants were less than diligent
with regard to checklist usage. We do not know if this was a common practice forthem or if they were more lax in this area because it was simulator study. Westrongly support the use of checklists during flight. We recommend that pilotsactually refer to printed normal checklists for most if not all phases of flight ratherthan relying upon memory for their completion (Dismukes & Berman, 2010).
Chart usage:o It appeared that some participants had no chart back-up available for the G1000
MFD screen. Most reported that they typically use several sources of chart back-ups, such as paper or an iPad. We strongly support having multiple back-upsources readily available.

200
Communication:o The majority of our participants did not monitor 121.5 on their 2nd communication
radio, though this may be because they were in a simulator participating in astudy. Although not required by FARs, this is an accepted best practice in theindustry and one typically taught by instructors.
G1000 programming:o Several participants utilized the VOR and OBS to capture the BWZ radial, which
was an acceptable strategy for accomplishing that task. However, this strategywould have required them to shift from GPS to ground-based navigation sourcesand then back again upon reaching BIGGY—a multistep process which could bevulnerable to error. Additionally, BIGGY was not identified on the BWZ radialby DME or another source so pilots would have had to watch the moving mapclosely and rapidly shift from ground-based navigation to space-based to continueflying the route after passing BIGGY. This could easily have been missed,especially if contact from ATC or other flight duties occurred during this time.
FD malfunction:o During the FD malfunction some participants pulled back on the yoke with the
AP still engaged without selecting control wheel steering (CWS). Most CFIsteach this should only be done if the AP cannot be disconnected. Engaging in atugging match with an autoflight system is a dangerous practice and can greatlyincrease the chance of a loss of control.
o None of the participants who experienced the FD failure consulted the QRH tosee if there was a checklist for malfunctioning FD or AP available after they hadestablished control of the aircraft. Consulting the QRH for anomalies is goodpractice, even if pilots think an appropriate checklist does not exist or if they thinkthey have completed all the steps on one that does.
Instrument approaches:o It is a good idea to always think of the DH or MDA for an approach as containing
two numbers—the altitude and the altimeter setting—and to re-confirm thesecond when setting the first. Having done so would have kept many participantsfrom landing at KHSP with an incorrect altimeter setting.


![[A PILOTS PERSPECTIVE OF THE 1989 PILOTS DISPUTE ]apaterson/aviation/1989_pilot_dispute.pdf · flight.org Alex Paterson | . [A PILOTS PERSPECTIVE OF THE 1989 PILOTS DISPUTE ] ALEX](https://img.dokumen.tips/doc/110x75/5ad4c90f7f8b9aff228c436f/a-pilots-perspective-of-the-1989-pilots-dispute-apatersonaviation1989pilotdisputepdfflightorg.jpg)