Embed Size (px)
Citation preview

-------------------------------------------------------------------------------------------------------------------------------------------SCIENTIFIC SOLUTIONS: An Independent Consultant Serving the Needs of the Trace Element Community
Single Particle ICP-MS for the Characterization and Study of
Nanoparticles in the Environment
Inorganic VenturesICP Operations & Techniques Workshop
September 22, 2015 • Blacksburg, Virginia
Robert Thomas, Scientific SolutionsGaithersburg, MD

Definition of a Nanomaterial
The International Standards Organization (ISO) defines a nano-object as a material with at least one, two or three external dimensions in the nanoscale range of 1 to 100 nm. A nanoparticle is specifically a nano-object
with all three external dimensions in the 1 to 100 nm range which exhibits a property not evident in the bulk material However, there are also nanotubes, nanowires,,
nanofibers and nanoplates, and nanocrystals--------------------------------------------------------------------
SCIENTIFIC SOLUTIONS: An Independent Consultant Serving the Needs of the Trace Element Community

Different Types of Nanomaterials
-------------------------------------------------------------------------------------------------------------------------------------------SCIENTIFIC SOLUTIONS: An Independent Consultant Serving the Needs of the Trace Element Community

Nanotechnology-Based Consumer Products are EVERYWHERE
-------------------------------------------------------------------------------------------------------------------------------------------SCIENTIFIC SOLUTIONS: An Independent Consultant Serving the Needs of the Trace Element Community
The Market Size for Nanotechnology Products
-------------------------------------------------------------------------------------------------------------------------------------------SCIENTIFIC SOLUTIONS: An Independent Consultant Serving the Needs of the Trace Element Community
The National Institute of Standards and Technologies reported that nanotechnology-based consumer products are currently entering the market at a rate of 3 to 4 per week and it is estimated that $2.6 trillion in manufactured goods will be manufactured using some kind of nano technology in 2015

In the US, Funding for Nanotechnology Research is Approx $5 Billion
-------------------------------------------------------------------------------------------------------------------------------------------SCIENTIFIC SOLUTIONS: An Independent Consultant Serving the Needs of the Trace Element Community

-------------------------------------------------------------------------------------------------------------------------------------------SCIENTIFIC SOLUTIONS: An Independent Consultant Serving the Needs of the Trace Element Community

Characterization of Nanomaterials It is important to understand that the unique
capabilities and applications of nanomaterials are based on the fact that, because of their very small size, the characteristics and behavior are quite different to bulk materials with the same composition. As a result, the range of parameters that has to be
assessed to characterize them is typically larger than the characterization of the bulk material.
-------------------------------------------------------------------------------------------------------------------------------------------SCIENTIFIC SOLUTIONS: An Independent Consultant Serving the Needs of the Trace Element Community

What are the Important Metrics Used to Characterize Nanomaterials?
-------------------------------------------------------------------------------------------------------------------------------------------SCIENTIFIC SOLUTIONS: An Independent Consultant Serving the Needs of the Trace Element Community

-------------------------------------------------------------------------------------------------------------------------------------------SCIENTIFIC SOLUTIONS: An Independent Consultant Serving the Needs of the Trace Element Community
Analytical Techniques Used for Nanometrology

Implications of Nanomaterials Getting into the Environment
Processing waste has always been a manufacturing issue. It is slightly different today when nanoparticles are considered, as they are different to bulk material waste.
It’s been seen in laboratory experiments that nanomaterials can enter the human body by dermal exposure, inhalation, and ingestion.
While there are very few specific nanomaterial regulations, yet, there is increasing review and concern both within the industry and in the environmental field as to the fate and behavior of these materials in the environment.
-------------------------------------------------------------------------------------------------------------------------------------------SCIENTIFIC SOLUTIONS: An Independent Consultant Serving the Needs of the Trace Element Community
Environmental Impact on Human Health Many nanomaterial manufacturers are working with the EPA to
establish nanomaterial guidelines for health and safety for the workers and for the end users.
The EPA has therefore declared that the manufacturers of nanomaterials must show proof that they are safe when entering the environment
For example, the safety of airborne nanoparticles, nanoparticles in water, and skin exposure to nanomaterials are currently being studied by various research groups and universities
A key aspect of this work is the need for methods and analytical techniques that can separate, identify and quantitate ENPs at very low levels in the presence of naturally occurring nanoparticles.
-------------------------------------------------------------------------------------------------------------------------------------------SCIENTIFIC SOLUTIONS: An Independent Consultant Serving the Needs of the Trace Element Community

Government Initiatives
Within the United States, the EPA and other government agencies are proactive in regards to nanotechnology. The Federal Government has established the
National Nanomaterial Initiative (NNI) where government agencies and private industry meet to discuss to better understand nanomaterial impact on the environment and human health.
-------------------------------------------------------------------------------------------------------------------------------------------SCIENTIFIC SOLUTIONS: An Independent Consultant Serving the Needs of the Trace Element Community

Earth System Science and Environmental Management COST Action ES1205
The Transfer of Engineered Nanomaterials (EN) from Wastewater & Storm Water to Rivers
The following issues require clarification:
• Which Engineered Nanomaterials are released?• What amounts are being released? • How persistent are they? • To what extent do they cause in situ toxicity?
Reasons for knowledge gaps are a lack of suitable high sensitivity analytical methods, insufficient databases on usage and release, and the absence of comprehensive monitoring networks to advance scientific knowledge on release and fate of engineered nanomaterials in the urban water cycle.
Earth System Science and Environmental Management Team
-------------------------------------------------------------------------------------------------------------------------------------------SCIENTIFIC SOLUTIONS: An Independent Consultant Serving the Needs of the Trace Element Community

• Single Particle ICP-MS: a novel analytical technique that allows ICP-MS to monitor single nanoparticles in a sample, together with the dissolved ions to get information about the number, size, and size distribution of the particles
It is rapidly becoming common nanometrology practice in various laboratories: drug delivery, environmental release, silica dioxide, element oxide slurries, and other application areas.
It is being shown that SP-ICP-MS is capable of generating data that is not possible with any other single analytical technique
“A Lack of Suitable High Sensitivity Analytical Methods”
-------------------------------------------------------------------------------------------------------------------------------------------SCIENTIFIC SOLUTIONS: An Independent Consultant Serving the Needs of the Trace Element Community

Concept of Single Particle-ICP-MS
Steady-state Signal
Individual Signal EventsParticle Size Information-------------------------------------------------------------------------------------------------------------------------------------------SCIENTIFIC SOLUTIONS: An Independent Consultant Serving the Needs of the Trace Element Community
Differentiation Between Dissolved and Particles Signal
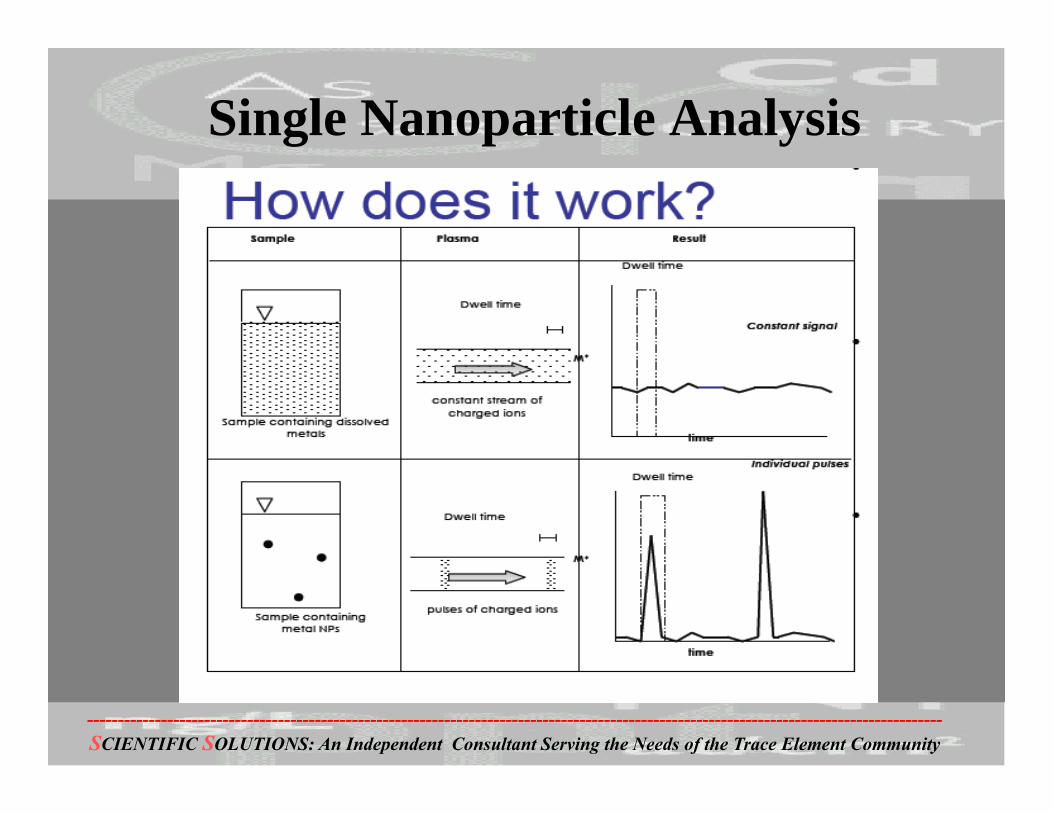
Single Nanoparticle Analysis
-------------------------------------------------------------------------------------------------------------------------------------------SCIENTIFIC SOLUTIONS: An Independent Consultant Serving the Needs of the Trace Element Community

-------------------------------------------------------------------------------------------------------------------------------------------SCIENTIFIC SOLUTIONS: An Independent Consultant Serving the Needs of the Trace Element Community
Quadrupole Mass Scan Controller
Quadrupole
Copper Ion – m/z 63
Detector
Channel No.
Mass Scan (amu)
63Cu ScanMultichannel Data Acquisition System
63Cu
1 2 3 4 5 6 7 ……… 20
Ions (Electrical Pulses)
63
Factors Influencing Transient Signal Data Quality Optimization of Measurement Protocol

-------------------------------------------------------------------------------------------------------------------------------------------SCIENTIFIC SOLUTIONS: An Independent Consultant Serving the Needs of the Trace Element Community
*
*
*
**
** *
**
*
*
*
* *
* ** *
*
*
*
* *
*
Direction of Mass Scan
Scanning Protocol• Scan to a mass• Settle electronics (quad and detector)• Dwell for fixed period of time at each point on mass• Move to next point on mass, settle and dwell• Scan/Hop to next mass• Repeat measurement cycle
Transient Signal Data Quality for Multielement AnalysisQuadrupole Scanning/ Settling/Measuring Time
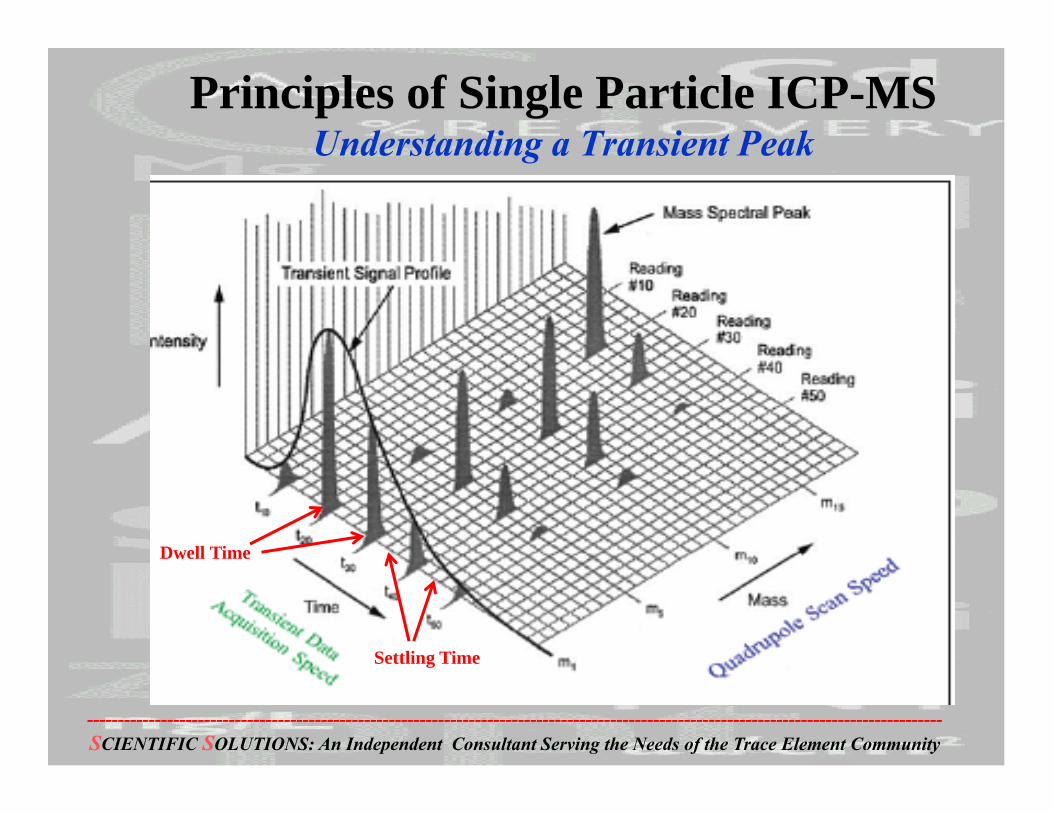
Principles of Single Particle ICP-MSUnderstanding a Transient Peak
-------------------------------------------------------------------------------------------------------------------------------------------SCIENTIFIC SOLUTIONS: An Independent Consultant Serving the Needs of the Trace Element Community
Dwell Time
Settling Time

-------------------------------------------------------------------------------------------------------------------------------------------SCIENTIFIC SOLUTIONS: An Independent Consultant Serving the Needs of the Trace Element Community
404550556065707580859095
100
100 90 80 70 60 50 40 30 20 10 5
Dwell Time (milliseconds)
% D
uty
Cyc
le
0.2 ms
1 ms
3 ms
5 ms
Factors Influencing Transient Peak Data QualityMeasurement Efficiency Cycle at Different Dwell
Times as a Function of Settling Time
Settling Time does not contribute to data quality as demonstrated by measurement efficiency (duty) cycle below:
Dwell Time x # Sweeps x # Elements x # Reps x 100 {(Dwell time x # Sweeps x # Elements x # Reps) + (Scanning/Settling Time x # Sweeps x # Elements x # Reps)}
Single point peak hopping, with a total integration time of 1 second/mass

For Rapid Transients (Nanoparticle Pulses), Short Dwell Times are Needed
-------------------------------------------------------------------------------------------------------------------------------------------SCIENTIFIC SOLUTIONS: An Independent Consultant Serving the Needs of the Trace Element Community

Using a Long Quadrupole Settling Times Can Easily Miss a Nanoparticle Pulse
The Limitations of Conventional ICP-MS
Overlap of ion plume transit with dwell time
Time
tp
td td tdSettling time Settling time
tdSettling timetd Settling time
ICP-
MS
Cou
nts
td = Dwell Time
Inaccurate particle counting leading to Inaccurate particle sizing

Particles = Pulsed Signal
... ....... ....... ....... ........... ...... ...
... ....... ....... ....... .................. Quadrupole
Detector
Time
Counts at mass 197 (Au)
Dwell Time
NanoparticulateMetals (Au)
Plasma
Pulse
• Tune Mass Spec for material• Intensity of pulse relates to
particle mass • Number of pulses relates to
particle concentration• Baseline = dissolved
300-500 µs
ICP-MS Schematic of Analysis of Metal-Based Nanoparticles

NexION 350 Single Particle Mode
Overlap of ion plume transit with dwell timeIC
P-M
S C
ount
s
TimeFast Continuous Data Acquisition = No Settling Time
Dwell Time Shorter than the Particle Transient Time
Fast Continuous Data Acquisition is Important

Shorter Dwell Times Means a Better Chance of Detecting a Single Nanoparticle Peak
-------------------------------------------------------------------------------------------------------------------------------------------SCIENTIFIC SOLUTIONS: An Independent Consultant Serving the Needs of the Trace Element Community
….and less chance of two nanoparticles being mistaken for one

How Nanoparticle Sizing is Carried out by ICP-MS
-------------------------------------------------------------------------------------------------------------------------------------------SCIENTIFIC SOLUTIONS: An Independent Consultant Serving the Needs of the Trace Element Community

Characterization Cycle by SP-ICP-MS
Syngistix Nano Application Module
Dilution
SP-ICP-MS Analysis
Time Resolved Data
Size Distribution
-------------------------------------------------------------------------------------------------------------------------------------------SCIENTIFIC SOLUTIONS: An Independent Consultant Serving the Needs of the Trace Element Community

, dwell time
Ag+ calibration data Convert to mass flux; using efficiency
“unknown” NP sample; raw data NP mass converted to diameter: apply element mass fraction and density, assume a geometry
Ref: Pace et al. 2011, Anal. Chem, 83, 9361-9369 Pace et al 2012, ES&T, 46, 12272-12280
Converting Pulse Counts to Diameter
Time (seconds)
Signal
intensity
Blank 500 ppt Ag+ 100 ppt AgNP
apply neb. efficiency, flow rate, dwell time
-------------------------------------------------------------------------------------------------------------------------------------------
SCIENTIFIC SOLUTIONS: An Independent Consultant Serving the Needs of the Trace Element Community

This transport efficiency must be calculated for each instrument and under the given run conditions for the mass flux to be accurate. In this way, the resulting calibration curve relates signal intensity (counts/event) to a total mass transported into the plasma per event.
The relationship between analyte concentration and the mass observed per event is called the “mass flux”, which is highly dependent on the transport efficiency.
Finally, the intensity of each individual pulse (counts/event) can then be transformed using the mass flux calibration curve to determine the particle mass, which can then easily be converted to particle diameter, when assuming a spherical geometry of the particle.
-------------------------------------------------------------------------------------------------------------------------------------------SCIENTIFIC SOLUTIONS: An Independent Consultant Serving the Needs of the Trace Element Community
Relationship Between Size/Diameter of Nanoparticle to Peak Height (2)

SP-ICP-MS: Calculate Instrument Transport Efficiency
Analyte ions are detected only during an ion plume transits to the detector; otherwise, intensity at the detector is due to background
Transport Efficiency
Sample flow rate (mL/min) NP concentration (particles/mL)
Observed pulse frequency (particles/min)
Compute this for NP standard
Solve for this
f = qntransCNP
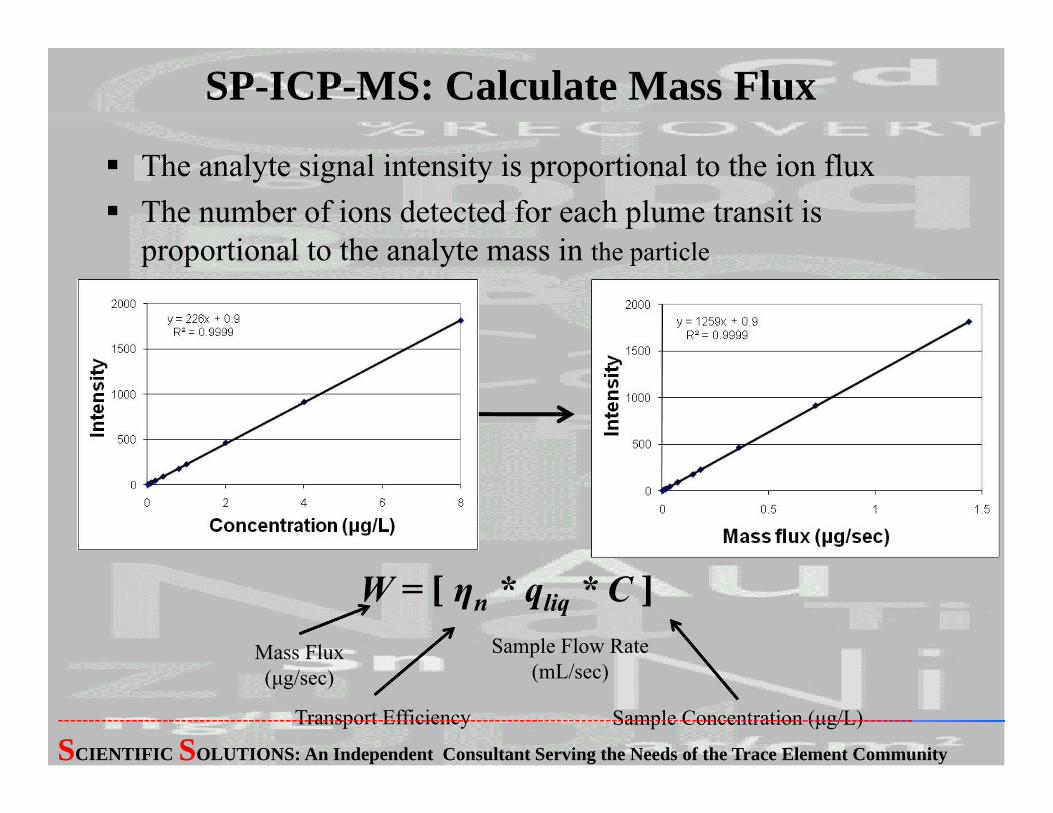
The analyte signal intensity is proportional to the ion flux The number of ions detected for each plume transit is
proportional to the analyte mass in the particle
SP-ICP-MS: Calculate Mass Flux
W = [ ηn * qliq * C ]
Transport Efficiency
Sample Flow Rate (mL/sec)
Sample Concentration (μg/L)
Mass Flux (μg/sec)
-------------------------------------------------------------------------------------------------------------------------------------------
SCIENTIFIC SOLUTIONS: An Independent Consultant Serving the Needs of the Trace Element Community

SP-ICP-MS: Relating Pulse Height to Nanoparticle Mass/Size
mENP fM1 *
(I pulse IBkgd )m
1Mf = mass fraction metal in NP.
m = dissolved mass calibration curve slope
0
5
10
15
20
25
30
35
40
10 35 60 85 110 135 160 185 210 235 260 285
Num
ber
of e
vent
s
r(197Au), counts
50 nm
80 nm

SP-ICP-MS: Relating Mass to Particle Shape
3/1
**6
ENP
ENPm
dFor Sphere (most common):
For wire/rod:2** r
mLwire

, dwell time
Ag+ calibration data Convert to mass flux; using efficiency
“unknown” NP sample; raw data NP mass converted to diameter: apply element mass fraction and density, assume a geometry
Ref: Pace et al. 2011, Anal. Chem, 83, 9361-9369 Pace et al 2012, ES&T, 46, 12272-12280
Data Processing Options of Converting Pulse Counts to Nanoparticle Diameter
Time (seconds)
Signal
intensity
Blank 500 ppt Ag+ 100 ppt AgNP
apply neb. efficiency, flow rate, dwell time
-------------------------------------------------------------------------------------------------------------------------------------------
SCIENTIFIC SOLUTIONS: An Independent Consultant Serving the Needs of the Trace Element Community

Data Processing Options for Converting Pulse Counts to Nanoparticle Diameter
Data Exported and Data Processing Calculations done via an External Spreadsheet Data Processing and Calculations Exported
Carried out by the ICP-MS Software Data Processing and Calculations Carried
out Interactively in Real Time, while the Nanoparticle Pulses are being Generated Commercial Instruments use one or more
of these approaches-------------------------------------------------------------------------------------------------------------------------------
SCIENTIFIC SOLUTIONS: An Independent Consultant Serving the Needs of the Trace Element Community

The PKI Nano Application Module is specifically designed for the analysis of Nano Particles on the NexION ICP-MS
The Nano Application Module can be used to rapidly determine:• Most common particle diameter (nm)
• Mean particle diameter (nm)
• Distribution of nanoparticle diameters
• Particle concentration (particles /mL) (total or by distribution)
• Dissolved concentration of analyte (ppb)
I’m More Familiar with the PKI Nano Application Module

PKI Nano Application Module: Interactive Real Time Display
Syngistix Nano Application Module
Real Time Nanoparticle Pulse Data
Real Time Distribution Histogram of Particle Size

PKI Nano Application Module: Interactive Real Time Display: Expansion of Pulses
Analytical Parameters
Method Parameters
Calibration
Real Time Distribution Histogram
Real Time Nanoparticle Pulse Data Expanded

Scrolling list of results
Size Distribution Histogram
Particle Calibration
Method Parameters
File Information
Adjustable Integration
Window
Dissolved Calibration
Sample & Table
Export
Data Reprocessing
Nano Application Module: Interactive Real Time Display: Dissolved and Nanoparticle Calibration

Sample Containing 20, 50 and 80 nm Gold Nanoparticles
Real-Time Display Showing Three Different Sized Nanoparticles
20 nm
50 nm 80 nm

Requires both Dissolved and Particle standards to be measured
Dissolved Calibration• Must be same element as the analyte• Required to determine the dissolved analyte concentration in the
sample• The blank is the particle diluent (typically DI)
Particle Calibration• Can be same or different element than the analyte
Typical Transport Efficiency = 5-10%
Calibration and Transport Efficiency

Dilute sample solutions are required• Ideally 100,000 – 200,000 particles/mL• Decreases the chance of 2 particles arriving at the plasma at the
same time• If sample is too dilute, it requires longer total measurement time to
see enough particles to get meaningful results Ideally, 1,000 – 3,000 peaks are needed in the distribution
for reliable results For unknown samples, the typical analysis time is typically
1-2 minutes• This generates the recommended particle concentration and the
optimum number of nanoparticle pulses• If number of peaks is outside the recommended range, adjust
analysis time and/or dilute sample more
Method Development for Optimum Particle Concentrations

In nano mode, only one isotope can be measured.
Maximum sample time determined by dwell time
(6M data points/acquisition)
• 10 minutes @ 100us dwell time
• 5 minutes @ 50us dwell time
• 1 minute @ 10us dwell time
Nano Application Limitations
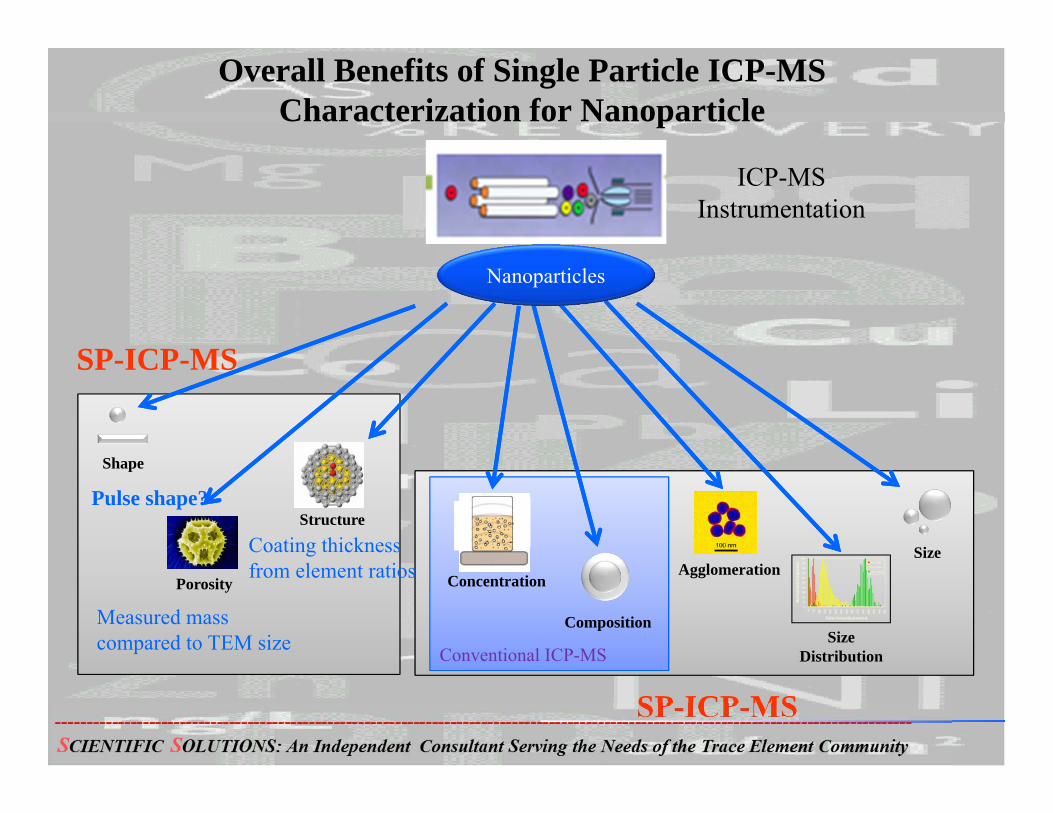
Overall Benefits of Single Particle ICP-MSCharacterization for Nanoparticle
Size
Size Distribution
Shape
Composition
Structure
Porosity ConcentrationAgglomeration
Nanoparticles
SP-ICP-MS
Pulse shape?
Measured mass compared to TEM size
Coating thickness from element ratios
Conventional ICP-MS
SP-ICP-MS
ICP-MS Instrumentation

SP-ICP-MS Publications (1) Silver Particle Characterization Using Single Particle ICP-MS (SP-ICP-
MS) and Asymmetrical Flow Field Flow Fractionation ICP-MS: D.M. Mitrano, A. Barber, A. Bednar, P. Westerhoff, C.P. Higgins, and J.F. Ranville; Journal of Analytical Atomic Spectrometry, 27, 1131-1142, (2012)
Detection of Nanoparticulate Silver Using SP-Inductively Coupled Plasma Mass Spectrometry: D.M. Mitrano, E.K. Leshner, A. Bednar, J. Monserud, C.P. Higgins, and J.F. Ranville; Environmental Toxicology and Chemistry, 31, 1, 115–121, (2012)
Selective Identification, Characterization and Determination of Dissolved Silver (I) and Silver Nanoparticles Based on Single Particle Detection by Inductively Coupled Plasma Mass Spectrometry: F. Laborda et al., Journal of Analytical Atomic Spectrometry, 26(7). 1362-1371 (2011)
Effect of Dwell Time on Single Particle ICP-MS Data Acquisition Quality: A. Hineman and C. Stephan; Journal of Analytical Atomic Spectrometry, 29, 1252-1257, (2014)
-------------------------------------------------------------------------------------------------------------------------------SCIENTIFIC SOLUTIONS: An Independent Consultant Serving the Needs of the Trace Element Community
SP-ICP-MS Publications (2) Colloid Analysis by Single Particle Inductively Coupled Plasma-
Mass Spectroscopy: a Feasibility Study C. Degueldre and P. Y. Favarger: Colloids and Surfaces A: Physicochem. Eng. Aspects, 217, 137–142, (2003)
Determining Transport Efficiency for the Purpose of Counting and Sizing Nanoparticles via Single Particle Inductively Coupled Plasma Mass Spectrometry: H.E. Pace, J. Rogers, C. Jarolimek, V.A. Coleman, C.P. Higgins, and J.F. Ranville; Analytical Chemistry, 83 (24), 9361–9369, (2011)
Rapid Analysis of Silver, Gold, and Titanium Dioxide Nanoparticles in Drinking Water by Single Particle ICP-MS: A.R. Donovan, H. Shi, C. Adams, C. Stephan; PerkinElmer Application Note, (2015)
Assessing the Fate of Silver Nanoparticles in Surface Waters using Single Particle ICP-MS, M. Hadioui, K. Wilkinson, C. Stephan, PerkinElmer Application Note (2014)-------------------------------------------------------------------------------------------------------------------------------
SCIENTIFIC SOLUTIONS: An Independent Consultant Serving the Needs of the Trace Element Community

SP-ICP-MS Publications (3)
Measurement and Analysis of Silver Nanoparticles in Wastewaters with Single Particle ICP-MS: M. Azodi, S. Ghoshal, C. Stephan, PerkinElmer Application Note (2015)
Single Particle ICP-MS Syngistix Nano Application Module: PerkinElmer Application Study, http://www.perkinelmer.com/catalog/product/id/N8140309
Gold Nanoparticle Uptake of Tomato Plants Characterized by Single Particle ICP-MS: Y. Dan, W. Zhang, X. Ma, H. Shi, C. Stephan; PerkinElmer Application Note (2015)
Extraction and Analysis of Silver and Gold Nanoparticles from Biological Tissues Using Single Particle Inductively Coupled Plasma Mass Spectrometry: E.P. Gray et. al., Environmental Science& Technology, 47, (24), 14315−14323, (2013)
-------------------------------------------------------------------------------------------------------------------------------SCIENTIFIC SOLUTIONS: An Independent Consultant Serving the Needs of the Trace Element Community

PKI SP-ICP-MS Nano Application Publications
PKI SP-ICP-MS Nano Application Materials:• Single Particle ICP-MS Theory white paper • Nano Application Module for SP-ICP-MS• Iron Nanoparticles SP-ICP-MS app brief • Gold Nanoparticles SP-ICP-MS app note • Silver Nanoparticles in surface water SP-ICP-MS app note • Element Oxide Slurries Nanoparticles SP-ICP-MS app note • Silver Nanoparticles Dissolution SP-ICP-MS app note • SP-ICP-MS for Characterization of Nanoparticles in Biological Tissues

Upcoming Publication
-------------------------------------------------------------------------------------------------------------------------------SCIENTIFIC SOLUTIONS: An Independent Consultant Serving the Needs of the Trace Element Community