Embed Size (px)
Citation preview

1
J. Aerosp. Technol. Manag., São José dos Campos, v12, e3920, 2020
INTRODUCTION
The aviation sector is vital to the European Union’s economy, accounting for 2.1 percent (€300 billion) of GDP (EC 2019). Despite economic uncertainties arising from the potential separation of the United Kingdom from the EU, air traffic is forecast to rise steadily to 12.4 million flights in 2024, an increase of 17 percent compared with 2017 (Eurocontrol 2018a). Simultaneously, with a record number of flights taking off, European airspace still faces considerable delays, caused by various factors, with an average delay of 17 minutes per flight in 2019 (Eurocontrol 2019a). Despite predictions of continued growth in air traffic, the full utilization of European airspace needed to accommodate it is constrained by the inefficiency of the European air traffic management (ATM) system. Operations over Europe are criticized for zigzagging across airspace owing to fragmentation (FABEC n.d.).
To respond to these issues, the Single European Sky (SES) program was set up by the European Commission (EC) in 2004, to address cost, flight efficiency and safety factors, and to introduce a unified approach to solving civil and military aviation problems. This initiative works by applying legal regulations to the EU and its member states, with the aim of reforming problematic aspects of operations in European airspace by proposing EU-wide laws intended to enhance international cooperation and increase ATM efficiency (Waldinger 2008).
The “holistic innovative approach” (Waldinger 2008), which involved gathering all European airspace users, including airlines, airports, air navigation service providers (ANSPs) and manufacturers, and engaging with major European aviation representatives such as Eurocontrol (which later became the SES network manager) and the European Aviation Safety Agency (EASA), was supposed to bring significant improvements to the European ATM system over time. However, the initiative has been blamed for failing to deliver the desired results. Almost two decades since its implementation, European airspace remains fragmented and
https://doi.org/10.5028/jatm.v12.1175 REVIEW ARTICLE
1.University of Huddersfield – Logistics, Hospitality, Marketing and Analytics – Huddersfield, United Kingdon*Correspondence author: [email protected]
Received: Oct 08, 2019 | Accepted: Jun 01, 2020
Section editor: Marina Efthymiou
ABSTRACT: This paper aims to assess the progress made towards the implementation of a Single European Sky (SES). It examines the program’s four main key performance indicators – environmental impact, safety, cost efficiency and capacity – and depicts in more detail the sequence of changes in each problematic area, thereby providing a better visualization of the main milestones and the issues hindering proposed reforms. The paper concludes that the overall process of reforming European airspace within SES has been slow and delayed, partly due to a lack of cooperation and commitment from air navigation service providers and states to deliver the information needed and apply desired amendments. The paper recommends several actions, which could improve the SES performance, including among others the implementation of incentives to meet the program’s objectives, as well as penalties for lack of cooperation, and the introduction of a common en-route charging rate at the European level.
KEYWORDS: Single European Sky; Air traffic flow management; European airspace; Civil-military cooperation.
Single European Sky: The progress so FarAnna Motyka1, Eric Tchouamou Njoya1,*
Motyka A, Njoya ET (2020) Single European Sky: The progress so far. J Aerosp Tecnol Manag, 12 e3920. https://doi.org/10.5028/jatm.v12.1175
How to cite
Motyka A https://orcid.org/0000-0002-0515-3722
Njoya ET https://orcid.org/0000-0002-1799-9469

J. Aerosp. Technol. Manag., São José dos Campos, v12, e3920, 2020
Motyka A, Njoya ET2
faces capacity problems (Serafimova 2019). The lack of progress in harmonizing regulations in European ATM has been criticized as frustrating and economically harmful (CAPA 2012).
To address the controversy surrounding the effectiveness of SES, evaluative research is undertaken in this paper to provide an overview of the reforms and improvements that it has brought about. The research is based on qualitative secondary data. Analyses of official reports provided by SES stakeholders, such as the performance review bodies for SES and Eurocontrol, are compared with existing academic literature evaluating the activities of a wide range of programs in relation to operational effectiveness, cost and flight efficiency, environmental impact and safety. The main obstacles to achieving SES’s full potential are investigated to determine key factors preventing the full unification of European airspace. Potential optimization measures and remedies are also discussed.
Like previous research, this study examines the performance scheme introduced in the second package of reforms to SES (SES II). However, in examining the program’s four main KPI’s – environmental impact, safety, cost efficiency and capacity – this research depicts in more detail the sequence of changes in each problematic area, thereby providing a better visualization of the main milestones and the issues hindering proposed reforms. Although the current study evaluates the same achievements of SES as some previous research, it analyses a broader range of aspects from different perspectives, leading to innovative findings. Existing studies have focused on one or few KPIs, with very few researches taking into consideration multiple angles of SES’s operations and providing an up to date overview of the progress of the main four KPIs. In addition, where sufficient data is released, this research reflects on the outcomes of the first and second reference period of the Single European Sky Performance Scheme, providing an up-to-date evaluation of SES achievements. This study, therefore, provides the most up-to-date evaluation of SES, contributing significantly to existing knowledge.
HISTORY OF EUROPEAN AIRSPACE
According to Article 1 of the 1944 Chicago Convention on International Civil Aviation, every state has complete and exclusive sovereignty over the airspace above its territory (ICAO 1944). This law resulted in the creation of flight information regions (FIRs) based mainly on national borders (Cook 2007). This fragmentation has had negative consequences and is often cited as a factor in “a microcosm” of challenges in efforts to create a seamless European air traffic control (ATC) (Oster and Strong 2007). In addition, it has been pointed out that many regional control centres are below the optimal size to be economically efficient, causing significant duplication in the overall infrastructure. Button and Neiva (2014) indicated that there is a wide dispersion in the relative efficiencies of different ANSPs within Europe, with the difference between least efficient and most efficient ANSPs in most years amounting to about 70 percent. Furthermore, Button and Neiva (2013) demonstrated that owing to spatial dependency from an economic efficiency perspective, the inefficiency of a ANSP provider might negatively affect the economic efficiency of its neighbours Therefore, the need for collective management of airspace, entailing the subdivision of sectors and establishment of routes regardless of frontiers, has been mentioned in numerous communications by the EC (COM 1999; 1996).
SES’s focus on the efficiency of the ATC system was not accidental. Prior to the program’s implementation, in the 1980s and 1990s air traffic faced many delays, with an average of 17 percent of flights delayed by at least 21 minutes in 1997, 45% of which were due to a very limited number of ATC sectors (3%); which illustrated the high interdependency of all centres and stressed the importance of collective management of the ATM system at European level (COM 1999). Moreover, owing to the fragmentation and the need to bypass military zones, flight trajectories were far from ideal. When the average route extension was first recorded by the Performance Review Commission (PRC) in 2001, short-haul flights were on average 10 to 12 percent longer than the optimal trajectories between origin and destination (PRC 2002). This additional flight distance increased costs in Europe by a significant €1,500 million per year (COM 1996).
The cost efficiency of Europe’s ATM system also required reform. The rise in air traffic resulted in a need for additional ATC equipment and staff to operate new sectors. En-route ATC charges grew by 60 percent between 1986 and 1998, and by 45 percent in the five years between 1993 and 1998. However, even these high numbers do not take account of the contribution of delays and congestion to airlines’ expenditure on air navigation services (COM 1999). The system also lacked transparency and fairness.

J. Aerosp. Technol. Manag., São José dos Campos, v12, e3920, 2020
Single European Sky: The progress so Far 3
Some airlines even refused to pay for the services of the French ATC because its charges were “too high” and a break-down of costs revealed that its fees included expenditure on the French civil aviation administration, which did not relate directly to the ATC’s services (Raffarin 2004). The ATC charging scheme was summarized as lacking appropriate cost control and requiring a framework to encourage ATC providers to improve their managerial skills and efficiency (COM 1996).
The resulting SES program was intended to cure these historical issues facing the European ATM system by encouraging cooperation between all airspace users and focusing reforms on problematic areas of the system. The sequence of modernizing efforts and struggles to resolve the problems of fragmentation and flight and cost efficiency, as well as improving the safety of the European ATM system, are explained and analysed in the next section.
RESEARCH METHOD
The degree of success in attaining the Single European Sky was assessed using the evaluative research method. The evaluative research provides judgement on the achievement, effectiveness and value of some predetermined objectives, or in the context of this research, a programme (Veal 2018). According to Saunders et al. (2016), this type of study may provide a theoretical contribution, where the research assesses whether and how well objectives are being achieved, as well as the reasons for specific successes, providing an overview when compared with existing theory.
To evaluate the effectiveness of SES, this study gathered secondary data from existing literature, policy documents and official reports provided by stakeholders and compared attained results with existing academic literature, where available. Moreover, two main sources of data were used: official reports from the Eurocontrol’s Performance Review Commission, summarising condition of the European airspace on an annual basis, as well as Performance Review Body reports, which reviews the implementation of the Performance Scheme. The analysis of official reports is complemented with academic literature in each of the sections discussed. The choice of this approach is that it allows the incorporation of a higher number of reports and studies examining improvements achieved since the SES establishment in 2004. Moreover, given the broad scope of SES, addressing various aspects connected with air traffic management, evaluative research appropriate for highlighting main milestones and bottlenecks of SES initiative, and provides recommendation for improving SES implementation.
EVALUATION OF SES’S IMPACT ON KEY PROBLEMS IN THE EUROPEAN ATM SYSTEM
FRAGMENTATION AND LACK OF SEAMLESS SKYFunctional airspace blocks (FABs) were established to solve the problem of European airspace fragmentation. This concept
was defined in the SES’s first regulatory framework in 2004, and executed in Regulation 1070/2009 as part of the second reform package (SES II).
FABs are defined as airspace blocks established according to operational needs rather than the borders of FIRs, which usually correspond with national boundaries (Eurocontrol n.d.). According to the Regulation, implementation of FABs would be a crucial enabler of increased cooperation between ANSPs, and a way to create synergies between them and improve overall performance. Another aim of incorporating FIRs into functional blocks was to improve the network’s efficiency and enable the required capacity to be achieved without compromising safety or worsening environmental impact. Efthymiou and Papatheodorou’s (2018) study reveals that the most significant potential benefits of FABs are a harmonised ATM system, standard operational procedures and airspace consolidation. Among other aspects, the impact of Flexible Use of Airspace, Free Route Airspace (FRA) and current ATM charging scheme on the flight efficiency has been evaluated, visualising the extent to which they are positively impacting the efficiency of the system (Fig. 1). Nava-Gaxiola and Barrado (2016) examined expected benefits of introducing the FRA in Southwest FAB, concluding that not only airlines, but taskload and conflicts measures respond in positive to the FRA.

J. Aerosp. Technol. Manag., São José dos Campos, v12, e3920, 2020
Motyka A, Njoya ET4
In 2019, nine FABs were in operation. However, the process of implementing FABs has been substantially delayed. The binding deadline stated in Regulation 1070/2009 required states to establish FABs by December 2012. A year later, none of the nine FABs was fully functional, nor had their establishment been completed several years later, which led the EC to make several formal requests for states to take action (EC 2013, 2014a; Fox 2016). The EC (2014b) indicated that progress on airspace reorganization was slow, with insufficient improvements to cost effectiveness, resulting in delays, higher fuel consumption and higher charges for users. According to Fox (2016), “To say the implementation of the FABs has been slow – would perhaps be only too clearly obvious and would therefore be a very much understated phrase to summarize the last 10-years of political lethargy.” He also points out that until all FABs are fully functional, the benefits listed in the SES framework will not be obtained.
• FRA full implemented in Portugal (2009) and partly completed (FRASAI project) in Spain; Current plans consider extending FRA concept to both, the whole SW FAB airspace and in a cross-border perspective. Te overall project is planned to be implemented by end 2021;
• Basic AMAN is already implemented in applicable Spanish airports and late in Lisbon;
• Extended AMAN implementation will be deployed by the Spanish and Portuguese ANSPs by 2023;
• PRNAV implemented in Portugal and planned in main Spanish TMAs (2023)
• APV procedures have been implemented in Portugal (2016) and late in Spain (2020).
• Joint FAB project: FRA implemented for and above FL285 in DK-SE FAB;
• Basic AMAN implemented at.Copenhagen and Stockholm Arlanda Airports. Extended AMAN implemented in both States;
• PRNAV implemented in both SE and DK;
• APV procedures implemented in SE, published in AIP. In DK, PBN IR is awaited, subject to local decisions.
Figure 1. Deployment of SESAR key features in Southwest and DK-SE FABs in 2016 (eATM 2016).
In addition to delays in establishing FABs, progress has varied between them. Despite its international character, at a national level, different process improvements within the SES ATM Research (SESAR) framework have been applied. As illustrated in Fig. 1, in implementing critical SESAR solutions, extended arrival management (AMAN) tools to improve sequencing and metering of arrival aircraft at airports have already been implemented in both states of the DK-SE FAB, but in the Southwest FAB will only be deployed in Portugal and Spain in 2023, whereas the basic AMAN has been implemented in Spain but not in Portugal.
FABs were ideally supposed to transform the fragmented ATC system from a national to an international level, and ensure cooperation driven by operational needs. However, they have added another layer of bureaucracy, creating an additional obstacle to creating the SES (Finger 2019). They promise potential benefits, but delays to their implementation, as well as unequal technical and operational development between FABs, is hindering achievement of the initiative’s full potential. According to Lawless (2013), optimal development of the blocks is limited by political, economic and social factors, and as a result, FABs represent a “fragile compromise” between national interests and reformed airspace.
Flight efficiencyThe reasons for flying along any other than the shortest route between two points include the need to avoid overflying military
zones and states with higher en-route charges, as well as congestion and meteorological issues (PRC 2010). Increasing flight efficiency is one of the main aims of the SES initiative. Longer trajectories translate into delays and economic losses, as well as burning more fuel and thereby increasing CO2 emissions.

J. Aerosp. Technol. Manag., São José dos Campos, v12, e3920, 2020
Single European Sky: The progress so Far 5
It has been noted that the problem of inefficiency must be addressed collectively at a pan-European level. Therefore, the need for Europe-wide goals was addressed in the targets set by the Provisional Council (PC) and then in the environmental target of the SES performance scheme (PRC 2008). The Provisional Council set a target of reducing the average route extension per flight by two kilometres per year between 2007 and 2010. To achieve this reduction, the 50 most inefficient city pairs were analysed, and efforts were made to reduce route extensions between them (PRC 2008). The overall goal was not met, and route extensions in 2010 averaged 49.1 kilometres per flight, compared with 48.9 in 2007 (PRC 2011). The SES performance scheme included an aim to improve the average horizontal en-route flight efficiency of the last filed flight plan (KEP) by 0.75 percent between 2009 and 2014. This target was not met, with only a 0.28 percent improvement (PRC 2012). Table 1 summarizes changes in flight efficiency through SES operations ). In the second reference period, two other KPIs of flight trajectory are added: (1) KEP, comparing the length of en-route path filled in the flight plan with the distance achieved in the air; (2) KEA, measuring the average horizontal en-route flight efficiency of the actual trajectory (PRB 2016). The comparison between the amount of fuel needed according to the flight plan (KEP) and the amount actually used (KEA) is therefore an indicator of environmental performance (PRC 2014). In view of the slow progress, none of the further optimizations targeted in the second reference period (PR2) have been achieved. The KPA and KEP values exceeded the target for the fourth year (Eurocontrol 2019f).
Table 1. Flight Efficiency improvement overview.
KPA Indicator General target
Flight efficiency
PC PR1 PR2
Reduction of the average route extension/flight by 2 km per year between 2007 and 2010
Reduction of horizontal route extention of
0.75% compering to 2009 (4.67% of total extention in 2014)
Reduction of KEA to 2.6% and KEP to 4.1%
Results
Not achivied Not achivied Not achieved
2010 2014 2015 2016 2017 2018 2019
Targeted KEP 4.67% 4.78% 4.61% 4.44% 4.27% 4.10%
Attained value 49.1 km 4.90% 4.84% 4.91% 4.73% 4.71% 4.68%
Targeted KPA n/a n/a 2.96% 2.87% 2.78% 2.69% 2.60%
Attained value n/a n/a 2.80% 2.96% 2.81% 2.8% 2.95%
Source: Adapted from PRR (2011-2019) and PRB (2013; 2016-2018)
Inefficient civil–military cooperation in sharing airspace may be another reason for inefficiency (see Civil and Military Cooperation), as well as the delayed implementation of FABs described in History of European Airspace. Flight efficiency is also negatively affected by strikes by air traffic controllers (ATCOs), which force pilots to avoid closed sectors, and therefore fly along non-optimal trajectories. Nevertheless, despite failing to meet the objectives, some improvements to flight efficiency can be identified.
Free route airspace (FRA)The free route airspace (FRA) concept has positively influenced reductions in route extensions in countries in which it has
been implemented. EC Regulation (EU) No 677/2011, which encourages the application of FRA, defines it as “specific airspace within which users can freely plan their routes between an entry point and an exit point without reference to the ATS route network”. Flights remain subject to ATC, but routes that allow best performance can be selected, without mandatory airways and crossing points (Nava-Gaxiola and Barrado 2016). FRA is an operational innovation within SES’s technological arm, SESAR.

J. Aerosp. Technol. Manag., São José dos Campos, v12, e3920, 2020
Motyka A, Njoya ET6
Eurocontrol, as network manager, has taken over supervision of FRA implementation, in cooperation with ANSPs, members of the European Civil Aviation Conference (ECAC) and airspace users (Eurocontrol 2019b). In 2017, the level of implementation was estimated at 46 percent, and it was predicted that the initiative would be implemented fully “on time” by the end of 2021 (ATC Master Plan 2017).
Flights under FRA rules are beneficial in several ways. Improved flight planning allows shorter routes and less fuel to be carried, resulting in lighter aircraft, so less fuel is burnt and CO2 emissions are reduced (Pavlova and Zadorozhnia 2014). States that have implemented FRA operations also experience improved flight efficiency, as observed by the PRC (2017). Moreover, the PRC found that the gap between actual and planned trajectories is on average 1.6 percent smaller in states where FRA has been fully implemented, increasing the predictability of airspace users’ operations, and positively affecting capacity and airspace utilization.
The FRA concept has also been independently examined. According to Mihetec et al. (2011), if airlines were to fly their preferred trajectories on night routes, this would reduce the distance flown by 1.6 million nautical miles, resulting in 17.8 thousand fewer litters of burnt fuel and 56 thousand fewer tons of CO2 emissions. Other research presents the beneficial impact of FRA application. For example, Nava-Gaxiola and Barrado (2016) describe the results of the three phases of the initiative’s implementation in the Southwest FAB, covering Portugal and Spain. According to their study, flight efficiency increased by up to 2.25 percent in the last phase, with savings of 32,000 nautical miles per day and around 334 tons of fuel, which translates into savings of 168,000 euros and 1,052 tons of CO2 emissions. The same authors (Nava-Gaxiola and Barrado 2018) examined general opinions of FRA among ATCOs in the four regions in which it was implemented (the Lisbon, North European, Czech Republic and Hungaro Control FRAs). Among other aspects, 85 percent of controllers agreed that FRA is beneficial. The necessity for its implementation was marked as high, and 78 percent of respondents believed that the initiative would be fully implemented by 2030, while only five percent predicted its withdrawal. Safety was another factor discussed in the study, as controllers face a more chaotic situation in controlling free movement in the sector. Crossing the same points in the airway system avoids the risk of conflicts, but in FRA airspace, potential conflicts are harder to detect as movements are less predictable. Therefore, the importance of improving ATC technology is stressed. Nevertheless, Gaxiola et al. (2018) suggest that the complexity of traffic and the number of separation losses in the Northern Europe FRA (NEFRA) has not significantly worsened with higher traffic in the area.
In summary, both PRC reports and the academic literature indicate that the FRA concept is a successful aspect of airspace modernization, bringing benefits to airspace users by creating potential for more direct flights, as well as fuel and money savings.
CIVIL AND MILITARY COOPERATIONThe permanent separation of military and civil zones had to be reconsidered in light of the need for additional space resulting
from the continued rise in air traffic. Civil–military co-operation was noted as crucial to achieving uniform airspace management and successfully implementing changes, and thus to the success of the SES approach (EC 2004).
In order to achieve these goals, flexible use of airspace (FUA) was incorporated into the SES legal framework in Regulation (EC) No 2150/2005. This concept, developed by Eurocontrol in 1996, aims to ensure that airspace is considered as a common resource for all users, rather than as either purely civil or military. In such airspace, segregation of different users should only be temporary, based on real-time needs. Nevertheless, states’ efforts to update information on actual use of airspace between military and civil users have become a key constraint on reaching the full potential of the FUA.
This KPI was included in the first reference period (RP1) of the SES performance scheme, focusing on monitoring how airspace allocations between users are used to improve notifications of available airspace and prevent excessive usage (PRC 2012). However, some states failed to comply with Eurocontrol’s request to provide statistics on real airspace usage in 2013 and 2014 compared with segregated periods (indicated by blank cells in Table 2).

J. Aerosp. Technol. Manag., São José dos Campos, v12, e3920, 2020
Single European Sky: The progress so Far 7
Table 2. Pre-tactical airspace time used versus allocated (PRC 2015).
State(2014)Used/
allocatedTotal hours
Albania
Armenia
Austria 66% 1,087
Belgium
Bosnia and Herzegovina
Bulgaria
Croatia na.
Cyprus
Czech republic 40% 43,098
Denmark 17% 2,655
Estonia Data issues
Finland 27% 26,262
France
State(2014)Used/
allocatedTotal hours
Georgia not. apll.
Germany 45% 33,479
Greece
Hungary 30% 14,477
Ireland Data issues
Italy 44% 4,008
Latvia 29% 635
Lithuania 93% 845
Luxemburg na.
Malta
Moldoca
Monaco na.
Montenegro na.
Netherlands 84% 28,189
State(2014)Used/
allocatedTotal hours
Norway 47% 5,276
Poland 45% 87,044
Portugal na.
Romania 62% 58,362
Serbia
Slovakia 57% 55,592
Slovenia
Spain 66% 10,321
Sweden 41% 564
Switzerland
FYROM 100% 99
Turkey
Ukraine
UK 40% 143,634
Furthermore, later questionnaires and follow-ups in 2015 and 2016, evaluating aspects such as pre-tactical and tactical allocation of airspace, were completed as required by only a minority of states. The questionnaire results also revealed problems in real-time information sharing at local and system levels (PRC 2016, 2017). Lack of cooperation between the states has prevented achievement of the full potential of civil–military cooperation, as the FUA’s actual application cannot be accurately assessed owing to the states’ lack of consistent and useful data provision.
CAPACITY AND DELAYSEn-route capacity is adjusted to predicted traffic by applying the right configuration of controlled sectors, splitting them into
smaller units capable of controlling a higher number of flights. Lack of capacity may result from ineffective capacity planning, which is the responsibility of ANSPs, or from staff unavailability, strikes and other staff-related issues (PRR 2011). Reducing air traffic flow management (ATFM) delays is a KPI in the performance scheme. Prior to its implementation, the Provisional Council set a target of reducing average ATFM delays in the summer months (May–October) to one minute from 2010. The target was not met in 2011, and all-year delay monitoring was applied in following years under the scope of SES II. The target of reducing the average ATFM en-route delay per flight to 0.5 minutes was again not reached during PR1, and is not predicted to be met during PR2. The basis for this assumption is that ATFM delays were already higher in the first two months of 2019 than the guideline of 0.14 minutes per flight (m/flt), with 0.36 m/flt in January and 0.46 m/flt in February (Eurocontrol 2019ce).
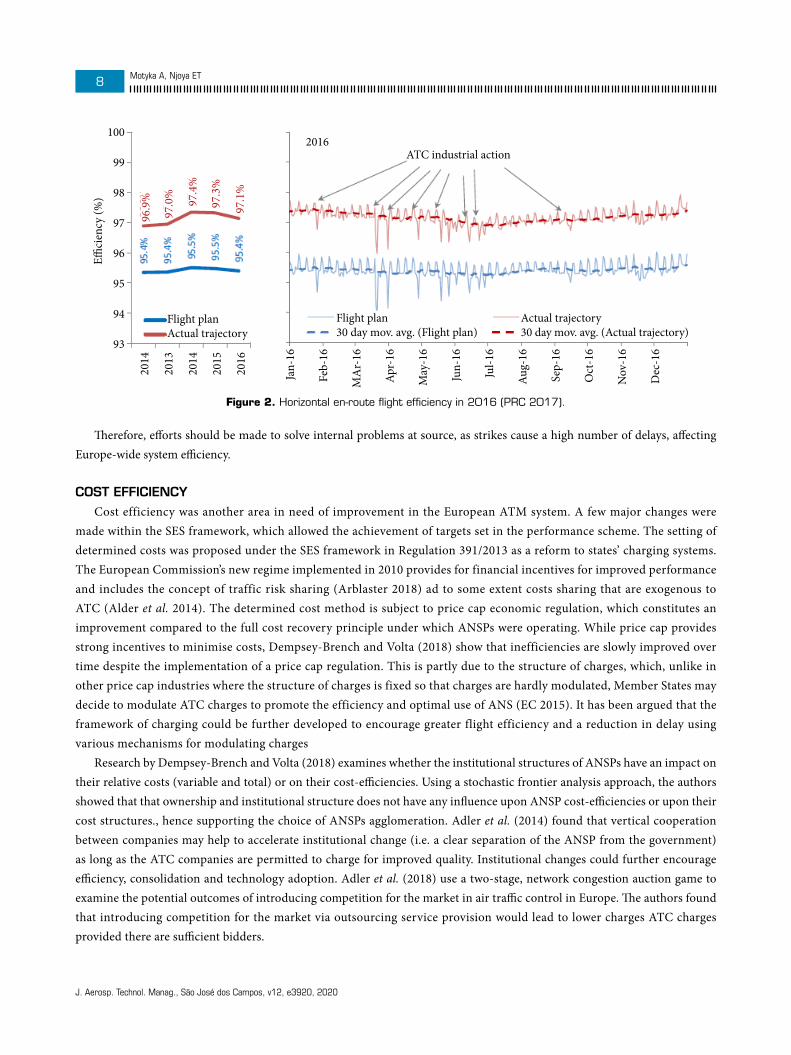
It has been noted that the majority of delays have been consistently generated by a small number of states, including Nicosia ATC, Barcelona ATC and Maastricht UAC from 2015 to 2017, and by French air navigation service providers (ASNPs) owing to industrial action and system modernization (PRC 2016, 2017). The PRC (2017) reported that ATCO strikes in France and Spain contributed to 41.6 percent of all en-route ATFM delays in the Eurocontrol area in 2016. Strikes continue to be a problem, accounting for 14.3 percent of total ATFM delays in 2018 (Eurocontrol 2019d). Moreover, such actions have a negative impact on flight efficiency, and cause environmental harm, decreased cost efficiency and lower overall productivity of the system, owing to flight cancellations, rescheduling and delays (PWC 2016; PRC 2017). Figure 2 illustrates the negative impact of industrial action on flight efficiency.
J. Aerosp. Technol. Manag., São José dos Campos, v12, e3920, 2020
Motyka A, Njoya ET8
2016ATC industrial action
Flight plan30 day mov. avg. (Flight plan)
Flight planActual trajectory
96.9
%
97.0
%
97.4
%
97.3
%
97.1
%
Actual trajectory30 day mov. avg. (Actual trajectory)
Effici
ency
(%)
100
99
98
97
96
95
94
93
2014
2013
2014
2015
2016
Jan-
16
Feb-
16
MA
r-16
Apr-
16
May
-16
Jun-
16
Jul-1
6
Aug-
16
Sep-
16
Oct
-16
Nov
-16
Dec
-16
Figure 2. Horizontal en-route flight efficiency in 2016 (PRC 2017).
Therefore, efforts should be made to solve internal problems at source, as strikes cause a high number of delays, affecting Europe-wide system efficiency.
COST EFFICIENCYCost efficiency was another area in need of improvement in the European ATM system. A few major changes were
made within the SES framework, which allowed the achievement of targets set in the performance scheme. The setting of determined costs was proposed under the SES framework in Regulation 391/2013 as a reform to states’ charging systems. The European Commission’s new regime implemented in 2010 provides for financial incentives for improved performance and includes the concept of traffic risk sharing (Arblaster 2018) ad to some extent costs sharing that are exogenous to ATC (Alder et al. 2014). The determined cost method is subject to price cap economic regulation, which constitutes an improvement compared to the full cost recovery principle under which ANSPs were operating. While price cap provides strong incentives to minimise costs, Dempsey-Brench and Volta (2018) show that inefficiencies are slowly improved over time despite the implementation of a price cap regulation. This is partly due to the structure of charges, which, unlike in other price cap industries where the structure of charges is fixed so that charges are hardly modulated, Member States may decide to modulate ATC charges to promote the efficiency and optimal use of ANS (EC 2015). It has been argued that the framework of charging could be further developed to encourage greater flight efficiency and a reduction in delay using various mechanisms for modulating charges
Research by Dempsey-Brench and Volta (2018) examines whether the institutional structures of ANSPs have an impact on their relative costs (variable and total) or on their cost-efficiencies. Using a stochastic frontier analysis approach, the authors showed that that ownership and institutional structure does not have any influence upon ANSP cost-efficiencies or upon their cost structures., hence supporting the choice of ANSPs agglomeration. Adler et al. (2014) found that vertical cooperation between companies may help to accelerate institutional change (i.e. a clear separation of the ANSP from the government) as long as the ATC companies are permitted to charge for improved quality. Institutional changes could further encourage efficiency, consolidation and technology adoption. Adler et al. (2018) use a two-stage, network congestion auction game to examine the potential outcomes of introducing competition for the market in air traffic control in Europe. The authors found that introducing competition for the market via outsourcing service provision would lead to lower charges ATC charges provided there are sufficient bidders.

J. Aerosp. Technol. Manag., São José dos Campos, v12, e3920, 2020
Single European Sky: The progress so Far 9
An assessment of the progress achieved (Table 3) shows that for the targets for the first Reference Period (2009- 2014) regarding cost efficiency were met, namely the planned reduction in the Determined Unit Cost by –3.5% per year. The unit cost decreased by 13% through the RP1. Further annual decreases have been made in RP2, and the target may be met if the negative trend continues. It has been however argued by the European Court of Auditors (2017) that the determined unit cost and unit rates are due to the deviations between actual and forecasted traffic. The authors noted that between 2011 and 2016 the total unit cost was reduced only by 4% and the accumulated decrease of 22% achieved between the year of SES implementation and 2016, with major gains achieved during the periods of highly increased traffic.
Table 3. Reflection on the performance scheme’s cost-efficiency targets.
Reflection on PS cost-efficiency targets
Cost-efficiency
PR1 PR2
Reduction of enrout ANS Determined Unit Cost (DUR) per service unit to EUR53.92 in 2014
Reduction of en-route ANS DUR per service yearly,to reach EUR94.10 in 2019
Result
Achivied Predicted to be achivied
2014 2015 2016 2017 2018 2019
53.92 56.64 54.95 52.98 51.00 49.10
53.2 50.5 49.2 52.9 49.6
Source: adapted from PRR (2013 – 2019)
Overall improvements in cost efficiency have been made by the ANSPs. The drivers for cost reduction on the European-level are among others the change in the charging schemes, both en-route and terminal, as well as improved cost transparency and cost analysis.
Despite being obliged to publish five-year objectives under Eurocontrol’s multilateral agreement relating to route charges (1981) and further stated principles (1999), states often failed to comply. En-route cost plans were not provided by all Eurocontrol member states until 2006, after the EU had addressed this problem through Regulation 2096/2005 by stipulating that all service providers should draw up a five-year business plan and a strategy to achieve those objectives, allowing a better and more reliable overview of en-route costs at the European level (PRC 2007). Cost reporting was also reformed to require information on different categories of expenses, forecast traffic and planned investments to be exchanged annually between airspace users’ representatives, the PRC and Eurocontrol. Cost categorization allowed more meaningful comparisons of performance between ANSPs (PRC 2009). It also incentivized service providers to improve their cost-effectiveness and thus meet their previously announced goals. The ability to compare cost-effectiveness indicators enables a shared understanding of performance achievements and establishes a basis for setting further realistic targets at the Eurocontrol level (PRC 2008).
En-route and terminal ANS charging system reformsThe major reform of the EC through the SES framework was the change to the European en-route and terminal ANS charging
system. When the initiative was launched, Eurocontrol member states (apart from the UK) were applying ATC service charges to airspace users using a full-cost recovery system, whereby total annual expenditure on ANS services was incorporated into the charge payable in the following year (PPC 2014). According to Raffarin (2004), this system did not provide incentives for ANSPs to control costs since they were fully recoverable.
This system using a price cap approach is meant to provide economic incentives for ANSPs to lower their costs if traffic is lower than forecast, as the difference between the actual and previously determined cost is retained/borne by the state or ANSP

J. Aerosp. Technol. Manag., São José dos Campos, v12, e3920, 2020
Motyka A, Njoya ET10
(PRC 2015). In 2016, increased traffic and differences between real and determined costs resulted in additional revenues of €234.2 million shared between ANSPs and airspace users (PRB 2016).
According to Efthymiou and Papatheodorou (2018), the risk-sharing scheme is an essential incentive for ANSPs and encourages improved management and productivity. Nevertheless, the current en-route charging system in Europe encourages airlines to plan routes that overfly states with lower charges, compromising flight efficiency and environmental sustainability in order to pay lower prices. Some authors have suggested unified rates at the European level as a solution to the problem.
While Eurocontrol provides a harmonised system of charging for en-route services though the Central Route Charges Office, there is no equivalent system for ANS services (EC 2001). To remedy the lack of consistencies of charging mechanisms between states and an integrated terminal ANS charging (TNC) system), the EC proposed such a scheme in Regulation 1794/2006. SES member states provided terminal ANS cost data for the first time in November 2008 (PRC 2010). Moreover, a common charging scheme was introduced to allow better comparison of terminal unit costs. Since 2015, the charges have been based on a function of the maximum take-off weight ((MTOW/50)^α) (PRC 2017), which allows direct comparison of costs between airports, and cost optimizations. Also since 2015, the “determined cost” method has been applied to the TNC, providing incentives for cost reductions and risk sharing (PRC 2017). According to PRC (2015), there are wide differences in the level of unit costs at terminal charging zones across Europe, however, total terminal ANS costs have how a decreased trend, which was forecast to continue for 2016-2019. Table 4 presents an example of TNC charging structure at major EU airports, where UR is a unit rate, ε is a compensation coefficient.
Table 4. Examples of TNC formulae in force at the top 25 European airports (PRC 2005).
Constant flat fee + (UR × MTOW)London/Heathrow, London/Gatwick, London/Stansted, Amsterdam, Stockholm
Constant flat fee × UR × MTOWParis/CDG, Paris/Orly
UR × MTOWBarcelona, Madrid, Palma, Rome, Milan, Brussels, Copenhagen, Dublin, Zurich
UR × (MTOW/50)Frankfurt, Munich, Düsseldorf, Vienna, Helsinki
Constant flat feeIstanbul
No specific TNSAthens, Manchester, Oslo
SAFETYThe safety reforms within the scope of SES have focused on improving safety reporting by encouraging the implementation
of a “Just Culture” (JC) and making the safety management system more efficient. This focus was motivated by the lack of a consistent and unified ATC accident-related reporting system at the European level, as safety data, where published by states, varied in its quality, quantity and timeliness. Some states reported on a monthly and some on a yearly basis, with different incident specifications, as shown in Table 5 (PRC 2005). Therefore, in both RP1 and RP2, implementation of JC, the effectiveness of safety management (EoSM), and occurrence reporting using a risk assessment tool (RAT) were monitored.

J. Aerosp. Technol. Manag., São José dos Campos, v12, e3920, 2020
Single European Sky: The progress so Far 11
Table 5. Publicly available national ATM safety indicators (PRC 2005).
Publicly-available information
Safety incidents with severity classification
Safety incidents without severety classification
General Statements on ATM safety
No information on ATM safety
Austria, Belgium, Czech Republic, Denmark,
Germany, Finland, France, Italy, Switzerland, United
Kingdom
Ireland, RomaniaMaastricht UAC, Netherlands,
Norway, Portugal, Slovakia, Spain, Sweden
Albania, Bosnia-Herzegovina, Bulgaria,Croatia, Cyprus,
FYROM, Greece, Hungary, Luxemburg, Malta, Moldova,
Monaco, Poland, Slovenia, Turkey, Ukraine
In addition to the afore-mentioned KPIs, within the SES framework the rules regarding safety have been reorganized and unified into a single set of regulations, which became possible when EASA’s responsibilities were broadened to include oversight of ATC, ANS and aerodromes (PRC 2010). EASA’s implementation rules have since been based on SES legislation, which ensures that common requirements are issued by a single authority and uniformly implemented by all member states (EASA 2008).
Severity assessment of ATM-related occurrencesThe RAT is a method of classifying ATM-related occurrences, with a focus on defining their severity and the probability of their
repetition in the future, based on completing marksheets for each occurrence, thereby allowing safety analysis (SKYbrary 2017a).Under Regulation (EU) No 691/2010, the safety KPI for RP1 was set as the percentage of RAT severity classifications. During that
period, an increase in the percentage of severity assessments using the tool was noted in all three categories (Table 6).The tool has potential limitations relating to the differing maturity and availability of necessary data, so the reliability factor is
below 70 percent and occurrences grouped as non-determined cannot be included in the analysis (Eurocontrol 2015). However, the level of such occurrences has decreased since its implementation. The PRC (2016) suggests that this improvement may have been achieved as a result of higher usage of the RAT methodology (Table 7), which indicates a positive change in safety reporting achieved through the SES’s activities.
Table 6. Percentage of occurrences severity assessed using RAT: RP1 period improvements.
Separation Minima Infringements Runway IncursionsATM Specific Occurrences
Groung Overall Groung Overall Overall
2012 2014 2012 2014 2012 2014 2012 2014 2012 2014
64% 87% 46% 65% 49% 79% 36% 66% 52% 73%
+ 23% + 19% + 30% + 30% +21%
Source: adapted from Eurocontrol performance dashboard (2015)
Table 7. Percentage of occurrences neither severity classified nor determined 2012–2017.
Occurrences Not Severity Classified and Not Determined
RP1 RP2
2012 2013 2014 2015 2016 2017
43% 30% 13.50% 18% 30% 18.60%
Improvement High variations
Source: adapted from PRC (2012–2017) and (SCR 2015–2017).

J. Aerosp. Technol. Manag., São José dos Campos, v12, e3920, 2020
Motyka A, Njoya ET12
In RP2, a target was set for all states to report almost all (99%) of ATM occurrences using the RAT methodology (PRB 2013), with 100 percent at the state level. It is predicted that the gap between target and real values will be narrowed in 2019, in light of the annual rate of progress.
Just CultureAccording to the International Federation of Air Traffic Controllers’ Associations (IFATCA 2015), Just Culture (JC) is an
important initiative that aims to increase incident reporting by creating an environment in which controllers and pilots are sufficiently confident to report any mistakes that create a threat, to enable safety analysis. In order to achieve this, rather than penalizing controllers for all errors, the regulations must be amended so that only cases of serious disregard for safety result in disciplinary action.
Monitoring of the application of JC was included as a KPI in RP2, assessed by conducting annual surveys among relevant stakeholders. Its implementation is measured in three categories: the existence of JC policies within the state; the legal status of reporting incidents and their consequences; and the public provision of safety occurrence-related statistics and their investigation (EASA 2014). Analysis of questionnaires completed in 2017 shows that overall, the level of application of JC in each category was quite high, at around 80 percent on average (Table 8). This indicates that, with various improvements, the initiative can be fully implemented. The number of states that responded positively to every question in each category varied: the highest level related to “occurrences”, whereas only a minority of states had fully developed the policy, implementation and legal aspects of JC. Lastly, only four states attained the maximum score in all three categories, presumably meaning that only these members were operating fully according to the initiative. States that have fully implemented the initiative are in the minority. It is therefore important that efforts be made to change the perception of human error within organizations, as well as at the national regulatory level.
Table 8. Application of Just Culture: Annual questionnaire results 2017.
Percentage of positive (“yes”) responses in the questionare 2017
State Level
Policy and its implementation Legal/Judiciary Occurences
79% 76% 87%
Number of states who responded “yes” to al questions from each category (out of 30)
9 6 24
States with a maximum score in 3 categories
UK, Ireland, Belgium, MaltaSource: adapted from Eurocontrol (2017).
Effectiveness of safety management (EoSM)The International Civil Aviation Organization (ICAO) defines a safety management system (SMS) as a set of tools for
organizational management issued by the regulator which allows safety responsibilities to be met (SKYbrary 2017b). It focuses on implementation and monitoring of safety compliance on different levels, such as compliance with international legislation, risk management processes, as well as safety reporting and investigation. (SKYbrary 2017; Kovacova and Balint 2017). Implementation of an SMS was first required in Eurocontrol’s safety regulatory requirements. In 2011 it became part of European law, and its implementation became mandatory under the scope of Commission Regulation (EU) No 691/2010. Application of SMS became a KPI monitored in the performance scheme, using a maturity monitoring tool through surveys submitted annually by relevant stakeholders to evaluate the implementation of different aspects of the SMS (Fig. 3).

J. Aerosp. Technol. Manag., São José dos Campos, v12, e3920, 2020
Single European Sky: The progress so Far 13
Safety culture
Safety policy and objectivesElements:
Safety policySafety responsibilities
Compilance with international legislationCoordination of emergency response planSafety management system documentation
Safety risk managementElement:
Risk management process
Safety achievementElements:
Safety interfacesSafety by designFatigue-related
Risk Management
Safety AssuranceElements:
Safety performance monitoring and measurement
Change managementContinuous improvement
of SMSsafety reporting and
investigationSafety surveys/audits
Safety PromotionElements:
Safety communicationSafety training and
education
Figure 3. Factors evaluated within the SMS maturity tool (Kovacova and Balint 2017).
In RP2, targets were set for states to achieve at least EoSM level C, and for ANSPs to achieve level D in all management objectives (MOs) (PRB 2013). Level C is defined as “‘Implementing’ – defined and standard processes are used for managing”, and Level D is defined as “ Managing & Measuring’ – objectives are used to manage processes and performance is measured” (EASA 2014). Table 9 presents the percentage of states/ANSPs meeting the desired criteria between 2015 and 2017. In the RP2, targets were set to achieve at least EoSM level C by States, and level D in all Management Objectives (MOs) by ANSPs (PRB 2013). According to EASA (2014), the scale A to E defines the extent to which the safety processes and their performance are managed and measured, where in case of A the processes are ad hoc and chaotic in opposition to level E, where the processes and process performance are improving constantly. Levels C and D, desired to be achieved by 2019 are defined as follows: ‘Level C which is defined as ‘Implementing’ — defined and standard processes are used for managing; and Level D which is defined as ‘Managing & Measuring’ — objectives are used to manage processes and performance is measured’.
Overall, improvements have been made, but it is impossible to predict the final RP2 results owing to a lack of consistent data. However, it can be seen that the results for some MOs, such as Safety Assurance and Policy, are close to the target values. On the other hand, greater efforts need to be made in relation to Safety Culture and Safety Promotion at the state level.
Table 9. Effectiveness of the Safety Management Improvement 2015-2017.
Percentage of states that achieved level C of EoSM among different Management Objectives
Year Safety policy and object
Safety risk Mgmt.
Safety assurance
Safety promotion Safety culture
2015 47% 50% 47% 50% 27%
2016 61% 63% 53% 53% 23%
2017 60% 60% 60% 57% 33%
Percentages of ANSPs that achieved level D of EoSM among different Management Objectivies (MOs)
Year Safety policy and object
Safety risk Mgmt.
Safety assurance
Safety promotion Safety culture All other MOs
2015 65% 65% 68% 48% 55% 32%
2016 71% 65% 77% 61% 65% 45%
2017 81% 65% 90% 74% 58% 61%Source: adapted from SMS Annual Maturity Assessment Questionnaires (2015-2017).

J. Aerosp. Technol. Manag., São José dos Campos, v12, e3920, 2020
Motyka A, Njoya ET14
PROBLEMS CONSTRAINING IMPLEMENTATION OF THE SES
CONTRADICTORY STAKEHOLDER INTERESTSStates’ sovereignty over their own airspace is guaranteed under Article 1 of the Chicago Convention. Shubert (2000) explains
that operational and regulatory aspects of ATM have been developed jointly at the national level for reasons of national security and defense. Therefore, corporatization of the ATM has been challenging, as in some cases it has gone against states’ constitutions. Shubert (2000) has advised that, in order for the ANS system to become more efficient, a new understanding of sovereignty must be promoted, whereby the operational side of the system is separated from states’ sovereign power to regulate ATM within their territory. States seeking to retain full control of their airspace is only one example of stakeholders’ interests conflicting with liberalization of the European ATM. Baumgartner and Finger (2014) point out that full implementation of SES is hindered by the significant number of actors with divergent interests taking part in the reforms. They suggest that military representatives want to maintain non-restricted access to airspace, local ATC technology providers are threatened with disappearance from the market when the system is unified, governments’ interests lie in securing jobs within their ANSPs, and so on. The only two actors with a clear interest in the application of SES are the EC, and airspace users who pay the price for the system’s inefficiency. This is especially evident in the numerous letters and statements published by the airlines’ representatives to boost implementation of the program. EasyJet, a low-cost airline in the UK, called the EC to reset SES policy to ensure that progress is made and that investment funds are used for efficiency gains (EasyJet 2015). Similarly, action by the EC has been urged by Airlines for Europe (A4E 2019), which seeks further improvements to the system, rather than “wishful thinking” which will neither increase the efficiency of the airspace nor enable increasing numbers of passengers to benefit from cost-efficient services.
LACK OF COOPERATIONLike many other reforms proposed by Eurocontrol in the past, differing interests and priorities and lack of commitment
among aviation players are preventing the SES initiative from reaching its full potential (Grushka-Cockayne and Reyck 2009). Securing member states’ cooperation with the reforms in each of the problematic areas discussed above has been challenging. According to previous research, FABs’ implementation has been significantly delayed, and targets proposed by the Commission have not been met. Lack of reporting on the use of reserved airspace within FUA hampers efficient civil–military cooperation. With regard to cost statements, states failed to deliver the requested reports for some time before a change in the law finally resulted in their successful execution. It is difficult to make operational changes and feasible amendments if the results cannot be measured consistently through the provision of requested information. Introducing incentives for meeting performance objectives, or penalties for non-compliance with the requirements, might resolve some problems (Serafimowa 2019).
LENGTHY IMPLEMENTATION PROCESSAs previously mentioned, restructuring of the European ATM system is often criticized for being “painfully slow” (IATA n.d.).
Efforts to optimize civil–military cooperation started soon after the initiative’s implementation. However, steps towards easing the problem of fragmentation took a long time, with FABs’ expected implementation in 2012 being severely delayed, as previously mentioned. Steps to harmonize safety legislation only progressed after cooperation with EASA was strengthened, which took several years. It took 11 years for key gains in cost efficiency to be realized, associated with the determined cost charging scheme for en-route and terminal ANS. Lastly, the optimizations achieved through the performance scheme only began in 2014, a decade after SES implementation. It must be acknowledged that the desired results were not attained in RP1, nor are they predicted to be achieved by the end of 2019, except for the cost-efficiency KPI. It is therefore obvious that the process of changing the European ATM system and boosting its efficiency will be lengthy, and most desired improvements have been delayed.
RECOMMENDATIONSAs a result of this assessment of progress with and problems constraining the implementation of SES, the following
recommendations for its future operations are made. First, to boost dedication to unifying the ATM system, incentives to meet

J. Aerosp. Technol. Manag., São José dos Campos, v12, e3920, 2020
Single European Sky: The progress so Far 15
the program’s objectives, as well as penalties for lack of cooperation, should be implemented. Button (2019) as cited in Finger and Serafimova (2019) pointed out at the 10th Florence Air Forum that the problems with FABs are indicative of the lack of incentives. Moreover, he indicated that FABs had not been fully implemented because, in economic terms, there was no incentive to adopt them or penalty for not doing so. Penalising ANSPs for not delivering optimal capacity was a solution also proposed by IATA (2018) in response to a growth in summer delays of over 130 percent compared with 2017. Moreover, Finger and Serafimova (2019) indicate that the financing and incentives (or conversely, penalties) must be performance- ad objective-based, with firm commitment from the Member States to make appropriate investments.
Furthermore, the method of calculating en-route charges requires amendment so as not to encourage the use of small aircraft and schedule of flights at peak times. Button (2019) as cited in Finger and Serafimova (2019) indicated information about changing conditions are missing in the process and suggested that appropriate signalling mechanism must be included in SES. Thus, pricing mechanisms and associated incentives must be used to guide prioritisation and stimulate efficiency. Ideally, a common en-route charging rate should be introduced at the European level to improve flight efficiency by limiting route extensions caused by overflying “cheaper” states. Lastly, in order to reap common benefits from accommodating higher traffic, all stakeholders should be encouraged to work toward more efficient European airspace. Moreover, enhanced coordination in information exchange is paramount to implement the SES vision.
In addition, the balance between the various KPIs addressed by the Commission in the performance scheme should be revised. Focusing on cost reductions may threaten the safety and capacity of the system and should be avoided.
CONCLUSIONS
The European ATM is currently in a challenging position, as inefficiency and fragmentation in the system need to be tackled in order to cope with continued growth in air traffic. This paper has examined the progress of and problems faced by SES, an initiative launched by the EC to reform problematic aspects of European airspace. Through analysis of reports and documents issued by the program’s stakeholders and independent academic researchers, an overview has been presented of progress in key problematic areas.
Most importantly, the urgent need to defragment the European ATM system was addressed through the implementation of FABs, but these have not brought about the desired results. The long and delayed process of FABs’ application, as well as different technical developments between blocks, and even between countries within a single block, leads to the conclusion that the initiative has not provided united airspace based on operational needs.
Flight inefficiency has not been resolved to the extent targeted by the Commission in its performance scheme. Route extensions are still higher than targeted, creating harmful environmental impacts and financial losses. Amongst the reasons for continued inefficiency is lack of a common charging rate for ATS, non-optimal unification of civil and military traffic, and industrial action affecting capacity. However, the FRA concept has been proven to deliver greater efficiency and capacity, reducing route extensions and thereby lowering CO2 emissions.
Efficient segregation of airspace within the FUA concept has been adversely affected by failure to report on actual usage of segregated airspace as required. States’ lack of cooperation constrains the benefits to be gained from the concept. Moreover, it is predicted that the performance scheme’s desired reduction in delays will not be achieved. Insufficient capacity planning and, once again, industrial actions are among the factors hindering efficiency.
Some progress has been made in the improvement of productivity of ANPSs. The analysis of data has revealed that unit costs decreased by 13% through the RP1 (2009 - 2014). However, the current charging system has been criticized for continuing to cause flight inefficiency.
The full potential of civil-military cooperation has not been achieved which is indicative of the lack of cooperation between states, the failure of some states to comply with Eurocontrol’s request to provide consistent and useful data.

J. Aerosp. Technol. Manag., São José dos Campos, v12, e3920, 2020
Motyka A, Njoya ET16
Another KPI in the performance scheme is the reduction of ATFM delays. The target of reducing the average ATFM en-route delay per flight to 0.5 minutes was not reached during PR1, and is not predicted to be met during PR2.
Furthermore, in the area of safety, the legislation has been harmonized, and reporting of occurrences has improved. Monitoring of and encouragement for the application of JC and setting binding targets on occurrence reporting using the RAT, as well as monitoring of EoSM have enabled improved safety analysis. Nevertheless, further progress is needed, as only a minority of countries is working fully to JC objectives, and the level of RAT usage and EoSM was still below RP2 targets in 2017.
Analysis of planned technological improvements shows the significant potential of SESAR solutions to optimize European airspace. However, progress in applying these technologies has been delayed, hindering realisation of their full potential benefits.
Lastly, the overall process of reforming European airspace within SES has been slow and delayed. This has been partly affected by a lack of cooperation and commitment from ANSPs and states to deliver the information needed and apply desired amendments. It has been noted that the program’s various stakeholders have different interests and priorities, which also result in lack of cooperation.
AUTHOR’S CONTRIBUTION
Conceptualization: Motyka, A.; Methodology: Motyka, A.; Investigation: Motyka, A. and Njoya, ET; Writing – Original Draft: Motyka, A.; Writing – Review & Editing: Njoya, ET and Motyka, A.; Resources: Motyka, A. and Njoya, ET; Supervision: Njoya, ET.
ACKNOWLEGMENT
The authors would like to express their appreciation to the editor and two anonymous reviewers for their valuable comments. We also thank Dr Ane Ripoll-Zarraga and participants in the July 2019 GARS Workshop in Amsterdam, for comments and suggestions.
Editors and authors are thankful to Fundação Conrado Wessel for providing the financial support for publishing this article.
REFERENCES
Adler N, Hanany E, Proost S. (2018) Introducing Competition through Auctions in the Air Traffic Control Market. Paper presented at: 8th SESAR Innovation days, 3rd – 7th December. University of Salzburg, Salzburg, Austria.
Adler N, Hanany E, Proost S (2014) Managing European air traffic control provision. 4th SESAR Innovation Days, 25th –27th November. Universidad Politécnica de Madrid, Madrid, Spain.
Airlines for Europe (A4E) (2019) A Call for the Future of Air Travel in Europe. Brussels. [updated: 2020 30 March; accessed: 2020 1 June] https://a4e.eu/publications/a4e-urges-eu-to-make-aviation-a-future-political-priority/
Arblaster M (2018) Air Traffic Management: Economics, Regulation and Governance. Amsterdam, Netherlands; Oxford, UK; Cambridge, MA, USA: Elsevier.
ATCEUC, ETF, IFAIMA, IFATCA, IFATSEA (2019) Open letter to EU member states. 26 November 2018 [accessed: 2020 1 June]. http://www.atceuc.org/uploads/docs/20181125-joint-letter-to-eu-member-states.pdf
Baumgartner M, Finger M (2014) The single European sky gridlock: A difficult 10-year reform process. Utilities Policy, 31: 289-301. https://doi.org/10.1016/j.jup.2014.03.004
Button K, Neiva R (2013) Spatial autocorrelation in the European air navigation system. Applied Economics Letters 20(15): 1431-1434. https://doi.org/10.1080/13504851.2013.815308
Button K, Neiva R (2014) Economic efficiency of European air traffic control systems. Journal of Transport Economics and Policy (JTEP) 48(1): 65-80.
CAPA- Centre for Aviation (2012). Europe to take a third attempt at sorting out the Single European Sky. Sydney. 2012 26 October

J. Aerosp. Technol. Manag., São José dos Campos, v12, e3920, 2020
Single European Sky: The progress so Far 17
[accessed: 2019 10 September]. https://centreforaviation.com/analysis/reports/europe-to-take-a-third-attempt-at-sorting-out-the-single-european-sky-86383.
Commission of the European Communities (1996). Air Traffic Management- Freeing Europe s airspace. (COM(96) 57 final). Brussels. [accessed: 2019 15 June]http://aei.pitt.edu/1134/1/air_traffic_white_paper_COM_96_57.pdf
Commission of the European Communities (1999). Communication from the Commission to the Council and the European Parliament: The creation of the single European sky. (COM (1999) 614 final/2). Brussels. [accessed: 2019 07 March]https://eur-lex.europa.eu/legal-content/EN/TXT/PDF/?uri=CELEX:51999DC0614&from=EN
Cook A (2007). European air traffic management: Principles, practice and research. Aldershot, England; Burlington, Vt., USA: Ashgate Pub.
Dempsey-Brench Z, Volta N (2018) A cost-efficiency analysis of European air navigation service providers. Transportation Research Part A: Policy and Practice 111:11-23. http://dx.doi.org/10.1016/j.tra.2018.02.019
EASA- European Aviation Safety Agency. (2008). EASA set to play key role in the Single European Sky. [accessed: 2019 07 March]. https://www.easa.europa.eu/newsroom-and-events/press-releases/easa-set-play-key-role-single-european-sky
easyJet. (2015). easyJet response to the European Commission consultation on the aviation package for improving the competitiveness of the EU aviation sector. [accessed: March 05, 2019] http://corporate.easyjet.com/~/media/Files/E/Easyjet/pdf/about-easyjet/easyjet-response-to-consultation-on-aviation-package.pdf
eATM Portal. (2016). FAB View: FAB analysis is performed in two waves, first assessing the major FAB initiatives and developments per SESAR Key Feature, and second, assessing the performance benefits this FAB approach brings to stakeholders. [accessed: March 07, 2019] from https://www.atmmasterplan.eu/depl/fabs
eATM Portal. (2018). Overall Master Plan Level 3 Implementation Progress. [accessed: March 07, 2019]. https://www.atmmasterplan.eu/exec/overview/essip-implementation-progress
Efthymiou M, Papatheodorou A (2018) Environmental considerations in the single European sky: A Delphi approach. Transportation Research Part A 118: 556-566. https://doi.org/10.1016/j.tra.2018.09.024
Efthymiou M, Njoya ET, Lo PL, Papatheodorou A, Randall D (2019) The Impact of Delays on Customers’ Satisfaction: an Empirical Analysis of the British Airways On-Time Performance at Heathrow Airport. Journal of Aerospace Technology and Management 11. https://doi.org/10.5028/jatm.v11.977
Eurocontrol (2015) ANS performance monitoring (EU wide level, 2014). [accessed: March 08, 2019] https://www.eurocontrol.int/prudata/dashboard/vis/eur_view_2014/
Eurocontrol (2017) Reporting Period 2 - 2017 dashboard - Single European Sky Portal. c January- December 2017 [accessed: September 14, 2019]. https://www.eurocontrol.int/prudata/dashboard/vis/2017/
Eurocontrol (2015) Risk Analysis Tool- RAT: Guidance Material. [accessed: September 15, 2019]. https://skybrary.aero/bookshelf/books/3276.pdf
Eurocontrol (2018) NETWORK OPERATIONS REPORT 2017. [accessed: September 12, 2019]. https://www.eurocontrol.int/sites/default/files/publication/files/nm-annual-network-operations-report-2017-main-report-for-consultation.pdf
Eurocontrol (2018a) Seven-Year Forecast February 2018- Flight Movements and Service Units 2018 - 2024. [accessed: September 12, 2019] https://www.eurocontrol.int/sites/default/files/content/documents/official-documents/forecasts/seven-year-flights-service-units-forecast-2018-2024-Feb2018.pdf
Eurocontrol (n.d.) Functional Airspace Block (FAB) [accessed: September 15, 2019] https://www.eurocontrol.int/articles/functional-airspace-block-fab
Eurocontrol (2019a) All-causes delay to air transport in Europe for July 2019. August 26, 2019. [accessed: September 14, 2019] https://www.eurocontrol.int/publication/all-causes-delay-air-transport-europe-july-2019
Eurocontrol (2019b) Free route airspace: giving users the freedom to plan a route in Europe’s airspace. Brussels [accessed: September 14, 2019] https://www.eurocontrol.int/concept/free-route-airspace
Eurocontrol (2019c) Monthly Network Operations Report: Overview – January 2019 – February 21, 2019. Brussels [accessed: September 14, 2019] https://www.eurocontrol.int/sites/default/files/publication/files/nm-monthly-network-operations-report-overview-january-2019.pdf.
Eurocontrol (2019d) Network Operations Report – December 2018. 14 December 2018. Brussels [accessed: 2019 7 September] https://www.eurocontrol.int/publications/network-operations-report-december-2018.
Eurocontrol (2019e) Network Operations Report – February 2019. 15 March 2019. Brussels [accessed: 2019 5 September]. https://www.eurocontrol.int/publications/network-operations-report-february-2019
Eurocontrol (2019f) Reporting Period 2 - 2019 dashboard. Brussels [accessed: September 05, 2019]. https://www.eurocontrol.int/prudata/dashboard/vis/2019/

J. Aerosp. Technol. Manag., São José dos Campos, v12, e3920, 2020
Motyka A, Njoya ET18
European Aviation Safety Agency - EASA (2014). Annex to ED Decision 2014/035/R: Acceptable Means of Compliance and Guidance Material for the implementation and measurement of Safety (Key) Performance Indicators (S(KP)Is) (ATM performance IR). December 16, 2014. [accessed: June 23, 2019] https://www.easa.europa.eu/sites/default/files/dfu/Annex%20to%20ED%20Decision%202014-035-R.pdf#SKPI.
European Commission – EC (2011) Study of the Terminal Charges for Air Traffic Control Services. Commission of the European Communities. March 2001. [accessed: March 07, 2019] https://ec.europa.eu/transport/sites/transport/files/modes/air/studies/doc/traffic_management/2001_03_charges_final_report_en.pdf
European Commission - EC (2004). REGULATION (EC) No 551/2004 OF THE EUROPEAN PARLIAMENT AND OF THE COUNCIL of 10 March 2004 on the organisation and use of the airspace in the single European sky. November 14, 2009. [accessed: March 20, 2019]. https://eur-lex.europa.eu/LexUriServ/LexUriServ.do?uri=CONSLEG:2004R0551:20091204:EN:PDF
European Commission - EC (2005) COMMISSION REGULATION (EC) No 2096/2005 of 20 December 2005 laying down common requirements for the provision of air navigation services. December 21, 2005. Brussels. [accessed: March 11, 2019] https://www.skybrary.aero/bookshelf/books/3864.pdf
European Commission - EC (2005). COMMISSION REGULATION (EC) No 2150/2005 of 23 December 2005 laying down common rules for the flexible use of airspace. December 23, 2005. Brussels. [accessed: May 15, 2019]https://eur-lex.europa.eu/legal-content/EN/TXT/PDF/?uri=CELEX:32005R2150&from=EN
European Commission (EC) (2006). COMMISSION REGULATION (EC) No 1794/2006 of 6 December 2006 laying down a common charging scheme for air navigation services. December 06, 2006. Brussels. [accessed: March 04, 2019]https://eur-lex.europa.eu/legal-content/EN/TXT/PDF/?uri=CELEX:32006R1794
European Commission (EC) (2010). COMMISSION REGULATION (EU) No 691/2010 of 29 July 2010 laying down a performance scheme for air navigation services and network functions and amending Regulation (EC) No 2096/2005 laying down common requirements for the provision of air navigation services. July 29, 2010. Brussels [accessed: February 10, 2019]. https://eur-lex.europa.eu/LexUriServ/LexUriServ.do?uri=OJ:L:2010:201:0001:0022:EN:PDF
European Commission (EC) (2010). REGULATION (EC) No 1070/2009 OF THE EUROPEAN PARLIAMENT AND OF THE COUNCIL of 21 October 2009 amending Regulations (EC) No 549/2004, (EC) No 550/2004, (EC) No 551/2004 and (EC) No 552/2004 in order to improve the performance and sustainability of the European aviation system. November 14, 2009. Brussels [accessed: September 07, 2019]. https://eur-lex.europa.eu/LexUriServ/LexUriServ.do?uri=OJ:L:2009:300:0034:0050:en:PDF
European Commission (EC) (2013). COMMISSION IMPLEMENTING REGULATION (EU) No 391/2013 of 3 May 2013 laying down a common charging scheme for air navigation services. May 03, 2013.Brussels [accessed: March 10, 2019]. https://eur-lex.europa.eu/legal-content/EN/TXT/PDF/?uri=CELEX:32013R0391&from=DE
European Commission EC (2013). Transport: Commission urges Italy, Cyprus and Greece to implement EU rules to unblock congestion in Europe’s airspace. September 26, 2013. Brussels [accessed: June 15, 2019]. http://europa.eu/rapid/press-release_IP-13-860_en.htm
European Commission EC (2014a) Single European Sky: Commission urges eighteen Member States to make a decisive move towards common airspace management. July 10, 2014. Brussels [accessed: March 07, 2019]http://europa.eu/rapid/press-release_IP-14-818_en.htm
European Commission - EC(2014b). Single European Sky: Commission urges Germany, Belgium, France, the Netherlands, and Luxembourg to make a decisive move towards a common airspace. April 16, 2014. Brussels [accessed: September 10, 2019] http://europa.eu/rapid/press-release_IP-14-446_en.htm
European Commission (2015) Policy options for the modulation of charges in the Single European Sky. Final report prepared for European Commission. April 2015. London [accessed: September 10, 2019]. https://ec.europa.eu/transport/sites/transport/files/modes/air/studies/doc/ses/2015-04-policy-options-modulation-charges-in-ses.pdf
European Court of Auditors - ECA (2017) Single European Sky: a changed culture but not a single sky. October 11, 2017. Luxembourg [accessed: March 07, 2019] http://publications.europa.eu/webpub/eca/special-reports/single-european-sky-18-2017/en/
Finger M, Serafimova T(2019) European transport regulation observer: single European sky: the way forward. Policy Briefs 2019/02. http://doi.org/10.2870/425159
Fox S (2016) Single European Skies: Functional Airspace Blocks – Delays and Responses. Air and Space Law 41(3): 201–227.
Functional Airspace Block Europe Central (FABEC). (n.d.). ATM in Europe - It’s all about performance. https://www.fabec.eu/images/user-pics/pdf-downloads/FABEC_All_about_Performance_1.pdf
Grushka-Cockayne Y. De Reyck B (2009) Towards a Single European Sky. INFORMS Journal on Applied Analytics 39(5): 400-414. http://doi.org/10.1287/inte.1090.0436
IFATCA (2015) IFATCA View on Just Culture and possible way forward. October 2015. [accessed: February 16, 2019]. https://www.entrypointnorth.com/wp-content/uploads/sites/3/Zeljko-Oreski-IFATCA-view-on-Just-Culture.pdf

J. Aerosp. Technol. Manag., São José dos Campos, v12, e3920, 2020
Single European Sky: The progress so Far 19
IATA (2013) A Blueprint for the Single European Sky Delivering on safety, environment, capacity and cost-effectiveness. February 2013. [accessed: February 16, 2019]. https://www.iata.org/contentassets/f13b0314d16242b6b747a4fb10b2076d/blueprint-single-european-sky.pdf
International Civil Aviation Organization – ICAO (1994), Convention on Civil Aviation (“Chicago Convention”). December 07,1944.15 U.N.T.S. 295. [February 19, 2019]: https://www.refworld.org/docid/3ddca0dd4.html
Kovacova M, Balint J (2017) Single european sky vision: Increase capacity 3 times, reduction of ATM cost by half and ensuring improvement of safety by 10 times – how to satisfy this goal in safety area? Transportation Research Procedia 28: 89-98. https://doi.org/10.1016/j.trpro.2017.12.172
Lawless C (2013) Bounding the vision of a Single European Sky. The Geographical Journal, 180(1): 76-82.
Mihetec T, Odic D, Steiner S (2011) Evaluation of Night Route Network on Flight Efficiency in Europe. International Journal for Traffic and Transport Engineering 1(3): 132 – 141.
Nava Gaxiola C, Barrado C, Royo P, Pastor E. (2018) Assessment of the north European free route airspace deployment. Journal of Air Transport Management 73: 113-119. https://doi.org/10.1016/j.jairtraman.2018.08.008
Nava-Gaxiola C, Barrado C (2016) Free route airspace and the need of new air traffic control tools. Paper presented at: 2016 IEEE/AIAA 35th Digital Avionics Systems Conference (DASC). Sacramento, CA, USA. https://doi.org/10.1109/DASC.2016.7777946
Oster CV, Strong JS (2007) Managing the skies: Public policy, organization and financing of air traffic management. Aldershot, England: Ashgate.
Pavlova S, Zadorozhnia A (2014) Analysis of free route airspace and performance-based navigation implementation in the european air navigation system. Vìsnik Nacìonal’nogo Avìacìjnogo Unìversitetu 61(4): 28-35.
Performance Review Body of the Single European Sky (PRB) (2013). PRB advice to the Commission in the setting of Union-wide performance targets for RP2. September 27, 2013. Brussels [accessed: March 19, 2019]https://ec.europa.eu/transport/sites/transport/files/ses-performance-library/PRB%20Advice%20in%20the%20setting%20of%20Union-wide%20performance%20targets%20for%20RP2.pdf
Performance Review Body of the Single European Sky – PRB (2016) PRB Annual Monitoring Report 2015 – Volume 1. December 20, 2016. Brussels [accessed: February 16, 2019]. https://ec.europa.eu/transport/sites/transport/files/prb_annual_monitoring_report_2015_vol_1_european_overview.pdf
Performance Review Body of the Single European Sky – PRB (2017). PRB Annual Monitoring Report 2016 Volume 1: European Overview. October 09, 2017. Brussels [accessed: February 16, 2019] https://webgate.ec.europa.eu/eusinglesky/node_en
Performance Review Body of the Single European Sky – PRB (2018). PRB Advice to the Commission in the setting of Union-wide performance targets for RP3. September 30, 2018. Brussels [accessed: February 16, 2019]. https://ec.europa.eu/transport/sites/transport/files/2018-prb-advice.pdf
Performance Review Commission (2002, 2004, 2007- 2017). PRR 5- An Assessment of Air Traffic Management in Europe during the Calendar Year: 2001, 2005, 2006- 2018.
PricewaterhouseCoopers LLP - PWC (2016) Economic Impact of Air Traffic Control Strikes in Europe Prepared for A4E Airlines for Europe. September 2016 [accessed: February 16, 2019]. http://www.politico.eu/wp-content/uploads/2016/10/ATCimpactreportA4E.pdf
Prospect, ETF & ATCEUC. (2017). Efficiency, capacity and growth in European aviation: Why industrial action in ATM is not the issue. [accessed: September 03, 2019]. https://www.sncta.fr/?wpfb_dl=1093
Raffarin M (2003) Congestion in European Airspace: A Pricing Solution? Journal of Transport Economics and Policy 38(1):109 – 126.
Saunders M, Lewis P, Thornhill A (2007) Research methods for Business Students 4th edition. Harlow, England; New York, NY, USA: Pearson Education Limited.
Schubert FP (2000) The Creation of a Single European Sky: The Shrinking Concept of Sovereignty. 25 Annals Air & Space 239: 248-249.
Serafimowa T (2019) Single European Sky: the way forward- a summary of discussions. In 10th Florence Air Forum in Budapest. FSR – Florence School of Regulation. Feb 05, 2019. [accessed: February 28, 2019]. http://fsr.eui.eu/the-observer-single-european-sky-the-way-forward/
Single European Sky Performance (2018). Reporting Period 2 - 2017 dashboard. [accessed: February 16, 2019]. https://www.eurocontrol.int/prudata/dashboard/vis/2017/
SKYbrary (2017c) 4D Trajectory Concept. December 15, 2017. [accessed: May 07, 2019]. https://www.skybrary.aero/index.php/4D_Trajectory_Concept
SKYbrary (2017a) Risk Analysis Tool (RAT). August 04, 2017. [accessed: May 07, 2019] . https://www.skybrary.aero/index.php/Risk_Analysis_Tool_(RAT)
SKYbrary (2017b) Safety Management System. [accessed: May 09, 2019]. https://www.skybrary.aero/index.php/Safety_Management_System.

J. Aerosp. Technol. Manag., São José dos Campos, v12, e3920, 2020
Motyka A, Njoya ET20
Kovacova M, Balint J (2017) Single european sky vision: Increase capacity 3 times, reduction of ATM cost by half and ensuring improvement of safety by 10 times – how to satisfy this goal in safety area? Transportation Research Procedia 28: 89-98. https://doi.org/10.1016/j.trpro.2017.12.172
Veal AJ (2018) Research methods for leisure and tourism. 5th edition. Harlow, England: Pearson.
Waldinger P (2008) Future of Air Traffic Management: How to Overcome a Potential Capacity Wall. Paper presented at: 8th International Conference “RELIABILITY and STATISTICS in TRANSPORTATION and COMMUNICATION. RelStat’08, 15-18 October 2008, Riga, Latvia.