Embed Size (px)
Citation preview

Single- and Dual-Photon Absorptiometry Techniques for Bone Mineral Analysis
Linda M. Thorson and Heinz W. Wahner
Mayo Clinic and Mayo Foundation, Rochester, Minnesota
This article on bone mineral analysis is the third of the 1986 continuing education series. After reading this paper, the reader should be able to: 1) state the clinical indications for single- and dualphoton absorptiometry studies; 2) discuss the principles of the instruments, the procedures used with patients, and the results; and 3) identifiy and co"ect technical pitfalls that may occur during bone mineral studies.
The increasing awareness of bone mineral loss and bone fracture as a public health problem by the medical community and the public has stimulated interest in the measurement of bone mineral. Several new procedures for bone mineral measurements have emerged for clinical use, photon absorptiometry and computed tomography being the most prominent. Physicians and technical personnel alike in nuclear medicine are now confronted with introducing the new technology of single- and dual-photon absorptiometry (SPA and DPA). Technologists are expected to understand and manage the new techniques, often without having the opportunity for any formal training. The objectives of this article are to give a general review of the applications of bone mineral measurements, to facilitate understanding ofthe principles and concepts of SPA and DPA instruments, to review how to operate and perform clinical studies and how to calculate and assess results in patients, to review a comprehensive quality control program, and to describe some pitfalls in the performance and interpretation of these studies.
CLINICAL BACKGROUND
Bone mass increases during growing years and begins to decrease after the third decade oflife, first in the axial skelton (spine, hip) and later in the appendicular skeleton (extremities). Thus, the rate of age-related bone loss is different in various bones of the skeleton. In addition, bone mass decreases at a different rate in men than it does in women. As one ages, bones become more fragile and the risk of fractures increases. Age-related bone loss and associated fractures are most pronounced in white women and least in black men. Osteoporosis-related deficiency fractures most commonly occur in the spine, hip, and wrist.
Metabolic bone disorders, such as osteoporosis, accentuate age-related bone loss and further increase the risk of fracture
For reprints contact: Linda M. Thorson, Section of Diagnostic Nuclear Medicine, Mayo Clinic, 200 First St. SW, Rochester. MN 55905.
VOLUME 14, NUMBER 3, SEPTEMBER 1986
at an earlier age. Long-term steroid treatment and anticoagulant or anticonvulsant drug therapy are assoicated with bone loss and consequently with a higher risk of fracture. Smokers, heavy drinkers, and persons with a lactase enzyme deficiency are also included in the group at high risk for fracture.
In the appendicular skeleton, bone tissue consists of predominantly compact bone; in the axial skeleton, it is predominantly trabecular. Trabecular bone is more metabolically active, and bone loss generally is earlier and more pronounced. Therefore, deficiency fractures occur primarily in the axial skeleton (spine and hip).
A clinically useful test for bone mineral analysis should have proper selection of the measuring site on the basis of its trabecular and cortical bone composition; high precision and accuracy, with the ability to detect small bone-mineral changes; and a well-defined normal range that reflects a racial background. At this time, SPA and DPA, more than other techniques, come closest to fulfilling these ideal requirements.
Candidates for these studies are patients with proven or suspected osteoporosis, such as symptomatic patients with spontaneous or unexplained fractures, subjects in high-risk groups, and asymptomatic patients with suspected bone loss. The physician uses the measurements to quantitate the loss, estimate the risk of fracture, determine the rate of loss in longitudinal studies, and monitor the effect of treatment.
SINGLE-PHOTON ABSORPTIOMETRY (SPA)
SPA was first developed by Cameron and Sorenson in 1963 (1). This method can be applied only to appendicular bones. Sites that have been measured are small bones of the hand, jaw, tibia, femur, calcaneus, and forearms. Most commonly, several sites in the forearm are used for measurements. At the middle of the radius, there is - 5% trabecular bone; at the distal end, there is up to 60% trabecular bone. This difference should be considered in data interpretation. Commonly used sites for cortical bone are the middle of the radius and distal one-third. The site for predominantly trabecular bone is the distal end of the radius, where ulna and radius meet.
Instrument In a vertical C-frame, a collimated 1251 source (200 mCi
or 7.4 GBq) and a collimated Nal(Tl) scintillation detectorphotomultiplier tube are mounted in opposed geometry to allow a body site for measurement to be placed between the
163
by on April 18, 2018. For personal use only. tech.snmjournals.org Downloaded from
source and detector. The source and detector assembly are rigidly coupled and are motor-driven to traverse the longitudinal axis of the bone.
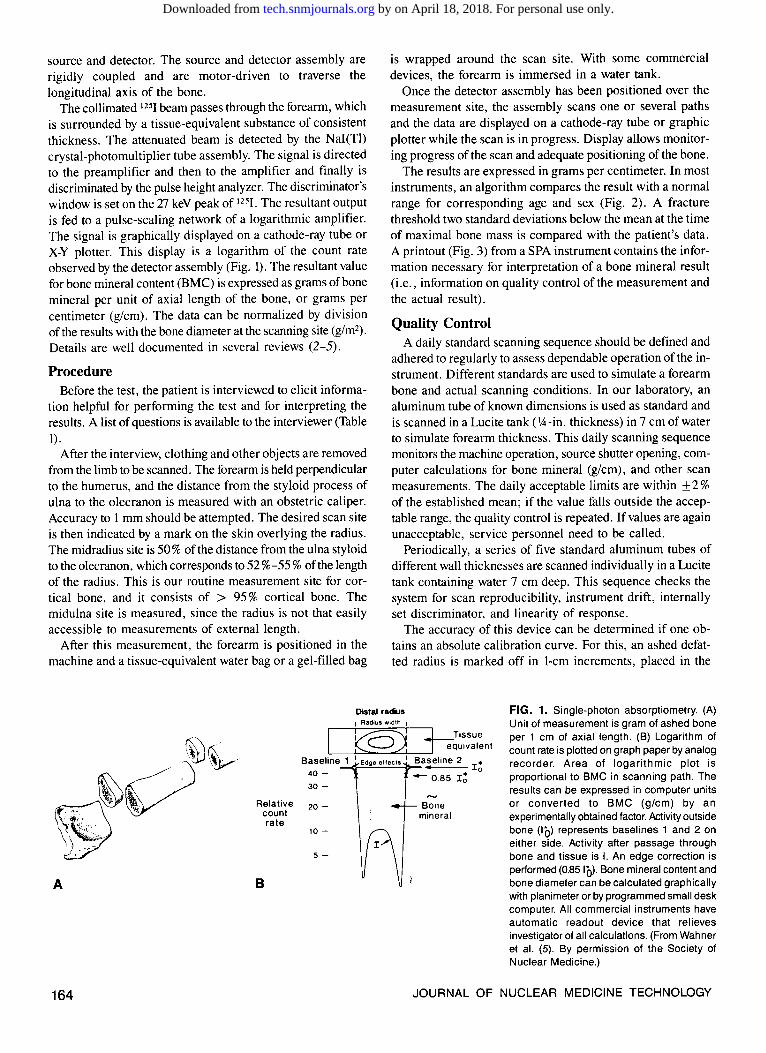
The collimated 125I beam passes through the forearm, which is surrounded by a tissue-equivalent substance of consistent thickness. The attenuated beam is detected by the Nai(Tl) crystal-photomultiplier tube assembly. The signal is directed to the preamplifier and then to the amplifier and finally is discriminated by the pulse height analyzer. The discriminator's window is set on the T7 keY peak of 1251. The resultant output is fed to a pulse-scaling network of a logarithmic amplifier. The signal is graphically displayed on a cathode-ray tube or X-Y plotter. This display is a logarithm of the count rate observed by the detector assembly (Fig. I). The resultant value for bone mineral content (BMC) is expressed as grams of bone mineral per unit of axial length of the bone, or grams per centimeter (g/cm). The data can be normalized by division of the results with the bone diameter at the scanning site (g/m2
).
Details are well documented in several reviews (2-5).
Procedure Before the test, the patient is interviewed to elicit informa
tion helpful for performing the test and for interpreting the results. A list of questions is available to the interviewer (Table 1) 0
After the interview, clothing and other objects are removed from the limb to be scanned. The forearm is held perpendicular to the humerus, and the distance from the styloid process of ulna to the olecranon is measured with an obstetric caliper. Accuracy to 1 mm should be attempted. The desired scan site is then indicated by a mark on the skin overlying the radius. The midradius site is 50% of the distance from the ulna styloid to the olecranon, which corresponds to 52%-55% ofthe length of the radius. This is our routine measurement site for cortical bone, and it consists of > 95% cortical bone. The midulna site is measured, since the radius is not that easily accessible to measurements of external length.
After this measurement, the forearm is positioned in the machine and a tissue-equivalent water bag or a gel-filled bag
is wrapped around the scan site. With some commercial devices, the forearm is immersed in a water tank.
Once the detector assembly has been positioned over the measurement site, the assembly scans one or several paths and the data are displayed on a cathode-ray tube or graphic plotter while the scan is in progress. Display allows monitoring progress of the scan and adequate positioning of the bone.
The results are expressed in grams per centimeter. In most instruments, an algorithm compares the result with a normal range for corresponding age and sex (Fig. 2). A fracture threshold two standard deviations below the mean at the time of maximal bone mass is compared with the patient's data. A printout (Fig. 3) from a SPA instrument contains the information necessary for interpretation of a bone mineral result (i.e., information on quality control of the measurement and the actual result).
Quality Control A daily standard scanning sequence should be defined and
adhered to regularly to assess dependable operation ofthe instrument. Different standards are used to simulate a forearm bone and actual scanning conditions. In our laboratory, an aluminum tube of known dimensions is used as standard and is scanned in a Lucite tank (lA-in. thickness) in 7 em of water to simulate forearm thickness. This daily scanning sequence monitors the machine operation, source shutter opening, computer calculations for bone mineral (g/cm), and other scan measurements. The daily acceptable limits are within ±2% of the established mean; if the value falls outside the acceptable range, the quality control is repeated. If values are again unacceptable, service personnel need to be called.
Periodically, a series of five standard aluminum tubes of different wall thicknesses are scanned individually in a Lucite tank containing water 7 em deep. This sequence checks the system for scan reproducibility, instrument drift, internally set discriminator, and linearity of response.
The accuracy of this device can be determined if one obtains an absolute calibration curve. For this, an ashed defatted radius is marked off in 1-cm increments, placed in the
Distal radius FIG. 1. Single-photon absorptiometry. (A) Unit of measurement is gram of ashed bone per 1 em of axial length. (B) Logarithm of count rate is plotted on graph paper by analog recorder. Area of logarithmic plot is proportional to BMC in scanning path. The results can be expressed in computer units or converted to BMC (g/cm) by an experimentally obtained factor. Activity outside bone (IQ) represents baselines 1 and 2 on either side. Activity after passage through bone and tissue is I. An edge correction is performed (0.85 I(J). Bone mineral content and bone diameter can be calculated graphically with planimeter or by programmed small desk computer. All commercial instruments have automatic readout device that relieves investigator of all calculations. (From Wahner et al. (5). By permission of the Society of Nuclear Medicine.)
'
'
A
164
~.v~~~~. ';>i;
.
-
Relative count rate
B
~ J..._Tissue
L--L~""'---"--"'--'-----~ equ1valent Baseline 1 I Edge ellects I Baseline 2 •
Io 40 - -0.85 I6 30-
20-
10-
5-
Bone mineral
JOURNAL OF NUCLEAR MEDICINE TECHNOLOGY
by on April 18, 2018. For personal use only. tech.snmjournals.org Downloaded from

A
B
Distal radius 1.4 ,...-----------....... 1.2
BMC, 1.0 g/cm .8
.6
.4~~~~~~~~~~
BMC, 0.50
g/cm2 0.40
0.30
Distal radius/width of distal radius
Mid radius
Mid radius/width of mid radius
m~~~~ro~oo m~~~~ro~oo
Age (years)
BMC - Distal radius
1.60
1.40
g/cm 1.20
1.00
.80
BMC - Distal radius/ width of distal radius
.80r------------,
.70
g/cm2 .60
.50
.40~-L~~~~~~~~~~-
1.60
1.40
1.20
1.00
.80
.70
.60
BMC - Mid radius
BMC - Mid radius/width of mid radius
L'"'"'"''•''''''"'"''•'•'''''"'''''''''
m~~~~ro~oo ~~~~~ro~oo
Age (years)
VOLUME 14, NUMBER 3, SEPTEMBER 1986
FIG. 2. Normal BMC at distal length of radius (25% trabecular bone) and at midradius ( > 95% cortical bone) in 105 healthy women (A) and 82 healthy men (8) of various ages. Data are from a cross-sectional study performed in our laboratory and are expressed as g/cm (BMC) and normalized (g/cm2). (From Wahner et al. (5). By permission of the Society of Nuclear Medicine.)
FIG. 3. Representative SPA printout of midradius (cortical bone) site. Five sets of data (listed on right) are averaged for final bone width and BMC values. Information on scan site and BMC formula constants are also listed.
165
by on April 18, 2018. For personal use only. tech.snmjournals.org Downloaded from
1.10
~ 1.00
~ ~ ..... 0.90 -.1::: -~ ~ y=0.09+0.034x
-.1::: 0.80 r= 0.92 (I)
"':
22 24 26 28 30 Calculated bone mineral (CU)
A
Bone Mass in grams 40-
36 -
30-
26 -
20-
16-
10-r = 0.99
0 0 2 4 8 8 10 12 14 18
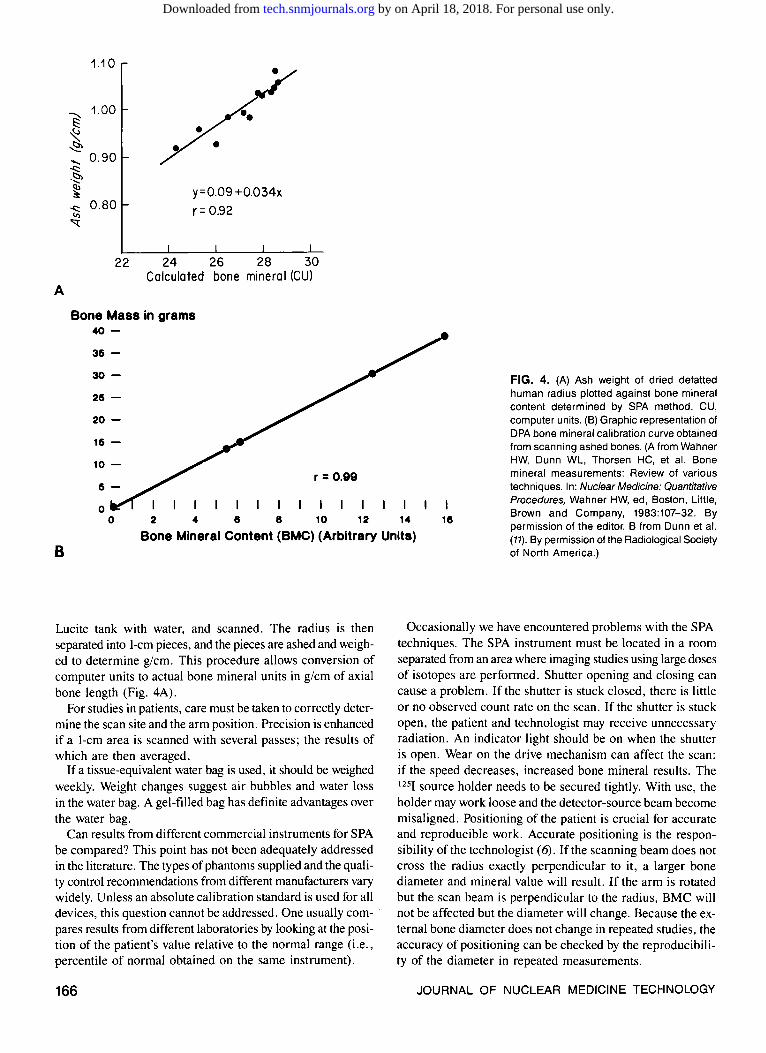
FIG. 4. (A) Ash weight of dried defatted human radius plotted against bone mineral content determined by SPA method. CU, computer units. (B) Graphic representation of DPA bone mineral calibration curve obtained from scanning ashed bones. (A from Wahner HW, Dunn WL, Thorsen HC, et al. Bone mineral measurements: Review of various techniques. In: Nuclear Medicine: Quantitative Procedures, Wahner HW, ed, Boston, Little, Brown and Company, 1983:107-32. By permission of the editor. B from Dunn et al. (11). By permission of the Radiological Society of North America.)
Bone Mineral Content (BMC) (Arbitrary Units) B
Lucite tank with water, and scanned. The radius is then separated into 1-cm pieces, and the pieces are ashed and weighed to determine g/cm. This procedure allows conversion of computer units to actual bone mineral units in g/cm of axial bone length (Fig. 4A).
For studies in patients, care must be taken to correctly determine the scan site and the arm position. Precision is enhanced if a 1-cm area is scanned with several passes; the results of which are then averaged.
If a tissue-equivalent water bag is used, it should be weighed weekly. Weight changes suggest air bubbles and water loss in the water bag. A gel-filled bag has definite advantages over the water bag.
Can results from different commercial instruments for SPA be compared? This point has not been adequately addressed in the literature. The types of phantoms supplied and the quality control recommendations from different manufacturers vary widely. Unless an absolute calibration standard is used for all devices, this question cannot be addressed. One usually compares results from different laboratories by looking at the position of the patient's value relative to the normal range (i.e., percentile of normal obtained on the same instrument).
166
Occasionally we have encountered problems with the SPA techniques. The SPA instrument must be located in a room separated from an area where imaging studies using large doses of isotopes are performed. Shutter opening and closing can cause a problem. If the shutter is stuck closed, there is little or no observed count rate on the scan. If the shutter is stuck open, the patient and technologist may receive unnecessary radiation. An indicator light should be on when the shutter is open. Wear on the drive mechanism can affect the scan: if the speed decreases, increased bone mineral results. The 1251 source holder needs to be secured tightly. With use, the holder may work loose and the detector-source beam become misaligned. Positioning of the patient is crucial for accurate and reproducible work. Accurate positioning is the responsibility of the technologist ( 6). If the scanning beam does not cross the radius exactly perpendicular to it, a larger bone diameter and mineral value will result. If the arm is rotated but the scan beam is perpendicular to the radius, BMC will not be affected but the diameter will change. Because the external bone diameter does not change in repeated studies, the accuracy of positioning can be checked by the reproducibility of the diameter in repeated measurements.
JOURNAL OF NUCLEAR MEDICINE TECHNOLOGY
by on April 18, 2018. For personal use only. tech.snmjournals.org Downloaded from

Most commercially available SPA devices have a good record for ease of operation and relatively trouble-free operation.
DUAL-PHOO'ON ABSORPTIOMETRY (DPA)
This technique was developed simultaneously by investigators in Europe and the United States to overcome the limitations of SPA in trabecular bone measurements ( 7-10). The method permits bone mineral measurements of the axial skelton, particularly the spine and hips. DPA methodology allows for evaluation of predominantly trabecular bone sites and major fracture sites.
These measurements are based on the use of two photon energies from a gadolinium-153 (1 53Gd) source (44 and 100 keY) transmitted through a two-component system consisting of bone and soft tissue. The changes in dual-beam intensities are recorded by a scintillation detector and computer system. The specifics of the DPA principle have been previously described in detail (3-5, 11).
Instrument The typical DPA system consists of a whole-body table, a
collimated 1-1.5 Ci (55.5 GBq) 153Gd source, and a collimated Nai(Tl) detector assembly. Like SPA systems, source and detector assembly are mounted in opposed geometry. The system is connected to a computer by means of an interface.
The 153Gd energy spectrum consists of photoelectric peaks in Nai(Tl) of 44 and 100 keY (europium K x-rays, 42 and 48 keY; gamma rays, fJ7 and 103 keY). Gadolinium-153 half-life is 242 days.
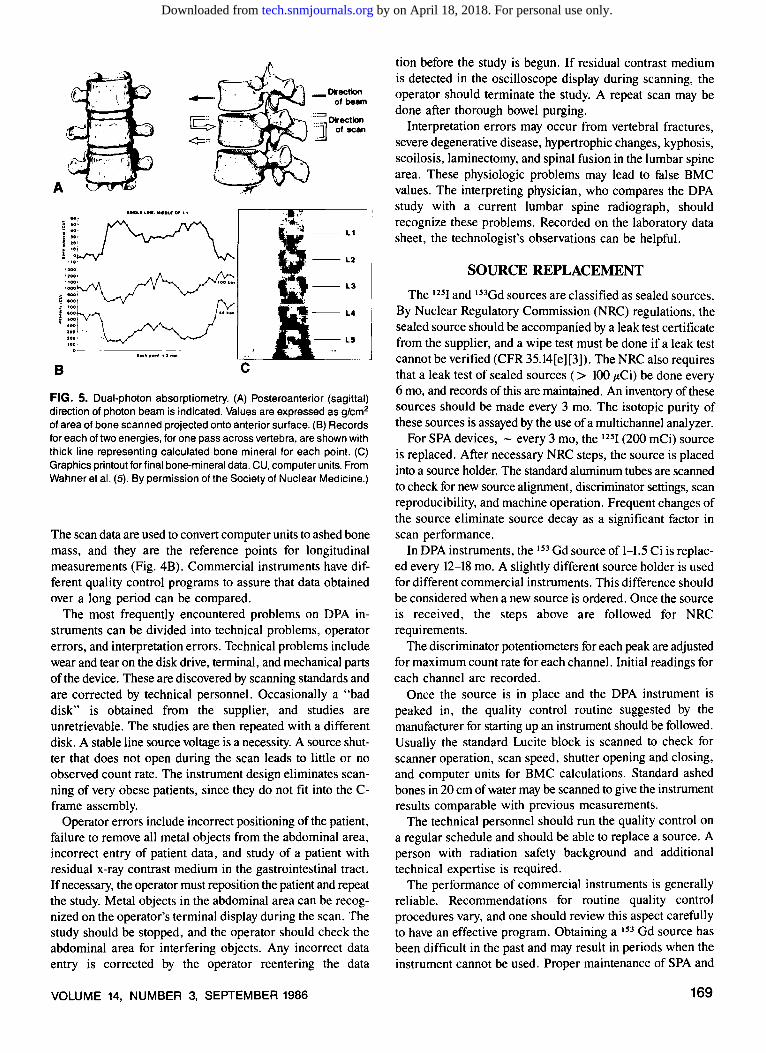
The absorbed radiation beam is detected by a Nai(Tl) scintillator detector as the scanner moves over the designated scan site (for example, lumbar spine) (Fig. 5). The detector output is amplified and discriminated by a pulse height analyzer for the 44 and 100 keY peaks. The analyzer output passes through a digital counter that accumulates detected photons for a set time interval (depending on equipment program design, either 0.5 sec or 1.0 sec). The total number of counts occurring in
each interval is stored in computer memory and on diskette. The source shutter is computer-controlled. A computer con
trols scan motion by directing two high-precision step motors in transverse and longitudinal directions. Potentiometers are mechanically linked to both motors and provide positional X andY data. The step between scan lines for most DPA devices is 4.5 mm, and the speed varies from 1.2 to 2.5 mm/sec in different instruments.
As a scan begins, point-by-point counts are stored and corrections are made for dead time, crossover from the 100 keY peak into the 44 keY channel of - 5%, and background radiation.
The computer generates an image of the spine scan on a cathode-ray tube display or graphics plotter. The operator is able to regulate the area scanned and observe the scan area during acquisition. A printer provides a hard copy of the image data output and calculations. The resulting image is used to define individual vertebrae. Calculations for bone mineral in the L-2 to L-4 region are done. Measurements of the L-1, a common site of vertibral fractures, and the L-5 region, overlapped by the iliac crest, should not be included in the bone mineral calculations.
DPA can be performed on the hip, the lumbar spine area, or the entire skelton (total body calcium). The routine scan on the spine, which is the only technique described in detail, is usually performed from L-1 to L-5. The region of interest (ROI) from L-2 to L-4 is then selected. The patient must be able to lie still for 30-45 min during the scan.
Procedure Before the scan, the patients are asked the questions in Table
2. The answers are recorded on a worksheet and should be available for final scan interpretation. Age, height, weight, and sex are also entered.
After being asked to remove all metal objects from the abdomen and pelvis area, the patient is positioned to lie supine on an imaging table. Some commercial devices require the lumbar spine area to be centered over a Lucite window in the
TABLE 1. Questions for Patients Undergoing Single-Photon Absorptiometry of the Radius
Question
1. Are you right-handed or left-handed?
2. Have you ever had any fracture of the wrist or forearm?
3. Has your arm been immobilized within the past 6 mo?
4. Are you taking steroids, estrogen, fluoride, vitamin D, or calcium?
Action by Technologist
Scan the nondominant arm unless the special reasons noted below preclude scanning this site.
If the answer is yes, note the side. Do not scan the site of the fracture.
If the answer is yes, note the side. Do not scan the site of the immobilization.
Note the medication and the length of time it has been taken.
VOLUME 14, NUMBER 3, SEPTEMBER 1986
Result on Scan
Because of activity, such as tennis playing, the dominant arm may have a high bone mineral content that does not reflect the overall bone status.
Site reflects bone repair but not skeletal mineralization.
Localized bone loss occurs with inactivity of the limb.
These drugs are known to affect bone mineral content.
167
by on April 18, 2018. For personal use only. tech.snmjournals.org Downloaded from

top of the table. The legs are elevated by a foam block to flatten the lumbar spine and thus to separate the vertebrae. Scan time is 20-40 min, depending on the device used. The scan area is from L-5 to the L-1 to T-12 area.
While the scan progresses, the operator can observe the acquired curve and judge whether the positioning is optimal. Most devices use an automatic edge detection program with a manual override to correct for errors. In cases of very low bone mineral, some commercial devices cannot distinguish between soft tissue and bone interface because of a less than optimal edge detection program.
After completion of the scan, a hard copy is obtained and the operator designates L-2-L-4 vertebrae as the ROI. Calculations for BMC in g/cm2 are done by the computer. Before reporting the result, the physician compares the ROI with a recent lumbar spine radiograph. Any compression fractures are excluded from the ROI, since they may alter the true bone mineral values. Severe degenerative and hypertrophic changes and scoliosis also result in false bone mineral results. If previous studies were done on a patient, the ROis must be identical to assess good precision and test accuracy.
The final BMC is compared with a normal range adjusted for age and sex. The normal range for females and males (Fig. 6) must be obtained for a scan area routinely used, and race must be considered in scan interpretation. A normal range for white persons is not applicable to black or Asian persons. A fracture threshold two standard deviations below the 50th percentile for bone mineral at age 30 can be applied to all study data, regardless of sex or race.
The final report should include the patient's actual bone mineral value (g/cm2), the percentile position within the nor-
mal range, the relationship to the fracture threshold, and any pertinent information, such as radiography results, that will alter bone mineral results. An example of a commercial DPA printout is given in figure 7.
Quality Control A strict quality control program is necessary for bone
mineral devices to assess required accuracy and precision. Daily programs should include scanning a standardized
Lucite block containing a bone-simulating substance. Scanning the block checks detector system, shutter opening and closing, scanner speed and movement, edge detection program, and background levels. Data from an absolute standard, such as ashed bone, are used to convert computer units to grams of ashed weight. Daily checks of discriminator settings for each peak ( 44 and 100 keV) must be performed. The standard should measure within 3% of the mean values. If the values are outside this range, the quality control program must be repeated. If the values are still unacceptable, instrument failure should be suspected.
Weekly scanning can be performed on a standard ashed bone in a Lucite tank containing a water depth of 20 em. The ashed bone is of known mass, and scanner computer units are compared with previous scan results for accuracy and reproducibility. The results are usually within 3% of the previous calculated mean value.
In our laboratory, bone mineral instruments have 1 day devoted every 3 wk to scanning a series of five standard ashed bones for obtaining a standard curve. The ashed bones are weighed before scanning, and the weight is recorded. The ashed bones are placed into a Lucite tank containing 20 em of water.
TABLE 2. Questions for Patients Undergoing Dual-Photon Absorptiometry of the Spine or Hip
168
Question
1. Have you recently (within 3-5 days) taken any x-ray contrast medium orally?
2. Have you recently (within 3 days) had any radioactive studies with technetium-99m?
3. Do you have any metal objects in the area of the abdomen?
4. Have you ever had an operation on your lumbar spine?
5. Are you taking steroids, estrogen, fluoride, vitamin D, or calcium?
Action by Technologist
If the answer is yes, postpone the test and find out whether the physician wants to reschedule it after the patient has been thoroughly purged.
Reschedule or cancel the test. The longer the half-life of the isotope, the longer the delay.
If the answer is yes, cancel the study or consider a study of the radius. If the object is a pacemaker, determine its location.
Note this fact on the study sheet.
Note the medication and the length of time it has been taken.
Scan Interpretation
The scan is invalid.
The scan is invalid.
The scan is invalid.
Laminectomy, bone grafts, and deformities may result in false bone mineral values. The area should be excluded from study.
These drugs are known to affect bone mineral content.
JOURNAL OF NUCLEAR MEDICINE TECHNOLOGY
by on April 18, 2018. For personal use only. tech.snmjournals.org Downloaded from
A
1100• 100 , •• ..... :::~-~ :::; i ;::· i ==t :soo ~ . ....
B c
·-Direction of beam
:~= Direction j of scan
FIG. 5. Dual-photon absorptiometry. (A) Posteroanterior (sagittal) direction of photon beam is indicated. Values are expressed as g/cm2
of area of bone scanned projected onto anterior surface. (B) Records for each of two energies, for one pass across vertebra, are shown with thick line representing calculated bone mineral for each point (C) Graphics printout for final bone-mineral data. CU, computer units. From Wahner et aL (5). By permission of the Society of Nuclear Medicine.)
The scan data are used to convert computer units to ashed bone mass, and they are the reference points for longitudinal measurements (Fig. 4B). Commercial instruments have different quality control programs to assure that data obtained over a long period can be compared.
The most frequently encountered problems on DPA instruments can be divided into technical problems, operator errors, and interpretation errors. Technical problems include wear and tear on the disk drive, terminal, and mechanical parts of the device. These are discovered by scanning standards and are corrected by technical personnel. Occasionally a "bad disk" is obtained from the supplier, and studies are unretrievable. The studies are then repeated with a different disk. A stable line source voltage is a necessity. A source shutter that does not open during the scan leads to little or no observed count rate. The instrument design eliminates scanning of very obese patients, since they do not fit into the Cframe assembly.
Operator errors include incorrect positioning of the patient, failure to remove all metal objects from the abdominal area, incorrect entry of patient data, and study of a patient with residual x-ray contrast medium in the gastrointestinal tract. If necessary, the operator must reposition the patient and repeat the study. Metal objects in the abdominal area can be recognized on the operator's terminal display during the scan. The study should be stopped, and the operator should check the abdominal area for interfering objects. Any incorrect data entry is corrected by the operator reentering the data
VOLUME 14, NUMBER 3, SEPTEMBER 1986
tion before the study is begun. If residual contrast medium is detected in the oscilloscope display during scanning, the operator should terminate the study. A repeat scan may be done after thorough bowel purging.
Interpretation errors may occur from vertebral fractures, severe degenerative disease, hypertrophic changes, kyphosis, scoilosis, laminectomy, and spinal fusion in the lumbar spine area. These physiologic problems may lead to false BMC values. The interpreting physician, who compares the DPA study with a current lumbar spine radiograph, should recognize these problems. Recorded on the laboratory data sheet, the technologist's observations can be helpful.
SOURCE REPLACEMENT
The 1251 and 153Gd sources are classified as sealed sources. By Nuclear Regulatory Commission (NRC) regulations, the sealed source should be accompanied by a leak test certificate from the supplier, and a wipe test must be done if a leak test cannot be verified (CFR 35.14[e][3]). The NRC also requires that a leak test of sealed sources ( > 100 ~Ci) be done every 6 mo, and records of this are maintained. An inventory ofthese sources should be made every 3 mo. The isotopic purity of these sources is assayed by the use of a multichannel analyzer.
For SPA devices, - every 3 mo, the 1251 (200 mCi) source is replaced. After necessary NRC steps, the source is placed into a source holder. The standard aluminum tubes are scanned to check for new source alignment, discriminator settings, scan reproducibility, and machine operation. Frequent changes of the source eliminate source decay as a significant factor in scan performance.
In DPA instruments, the 153 Gd source of 1-1.5 Ci is replaced every 12-18 mo. A slightly different source holder is used for different commercial instruments. This difference should be considered when a new source is ordered. Once the source is received, the steps above are followed for NRC requirements.
The discriminator potentiometers for each peak are adjusted for maximum count rate for each channel. Initial readings for each channel are recorded.
Once the source is in place and the DPA instrument is peaked in, the quality control routine suggested by the manufacturer for starting up an instrument should be followed. Usually the standard Lucite block is scanned to check for scanner operation, scan speed, shutter opening and closing, and computer units for BMC calculations. Standard ashed bones in 20 em of water may be scanned to give the instrument results comparable with previous measurements.
The technical personnel should run the quality control on a regular schedule and should be able to replace a source. A person with radiation safety background and additional technical expertise is required.
The performance of commercial instruments is generally reliable. Recommendations for routine quality control procedures vary, and one should review this aspect carefully to have an effective program. Obtaining a 153 Gd source has been difficult in the past and may result in periods when the instrument cannot be used. Proper maintenance of SPA and
169
by on April 18, 2018. For personal use only. tech.snmjournals.org Downloaded from

1.50
1.25
g/cm 2
1.00
0.75
0.50
20 30
A
1.40
1.20
g/cm 2
B
.. : !' ,,
. , ... I' '•
., " : ... ...
A
170
1.00
0.80
0.60
20 30
._, ....... _;;,,w., ... __ ,;
···- 1\ .,;;_m,_ .. , '·::=~:·:.,.:,.=;,·,· .·:-: .. ;-:\\,_,, ........ :·:.: .. -:-.::.--.:.
........ ~, .. :1_0_ . ·::MI:.n .••• MO.:,;r.::.: • , ... _____ ,
\tl\0\ ___ ••
•\lOOOIU"tl_ ....... : ... -o::::::tnm.l-· •
·-··'·"-··· -~;.::.:_.._
•(:000--:0::. •: . :.oottMn.:: . __ , __ ,,.,, ,_,, __ ., __
. :•--u:t~M ·•••ooo: ..... :., .. -,,\ ,. ;·-.:-··--ll'>- ... '""''" ---·•::-:::.
"'''-''"-~-~ \\~-
.. ... ,_,_;::-. ....... , ,,·,,:-mu-:::MMm::
y = 1.618- 0.00937(x)
40 50 60 70 Age (years)
80
y = 1.340 - 0.00203(x)
40 50 60 70 Age (years)
80
95%
50%
5%
90
50%
5%
90
•. ~u '..,, ~ ~ ..
~-" " ' ..
B
FIG. 6. Normal BMC in L-2-L-4 region in 105 women (A) and 82 men (B) of various ages from a study performed in our laboratory. Data are expressed as g/cm2 .
FIG. 7. Commercial DPA printout. (A) Graphic printout of lumbar spine (from pelvis at top to L-1 at bottom) has edges (C) that are manually defined by investigator. (B) Histogram (open bar) designates area (L-2-L-4) used for BMC calculations . Information necessary for BMC calculations-quality control standard units, BMC, and bone mineral density (BMD), percentile BMD values adjusted for age and sex, and fracture risk-is printed below histogram.
JOURNAL OF NUCLEAR MEDICINE TECHNOLOGY
by on April 18, 2018. For personal use only. tech.snmjournals.org Downloaded from

DPA devices and a regularly performed quality control program assure that studies will be clinically relevant.
ACKNOWLEDGMENT
The authors wish to thank William L. Dunn, MS. and Mrs. Randi L. Fravert for their help in preparing this manuscript.
REFERENCES
I. Cameron JR. Sorenson JA. Measurement of bone mineral in vivo: An improved method. Science 1963;142:230-32.
2. Cameron JR. Mazess RB. Sorenson JA. Precision and accuracy of bone mineral determination by direct photon absorptiometry. bn·esr Radio/ 1968;3:141-50.
3. Smith DM, Johnston CC Jr. Yu P-L. In vivo measurement of bone mass: Its use in demineralized states such as osteoporosis. lAMA 1972:219:325-29.
4. Wahner HW, Dunn WL, Riggs BL. Noninvasive bone mineral measurements. Semin Nucl Med 1983;13:282-89.
VOLUME 14, NUMBER 3, SEPTEMBER 1986
5. Wahner HW. Dunn WL. Riggs BL. Assessment of bone mineral. Part 2. J Nucl Med 1984:25:1241-53.
6. Schlenker RA. Kotek TJ. Effect of arm orientation on bone mineral mass and bone width measured using the Cameron-Sorenson technique. Med
Phys 1979;6:105-09. 7. Reed GW. The assessment of bone mineralization from the relative
transmission of 241Am and 137Cs radiations (abstract). Phys Med Bioi
1966;11:174. 8. Roos B. Rosengren B. Skoldborn H. Determination if bone mineral
content in lumbar vertebrae by a double gamma-ray technique. In: Cameron JR. ed. Proceedings of Bone Measuremelll Conference. CONF-700515. United States Atomic Energy Commission. 1970:243-53.
9. Mazess RB. Ort M. Judy P. et al. Absorptiometric bone mineral determination using 153Gd. In: Cameron JR. ed, Proceedings of Bone Measurement Conference, CONF-700515. United States Atomic Energy Commission, 1970:308-12.
10. Wilson CR. Madsen M. Dichromatic absortiometry of vertebral bone mineral content. Im·est Rt1diol 1977; 12:180-84.
fl. Dunn WL, Wahner HW, Riggs BL. Measurement of bone mineral content in human vertebrae and hip by dual photon absorptiometry. Radiology
1980;136:485-87.
171
by on April 18, 2018. For personal use only. tech.snmjournals.org Downloaded from

1986;14:163-171.J. Nucl. Med. Technol. Linda M. Thorson and Heinz W. Wahner Single- and Dual-Photon Absorptiometry Techniques for Bone Mineral Analysis
http://tech.snmjournals.org/content/14/3/163This article and updated information are available at:
http://tech.snmjournals.org/site/subscriptions/online.xhtml
Information about subscriptions to JNMT can be found at:
http://tech.snmjournals.org/site/misc/permission.xhtmlInformation about reproducing figures, tables, or other portions of this article can be found online at:
(Print ISSN: 0091-4916, Online ISSN: 1535-5675)1850 Samuel Morse Drive, Reston, VA 20190.SNMMI | Society of Nuclear Medicine and Molecular Imaging
is published quarterly.Journal of Nuclear Medicine Technology
© Copyright 1986 SNMMI; all rights reserved.
by on April 18, 2018. For personal use only. tech.snmjournals.org Downloaded from