Embed Size (px)
Citation preview

SINGAPORE:TACKLING FUTURE MOBILITY
DEMAND
WAQAS CHEEMA
LKY CENTRE FOR INNOVATIVE CITIESSINGAPORE UNIVERSITY OF TECHNOLOGY AND DESIGN


The Journey• For the first 30 years, road and public transport systems
managed separately
• In 1995, Land Transport Authority as one major governing body
The White Paper (1996) identified 4 key strategies:1. Integrating transport and land use planning
2. Expanding the road network and maximizing its capacity
3. Managing demand for road usage
4. Providing quality public transport choices

‘..convinced that Singapore is well placed to create a world class system’
(Hasegawa et al, 1997) –
Independent International Audit Panel

Road Development• Over last 19 years, road network has been expanded by
about 16%
Singapore
Hong Kong
London
New York
Tokyo
0 2 4 6 8 10 12 14 16 18 20
Road density (km/sq. km)

Road Development• 1995 to 2010, rate of total vehicle population growth outstripped
growth of road development
Vehicle growth - 3% p.a. Road growth - 1% p.a.
Vehicles to Road length ratio
2002 2004 2006 2008 2010 2012 20140
50
100
150
200
250
300
Cars/km
Vehicles/km
Year
Veh
icle
s/km
(#)

Road Management
Maximize Capacity Regulate Vehicle Use

Intelligent Transport Systems
i-transport
EMAS
GLIDE
J-Eyes
TrafficScan
MyTransport.sg

i-Transport System
• Integrated and unified platform that centralizes the management of all Intelligent Transport Systems
• 24/7 ITS operating centre
• Includes:- Traffic signal control- Traffic monitoring- Incident management- Provision of real-time traffic advisory information

Expressway Monitoring and Advisory System (EMAS)
• Intelligent incident management tool that manages traffic along Expressways
• Detects accidents, vehicle breakdowns and other incidents promptly, ensuring fast response to restore normal traffic flow
- Recovery crew arrives within 15 minutes
• Provides real-time information of travelling time from the entry point of Expressway to selected exits

Green Link Determining (GLIDE) System
• Controls all traffic signals in Singapore
• Wire sensors beneath the road surface of junctions to sense the presence of vehicles
• Adjust ‘green time’ in response to changing traffic flow
• Also, links adjacent traffic signals to allow vehicles to travel from one junction to another with minimal stops

Traffic Scan system & Junction-eyes (J-Eyes)
• TrafficScan - provides updated travel information on roads to motorists
- Taxis equipped with GPS give information on their locations and speeds as they ply along roads
• J-Eyes - system of surveillance cameras at strategic signalized junctions for traffic conditions monitoring purposes

MyTransport.sg
• App empowering commuters, motorists and cyclists to make informed decisions and better plan their journeys
• Features include:
- Public transport journey planner
- Search nearby bus stops and arrival times
- Search nearby taxi stands and book taxis
- Report road defects via crowdsourcing
- Get real-time parking lots availability
- Traffic news
- Explore cycling towns, routes, and parking facilities

Regulate Vehicle Use
1. Congestion pricing
• In 1999, Electronic Road Pricing (ERP) system to charge vehicles in central zone

Regulate Vehicle Use
2. Demand management
• Previously, mechanisms such as import fee worth 130%, and an excise tax of 20%
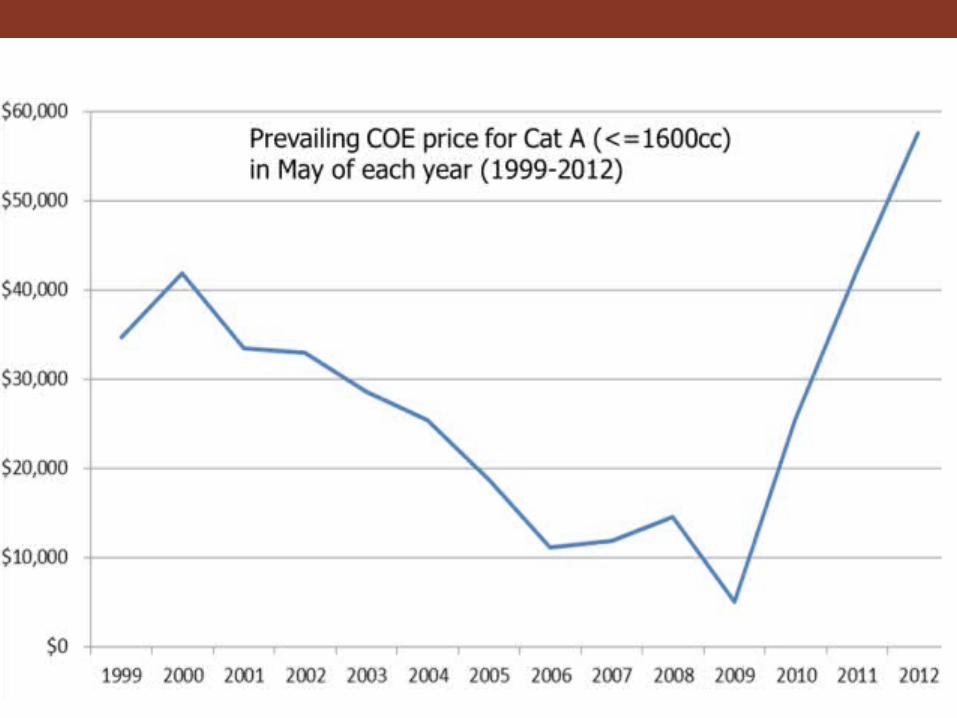
• In 1990, Government cut the growth of car population from 6% to 3% a year. And further to 1.5% in 2009, 1% in 2012, and 0.5% 2013 onwards
Vehicle Quota System - prospective car owners to bid for Certificate of Entitlement (COE)

Number of Cars / 100 persons
Singapore
Hong Kong
London
New York
Tokyo
0 5 10 15 20 25 30 35
2000 2002 2004 2006 2008 2010 2012 20140
10
20
30
40
50
60
70
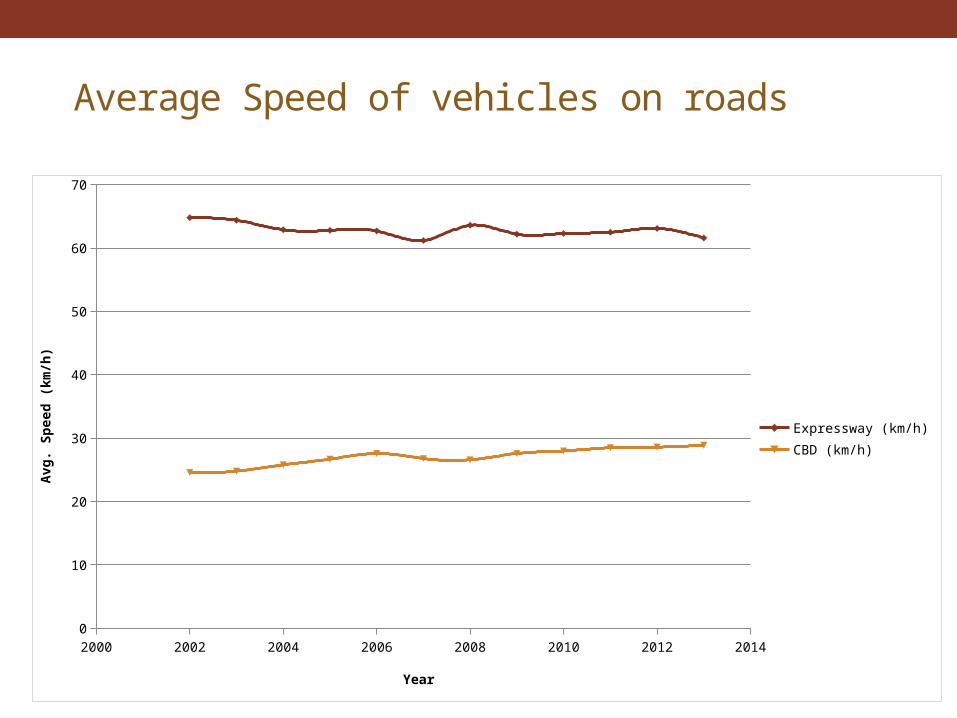
Expressway (km/h)
CBD (km/h)
Year
Avg
. S
pee
d (
km/h
)
Average Speed of vehicles on roads

Taxi network
• 18000 taxis carrying around 1 million passengers a day
• Liberalized market with few operators
• Quality of Service Standards by the government
• Highest number of taxis per million population among Hong Kong, London, and New York

At one of the lowest fares

Bus Network
• By 1990s, two multi-modal Public Transport Operators –
ComfortDelgro, the parent of SBS Transit, and SMRT
Corporation
• In 2008, Land Transport Authority (LTA) took the role of
centralised bus planner
• Today, buses dominant public transport mode –
over 3.6 million journeys per day

2002 2004 2006 2008 2010 2012 2014290
295
300
305
310
315
320
325
330
335
Year
Peo
ple
/bu
s (#
)
Population – Buses Ratio

One of the highest in comparison
Singapore
Hong Kong
London
New York
Tokyo
0 200 400 600 800 1000 1200
Bus fleet / million persons

At one of the lowest fares
Singapore Hong Kong London New York Tokyo0
0.2
0.4
0.6
0.8
1
1.2
1.4
1.6
1.8
Avg. Bus fare ($/pax-trip)

Rail Network• Realized in 1972 that buses alone would not be able to
cater for all Singapore’s public transport demand
• Construction began in 1982
• First line opened in 1987
• Today, 153km of MRT line (tube) and over 2.6 million passengers a day

Strategy – Connect Regional, Sub-Regional, and Central Area

Population – Rail length Ratio
1985 1990 1995 2000 2005 2010 201510
15
20
25
30
35
40
Rail density (km/million people)
Year
Ra
il d
en
sit
y (
km
/mill
ion
pe
op
le)

In comparison to other metropolitans
Singapore
Hong Kong
London
New York
Tokyo
0 10 20 30 40 50 60
Rail Length (km) / million persons

At one of the lowest fares
Singapore Hong Kong London New York Tokyo0
0.5
1
1.5
2
2.5
3
Avg. MRT fare ($/pax-trip)

Recent years & Future

• GDP 28% higher in 2012 as compared to 2008
• Expected to grow 3-4% every year over the next 10-15 years
• Population grew from 4.8 million in 2008 to 5.3 million in 2012
• More than 12.5 million journeys today. Expected to reach to 14.3 million by 2020
Changing dynamics

Areas of focus1. More Connections- 8 in 10 homes to be within 10-min walk to MRT- Integrated Hubs to make transfers easily- Majorly Public Transport dependent
2. Better Service- Ramp up capacity to reduce over crowding- Improve reliability and provide information on arrival and
journey times
3. Liveable and Inclusive Community- Make public transport system barrier free- Promote lower emissions and green vehicles

Road Development• Already 12% for road as compared to 14% for housing
• Slower growth of road development in future as limited capacity - prioritization of new roads for bus lanes
• Innovative methods – Reversible flow on expressway
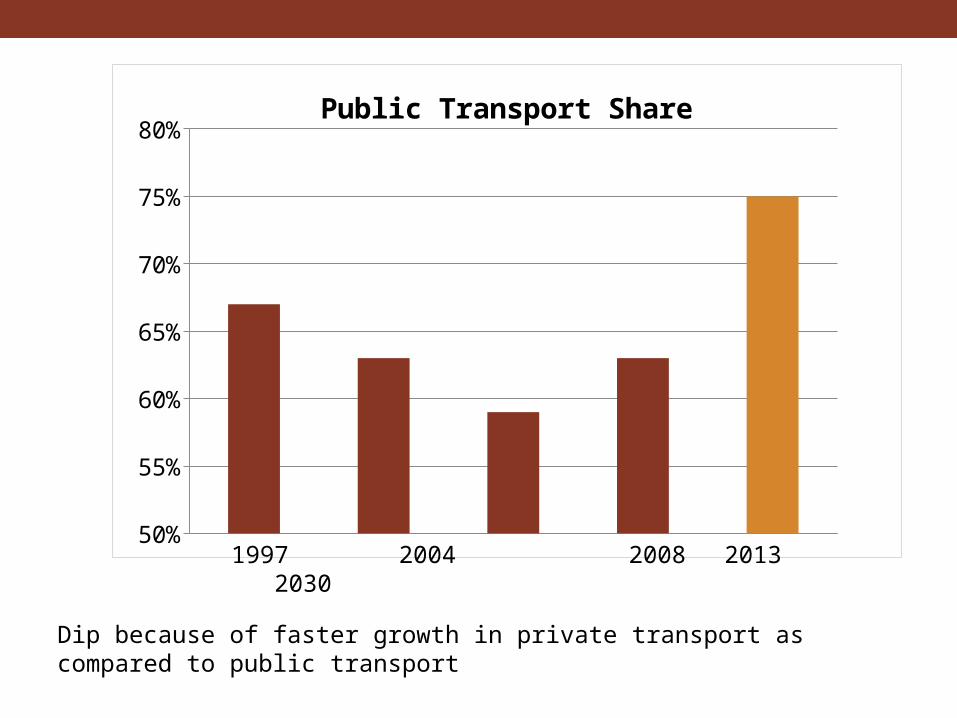
Dip because of faster growth in private transport as compared to public transport
50%
55%
60%
65%
70%
75%
80%Public Transport Share
1997 2004 2008 2013 2030

Bus Network
• Bus Service Enhancement Program (BSEP) in 2012
- Increase fleet by 20% (800 new buses) over 5 years
- Government to fund 550 of them, rest by operators
- Decrease waiting time - 4 in 5 bus services run every 10 minutes or less during weekday
peak hours, improvement from every 15 minutes in 2008
• Other advancements:
- Bus priority schemes: Mandatory Give-Way on more than 350 bus stops
- Bus-triggered signal priority system in test-bedding
- Premium Bus Service scheme - commuters willing to pay higher fare for better service
- Fast Forward Bus service - fewer stops between long distances

Rail Network• Between now and 2021, a new train line or extension to open every
year – even more between 2020 and 2030
• Double rail network from 138km to approximately 280km by around 2020
• More trains to existing lines to increase capacity by 110%
• Upgrade signaling system by 2018 on two major existing lines – 20% increase in capacity
Trains will run at 100-second intervals down from 120 seconds today - 6 trains every 10 min instead of current 5

Singapore 2030
Singapore
Hong Kong
London
New York
Tokyo
0 10 20 30 40 50 60
Rail Length (km) / million persons

MRT system by 2030
Taxi Network• Taxi standards revised in 2013
- 80-85% of the taxis to be on the road at peak periods by 2015, as compared to 65-70% today
- 85% of the taxis to achieve daily minimum mileage of 250km as compared to 70% today
• Innovative private Taxi Apps – Uber, GrabTaxi, EasyTaxi, allowed in the market

Cycling• Recent shift towards cycling
• As of 2012, 6.4km of cycling path in 5 out of 26 residential districts
• By 2015, 100km of cycling path
• By 2020, 190km in all of 26 districts
• Paths will lead to neighboring areas around districts e.g. schools, MRTs, and shopping center
• Long term vision - Island-wide cycling path of 700km
• Test-bedding bicycle sharing scheme in one district in 2015

EZ-link card• One card for all public transport modes
• Since 2010, fare calculated based on total distance, irrespective of number or modes of transfers
• Extension of services to other lifestyle elements such as shopping payments

Decentralization of Commercial Centers
• Decentralize commercial and other economic activities through the development of regional, sub-regional and fringe centres at MRT stations
• Reduce the needs to travel by locating employment centres near to residential areas
• These ‘Integrated Hubs’ becoming fun and convenient lifestyle places for commuters to embark on their journey, or meet, live, work and play

ITS Vision for 2030
“Moving towards a more connected and interactive land transport community”
Smart Urban Mobility of the Future where people and the transportation system are seamlessly connected,
interacting through innovative, state-of-the-art
ITS technologies


Real-time information of everything• Includes:- Travel times- Crowdedness in buses / trains- Arrival times of buses, trains, and taxis- Queue lengths at junctions and stations- Parking availability
• Achieved by embedded sensors, satellite trackers, HD cameras, and crowd sourcing
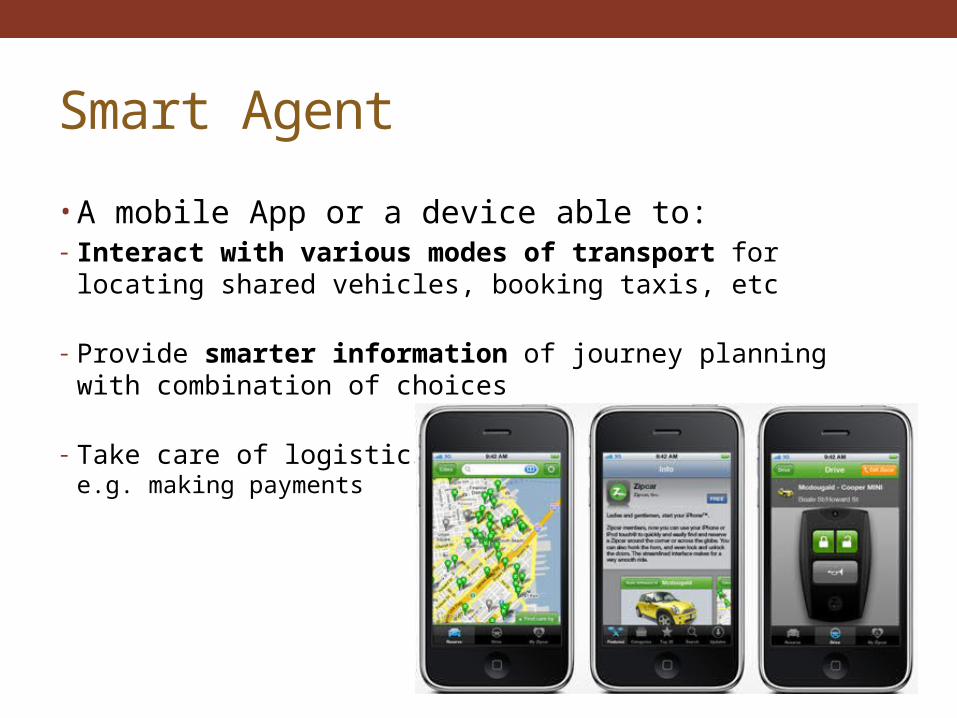
Smart Agent
• A mobile App or a device able to:- Interact with various modes of transport for locating shared
vehicles, booking taxis, etc
- Provide smarter information of journey planning with combination of choices
- Take care of logistics e.g. making payments

Interactivity V2V
• Communication between nearby vehicles wirelessly,
sharing useful information on surroundings

Interactivity V2I
• Communication with infrastructure on signals, traffic
availability, and road conditions

Shared Vehicles• Intelligent vehicle-sharing system - users to locate
vehicle on their smart devices and drive to destination without having to return it to its original location
• Vehicle will subsequently be picked up by another user from the previous location

Shared Vehicles• Ride-sharing to provide smarter way of car pooling and
maximizing capacity
• Such smart on-demand vehicle sharing mobility solution can reduce vehicle ownership and congestion drastically

Satellite-based tracking & ERP• GNSS technology to provide next generation Electronic
Road Pricing (ERP)
- overcomes the constraints of physical gantries- allows more flexible distance-based congestion charging

Autonomous Vehicles• Autonomous driving signifies a paradigm shift
• Driverless buses to provide greater connectivity for the
first and last mile travel, mitigate driver shortages and improve productivity

Autonomous Vehicles• Driverless cars to maintain a safe distance from other
vehicles and comply with speed limits automatically, hence eliminating human errors
• Driverless vehicles can move in platoon formation in compact and systematic manner to optimise road capacity

Green Vehicles• 20% of the total carbon emission & 75% of air pollution
attributed to motorised traffic
• Electric powered vehicles and diesel-hybrid systems more energy efficient and less harmful to the environment


Metric for Ideal Future City
Objective is to highlight areas each city should focus on developing in order to reach the vision by 2030

Integrated System
• seamless integration of multi-modal transportation services; taxis, AVs, shared vehicles, buses and trains• 100% penetration of smart card
Mass Public Transport• Modal split of at least 75%• Coverage to every residential and commercial district• No over-crowding (high frequency) and reliable information on arrival and journey timings• Less fare in comparison to the same journey by private transport
Interactivity• No boards, traffic signs, and other physical hardware to communicate with drivers. Instead in-vehicle communication• Both V2I and V2V communication
Telepresence• Employees can work from mobile locations, children can attend real-time classroom sessions, and any person can virtually walk through lanes of shopping mall• Holographic rather than online
Smart Agent• Able to interact and integrate with all the transportation modes• Provide intelligent information and assistance
Shared Vehicles
• At least 50% of the total non-mass public transport journeys via shared vehicles
Autonomous Vehicles
• At least 50% on road vehicles to be Autonomous
Bicycles
• At least 10% share in the modal split

Mass public transport
Shared vehicles
Intergrated system
Bicycles
Smart Agent
Autonomous vehicles
Telepresence
Interactivity
Metric for Future City

Mass public transport
Shared vehicles
Intergrated system
Bicycles
Smart Agent
Autonomous vehicles
Telepresence
Interactivity
Metric for 'City X’

WAQAS CHEEMA
LKY CENTRE FOR INNOVATIVE CITIESSINGAPORE UNIVERSITY OF TECHNOLOGY AND DESIGN

![A Practical Framework for Constructing Structured Drawings Salman Cheema Sarah BuchananSumit Gulwani Joseph J. LaViola Jr. References [ 1] Cheema, S.,](https://img.dokumen.tips/doc/110x75/56649f455503460f94c66dac/a-practical-framework-for-constructing-structured-drawings-salman-cheema-sarah.jpg)


![Muhammad Aamir Cheema · ers (Muhammad Omer Cheema, Muhammad Umair Cheema and Muhammad Ammar Cheema) who are my nearest surrounders2 [LLL06] and have provided me with a strong love](https://img.dokumen.tips/doc/110x75/5fb9ea326d6c7a5c8c32d214/muhammad-aamir-ers-muhammad-omer-cheema-muhammad-umair-cheema-and-muhammad-ammar.jpg)