Embed Size (px)
Citation preview
1
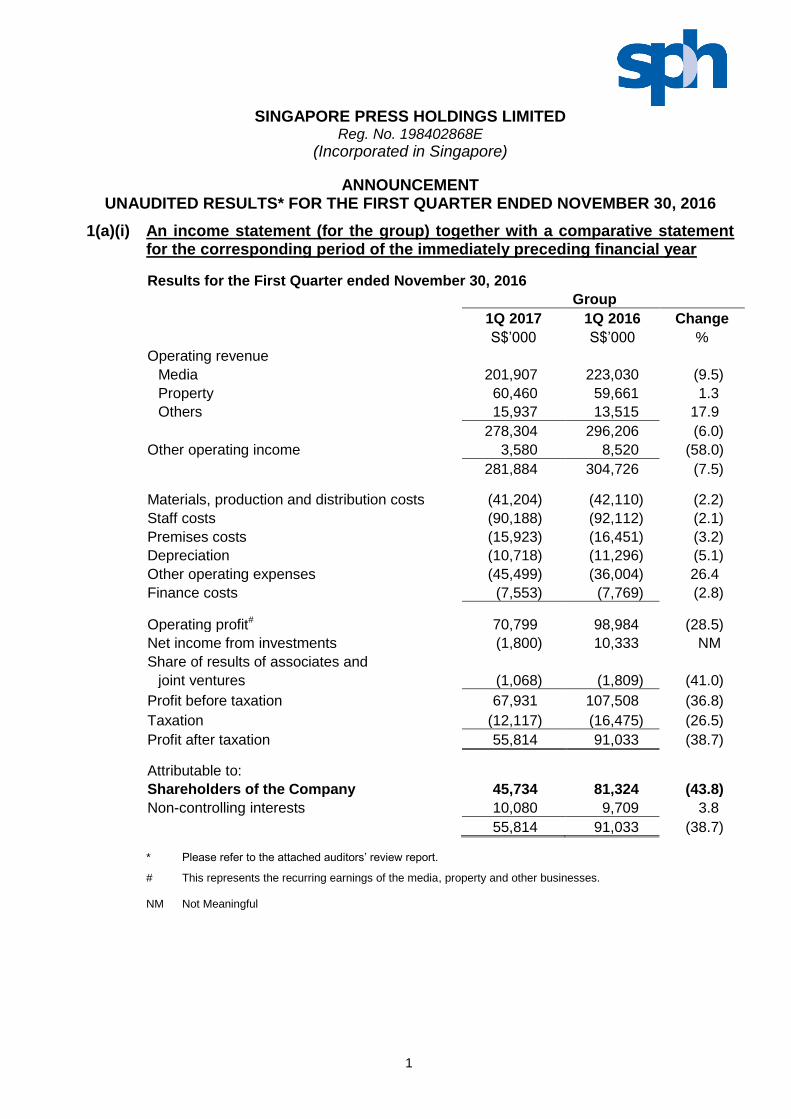
SINGAPORE PRESS HOLDINGS LIMITED
Reg. No. 198402868E
(Incorporated in Singapore)
ANNOUNCEMENT UNAUDITED RESULTS* FOR THE FIRST QUARTER ENDED NOVEMBER 30, 2016
1(a)(i) An income statement (for the group) together with a comparative statement for the corresponding period of the immediately preceding financial year
Results for the First Quarter ended November 30, 2016
Group
1Q 2017 1Q 2016 Change
S$’000 S$’000 %
Operating revenue
Media 201,907 223,030 (9.5)
Property 60,460 59,661 1.3
Others 15,937 13,515 17.9
278,304 296,206 (6.0)
Other operating income 3,580 8,520 (58.0)
281,884 304,726 (7.5)
Materials, production and distribution costs (41,204) (42,110) (2.2)
Staff costs (90,188) (92,112) (2.1)
Premises costs (15,923) (16,451) (3.2)
Depreciation (10,718) (11,296) (5.1)
Other operating expenses (45,499) (36,004) 26.4
Finance costs (7,553) (7,769) (2.8)
Operating profit# 70,799 98,984 (28.5)
Net income from investments (1,800) 10,333 NM
Share of results of associates and
joint ventures (1,068) (1,809) (41.0)
Profit before taxation 67,931 107,508 (36.8)
Taxation (12,117) (16,475) (26.5)
Profit after taxation 55,814 91,033 (38.7)
Attributable to:
Shareholders of the Company 45,734 81,324 (43.8)
Non-controlling interests 10,080 9,709 3.8
55,814 91,033 (38.7)
* Please refer to the attached auditors’ review report.
# This represents the recurring earnings of the media, property and other businesses. NM Not Meaningful
2
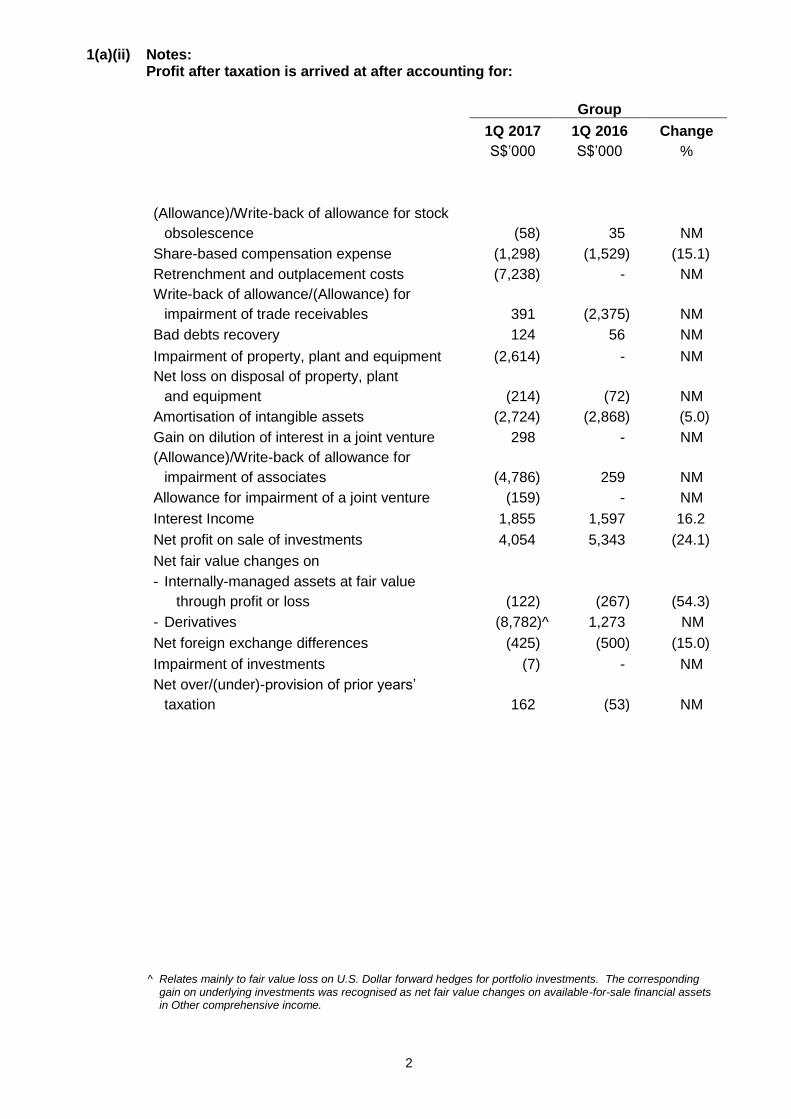
1(a)(ii) Notes: Profit after taxation is arrived at after accounting for:
Group
1Q 2017 1Q 2016 Change
S$’000 S$’000 %
(Allowance)/Write-back of allowance for stock
obsolescence (58) 35 NM
Share-based compensation expense (1,298) (1,529) (15.1)
Retrenchment and outplacement costs (7,238) - NM
Write-back of allowance/(Allowance) for
impairment of trade receivables
391
(2,375)
NM
Bad debts recovery 124 56 NM
Impairment of property, plant and equipment (2,614) - NM
Net loss on disposal of property, plant
and equipment (214) (72) NM
Amortisation of intangible assets (2,724) (2,868) (5.0)
Gain on dilution of interest in a joint venture 298 - NM
(Allowance)/Write-back of allowance for
impairment of associates
(4,786)
259
NM
Allowance for impairment of a joint venture (159) - NM
Interest Income 1,855 1,597 16.2
Net profit on sale of investments 4,054 5,343 (24.1)
Net fair value changes on
- Internally-managed assets at fair value
through profit or loss (122) (267) (54.3)
- Derivatives (8,782)^ 1,273 NM
Net foreign exchange differences (425) (500) (15.0)
Impairment of investments (7) - NM
Net over/(under)-provision of prior years’
taxation 162 (53) NM
^ Relates mainly to fair value loss on U.S. Dollar forward hedges for portfolio investments. The corresponding gain on underlying investments was recognised as net fair value changes on available-for-sale financial assets in Other comprehensive income.
3
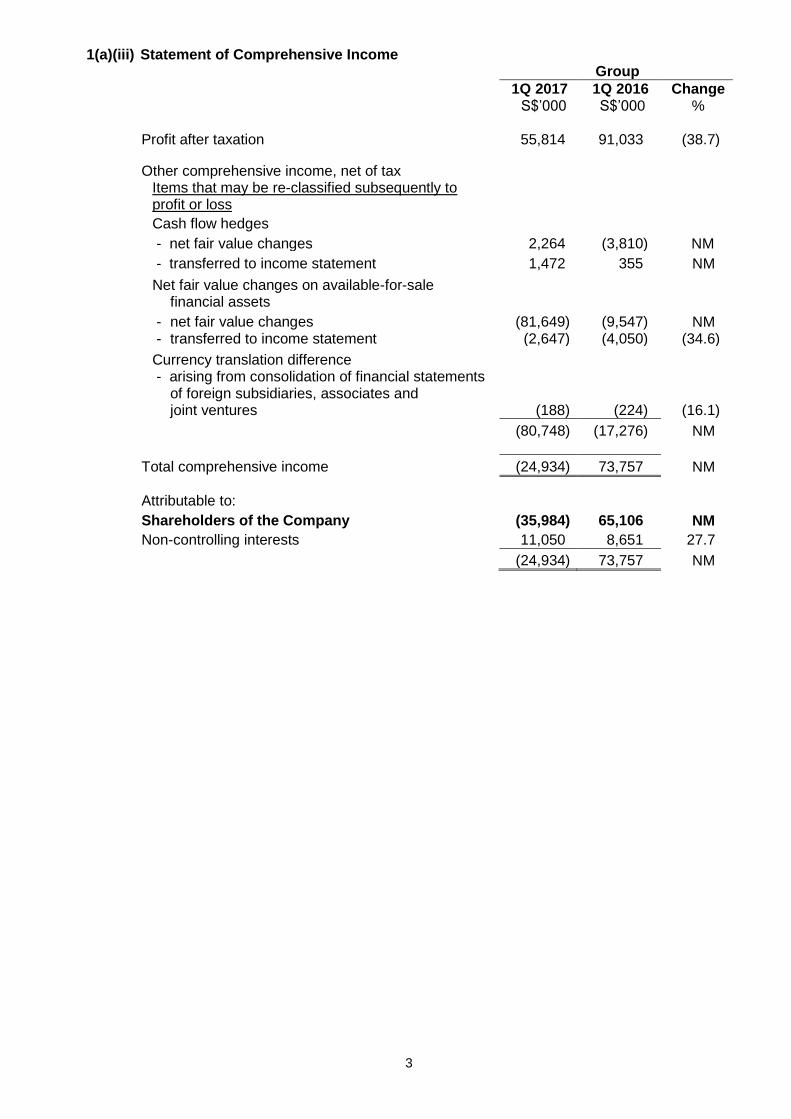
1(a)(iii) Statement of Comprehensive Income
Group
1Q 2017 1Q 2016 Change S$’000 S$’000 % Profit after taxation 55,814 91,033 (38.7)
Other comprehensive income, net of tax Items that may be re-classified subsequently to
profit or loss
Cash flow hedges
- net fair value changes 2,264 (3,810) NM
- transferred to income statement 1,472 355 NM
Net fair value changes on available-for-sale financial assets
- net fair value changes (81,649) (9,547) NM - transferred to income statement (2,647) (4,050) (34.6)
Currency translation difference - arising from consolidation of financial statements
of foreign subsidiaries, associates and joint ventures (188) (224) (16.1)
(80,748) (17,276) NM
Total comprehensive income (24,934) 73,757 NM
Attributable to:
Shareholders of the Company (35,984) 65,106 NM
Non-controlling interests 11,050 8,651 27.7
(24,934) 73,757 NM
4
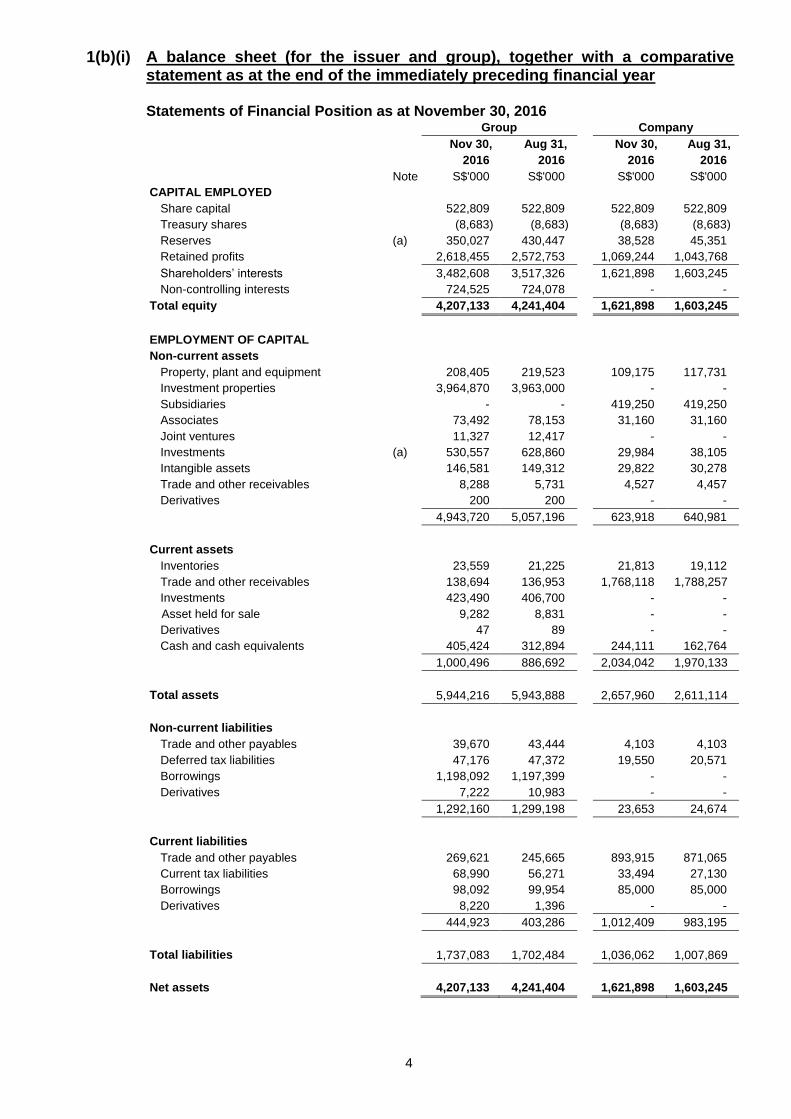
1(b)(i) A balance sheet (for the issuer and group), together with a comparative
statement as at the end of the immediately preceding financial year Statements of Financial Position as at November 30, 2016
Group Company
Nov 30, Aug 31, Nov 30, Aug 31,
2016 2016 2016 2016
Note S$'000 S$'000 S$'000 S$'000
CAPITAL EMPLOYED
Share capital 522,809 522,809 522,809 522,809
Treasury shares (8,683) (8,683) (8,683) (8,683)
Reserves (a) 350,027 430,447 38,528 45,351
Retained profits 2,618,455 2,572,753 1,069,244 1,043,768
Shareholders’ interests 3,482,608 3,517,326 1,621,898 1,603,245
Non-controlling interests 724,525 724,078 - -
Total equity 4,207,133 4,241,404 1,621,898 1,603,245
EMPLOYMENT OF CAPITAL
Non-current assets
Property, plant and equipment 208,405 219,523 109,175 117,731
Investment properties 3,964,870 3,963,000 - -
Subsidiaries - - 419,250 419,250
Associates 73,492 78,153 31,160 31,160
Joint ventures 11,327 12,417 - -
Investments (a) 530,557 628,860 29,984 38,105
Intangible assets 146,581 149,312 29,822 30,278
Trade and other receivables 8,288 5,731 4,527 4,457
Derivatives 200 200 - -
4,943,720 5,057,196 623,918 640,981
Current assets
Inventories 23,559 21,225 21,813 19,112
Trade and other receivables 138,694 136,953 1,768,118 1,788,257
Investments 423,490 406,700 - -
Asset held for sale 9,282 8,831 - -
Derivatives 47 89 - -
Cash and cash equivalents 405,424 312,894 244,111 162,764
1,000,496 886,692 2,034,042 1,970,133
Total assets 5,944,216 5,943,888 2,657,960 2,611,114
Non-current liabilities
Trade and other payables 39,670 43,444 4,103 4,103
Deferred tax liabilities 47,176 47,372 19,550 20,571
Borrowings 1,198,092 1,197,399 - -
Derivatives 7,222 10,983 - -
1,292,160 1,299,198 23,653 24,674
Current liabilities
Trade and other payables 269,621 245,665 893,915 871,065
Current tax liabilities 68,990 56,271 33,494 27,130
Borrowings 98,092 99,954 85,000 85,000
Derivatives 8,220 1,396 - -
444,923 403,286 1,012,409 983,195
Total liabilities 1,737,083 1,702,484 1,036,062 1,007,869
Net assets 4,207,133 4,241,404 1,621,898 1,603,245
5
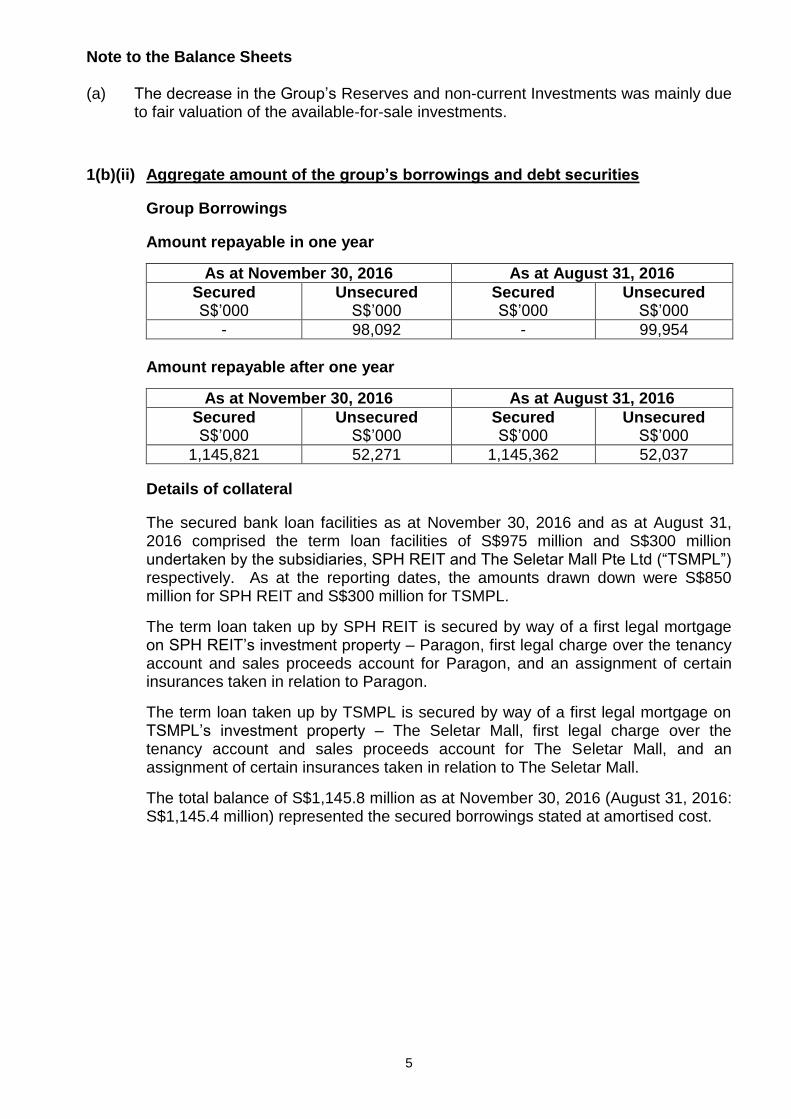
Note to the Balance Sheets (a) The decrease in the Group’s Reserves and non-current Investments was mainly due
to fair valuation of the available-for-sale investments.
1(b)(ii) Aggregate amount of the group’s borrowings and debt securities
Group Borrowings
Amount repayable in one year
As at November 30, 2016 As at August 31, 2016
Secured S$’000
Unsecured S$’000
Secured S$’000
Unsecured S$’000
- 98,092 - 99,954
Amount repayable after one year
As at November 30, 2016 As at August 31, 2016
Secured S$’000
Unsecured S$’000
Secured S$’000
Unsecured S$’000
1,145,821 52,271 1,145,362 52,037
Details of collateral
The secured bank loan facilities as at November 30, 2016 and as at August 31, 2016 comprised the term loan facilities of S$975 million and S$300 million undertaken by the subsidiaries, SPH REIT and The Seletar Mall Pte Ltd (“TSMPL”) respectively. As at the reporting dates, the amounts drawn down were S$850 million for SPH REIT and S$300 million for TSMPL.
The term loan taken up by SPH REIT is secured by way of a first legal mortgage on SPH REIT’s investment property – Paragon, first legal charge over the tenancy account and sales proceeds account for Paragon, and an assignment of certain insurances taken in relation to Paragon.
The term loan taken up by TSMPL is secured by way of a first legal mortgage on TSMPL’s investment property – The Seletar Mall, first legal charge over the tenancy account and sales proceeds account for The Seletar Mall, and an assignment of certain insurances taken in relation to The Seletar Mall.
The total balance of S$1,145.8 million as at November 30, 2016 (August 31, 2016: S$1,145.4 million) represented the secured borrowings stated at amortised cost.
6
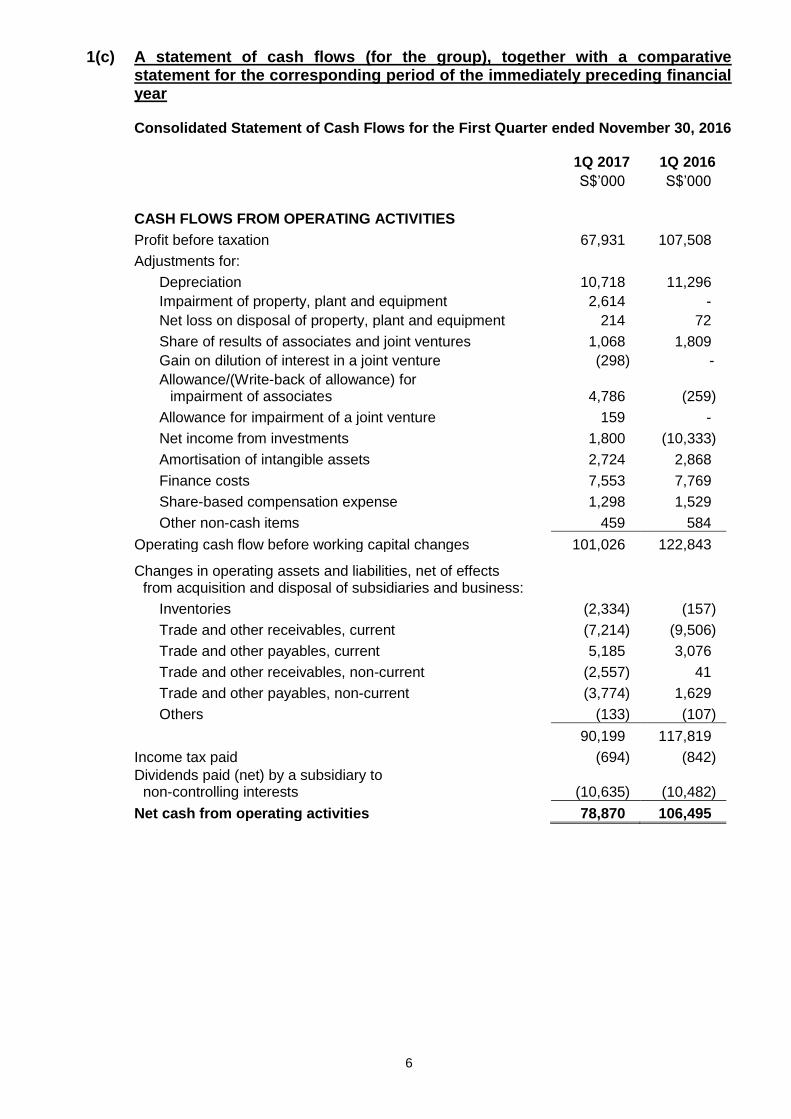
1(c) A statement of cash flows (for the group), together with a comparative
statement for the corresponding period of the immediately preceding financial year
Consolidated Statement of Cash Flows for the First Quarter ended November 30, 2016
1Q 2017 1Q 2016
S$’000 S$’000
CASH FLOWS FROM OPERATING ACTIVITIES
Profit before taxation 67,931 107,508
Adjustments for:
Depreciation 10,718 11,296
Impairment of property, plant and equipment 2,614 -
Net loss on disposal of property, plant and equipment 214 72
Share of results of associates and joint ventures 1,068 1,809
Gain on dilution of interest in a joint venture (298) -
Allowance/(Write-back of allowance) for
impairment of associates 4,786 (259)
Allowance for impairment of a joint venture 159 -
Net income from investments 1,800 (10,333)
Amortisation of intangible assets 2,724 2,868
Finance costs 7,553 7,769
Share-based compensation expense 1,298 1,529
Other non-cash items 459 584
Operating cash flow before working capital changes 101,026 122,843
Changes in operating assets and liabilities, net of effects from acquisition and disposal of subsidiaries and business:
Inventories (2,334) (157)
Trade and other receivables, current (7,214) (9,506)
Trade and other payables, current 5,185 3,076
Trade and other receivables, non-current (2,557) 41
Trade and other payables, non-current (3,774) 1,629
Others (133) (107)
90,199 117,819
Income tax paid (694) (842)
Dividends paid (net) by a subsidiary to non-controlling interests (10,635) (10,482)
Net cash from operating activities 78,870 106,495

7
Consolidated Statement of Cash Flows for the First Quarter ended November 30, 2016 (cont’d)
1Q 2017 1Q 2016
S$’000 S$’000
CASH FLOWS FROM INVESTING ACTIVITIES
Additions to property, plant and equipment (2,674) (2,564)
Proceeds from disposal of property, plant and equipment 15 5
Additions to investment properties (1,870) (5,970)
Acquisition of interest in a joint venture - (1,241)
Dividends received from associates 33 1,230
Proceeds from divestment of an associate - 259
Decrease/(Increase) in amounts owing by associate/joint ventures 54 (69)
Decrease in amounts owing to joint ventures (1,122) (3,347)
Purchase of investments, non-current (2,708) (9,097)
Purchase of investments, current (18,078) (4,166)
Proceeds from disposal of investments, non-current 8,891 861
Proceeds from redemption/disposal of investments, current 39,399 52,713
Dividends received 1,617 2,834
Interest received 1,592 1,323
Other investment income (1,629) (6,829)
Net cash from investing activities 23,520 25,942
CASH FLOWS FROM FINANCING ACTIVITIES
Repayment of bank loans (2,284) (2,327)
Interest paid (7,576) (7,781)
Net cash used in financing activities (9,860) (10,108)
Net increase in cash and cash equivalents 92,530 122,329
Cash and cash equivalents at beginning of period 312,894 292,246
Cash and cash equivalents at end of period 405,424 414,575
8
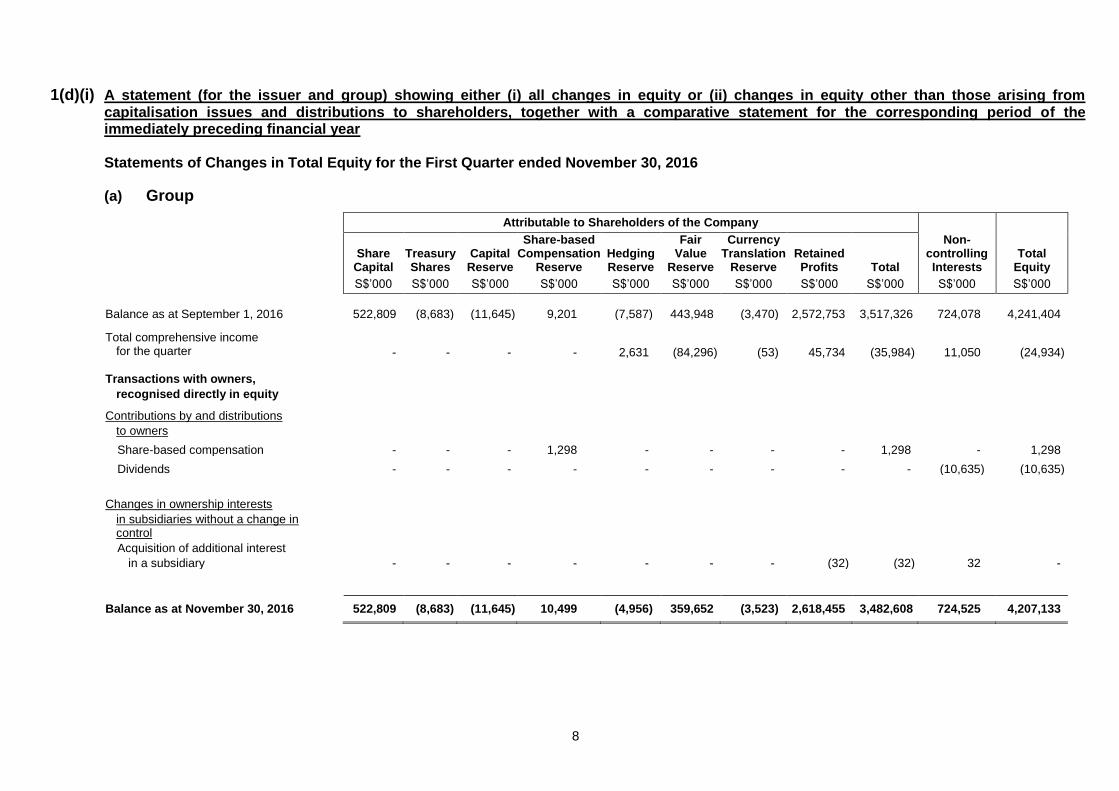
1(d)(i) A statement (for the issuer and group) showing either (i) all changes in equity or (ii) changes in equity other than those arising from capitalisation issues and distributions to shareholders, together with a comparative statement for the corresponding period of the immediately preceding financial year
Statements of Changes in Total Equity for the First Quarter ended November 30, 2016
(a) Group
Attributable to Shareholders of the Company
Share
Capital
Treasury Shares
Capital Reserve
Share-based Compensation
Reserve
Hedging Reserve
Fair Value
Reserve
Currency Translation
Reserve
Retained Profits
Total
Non-controlling Interests
Total
Equity
S$’000 S$’000 S$’000 S$’000 S$’000 S$’000 S$’000 S$’000 S$’000 S$’000 S$’000
Balance as at September 1, 2016 522,809 (8,683) (11,645) 9,201 (7,587) 443,948 (3,470) 2,572,753 3,517,326 724,078 4,241,404
Total comprehensive income for the quarter - - - - 2,631 (84,296) (53) 45,734 (35,984) 11,050 (24,934)
Transactions with owners,
recognised directly in equity
Contributions by and distributions
to owners
Share-based compensation - - - 1,298 - - - - 1,298 - 1,298
Dividends - - - - - - - - - (10,635) (10,635)
Changes in ownership interests
in subsidiaries without a change in control in control Acquisition of additional interest
in a subsidiary - - - - - - - (32) (32) 32 -
Balance as at November 30, 2016 522,809 (8,683) (11,645) 10,499 (4,956) 359,652 (3,523) 2,618,455 3,482,608 724,525 4,207,133
9
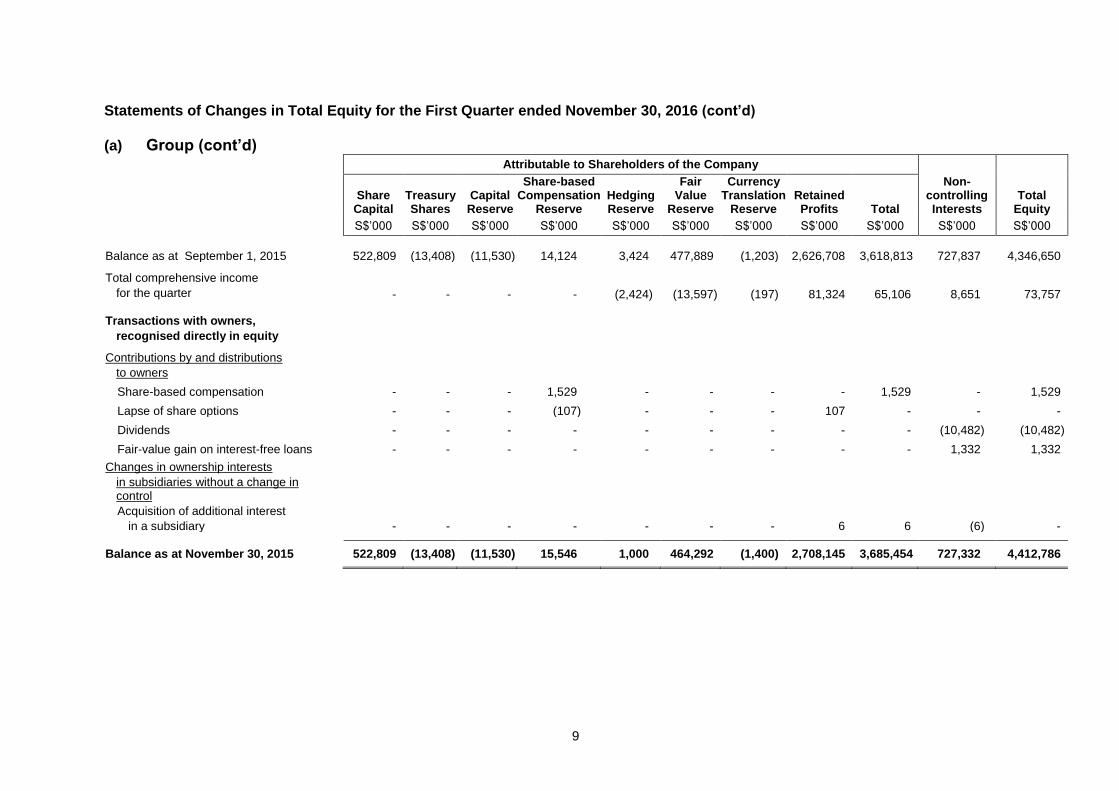
Statements of Changes in Total Equity for the First Quarter ended November 30, 2016 (cont’d)
(a) Group (cont’d)
Attributable to Shareholders of the Company
Share
Capital
Treasury Shares
Capital Reserve
Share-based Compensation
Reserve
Hedging Reserve
Fair Value
Reserve
Currency Translation
Reserve
Retained Profits
Total
Non-controlling Interests
Total
Equity
S$’000 S$’000 S$’000 S$’000 S$’000 S$’000 S$’000 S$’000 S$’000 S$’000 S$’000
Balance as at September 1, 2015 522,809 (13,408) (11,530) 14,124 3,424 477,889 (1,203) 2,626,708 3,618,813 727,837 4,346,650
Total comprehensive income
for the quarter - - - - (2,424) (13,597) (197) 81,324 65,106 8,651 73,757
Transactions with owners,
recognised directly in equity
Contributions by and distributions
to owners
Share-based compensation - - - 1,529 - - - - 1,529 - 1,529
Lapse of share options - - - (107) - - - 107 - - -
Dividends - - - - - - - - - (10,482) (10,482)
Fair-value gain on interest-free loans - - - - - - - - - 1,332 1,332
Changes in ownership interests
in subsidiaries without a change in control in control Acquisition of additional interest
in a subsidiary - - - - - - - 6 6 (6) -
Balance as at November 30, 2015 522,809 (13,408) (11,530) 15,546 1,000 464,292 (1,400) 2,708,145 3,685,454 727,332 4,412,786
10
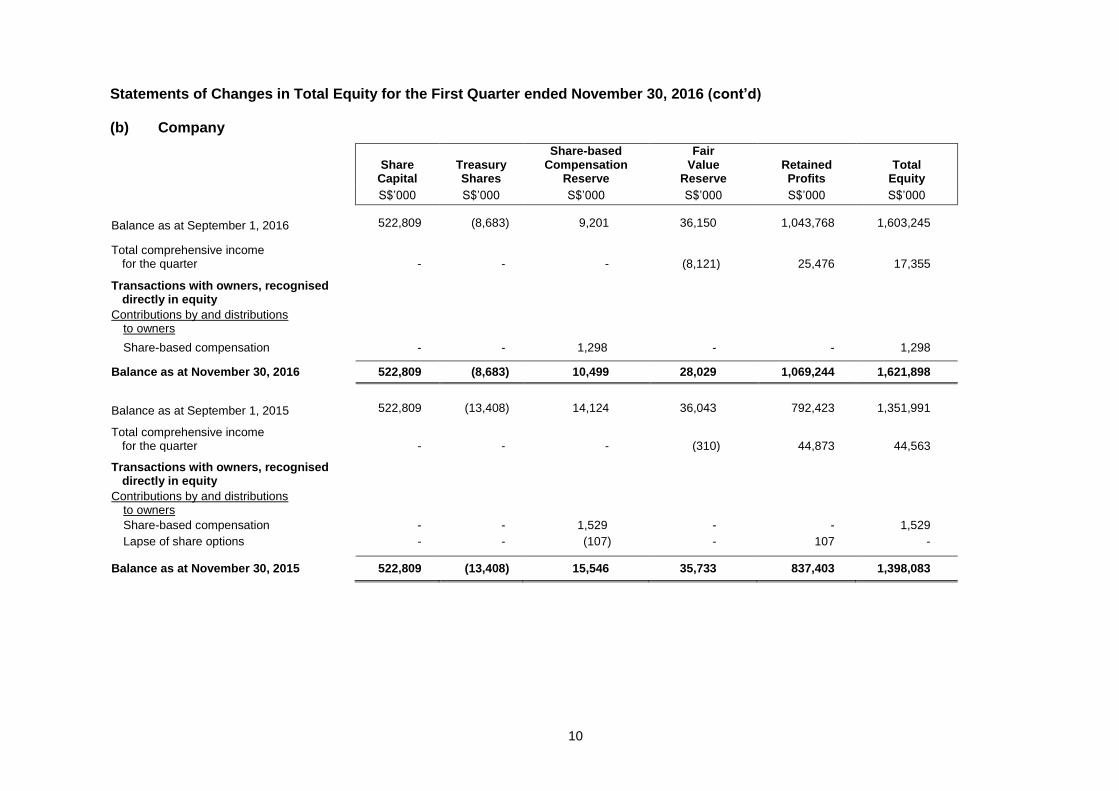
Statements of Changes in Total Equity for the First Quarter ended November 30, 2016 (cont’d)
(b) Company
Share
Capital
Treasury Shares
Share-based Compensation
Reserve
Fair Value
Reserve
Retained Profits
Total
Equity
S$’000 S$’000 S$’000 S$’000 S$’000 S$’000
Balance as at September 1, 2016 522,809 (8,683) 9,201 36,150 1,043,768 1,603,245
Total comprehensive income for the quarter - - - (8,121) 25,476 17,355
Transactions with owners, recognised directly in equity
Contributions by and distributions to owners
Share-based compensation - - 1,298 - - 1,298
Balance as at November 30, 2016 522,809 (8,683) 10,499 28,029 1,069,244 1,621,898
Balance as at September 1, 2015 522,809 (13,408) 14,124 36,043 792,423 1,351,991
Total comprehensive income for the quarter - - - (310) 44,873 44,563
Transactions with owners, recognised directly in equity
Contributions by and distributions to owners
Share-based compensation - - 1,529 - - 1,529
Lapse of share options - - (107) - 107 -
Balance as at November 30, 2015 522,809 (13,408) 15,546 35,733 837,403 1,398,083
11
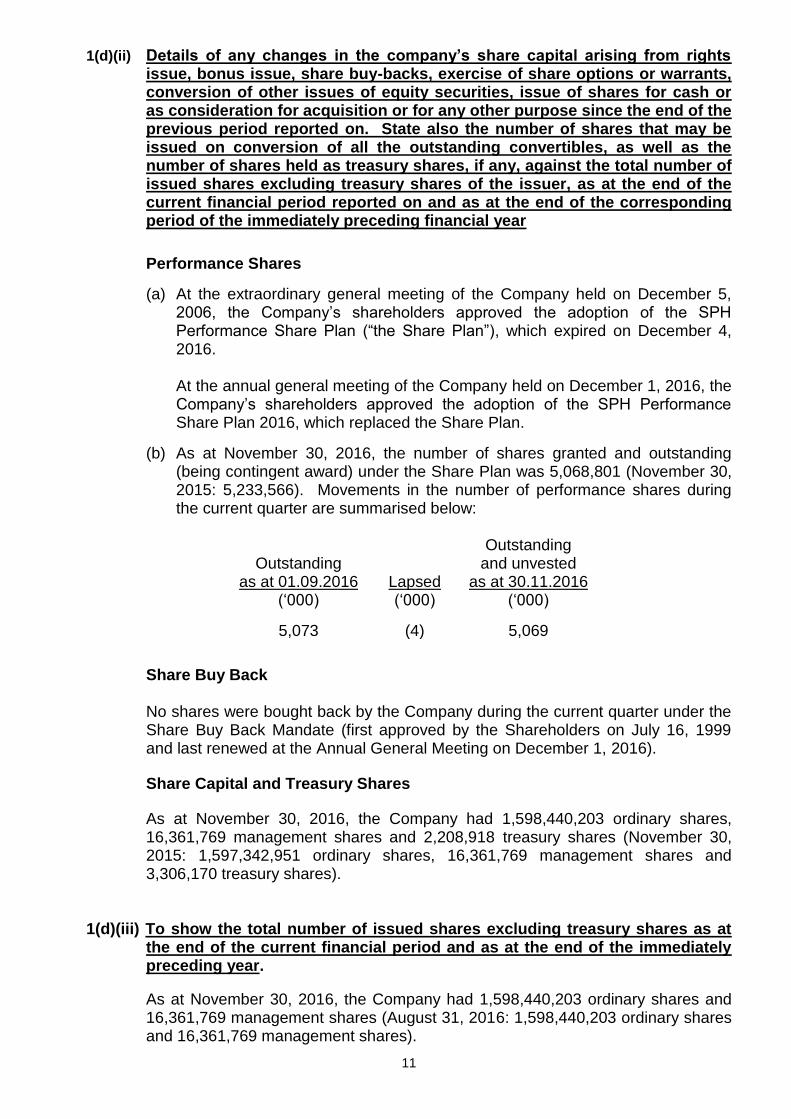
1(d)(ii) Details of any changes in the company’s share capital arising from rights issue, bonus issue, share buy-backs, exercise of share options or warrants, conversion of other issues of equity securities, issue of shares for cash or as consideration for acquisition or for any other purpose since the end of the previous period reported on. State also the number of shares that may be issued on conversion of all the outstanding convertibles, as well as the number of shares held as treasury shares, if any, against the total number of issued shares excluding treasury shares of the issuer, as at the end of the current financial period reported on and as at the end of the corresponding period of the immediately preceding financial year
Performance Shares
(a) At the extraordinary general meeting of the Company held on December 5, 2006, the Company’s shareholders approved the adoption of the SPH Performance Share Plan (“the Share Plan”), which expired on December 4, 2016. At the annual general meeting of the Company held on December 1, 2016, the Company’s shareholders approved the adoption of the SPH Performance Share Plan 2016, which replaced the Share Plan.
(b) As at November 30, 2016, the number of shares granted and outstanding (being contingent award) under the Share Plan was 5,068,801 (November 30, 2015: 5,233,566). Movements in the number of performance shares during the current quarter are summarised below:
Outstanding as at 01.09.2016 Lapsed
Outstanding and unvested
as at 30.11.2016 (‘000) (‘000) (‘000)
5,073 (4) 5,069
Share Buy Back
No shares were bought back by the Company during the current quarter under the Share Buy Back Mandate (first approved by the Shareholders on July 16, 1999 and last renewed at the Annual General Meeting on December 1, 2016).
Share Capital and Treasury Shares
As at November 30, 2016, the Company had 1,598,440,203 ordinary shares, 16,361,769 management shares and 2,208,918 treasury shares (November 30, 2015: 1,597,342,951 ordinary shares, 16,361,769 management shares and 3,306,170 treasury shares).
1(d)(iii) To show the total number of issued shares excluding treasury shares as at
the end of the current financial period and as at the end of the immediately preceding year.
As at November 30, 2016, the Company had 1,598,440,203 ordinary shares and 16,361,769 management shares (August 31, 2016: 1,598,440,203 ordinary shares and 16,361,769 management shares).
12
1(d)(iv) A statement showing all sales, transfers, disposal, cancellation and/or use of
treasury shares as at the end of the current financial period reported on.
There were no sale, transfer, disposal, cancellation and/or use of treasury shares during the current quarter.
2. Whether the figures have been audited or reviewed, and in accordance with which auditing standard or practice
The financial information as set out in paragraphs 1, 4, 5, 6, 7 and 14 of this announcement has been extracted from the condensed interim financial information that has been reviewed by our auditors, KPMG LLP, in accordance with Singapore Standard on Review Engagements 2410, Review of Interim Financial Information Performed by the Independent Auditor of the Entity.
3. Where the figures have been audited or reviewed, the auditors’ report
(including any qualifications or emphasis of a matter) Please refer to the attached auditors’ review report.
4. Whether the same accounting policies and methods of computation as in the
issuer’s most recently audited annual financial statements have been applied. If there are any changes in the accounting policies and methods of computation, including any required by an accounting standard, what has changed, as well as the reasons for, and the effect of, the change.
Accounting Policies
The financial information has been prepared in accordance with the same accounting policies and methods of computation adopted in the audited financial statements of the previous financial year, except for new or amended Financial Reporting Standards (“FRS”) and Interpretations to FRS (“INT FRS”) which became effective from this financial year.
The adoption of the new/revised FRS and INT FRS has not resulted in any
substantial changes to the Group’s accounting policies nor any significant impact on these financial statements.
5. Earnings per ordinary share of the group for the current financial period
reported on and the corresponding period of the immediately preceding financial year, after deducting any provision for preference dividends
Earnings Per Share for the First Quarter ended November 30, 2016
Group
1Q 2017 1Q 2016 (a) Based on the weighted average
number of shares on issue (S$) 0.03 0.05
(b) On fully diluted basis (S$) 0.03 0.05

13
6. Net asset value (for the issuer and group) per ordinary share based on the
total number of issued shares excluding treasury shares of the issuer at the end of the (a) current financial period reported on; and (b) immediately preceding financial year
Net Asset Value Per Share
Group Company
Nov 30, 2016
Aug 31, 2016
Nov 30, 2016
Aug 31, 2016
Net asset value per share based on total number of issued shares at the end of period/year (S$)
2.16
2.18
1.00
0.99 7. A review of the performance of the group, to the extent necessary for a
reasonable understanding of the group’s business. It must include a discussion of any significant factors that affected the turnover, costs, and earnings of the group for the current financial period reported on, including (where applicable) seasonal or cyclical factors; and any material factors that affected the cash flow, working capital, assets or liabilities of the group during the current financial period reported on
Business Segments/Review of Results
Business Segments
The Group is organised into three major operating segments, namely Media,
Property, and Treasury and Investment. The Media segment is involved in the production of content for distribution on print and other media platforms. The Property segment holds, manages and develops properties of the Group. The Treasury and Investment segment manages the investment activities of the Group. Other operations under the Group, which are currently not significant to be reported separately, are included under “Others”. These include the Group’s businesses and investments in online classifieds, events and exhibitions and the New Media Fund.
Review of Results for the First Quarter ended November 30, 2016 (“1Q 2017”)
compared with the First Quarter ended November 30, 2015 (“1Q 2016”)
7.1 Group operating revenue of S$278.3 million was S$17.9 million (6%) lower compared to 1Q 2016. Revenue for the Media business fell S$21.1 million (9.5%) to S$201.9 million as advertisement revenue declined by S$22.7 million (13.5%). Circulation revenue increased by S$0.7 million (1.8%) bolstered by the positive impact of newspaper cover price increases implemented on March 1, 2016. Revenue for the Property segment edged up S$0.8 million (1.3%) to S$60.5 million on the back of higher rental income from the retail assets of the Group. Revenue from the Group’s other businesses grew by S$2.4 million (17.9%) to S$15.9 million, led by contributions from the exhibitions business.
14
7.2 Other operating income was lower by S$4.9 million (58%) as 1Q 2016 included a write-back of contingent consideration for an acquired business.
7.3 Total costs of S$211.1 million was higher by S$5.3 million (2.6%). The increase was attributable to charges of S$15.9 million arising from the media business review and impairment of an associate. The charges included S$7.2 million of retrenchment and outplacement benefits as part of an ongoing Group-wide right-sizing exercise involving a staff reduction of up to 10% over two years, and an impairment charge of S$2.6 million on a press line with the optimisation of printing capacity. The impairment charge of S$4.8 million on an associate was taken in conjunction with the restructuring of the video business.
Materials, production and distribution costs fell S$0.9 million (2.2%) due to lower newsprint costs partially offset by higher production costs of the exhibitions business.
Staff costs decreased by S$1.9 million (2.1%) due to bonus provision.
Other operating expenses increased by S$9.5 million (26.4%) due to the above-mentioned charges of S$15.9 million, partially offset by reduced business promotion costs and lower provision for doubtful debts.
7.4 Operating profit of S$70.8 million was S$28.2 million (28.5%) lower compared to 1Q 2016. Excluding the charges of S$15.9 million, operating profit would have declined by S$12.3 million (12.4%).
7.5 The decrease in investment income of S$12.1 million mainly arose from fair value
loss on hedges for portfolio investments due to strengthening of the USD.
7.6 The share of results of associates and joint ventures improved by S$0.7 million (41%) due to lower losses recorded by the regional online classifieds business.
7.7 Taxation charge of S$12.1 million was based on the statutory tax rate, taking into account non-deductible expenses and non-taxable income. There were no material adjustments for over- or under- provision of taxation in respect of prior years.
7.8 Net profit attributable to shareholders of S$45.7 million was S$35.6 million (43.8%)
lower compared to 1Q 2016.
8. Where a forecast, or a prospect statement, has been previously disclosed to shareholders, any variance between it and the actual results
No forecast was made previously.
9. A commentary at the date of announcement of the significant trends and competitive conditions of the industry in which the group operates and any known factors or events that may affect the group in the next reporting period and the next 12 months
9.1 Business conditions are expected to remain challenging in view of the economic
headwinds and structural challenges confronting the media industry. 9.2 Newsprint prices are expected to strengthen marginally but remain dependent on
the degree of market balance between supply and demand.
15
9.3 The retail assets of the Group, comprising Paragon, The Clementi Mall and The
Seletar Mall, will continue to provide a recurrent income stream. 9.4 The Group will maintain a conservative stance on its investment portfolio allocation
and returns are expected to be commensurate with a low risk-return profile to mitigate against volatility.
9.5 The Group will focus on continued innovation and investment in the media
business to stay ahead and stay relevant, improve cost efficiency with a leaner organisation and wage restraint measures, and grow business adjacencies to diversify revenue streams.
10. Dividends (a) Current Financial Period Reported On Any dividend recommended for the current financial period reported on? No. (b) Corresponding Period of the Immediately Preceding Financial Year Any dividend declared for the corresponding period of the immediately
preceding financial year? No. (c) Date payable Not applicable.
(d) Record Date
Not applicable.
11. If no dividend has been declared (recommended), a statement to that effect
No interim dividend has been declared or recommended in the current reporting period.
12. If the group has obtained a general mandate from shareholders for Interested Person Transactions, the aggregate value of such transactions as required under Rule 920(1)(a)(ii). If no IPT mandate has been obtained, a statement to that effect.
The Company has not obtained a general mandate from shareholders for Interested
Person Transactions.
16
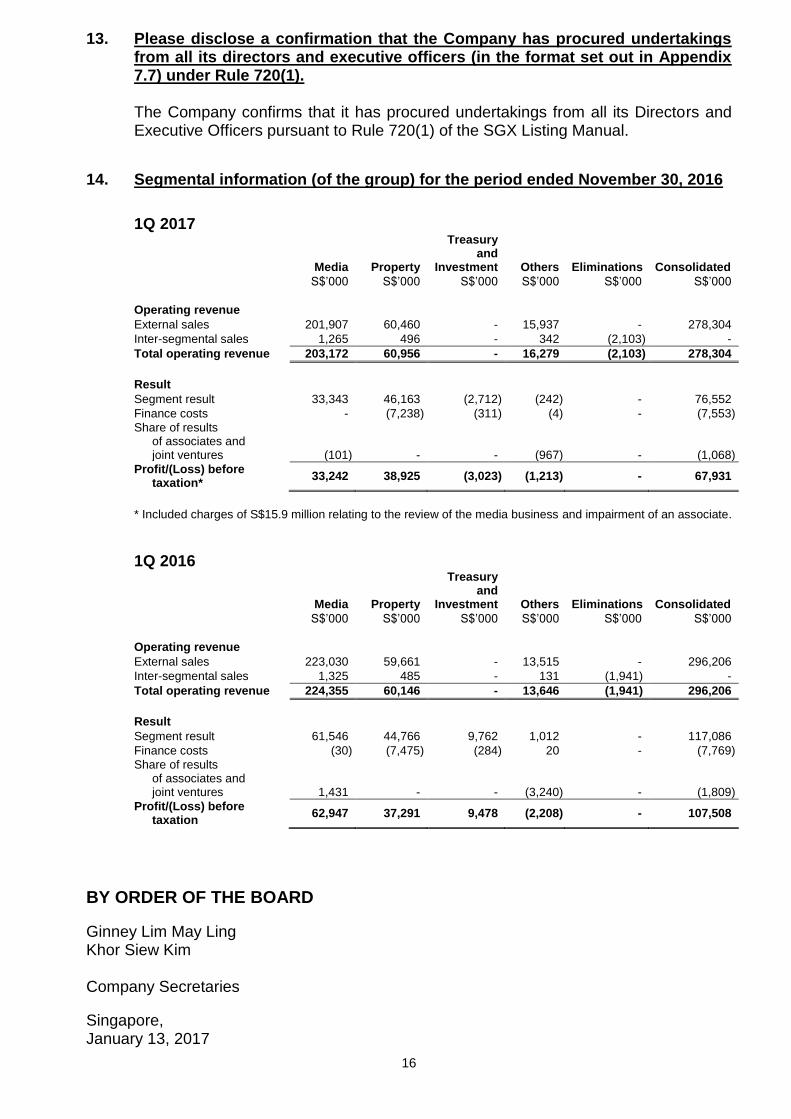
13. Please disclose a confirmation that the Company has procured undertakings from all its directors and executive officers (in the format set out in Appendix 7.7) under Rule 720(1).
The Company confirms that it has procured undertakings from all its Directors and Executive Officers pursuant to Rule 720(1) of the SGX Listing Manual.
14. Segmental information (of the group) for the period ended November 30, 2016
1Q 2017
Media Property
Treasury and
Investment Others Eliminations Consolidated
S$’000 S$’000 S$’000 S$’000 S$’000 S$’000
Operating revenue
External sales 201,907 60,460 - 15,937 - 278,304
Inter-segmental sales 1,265 496 - 342 (2,103) -
Total operating revenue 203,172 60,956 - 16,279 (2,103) 278,304
Result
Segment result 33,343 46,163 (2,712) (242) - 76,552
Finance costs - (7,238) (311) (4) - (7,553)
Share of results of associates and joint ventures (101) - - (967) - (1,068)
Profit/(Loss) before taxation*
33,242 38,925 (3,023) (1,213) - 67,931
* Included charges of S$15.9 million relating to the review of the media business and impairment of an associate.
1Q 2016
Media Property
Treasury and
Investment Others Eliminations Consolidated
S$’000 S$’000 S$’000 S$’000 S$’000 S$’000
Operating revenue
External sales 223,030 59,661 - 13,515 - 296,206
Inter-segmental sales 1,325 485 - 131 (1,941) -
Total operating revenue 224,355 60,146 - 13,646 (1,941) 296,206
Result
Segment result 61,546 44,766 9,762 1,012 - 117,086
Finance costs (30) (7,475) (284) 20 - (7,769)
Share of results of associates and joint ventures 1,431 - - (3,240) - (1,809)
Profit/(Loss) before taxation
62,947 37,291 9,478 (2,208) - 107,508
BY ORDER OF THE BOARD
Ginney Lim May Ling Khor Siew Kim Company Secretaries
Singapore, January 13, 2017