Embed Size (px)
Citation preview

The accompanying notes form an integral part of these financial statements 1
SINGAPORE CONSORTIUM INVESTMENT MANAGEMENT LIMITED (Incorporated in Singapore) Company Registration No. 199607548K
SINGAPORE INDEX FUND
Audited financial statements for the year ended 30 June 2010
SINGAPORE INDEX FUND (Constituted under a Trust Deed in the Republic of Singapore) The Board of Directors of Singapore Consortium Investment Management Limited (the “Manager”) wishes to announce the audited results of the Singapore Index Fund (the “Fund”) for the year ended 30 June 2010.
STATEMENT OF TOTAL RETURN For the financial year ended 30 June 2010 Note 2010 2009 $ $ Investment income Dividends 2,529,157 2,696,849 Less: Expenses Audit fees (32,579) (23,678) Bank charges (1,538) (822) Custody fees 10 (35,924) (26,543) Interest expense - (268) Management fees 10 (505,670) (394,293) Printing expenses (22,904) (22,562) Professional fees (12,073) (18,030) Registrar fees 10 (22,903) (51,785) Trustee fees 10 (50,454) (41,503) Miscellaneous expenses (30,516) (34,359) (714,561) (613,843)
Net income 1,814,596 2,083,006
Net gains or losses on value of investments
Net realised gain/(loss) on investments 1,482,282 (2,888,447) Net change in fair value on investments 12,953,950 (14,548,522) Net foreign exchange (loss)/gain (27,872) 19,262 Net gains/(losses) on value of investments 14,408,360 (17,417,707) Total return/(deficit) for the year before income tax 16,222,956 (15,334,701) Less: Income tax 3 (12,185) (14,146) Total return/(deficit) for the year 16,210,771 (15,348,847)

The accompanying notes form an integral part of these financial statements 2
BALANCE SHEET As at 30 June 2010 Note 2010 2009 $ $ ASSETS Portfolio of investments 82,085,482 67,427,895 Receivables 5 204,255 22,135 Cash and bank balances 1,417,345 2,478,190 Total Assets 83,707,082 69,928,220
LIABILITIES Payables 6 303,784 176,153 Net assets attributable to unitholders 7 83,403,298 69,752,067
Total Liabilities 83,707,082 69,928,220

PORTFOLIO STATEMENT As at 30 June 2010 (Primary)
The accompanying notes form an integral part of these financial statements 3
Holdings at Fair value at
Percentage of total net assets attributable to unitholders at
30 June 2010 30 June 2010 30 June 2010
$ %
By Industry (Primary)*
Quoted Equities
CONSUMER DISCRETIONARY
GENTING SINGAPORE PUBLIC LIMITED COMPANY 1,591,000 1,861,470 2.23
JARDINE CYCLE & CARRIAGE LIMITED 47,466 1,419,233 1.70
SINGAPORE PRESS HOLDINGS LIMITED 522,000 1,973,160 2.37
TOTAL 5,253,863 6.30
CONSUMER STAPLE
FRASER & NEAVE LIMITED 287,500 1,472,000 1.76
GOLDEN AGRI-RESOURCES LIMITED 3,003,632 1,576,907 1.89
OLAM INTERNATIONAL LIMITED 496,900 1,282,002 1.54
WILMAR INTERNATIONAL LIMITED 835,000 4,817,950 5.78
TOTAL 9,148,859 10.97
FINANCIALS
CAPITAMALLS ASIA LIMITED 510,000 1,071,000 1.28
DBS GROUP HOLDINGS LIMITED 559,750 7,646,185 9.17
K-GREEN TRUST 77,500 81,375 0.10
OVERSEA-CHINESE BANKING CORPORATION 810,234 7,154,366 8.58
SINGAPORE EXCHANGE LIMITED 350,500 2,586,690 3.10
UNITED OVERSEAS BANK LIMITED 376,780 7,347,210 8.81
TOTAL 25,886,826 31.04
INDUSTRIALS
COMFORTDELGRO CORPORATION LIMITED 676,000 980,200 1.18
JARDINE MATHESON HOLDINGS LIMITED 83,200 4,081,705 4.89 JARDINE STRATEGIC HOLDINGS LIMITED 72,000 2,092,810 2.51 KEPPEL CORPORATION LIMITED 387,500 3,293,750 3.95
NEPTUNE ORIENT LINES LIMITED 336,750 673,500 0.81
NOBLE GROUP LIMITED 1,461,350 2,484,295 2.98
SEMCORP INDUSTRIES LIMITED 291,840 1,187,789 1.42
SEMCORP MARINE LIMITED 270,000 1,039,500 1.25
SIA ENGINEERING COMPANY LIMITED 71,000 282,580 0.34
SINGAPORE AIRLINES LIMITED 193,740 2,816,980 3.38
SINGAPORE TECHNOLOGIES ENGINEERING 490,500 1,613,745 1.93
SMRT CORPORATION LIMITED 248,000 548,080 0.66
TOTAL 21,094,934 25.30
*The industry classification is based upon Global Industry Classification Standard (GICS) developed by Morgan Stanley Capital International (MSCI).
PORTFOLIO STATEMENT As at 30 June 2010 (Primary)
The accompanying notes form an integral part of these financial statements 4
Holdings at Fair value at
Percentage of total net assets attributable to unitholders at
30 June 2010 30 June 2010 30 June 2010
$ %
By Industry (Primary)* (continued)
Quoted Equities
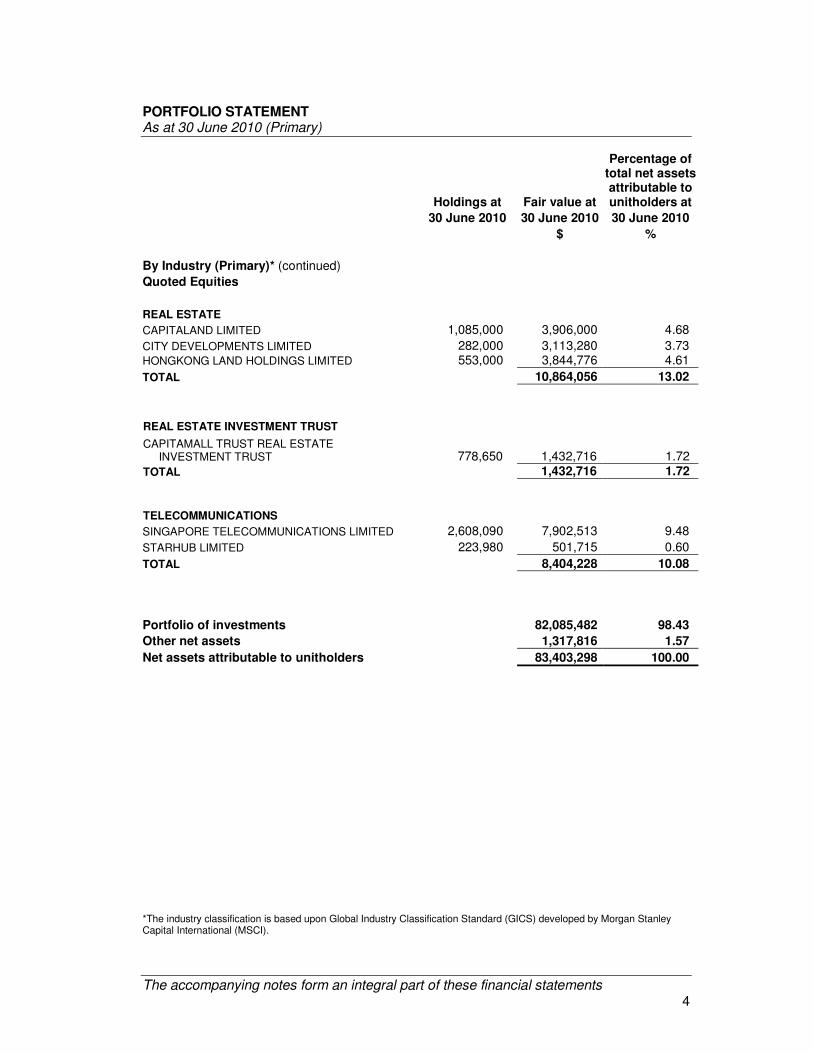
REAL ESTATE
CAPITALAND LIMITED 1,085,000 3,906,000 4.68
CITY DEVELOPMENTS LIMITED 282,000 3,113,280 3.73 HONGKONG LAND HOLDINGS LIMITED 553,000 3,844,776 4.61
TOTAL 10,864,056 13.02
REAL ESTATE INVESTMENT TRUST
CAPITAMALL TRUST REAL ESTATE INVESTMENT TRUST 778,650 1,432,716 1.72 TOTAL 1,432,716 1.72
TELECOMMUNICATIONS
SINGAPORE TELECOMMUNICATIONS LIMITED 2,608,090 7,902,513 9.48
STARHUB LIMITED 223,980 501,715 0.60
TOTAL 8,404,228 10.08
Portfolio of investments 82,085,482 98.43
Other net assets 1,317,816 1.57
Net assets attributable to unitholders 83,403,298 100.00
*The industry classification is based upon Global Industry Classification Standard (GICS) developed by Morgan Stanley Capital International (MSCI).

PORTFOLIO STATEMENT As at 30 June 2010 (Primary)
The accompanying notes form an integral part of these financial statements 5
Percentage of total net assets attributable to unitholders at
Percentage of total net assets attributable to unitholders at
30 June 2010 30 June 2009
% %
By Industry – Primary (Summary)
Quoted Equities
Consumer Discretionary 6.30 5.17
Consumer Staple 10.97 8.21
Financials 31.04 31.33
Industrials 25.30 23.58
Real Estate 13.02 13.62
Real Estate Investment Trust 1.72 1.72
Telecommunications 10.08 13.04
Portfolio of investments 98.43 96.67
Other net assets 1.57 3.33
Net assets attributable to unitholders 100.00 100.00

PORTFOLIO STATEMENT As at 30 June 2010 (Secondary)
The accompanying notes form an integral part of these financial statements 6
Fair value at
Percentage of total net assets attributable to unitholders at
Percentage of total net assets attributable to unitholders at
30 June 2010 30 June 2010 30 June 2009
$ % %
By Geography (Secondary)#
Hong Kong 12,503,586 14.99 12.37
Singapore 69,581,896 83.44 84.30
Portfolio of investments 82,085,482 98.43 96.67
Other net assets 1,317,816 1.57 3.33
Net assets attributable to unitholders 83,403,298 100.00 100.00
#The geography classification is based on country of domicile of the investee companies

SINGAPORE INDEX FUND (Constituted under a Trust Deed in the Republic of Singapore)
NOTES TO THE FINANCIAL STATEMENTS For the financial year ended 30 June 2010
7
These notes form an integral part of and should be read in conjunction with the accompanying financial statements 1. GENERAL Singapore Index Fund (the "Fund") is a Singapore registered trust fund constituted by a
Trust Deed dated 12 November 1996 together with its Supplemental Deeds thereon (thereafter referred to as "Trust Deed") between Singapore Consortium Investment Management Limited (the "Manager") and HSBC Institutional Trust Services (Singapore) Limited (the "Trustee"). The Trust Deed is governed by the laws of the Republic of Singapore.
The primary activity of the Fund is investment trading. The Fund's investment objective is to achieve medium to long term capital appreciation by investing in the component securities of the Straits Times Index (STI). While the Fund will aim to follow the STI as closely as possible, the Fund’s performance will not be able to exactly match the performance of the STI due to operating expenses.
2. SIGNIFICANT ACCOUNTING POLICIES (a) Basis of accounting
The financial statements have been prepared under the historical cost convention, modified by the revaluation of financial assets at fair value through profit or loss, and in accordance with the Statement of Recommended Accounting Practice 7 "Reporting Framework for Unit Trusts" ("RAP 7") issued by the Institute of Certified Public Accountants of Singapore. The financial statements are expressed in Singapore dollars.
(b) Recognition of income Dividend income is recognised when the right to receive payment is established. Interest
income is recognised on a time proportion basis using the effective interest method. (c) Investments
Investments are classified as financial assets at fair value through profit or loss. (i) Initial recognition
Purchase of investments are recognised on the trade date. Investments are recorded at fair value on initial recognition.
(ii) Subsequent measurement
Investments are subsequently carried at fair value. Net change in fair value on investments are included in the Statement of Total Return in the year in which they arise.

SINGAPORE INDEX FUND (Constituted under a Trust Deed in the Republic of Singapore)
NOTES TO THE FINANCIAL STATEMENTS For the financial year ended 30 June 2010
8
2. SIGNIFICANT ACCOUNTING POLICIES (continued) (c) Investments (continued)
(iii) Derecognition Investments are derecognised on the trade date of disposal. The resultant realised
gains and losses on the sales of investments are computed on the basis of the difference between the weighted average carrying amount and selling price net of transaction costs, and are taken up in the Statement of Total Return.
(d) Basis of valuation of investments
The fair value of financial instruments traded in active markets is based on quoted market prices at the balance sheet date. The quoted market price for these investments held by the Fund is the current market quoted bid price.
(e) Foreign currency translation
(i) Functional and presentation currency
The Fund operates from Singapore with the subscriptions and redemptions of the units denominated in Singapore dollars. The performance of the Fund is measured and reported to the investors in Singapore dollars. The Manager considers the Singapore dollars as the currency of the primary economic environment in which the Fund operates. The financial statements are presented in Singapore dollars, which is the Fund’s functional and presentation currency.
(ii) Transactions and balances Foreign currency transactions are translated into the functional currency using the
exchange rates prevailing at the dates of the transactions. Foreign exchange gains and losses resulting from the settlement of such transactions and from the translation at year-end exchange rates of monetary assets and liabilities denominated in foreign currencies are recognised in the Statement of Total Return. Non-monetary items that are measured at fair values in foreign currencies are translated using the exchange rates at the date when the fair values are determined. Currency translation differences on non-monetary items classified as financial assets at fair value through profit and loss are reported as part of the fair value gains or losses in the Statement of Total Return.
(f) Expenses charged to the Fund
All direct expenses relating to the Fund are charged directly to the Statement of Total Return. In addition, certain expenses shared by all unit trusts managed by the Manager are allocated to each fund based on the respective fund's net asset values.
SINGAPORE INDEX FUND (Constituted under a Trust Deed in the Republic of Singapore)
NOTES TO THE FINANCIAL STATEMENTS For the financial year ended 30 June 2010
9
2. SIGNIFICANT ACCOUNTING POLICIES (continued)
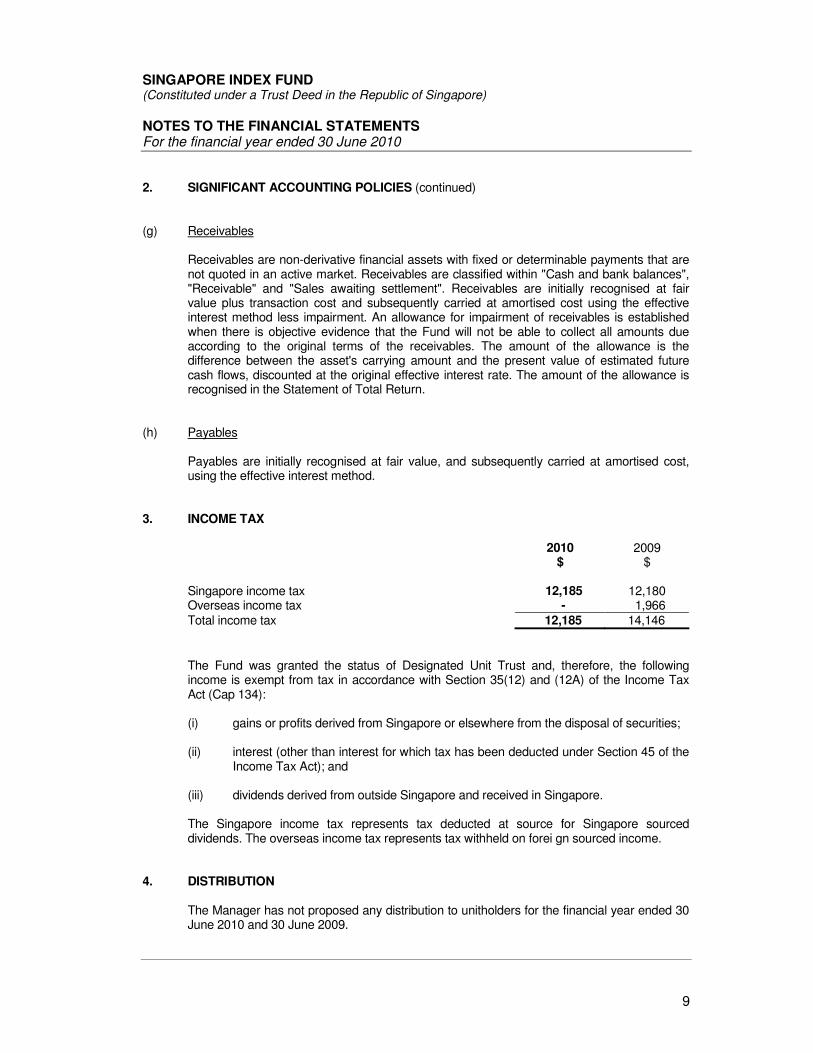
(g) Receivables
Receivables are non-derivative financial assets with fixed or determinable payments that are not quoted in an active market. Receivables are classified within "Cash and bank balances", "Receivable" and "Sales awaiting settlement". Receivables are initially recognised at fair value plus transaction cost and subsequently carried at amortised cost using the effective interest method less impairment. An allowance for impairment of receivables is established when there is objective evidence that the Fund will not be able to collect all amounts due according to the original terms of the receivables. The amount of the allowance is the difference between the asset's carrying amount and the present value of estimated future cash flows, discounted at the original effective interest rate. The amount of the allowance is recognised in the Statement of Total Return.
(h) Payables
Payables are initially recognised at fair value, and subsequently carried at amortised cost, using the effective interest method.
3. INCOME TAX 2010
$ 2009
$ Singapore income tax 12,185 12,180 Overseas income tax - 1,966 Total income tax 12,185 14,146
The Fund was granted the status of Designated Unit Trust and, therefore, the following
income is exempt from tax in accordance with Section 35(12) and (12A) of the Income Tax Act (Cap 134):
(i) gains or profits derived from Singapore or elsewhere from the disposal of securities; (ii) interest (other than interest for which tax has been deducted under Section 45 of the
Income Tax Act); and
(iii) dividends derived from outside Singapore and received in Singapore. The Singapore income tax represents tax deducted at source for Singapore sourced
dividends. The overseas income tax represents tax withheld on forei gn sourced income. 4. DISTRIBUTION The Manager has not proposed any distribution to unitholders for the financial year ended 30
June 2010 and 30 June 2009.

SINGAPORE INDEX FUND (Constituted under a Trust Deed in the Republic of Singapore)
NOTES TO THE FINANCIAL STATEMENTS For the financial year ended 30 June 2010
10
5. RECEIVABLES 2010 2009 $ $ Dividends receivable 204,255 22,135 204,255 22,135
6. PAYABLES 2010 2009 $ $ Amount due to unitholders 108,172 34,340 Amount due to Manager 141,452 98,986 Amount due to Trustee 13,983 10,586 Other accruals for operating expenses 40,177 32,241 303,784 176,153
7. NET ASSETS ATTRIBUTABLE TO UNITHOLDERS 2010 2009 $ $ At the beginning of the financial year 69,752,067 85,895,881 Operations Change in net assets attributable to unitholders
resulting from operations
16,210,771
(15,348,847) Unitholders’ contributions/(withdrawals) Creation of units 44,115 1,419,019 Cancellation of units (2,603,655) (2,213,986) Change in net assets attributable to unitholders resulting
from net creation and cancellation of units (2,559,540) (794,967) Total increase/(decrease) in net assets attributable to
unitholders
13,651,231
(16,143,814) At the end of the financial year 83,403,298 69,752,067
Units in issue (Note 8) 49,052,960 50,599,089
$ $ Net assets attributable to unitholders per unit 1.700 1.379
8. UNITS IN ISSUE 2010 2009 Units at the beginning of the financial year 50,599,089 51,175,869 Units created 25,306 1,043,289 Units cancelled (1,571,435) (1,620,069) Units at the end of the financial year 49,052,960 50,599,089

SINGAPORE INDEX FUND (Constituted under a Trust Deed in the Republic of Singapore)
NOTES TO THE FINANCIAL STATEMENTS For the financial year ended 30 June 2010
11
9. FINANCIAL RISK MANAGEMENT
The Fund’s activities expose it to a variety of financial risk (including currency risk, interest rate risk and price risk), credit risk and liquidity risk. The Fund’s overall risk management programme seeks to minimise potential adverse effects on the Fund’s financial performance. The Fund may use financial futures contracts, financial options contracts and/or currency forward contracts subject to the terms of the Prospectus to moderate certain risk exposures. Specific guidelines on exposures to individual securities and certain industries are in place for the Fund at any time as part of the overall financial risk management to reduce the Fund’s risk exposures. The Fund’s assets principally consist of financial instruments such as equity investments, money market investments and cash. They are held in accordance with the published investment policies of the Fund. The allocation of assets between the various types of investments is determined by the Manager to achieve their investment objectives. (a) Market risk
Market risk is the risk of loss arising from uncertainty concerning movements in market prices and rates, including observable variables such as interest rates, credit spreads, exchange rates, and others that may be only indirectly observable such as volatilities and correlations. Market risk includes such factors as changes in economic environment, consumption pattern and investor’s expectation etc. which may have significant impact on the value of the investments. The Fund’s investments are substantially dependent on changes in market prices. The Fund’s investments are monitored by the Manager on a regular basis so as to assess changes in fundamentals and valuation. Although the Manager makes reasonable efforts in the choice of investments, events beyond reasonable control of the Manager could affect the prices of the underlying investments and hence the asset value of the Fund. Guidelines are set to reduce the Fund’s risk exposures to market volatility such as diversifying the portfolio by investing across various geographies, alternatively, the Fund may be hedged using derivative strategies.
(i) Foreign exchange risk
The Fund has monetary financial assets/liabilities denominated in currencies other than Singapore dollars and it may be affected favourably or unfavourably by exchange rate regulations or changes in the exchange rates between Singapore dollars and such other currencies. The Manager may at his discretion, implement a currency management strategy either to reduce currency volatility or to hedge the currency exposures of the Fund.

SINGAPORE INDEX FUND (Constituted under a Trust Deed in the Republic of Singapore)
NOTES TO THE FINANCIAL STATEMENTS For the financial year ended 30 June 2010
12
9. FINANCIAL RISK MANAGEMENT (continued)
(a) Market risk (continued) (i) Foreign exchange risk (continued)
The table below summarises the on-balance sheet exposure to currency risks for the Fund.
As at 30 June 2010 SGD USD Total $ $ $ Assets Portfolio of investments 72,066,191 10,019,291 82,085,482 Receivables 156,730 47,525 204,255 Cash and bank balances 846,690 570,655 1,417,345 Total Assets 73,069,611 10,637,471 83,707,082
Liabilities Payables 303,784 - 303,784
Net assets attributable to unitholders 83,403,298 - 83,403,298
Total Liabilities 83,707,082 - 83,707,082
Net currency exposure 10,637,471
As at 30 June 2009 SGD USD Total $ $ $ Assets Portfolio of investments 59,431,558 7,996,337 67,427,895 Receivables - 22,135 22,135 Cash and bank balances 1,849,690 628,500 2,478,190 Total Assets 61,281,248 8,646,972 69,928,220
Liabilities Payables 176,153 - 176,153
Net assets attributable to unitholders 69,752,067 - 69,752,067
Total Liabilities 69,928,220 - 69,928,220
Net currency exposure 8,646,972
Investments, which is the significant item in the balance sheet is exposed to currency risk and other price risk. Price risk sensitivity analysis includes the impact of currency risk on non-monetary investments. The Fund's net financial assets comprise significantly non-monetary investments, hence currency risk sensitivity analysis has not been performed on the remaining financial assets.
SINGAPORE INDEX FUND (Constituted under a Trust Deed in the Republic of Singapore)
NOTES TO THE FINANCIAL STATEMENTS For the financial year ended 30 June 2010
13
9. FINANCIAL RISK MANAGEMENT (continued)
(a) Market risk (continued)
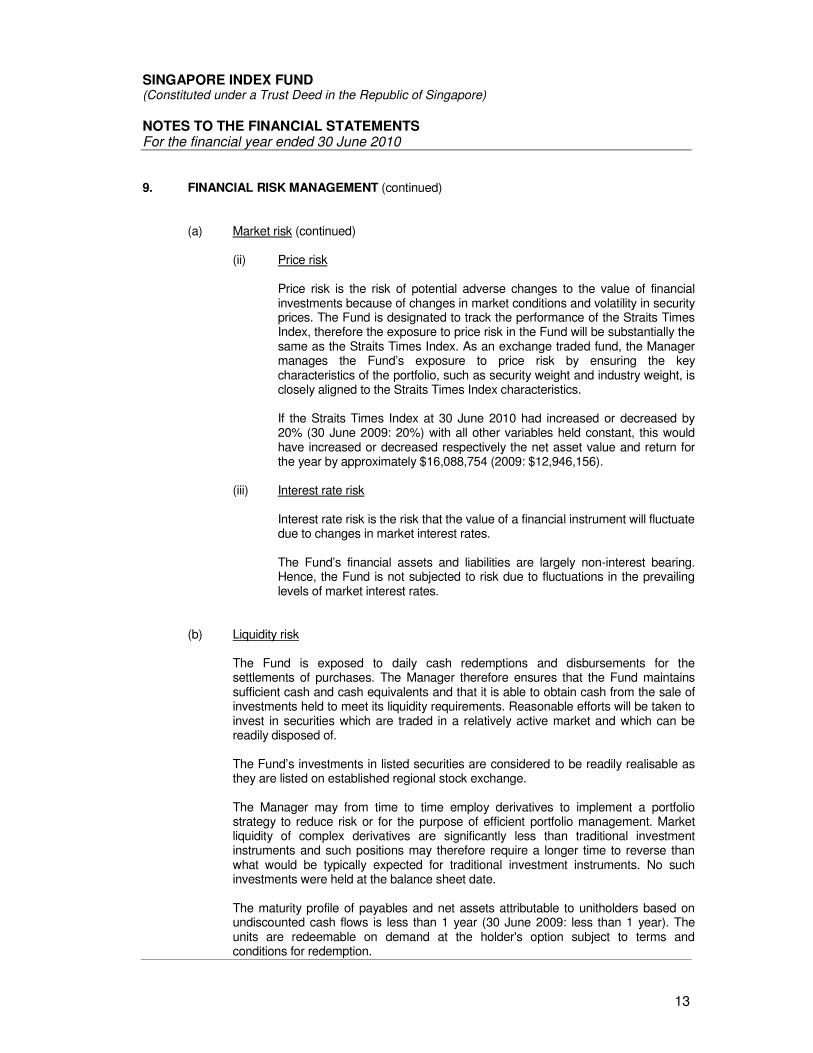
(ii) Price risk
Price risk is the risk of potential adverse changes to the value of financial investments because of changes in market conditions and volatility in security prices. The Fund is designated to track the performance of the Straits Times Index, therefore the exposure to price risk in the Fund will be substantially the same as the Straits Times Index. As an exchange traded fund, the Manager manages the Fund’s exposure to price risk by ensuring the key characteristics of the portfolio, such as security weight and industry weight, is closely aligned to the Straits Times Index characteristics.
If the Straits Times Index at 30 June 2010 had increased or decreased by 20% (30 June 2009: 20%) with all other variables held constant, this would have increased or decreased respectively the net asset value and return for the year by approximately $16,088,754 (2009: $12,946,156).
(iii) Interest rate risk
Interest rate risk is the risk that the value of a financial instrument will fluctuate due to changes in market interest rates.
The Fund’s financial assets and liabilities are largely non-interest bearing. Hence, the Fund is not subjected to risk due to fluctuations in the prevailing levels of market interest rates.
(b) Liquidity risk
The Fund is exposed to daily cash redemptions and disbursements for the settlements of purchases. The Manager therefore ensures that the Fund maintains sufficient cash and cash equivalents and that it is able to obtain cash from the sale of investments held to meet its liquidity requirements. Reasonable efforts will be taken to invest in securities which are traded in a relatively active market and which can be readily disposed of. The Fund’s investments in listed securities are considered to be readily realisable as they are listed on established regional stock exchange.
The Manager may from time to time employ derivatives to implement a portfolio strategy to reduce risk or for the purpose of efficient portfolio management. Market liquidity of complex derivatives are significantly less than traditional investment instruments and such positions may therefore require a longer time to reverse than what would be typically expected for traditional investment instruments. No such investments were held at the balance sheet date. The maturity profile of payables and net assets attributable to unitholders based on undiscounted cash flows is less than 1 year (30 June 2009: less than 1 year). The units are redeemable on demand at the holder's option subject to terms and conditions for redemption.

SINGAPORE INDEX FUND (Constituted under a Trust Deed in the Republic of Singapore)
NOTES TO THE FINANCIAL STATEMENTS For the financial year ended 30 June 2010
14
9. FINANCIAL RISK MANAGEMENT (continued)
(c) Credit risk
The Fund takes on exposure to credit risk, which is the risk that a counterparty will be unable to pay amounts in full when due. The Fund’s credit risk is concentrated on cash and bank balances, and amounts or securities receivable on the sale and purchase of investments respectively. In order to mitigate exposure to credit risk, all transactions in listed securities are settled/paid for upon delivery and transacted with approved counterparties using an approved list of brokers that are regularly assessed and updated by the Manager. As the Fund does not hold any collateral, the maximum exposure to credit risk for each class of financial instruments is the carrying amount of that class of financial instruments presented on the balance sheet. The Fund’s financial assets are neither past due nor impaired, representing cash and bank balances and receivables. Bank deposits and all the investments are held with a bank and a custodian respectively, that are part of a HSBC Group with a credit rating assigned by Moody's at 30 June 2010 is B+ (30 June 2009: B+). Receivables are substantially from companies with good collection track record with the Fund.
(d) Capital management
The Fund’s capital is represented by the net assets attributable to unitholders as the fund does not have any gearing. The Fund strives to invest the subscriptions of redeemable participating units in investments that meet the Fund’s investment objectives.
10. RELATED PARTY TRANSACTIONS
(a) The Manager and the Trustee of the Fund are Singapore Consortium Investment Management Limited and HSBC Institutional Trust Services (Singapore) Limited respectively. HSBC Institutional Trust Services (Singapore) Limited is a subsidiary of HSBC Holdings plc.
Management fee is paid to the Manager. Trustee fee is paid to the Trustee. These fees paid or payable by the Fund are shown in the Statement of Total Return and are on terms set out in the Trust Deed. All other related party transactions are shown elsewhere in the financial statements.
(b) As at the end of the financial year, the Fund maintained current accounts with HSBC
Group as follows: 2010 2009 $ $ Bank balances 1,417,345 2,478,190

SINGAPORE INDEX FUND (Constituted under a Trust Deed in the Republic of Singapore)
NOTES TO THE FINANCIAL STATEMENTS For the financial year ended 30 June 2010
15
10. RELATED PARTY TRANSACTIONS (continued)
(c) In addition to related party information shown elsewhere in the financial statements, the following significant transactions took place during the financial year between the Fund and related parties at terms agreed between the parties and within the provisions of the Trust Deed.
2010 2009 $ $
Brokerage expense on purchases and sales of investments charged by related companies of shareholders of the Manager 17,317 19,536
Transaction fee expense charged by the Trustee and its related company 4,365 3,825
Custody fee expense charged by a related company of the Trustee 35,924 26,543
Interest expense paid to a bank which is the related company of the Trustee - 268
Registration fee expense charged by a related company of the Trustee 22,903 55,410

SINGAPORE INDEX FUND (Constituted under a Trust Deed in the Republic of Singapore) NOTES TO THE FINANCIAL STATEMENTS For the financial year ended 30 June 2010
16
11. FINANCIAL RATIOS
2010 2009 Expense ratio
1 0.88% 0.98%
Turnover ratio
2 16.30% 23.66%
1 The expense ratio is computed in accordance with the IMAS guidelines on disclosure of expense ratios dated 25
May 2005. Brokerage and other transaction costs, interest expense, foreign exchange gains/losses, tax deducted at source or arising on income received and dividends paid to unitholders are not included in the expense ratio. The Fund does not pay any performance fees.
2 The portfolio turnover ratio is calculated in accordance with the formula stated in the "Code on Collective
Investment Schemes".
12. COMPARATIVE
Where necessary, comparative figures have been adjusted to conform to changes in presentation in the current year. For the financial year ended 30 June 2010, Goods and services tax (“GST”) component has been reclassified from “Management fees”, “Registrar fees” and “Trustee fees” to “Miscellaneous expenses” in the statement of total return. Similarly the GST components amounting to $27,600 from “Management fees”, $3,625 from “Registrar fees” and $2,905 from “Trustee fees” were also reclassified to Miscellaneous expenses for the year ended 30 June 2009.
13. AUTHORISATION OF FINANCIAL STATEMENTS
These financial statements were authorised for issue in accordance with a resolution of the Board of Directors of Singapore Consortium Investment Management Limited on 19 August 2010.

17
SINGAPORE INDEX FUND (Constituted under a Trust Deed in the Republic of Singapore) ANNUAL REPORT TO UNITHOLDERS FOR THE FINANCIAL YEAR ENDED 30 JUNE 2010 A) Fund Performance
Fund Performance/ Benchmark Returns
3 mth %
Growth
6 mth %
Growth
1 yr %
Growth
3 yr Ann
Comp Ret
5 yr Ann
Comp Ret
10 yr Ann
Comp Ret
Since
Inception 18 December
1996 Ann Comp
Ret
Singapore Index
Fund
-0.85
-1.29
23.40
-4.72
7.76
6.77
4.34
Benchmark
-0.61
-0.65
25.39
-4.26
7.06
5.03
2.91
Source: Lipper, a Thomson Reuters Company
Note: The performance returns of the Fund are in Singapore dollars based on a bid-to-bid price with net dividends reinvested.
The Benchmark of Singapore Index Fund since inception up to 23 Jan 2001 was the Business Times – Singapore Regional Index. The Benchmark of the Fund since 26 Jan 2001 is the Straits Times Index. The Benchmark was changed due to the change in the investment policy of the Fund to track the Straits Times Index instead of the Business Times - Singapore Regional Index.
For the full year ended 30 June 2010, the Fund rose 23.4% on a bid-to-bid basis, compared with the
benchmark Straits Times Index which rose 25.4% during the same period.
Market and Portfolio Review
The Singapore stock market continued to recover from the lows made in March 2009 and maintained its
upward momentum for the rest of 2009 as investors were encouraged by the global economic recovery.
The first half of 2010 was however disappointing as market sentiment was weighed down by China’s
policy tightening as well as the European sovereign debt crisis. The uncertain outlook in Europe led to
heightened volatility in the global equity markets. Investors were concerned that the global economic
recovery could be derailed, even resulting in a double-dip recession.
Over the 12-month period under review, the Straits Times index had 2 index reviews and rebalancing.
The first index review was done in September 2009 and no changes to the index were made. In the
second index review done in March 2010, CapitaMalls Asia was included in the list of constituents
while Cosco Corp was excluded.
18
In the last 12 months, all but one of the index components rose. The lone exception was Capitaland
Limited, which was down 1.7% due to a combination of domestic policy moves to reduce speculative
pressures on the property market and the company’s property portfolio exposure to China, where
sentiment was negatively impacted by the Chinese authorities’ introduction of draconian measures to
prevent a property asset bubble.
The top three performers in the first six months of the review period, namely Genting Singapore,
Jardine Cycle & Carriage and Noble Group, continued to perform well and they remained the top
three performers out of the 30 index constituents over the full 12 months. Genting Singapore was up
79.8%, Jardine Cycle & Carriage was up 56.3% and Noble Group was up 45.2%. The best
performer, Genting Singapore, was buoyed by the successful opening of its Resorts World Sentosa
(RWS) integrated resort in February 2010. Although it is still early days, initial numbers from the RWS
integrated resort operations have been very positive, underpinned by the 1,200 slot machines in
operations. The number of visitors to Singapore has also increased significantly and the Singapore
Tourism Board is now projecting some 11.5m to 12.5m visitors to Singapore in 2010, a year-on-year
increase of 20-30%. The improved visitation to Singapore can be partially attributed to the two new
integrated resorts.
Jardine Cycle & Carriage’s stock performance was driven by the sharp rally of its Indonesian
subsidiary Astra International, which contributes 90% to its earnings and 95% of its market value.
Noble Group’s stock performance was underpinned by the broad recovery in demand for commodities,
the growth prospects in its coal, oil & gas and grains business, and the incremental investments in the
coal mining and agriculture segments.
On the economic front, Singapore has been firing on all cylinders. After an exceptionally strong gain of
15.5% y-o-y in 1Q10, the Singapore economy reported a record-breaking pace of expansion of 19.3%
y-o-y in 2Q10. As a result, the official government GDP forecast for 2010 has been revised sharply
higher to between 13.0%-15.0%. Monthly economic indicators continue to surge robustly despite some
concerns about softer exports and manufacturing due to the Europe debt crisis. The Eurozone region
accounts for about 14.5% of Singapore’s total non-oil domestic exports, larger than the share of the US,
at 10.8%. The direct impact of a slowdown in Europe’s growth to Singapore’s robust economic growth
would probably be limited, and not cause the domestic economy to slow significantly or suddenly.
Market Outlook
Continued uncertainty over Europe’s debt crisis and policy tightening in China is likely to keep global
equity markets volatile over the near term. Although the continued volatility in financial markets would
affect market sentiments and potentially impact business and consumer confidence, we are of the view
that an economic slowdown is more likely than a double-dip recession scenario. The uncertain outlook
in Europe has clouded the outlook for the second half of 2010. While economy fundamentals and

19
corporate profits remain intact, earnings visibility has diminished. The openness of the Singapore
economy makes the Singapore equity market vulnerable to sell-offs whenever there are global growth
concerns.
Despite the roller-coaster period suffered by investors in 1H10, we maintain our view that this is a
cyclical bull market correction. Singapore currently trades at 14.0x trailing 12months P/E, slightly below
the 10-year historical average of 15.0x. Valuations are reasonable, especially as domestic interest rates
seem likely to remain low in the near term. From our perspective, based on our top-down (mean
Price/Book of 1.75x on 2010 book) and bottom-up approach, we derive a fair value for the Straits Times
Index at 3,200. Based on the FSSTI closing level of 2,835.51 on 30 June 2010, this suggests a possible
upside of 12.9% by the end of 2010.

20
SINGAPORE INDEX FUND (Constituted under a Trust Deed in the Republic of Singapore)
B) Investments at fair value and as a percentage of NAV as at 30 June 2010 under review classified by
i) Country Fair Value % of NAV
$
Hong Kong 12,503,586 14.99
Singapore 69,581,896 83.44
Portfolio of investments 82,085,482 98.43
Other net assets 1,317,816 1.57
Total 83,403,298 100.00
ii) Industry Fair Value % of NAV
$
Consumer Discretionary 5,253,863 6.30
Consumer Staple 9,148,859 10.97
Financials 25,886,826 31.04
Industrials 21,094,934 25.30
Real Estate 10,864,056 13.02
Real Estate Investment Trust 1,432,716 1.72
Telecommunications 8,404,228 10.08
Portfolio of investments 82,085,482 98.43
Other net assets 1,317,816 1.57
Total 83,403,298 100.00
iii) Asset Class
Fair value
at Percentage of
total net assets at Percentage of
total net assets at
30 June 2010 30 June 2010 30 June 2009 $ % %
Equities 82,085,482 98.43 96.67
Cash Equivalents 1,317,816 1.57 3.33
Total 83,403,298 100.00 100.00
iv)
Credit rating of debt securities
Not applicable

21
C) Top Ten Holdings
The top 10 holdings as at 30 June 2010 and 30 June 2009
10 largest holdings at 30 June 2010
Fair Value
$
Percentage of total net assets attributable
to unitholders %
Singapore Telecommunications Limited 7,902,513 9.48
DBS Group Holdings Limited 7,646,185 9.17
United Overseas Bank Limited 7,347,210 8.81
Oversea-Chinese Banking Corporation 7,154,366 8.58
Wilmar International Limited 4,817,950 5.78
Jardine Matheson Holdings Limited 4,081,705 4.89
Capitaland Limited 3,906,000 4.68
Hongkong Land Holdings Limited 3,844,776 4.61
Keppel Corporation Limited 3,293,750 3.95
City Developments Limited 3,113,280 3.73
10 largest holdings at 30 June 2009
Fair Value
$
Percentage of total net assets attributable
to unitholders %
Singapore Telecommunications Limited 8,579,688 12.30
DBS Group Holdings Limited 7,359,555 10.55
United Overseas Bank Limited 5,999,179 8.60
Oversea-Chinese Banking Corporation 5,749,277 8.24
Capitaland Limited 4,210,850 6.04
Jardine Matheson Holdings Limited 3,317,778 4.76
Hongkong Land Holdings Limited 3,125,408 4.48
Keppel Corporation Limited 2,977,350 4.27
Singapore Airlines Limited 2,847,452 4.08
Singapore Exchange Limited 2,747,375 3.94
D) Exposure to Derivatives
i) Fair value of derivative contracts and as a percentage of NAV as at 30 June 2010
Not applicable
ii) Net gains/(losses) on derivative contracts realised during the financial year ended 30 June
2010
Not applicable
iii) Net gains/(losses) on outstanding derivative contracts marked to market as at 30 June 2010
Not applicable

22
E) Investments in other unit trusts, mutual funds and collective investment schemes as at
30 June 2010
Real Estate Investment Trust
Fair value at 30 June 2010
$
Percentage of total net assets attributable to unitholders at 30 June 2010
%
Capitamall Trust Real Estate Investment Trust 1,432,716 1.72
F) Amount and percentage of borrowings to net asset value (NAV) as at 30 June 2010
Not applicable G) Amount of redemptions and subscriptions for the period 01 July 2009 to 30 June 2010
Total amount of subscriptions SGD 44,115
Total amount of redemptions SGD 2,603,655
H) Amount of related party transactions for the period 01 July 2009 to 30 June 2010
$
Brokerage expense on purchases and sales of investments charged by related companies of shareholders of the Manager 17,317
Transaction fee expense charged by the Trustee and its related company 4,365
Custody fee expense charged by a related company to the Trustee 35,924
Registrar fee expense charged by a related company of the Trustee 22,903
I) Expense ratios
30 June 2010 0.88%
30 June 2009 0.98%
Note:
The expense ratio is computed in accordance with the IMAS guidelines on disclosure of expense ratios dated 25 May 2005. Brokerage and other transaction costs, interest expense, foreign exchange gains/losses, tax deducted at source or arising on income received and dividends paid to unitholders are not included in the expense ratio. The Fund does not pay any performance fees.

23
J) Turnover ratios
30 June 2010 16.30%
30 June 2009 23.66%
Note:
The portfolio turnover ratio is calculated in accordance with the formula stated in the "Code on Collective Investment Schemes".
K)
Other material information
There is no material information that will adversely impact the valuation of the Fund.
L) Supplemental information on underlying sub-funds where the scheme invests more than 30%
of its deposited property in another scheme
Not applicable
M) Soft dollar commissions/arrangements received by the Manager
Not applicable

24
DETAILS OF TOP 10 HOLDINGS
As at 30 June 2010
Cost SGD
Percentage of share capital
owned %
Dividends received
SGD Dividend
cover ratio Singapore Telecommunications Limited 7,254,591 0.0164
360,830.79 1.73
DBS Group Holdings Limited 6,248,740 0.0243
321,860.00 1.60
United Overseas Bank Limited 3,913,612 0.0243
231,468.00 1.98
Oversea-Chinese Banking Corporation 4,503,405 0.0246
228,304.86 2.09
Wilmar International Limited 5,141,291 0.0131
55,430.00 5.20
Jardine Matheson Holdings Limited 3,233,841 0.0129
105,486.29 2.80
Capitaland Limited 3,195,237 0.0255
113,925.00 2.36
Hongkong Land Holdings Limited 2,633,877 0.0244 132,458.54 4.56
Keppel Corporation Limited 1,598,333 0.0242 153,850.00 2.68
City Developments Limited 2,557,584 0.0310
22,560.00 7.98
SUMMARY OF INVESTMENT PORTFOLIO
30 June 2010 30 June 2009
Cost / Fair Value Cost / Fair Value
SGD SGD
Quoted Investments:
Cost 60,185,809 58,482,172
Unrealised gain on investments 21,899,673 8,945,723
Net Book Value 82,085,482 67,427,895
INFORMATION ON THE PARTICULARS OF THE INVESTMENT MANAGER The investment manager of the Singapore Index Fund is Singapore Consortium Investment Management Limited which has appointed UOB Asset Management Limited as its administrator with effect from 12 August 2009. The fee payable to the administrator is based on a percentage of the value of the Singapore Index Fund. By Order of the Board
LEO HEE WUI Company Secretary 19 August 2010