Embed Size (px)
Citation preview
The Pennsylvania State University
The Graduate School
Department of Agricultural and Biological Engineering
SIMULTANEOUS SACCHARIFICATION AND FERMENTATION OF WASTE
POTATO MASH TO ETHANOL BY ASPERGILLUS NIGER AND
SACCHAROMYCES CEREVISIAE IN BIOFILM REACTORS
A Dissertation in
Agricultural and Biological Engineering
by
Gulten Izmirlioglu
2016 Gulten Izmirlioglu
Submitted in Partial Fulfillment
of the Requirements
for the Degree of
Doctor of Philosophy
December 2016
The dissertation of Gulten Izmirlioglu was reviewed and approved* by the following:
Ali Demirci
Professor of Agricultural and Biological Engineering
Dissertation Advisor
Chair of Committee
Virendra M. Puri
Distinguished Professor of Agricultural and Biological Engineering
Thomas L. Richard
Professor of Agricultural and Biological Engineering
Chitrita DebRoy
Clinical Professor of Veterinary and Biomedical Sciences
Paul H. Heinemann
Professor of Agricultural and Biological Engineering
Head of the Department of Agricultural and Biological Engineering
*Signatures are on file in the Graduate School

iii
ABSTRACT
Bioethanol production is of great interest to meet the renewable energy demand and
reduce the negative environmental impacts of petroleum fuel while providing energy
security for countries. In order to make ethanol production cost-competitive, inexpensive,
and easily available feedstocks are needed as well as novel processing technologies with
higher productivities. Industrial wastes are of great interest as a substrate in production of
value-added products to reduce the cost, while managing the waste economically and
environmentally. Therefore, bio-ethanol production from industrial wastes has gained
attention because of its abundance, availability, and rich carbon and nitrogen content. Part of
the production cost also includes cost of the enzymes needed for the saccharification step
during the starch hydrolyzation, which can be a significant cost depending on the
enzymes’ performances. On the other hand, to achieve high productivity, medium
optimization, culture conditions, integrated fermentation methods, and reactor design
should be considered. Thus, novel approaches for bioethanol production from starchy
industrial wastes have gained attention not only to reduce the production cost, but also to
maximize the ethanol productivity.
This dissertation aimed to reduce the cost of ethanol production with utilization of
starchy waste of potato industry, and evaluate the simultaneous saccharification and
fermentation process with a fungal co-culture to eliminate purchased enzyme costs, and,
finally, to increase the productivity of ethanol fermentation, in particular by cell
immobilization in biofilm reactors. Therefore, medium optimization for co-culture was
considered to improve production of ethanol in this study, which was neglected for co-
culture so far in the literature. Furthermore, first time simultaneous saccharification and
fermentation by co-culture in biofilm reactors was employed to achieve the goal.
Glucoamylase is one of the most common enzymes used in the starch industry to break
down the starch into its monomers. Glucoamylase production and its activity are highly
dependent on medium composition. Therefore, in this study, medium optimization for

iv
glucoamylase production was considered to improve the glucoamylase activity. Four
fungi were screened for amylase production, and Aspergillus niger van Tieghem was
found to be the best glucoamylase-producing fungus. Then, a statistical design, Plackett-
Burman design, was used to screen various medium ingredients for glucoamylase
production by A. niger, and malt extract, FeSO4·7H2O, and CaCl22H2O were found to
have significant effects on the glucoamylase production. Finally, malt extract,
FeSO4·7H2O, and CaCl22H2O were optimized by using another statistical design,
response surface methodology. The results showed that the optimal medium composition
for A. niger van Tieghem was 50 g/L of industrial waste potato mash supplemented with
51.82 g/L of malt extract, 9.27 g/L of CaCl22H2O, and 0.50 g/L of FeSO4 7H2O . At
the end of the optimization, glucoamylase activity and glucose production were improved
126 and 98% compared to only industrial waste potato mash basal medium and 274.4
U/ml glucoamylase activity and 41.7 g/L glucose levels were achieved, respectively.
Additionally, the effect of various medium components on ethanol production by
Saccharomyces cerevisiae was evaluated. Yeast extract, malt extract, and
MgSO4·7H2O showed significantly positive effects among the screened medium
components, whereas KH2PO4 and CaCl2·2H2O had a significantly negative effect
(p-value < 0.05). Using response surface methodology, a medium consisting of 40.4
g/L (dry basis) industrial waste potato, 50 g/L malt extract, and 4.84 g/L
MgSO4·7H2O was found optimal and yielded 24.6 g/L ethanol at 30 °C, 150 rpm, and
48 h of fermentation.
Later, a fermentation medium for simultaneous saccharification and fermentation (SSF)
by co-culture of Aspergillus niger and Saccharomyces cerevisiae using potato wastes was
developed. The medium consisted of waste potato mash, malt extract and FeSO47H2O
were found to be a promising medium for co-culture of A. niger and S. cerevisiae SSF.
Statistical optimization of the developed medium was conducted using central composite
design. Optimization results suggested that optimum concentrations of industrial waste
potato mash, malt extract, and FeSO47H2O were 92.37 g/L, 59.42 g/L and 0.159 g/L,
v
respectively. Under the optimal medium, 35.19 g/L ethanol production and 31.36 U/ml
enzyme activity were equivalent to a yield of 0.38 g ethanol/g starch and 0.34 U/ g starch
respectively, achieved at 30°C and 120 h of fermentation .
Biofilm reactor was used as a novel approach for production of bioethanol from potato
waste hydrolysate by optimizing the growth parameters for Saccharomyces cerevisiae in
biofilm reactor. To start with, plastic composite supports (PCS) were evaluated in order
to accomplish successful biofilm formation and the PCS composed of polypropylene,
soybean hull, soybean flour, yeast extract, and salts was selected for ethanol fermentation
with S. cerevisiae. Then, Box-Behnken design of response surface method (RSM) was
employed to optimize the growth parameters, pH, temperature, and agitation. Optimum
conditions for ethanol fermentation were found to be pH 4.2, temperature 34 ºC, and 100
rpm resulting 37.05 g/L ethanol with a 2.31 g/L/h productivity and 92.08% theoretical
yield. The results indicated that biofilm reactors with PCS can enhance the ethanol
fermentation from industrial potato wastes.
Finally, simultaneous saccharification and fermentation (SSF) of ethanol by co-cultures
of Aspergillus niger and Saccharomyces cerevisiae was studied in a potato waste based
medium by using biofilm reactors. The plastic composite supports (PCS) were studied for
biofilm formation. Effects of temperature, pH, and aeration rates in biofilm reactors were
evaluated by response surface methodology and the optimal conditions were found to be
35 ºC, pH 5.8, and no aeration. The maximum ethanol concentration of 37.93 g/L was
achieved at the end of 72h fermentation, with a 0.41 g ethanol /g starch yield. To finish,
biofilm formation of co-culture on PCS was also evaluated by scanning electron
microscope.
In conclusion, glucoamylase and ethanol productions were improved by medium
optimization, with significant increases observed in glucoamylase and ethanol
production. Similarly, the medium developed for SSF co-culture improved ethanol
production. The biofilm reactors constructed with PCS enhanced ethanol production not

vi
only for a single culture of S. cerevisiae but also for the co-culture after growth
optimization. These results indicated that PCS can be utilized for SSF processes for
ethanol production in biofilm reactors with co-cultures by using starchy industrial wastes.

vii
TABLE OF CONTENTS
List of Figures .............................................................................................................. ...xiii
List of Tables ............................................................................................................... ..xvii
Acknowledgements ...................................................................................................... ...xix
Technical Acknowledgements.........................................................................................xxi
1 INTRODUCTION..........................................................................................................1
2 LITERATURE REVIEW........................................................................................................4
2.1 Bioethanol..............................................................................................................4
2.1.1 Worldwide Production of Bioethanol........................................................6
2.1.2 Feedstock for Bioethanol Fermentation.....................................................7
2.1.2.1 First Generation Bioethanol.................................................................8
2.1.2.2 Second Generation Bioethanol...........................................................12
2.1.2.3 Third Generation Bioethanol..............................................................15
2.1.3 Ethanologenic Yeast and Bacteria............................................................17
2.2 Amylases..............................................................................................................22
2.2.1 Function of Amylases...............................................................................22
2.2.2 Production of Amylases..........................................................................24
2.2.3 Amylase Producing Microorganisms.......................................................26
2.2.4 Applications of Amylases........................................................................27
2.3 Bioreactor Design.................................................................................................28
2.3.1 Batch Processes........................................................................................28
2.3.2 Fed-Batch Processes................................................................................30
2.3.3 Continuous Fermentation Process............................................................30
2.3.4 Integrated Processes.................................................................................31
2.3.4.1 Simultaneous Saccharification and Fermentation (SSF).....................32
2.3.4.2 Co-culture Fermentation......................................................................32

viii
2.4 Cell Immobilization.............................................................................................34
2.5 Principles of Biofilm............................................................................................35
2.5.1 Biofilm Formation and Structure.............................................................36
2.5.2 Biofilm Reactors......................................................................................38
2.5.3 Biofilm Support Materials.......................................................................39
2.5.4 Applications of Biofilm Reactors in Bioethanol Production...................41
2.5.5 Benefits and Limitations of Biofilm Reactors.........................................43
2.6 Industrial Potato Waste........................................................................................45
2.6.1 Ethanol Fermentation by using Potato Waste..........................................47
2.7 Statistical Designs................................................................................................50
2.8 State-of-the-Art....................................................................................................52
2.9 References............................................................................................................54
3 STRAIN SELECTION AND MEDIUM OPTIMIZATION FOR
GLUCOAMYLASE PRODUCTION FROM INDUSTRIAL
POTATO WASTE BY ASPERGILLUS NIGER.....................................................68
3.1 Abstract.................................................................................................................68
3.2 Introduction..........................................................................................................69
3.3 Materials and Methods.........................................................................................72
3.3.1 Microorganisms and inoculum preparation............................................72
3.3.2 Industrial waste potato mash..................................................................72
3.3.3 Strain selection.......................................................................................73
3.3.4 Evaluation of medium ingredients.........................................................73
3.3.5 Medium optimization.............................................................................75
3.3.6 Analysis..................................................................................................76
3.3.6.1 Glucose................................................................................................76
3.3.6.2 Glucoamylase activity.........................................................................76
3.3.6.3 Statistical analyses..............................................................................77
3.4 Results and Discussion........................................................................................77
3.4.1 Strain selection.......................................................................................77

ix
3.4.2 Evaluation of significant medium ingredients affecting
glucoamylase production........................................................................79
3.4.3 Optimization of medium composition by
central composite design.........................................................................82
3.5 Conclusions..........................................................................................................87
3.6 References............................................................................................................88
4 ENHANCED BIO-ETHANOL PRODUCTION FROM INDUSTRIAL
POTATO WASTE BY STATISTICAL MEDIUM
OPTIMIZATION.......................................................................................................92
4.1 Abstract................................................................................................................92
4.2 Introduction..........................................................................................................93
4.3 Experimental Section...........................................................................................95
4.3.1 Microorganisms and Inoculum Preparation...........................................95
4.3.2 Industrial Waste Potato Mash.................................................................95
4.3.3 Hydrolysis of Starch...............................................................................96
4.3.4 Experimental Design..............................................................................96
4.3.4.1 Plackett-Burman Design......................................................................96
4.3.4.2 Response Surface Methodology..........................................................98
4.3.5 Analysis..................................................................................................99
4.3.5.1 Ethanol and Glucose............................................................................99
4.3.5.2 Microbial Cell Population...................................................................99
4.3.5.3 Dry Weight Analysis...........................................................................99
4.4 Results................................................................................................................100
4.4.1 Effects of Medium Components on Ethanol
Production.............................................................................................100
4.4.2 Optimization of the Selected Medium Components
Using Response Surface Methodology.................................................102
4.5 Discussion...........................................................................................................108
4.6 Conclusion..........................................................................................................111

x
4.7 References..........................................................................................................111
5 IMPROVED SIMULTANEOUS SACCHARIFICATION AND
FERMENTATION OF BIOETHANOL FROM INDUSTRIAL
POTATO WASTE WITH CO-CULTURES OF ASPERGILLUS NIGER
AND SACCHAROMYCES CEREVISIAE BY MEDIUM
OPTIMIZATION.....................................................................................................115
5.1 Abstract..............................................................................................................115
5.2 Introduction........................................................................................................116
5.3 Materials and Methods.......................................................................................119
5.3.1 Microorganisms and inoculum preparation..........................................119
5.3.2 Industrial waste potato mash................................................................119
5.3.3 Experimental design.............................................................................120
5.3.3.1 Selection of medium composition.....................................................120
5.3.3.2 Statistical medium optimization........................................................121
5.3.4 Analysis................................................................................................121
5.3.4.1 Ethanol and glucose...........................................................................121
5.3.4.2 Enzyme activity.................................................................................122
5.3.4.3 Dry weight analysis...........................................................................122
5.3.4.4 Statistical analyses.............................................................................122
5.4 Results and Discussion.......................................................................................123
5.4.1 Selection of medium composition........................................................123
5.4.2 Optimization of the selected medium using response
surface methodology............................................................................124
5.5 Conclusions........................................................................................................130
5.6 References..........................................................................................................131

xi
6 ETHANOL PRODUCTION IN BIOFILM REACTORS FROM
POTATO WASTE HYDROLYSATE AND OPTIMIZATION OF GROWTH
PARAMETERS FOR SACCHAROMYCES
CEREVISIAE............................................................................................................134
6.1 Abstract..............................................................................................................134
6.2 Introduction........................................................................................................135
6.3 Materials and Methods.......................................................................................137
6.3.1 Microorganism and medium.................................................................137
6.3.2 Preparation of waste potato mash hydrolysate.....................................138
6.3.3 Plastic composite support (PCS)..........................................................138
6.3.4 Culture tube fermentation for PCS selection........................................139
6.3.5 Ethanol fermentation in biofilm reactors..............................................140
6.3.6 Analysis................................................................................................141
6.3.6.1 Cell Population determination on PCS..............................................141
6.3.6.2 Ethanol and glucose...........................................................................142
6.3.6.3 Sugar Analysis...................................................................................142
6.3.6.4 Scanning Electron Microscope (SEM)..............................................143
6.3.6.5 Statistical Analysis.............................................................................143
6.4 Results and Discussion.......................................................................................143
6.4.1 PCS Selection........................................................................................143
6.4.2 Optimization of growth parameters by response surface
method in biofilm reactor.....................................................................145
6.4.3 SEM Evaluation....................................................................................151
6.5 Conclusions........................................................................................................153
6.6 References..........................................................................................................154
7 SIMULTANEOUS SACCHARIFICATION AND FERMENTATION
OF ETHANOL FROM POTATO WASTE BY CO-CULTURES OF
ASPERGILLUS NIGER AND SACCHAROMYCES CEREVISIAE
IN BIOFILM REACTORS......................................................................................157

xii
7.1 Abstract..............................................................................................................157
7.2 Introduction........................................................................................................158
7.3 Materials and Methods.......................................................................................160
7.3.1 Microorganisms and media...................................................................160
7.3.2 Plastic composite support (PCS)...........................................................161
7.3.3 Culture tube fermentation for PCS selection........................................162
7.3.4 SSF in biofilm reactor...........................................................................163
7.3.5 Analysis................................................................................................164
7.3.5.1 Biomass on PCS................................................................................164
7.3.5.2 Ethanol and glucose...........................................................................165
7.3.5.3 Enzyme Activity................................................................................166
7.3.5.4 Sugar Analysis...................................................................................166
7.3.5.5 Scanning Electron Microscope (SEM)..............................................166
7.3.5.6 Statistical Analysis............................................................................167
7.4 Results and Discussion......................................................................................167
7.4.1 PCS Selection.......................................................................................167
7.4.2 Optimization of growth parameters by response surface method in
biofilm reactor......................................................................................170
7.4.3 SEM Evaluation....................................................................................176
7.5 Conclusions........................................................................................................179
7.6 References..........................................................................................................179
8 CONCLUSION AND SCOPE FOR FUTURE RESEARCH..................................182

xiii
LIST OF FIGURES
Figure 2.1 Global ethanol production by country or region and years..............................6
Figure 2.2 Representative structure of amylose and amylopectin....................................10
Figure 2.3 Ethanol productions from starchy materials...................................................11
Figure 2.4 Ethanol productions from lignocellulosic material.........................................13
Figure 2.5 Bioethanol production from algal biomass.....................................................16
Figure 2.6 Simplified model of anaerobic fermentation of glucose to ethanol................18
Figure 2.7 Ethanol fermentation by Z. mobilis.................................................................20
Figure 2.8 Engineered microorganisms for ethanol production from pentose.................21
Figure 2.9 Enzymatic degradation of starch....................................................................23
Figure 2.10 Overview of the industrial processing of starch to its monomers................27
Figure 2.11 Formation of biofilms...................................................................................37
Figure 2.12 Biofilm Structure: (a) heterogeneous model, (b) heterogeneous mosaic
model, and (c) mushroom model.........................................................................38
Figure 2.13 Zoom-in of how a potato starch tuber is built-up.........................................46
Figure 2.14 Illustration of central composite design........................................................51
Figure 2.15 Representation of Box-Behnken design......................................................52
Figure 3.1 Comparisons of glucose production and glucoamylase activity of
Aspergillus strains at 72 h....................................................................................77
Figure 3.2 Glucoamylase activity and glucose production by A. niger NRRL 330
on industrial potato mash waste..........................................................................79

xiv
Figure 3.3 Surface plots of model regression equation for glucoamylase (U/mL) in
response to the interactions of malt extract, CaCl22H2O, and FeSO47H2O......85
Figure 3.4 Surface plots of model regression equation for glucoamylase
(U/mL) in esponse to the interactions of malt extract, CaCl22H2O, and
FeSO47H2O.........................................................................................................86
Figure 4.1 Plackett-Burman counter plots showing individual effects of statistically
significant factors on bio-ethanol production...................................................102
Figure 4.2 Response surface and contour plots for ethanol production showing the
interaction of malt extract and MgSO4·7H2O concentrations and their effects on
the bio-ethanol production.................................................................................105
Figure 4.3 Response surface and contour plots for cell population showing the
interaction of malt extract and yeast extract concentrations and their effects
on the cell population.........................................................................................106
Figure 4.4 Bio-ethanol production and glucose consumption using the statistically
optimized medium..............................................................................................107
Figure 5.1 Tukey comparison test results for medium selection when ethanol is the
response..............................................................................................................124
Figure 5.2 Response surface plots showing the interactions of waste potato mash
(WPM), malt extract and FeSO47H2O concentrations and their effect on the
bio-ethanol production.......................................................................................127
Figure 5.3 Contour plots showing the effect of waste potato mash, malt extract and
FeSO47H2O on the bio-ethanol production.......................................................128
xv
Figure 5.4 Product formation curve for simultaneous saccharification and ethanol
fermentation from industrial waste potato mash using the statistically
optimized medium..............................................................................................129
Figure 6. 1 Diagram of the PCS biofilm reactor and actual image of PCS tubes on the
agitator shaft.......................................................................................................141
Figure 6.2 Effects of different PCS compositions on the biomass and ethanol
production in test tubes (n =3) (Different letters represents the significant
difference between treatments (p˂0.05))...........................................................144
Figure 6.3 Contour plots showing the effect of pH, temperature and agitation on
the bio-ethanol production.................................................................................147
Figure 6. 4 Response surface plots showing the interactions of pH, temperature
and agitation and their effect on the bio-ethanol production............................148
Figure 6.5 Product formation curve for ethanol fermentation from industrial potato
waste hydrolysate under the statistically optimized conditions.........................150
Figure 6.6 Scanning electron micrographs of S. cerevisiae on the exterior
and interior surfaces SH-SF-YE-S PCS tubes in fermentation medium............153
Figure 7.1 Diagram of the PCS biofilm reactor and actual image of PCS tubes on the
agitator shaft before (left) and after (right) biofilm formation...........................163
Figure 7.2 Effects of different PCS compositions on the glucose, enzyme activity,
biomass and ethanol production in test tubes (n =3) for A. niger (A) and S.
cerevisiae (B).....................................................................................................168
Figure 7.3 Response surface plot showing the interactions of pH, temperature and
aeration and their effect on ethanol production..................................................173

xvi
Figure 7.4 Optimization graph shows the optimal value for maximum
ethanol production..............................................................................................174
Figure 7. 5 Product formation curve for SSF ethanol production from industrial
potato waste under the statistically optimized conditions in biofilm reactor
by A. niger and S. cerevisiae..............................................................................174
Figure 7.6 Scanning electron micrographs of SSF of ethanol by co-cultures of A. niger
and S. cerevisiae on the exterior and interior surfaces SH-SF-YE-S PCS tubes
in fermentation medium.....................................................................................178
Figure 8.1 Enhancement of enzyme activity by Aspergillis niger NRRL 330 by medium
optimization..................................................................................................183
Figure 8.2 Improvement of ethanol production by medium optimization.....................184

xvii
LIST OF TABLES
Table 2.1 Properties of ethanol..........................................................................................5
Table 2.2 Different feedstock for bioethanol production and their comparative
production potential...............................................................................................8
Table 3.1. Concentrations of variables at high and low levels in
Plackett - Burman design....................................................................................73
Table 3.2. The central composite design levels of each factor........................................75
Table 3.3. Plackett-Burman experimental design and results..........................................80
Table 3.4. Effect of each component on glucoamylase production.................................81
Table 3.5. Central composite design and the experimental results..................................83
Table 3.6. Comparison between the original and optimized media.................................87
Table 4.1. Concentrations of variables at high and low levels in
Plackett-Burman design.......................................................................................97
Table 4.2. Placket-Burman experimental design matrix for screening of important
variables for bio-ethanol production with results...............................................100
Table 4.3. Statistical analysis of Plackett-Burman design for ethanol production
from industrial waste potato mash by S. cerevisiae..........................................101
Table 4.4. Box-Behnken experimental design matrix with the experimental values
of bio-ethanol production...................................................................................103
Table 4.5. Comparison between the basal and optimized media...................................107
Table 5.1. Comparison of different medium compositions for simultaneous
saccharification and ethanol fermentation by A. niger and S. cerevisiae..........123
Table 5.2. Central composite design and the experimental results for simultaneous
saccharification and ethanol fermentation by A. niger and S.cerevisiae...........125

xviii
Table 5.3. Kinetic parameters of the optimum fermentation.........................................129
Table 6.1. The composition of plastic composite supports (PCS) used in this study....139
Table 6.2. Effect of growth parameters on ethanol production in biofilm reactors
with PCS.............................................................................................................146
Table 6.3. Kinetic parameters of ethanol fermentation in biofilm reactors under
statistically optimized conditions.......................................................................149
Table 7.1. The composition of plastic composite supports (PCS).................................162
Table 7.2. Effect of growth parameters on SSF ethanol production in biofilm reactors
with PCS by A. niger and S. cerevisiae..............................................................171

xix
ACKNOWLEDGEMENTS
First I would like offer my sincerest gratitude to my advisor, Dr. Ali Demirci, who has
been more than an advisor. He has supported me throughout my Ph.D. education with his
patience and knowledge. I attribute my doctorate degree to his encouragement and
opposition to failure. I have not only gained technical knowledge, but also learned a life-
long lesson “Never Give Up On Someone!”.
Besides my advisor, I, also, would like to thank my committee members, Dr. Virenda M.
Puri, Dr. Thomas L. Richard, Dr. Chobi DebRoy, who gave me their kind attentions,
encouragement, and constructive feedback throughout my study. It was my pleasure to
work with all of them.
I would like to thank my friends and lab mates, Dr. Duygu Ercan, Dr. Hasan B. Coban,
Dr. Xinmiao Wang, Dr. Gulsad Uslu, and Ehsan Mahdinia for their unlimited support and
encouragement throughout my study, and being my family far from home. I am certainly
very thankful that I have been a part of PSU Agricultural and Biological Engineering
family. Thank you for all your support.
I am sincerely thankful to my parents, Nurgul and Mehmet Izmirlioglu, for their love,
guidance, and support throughout my life. I am also thankful to my siblings, Ahmet
Izmirlioglu and Tuba Karaagac for their endless support and love.
I also, thank my son, Mehmet Selim, who is the joy of my life. I love you more than
anything and I appreciate all your patience and support during mommy’s Ph.D. studies.
Last but not least, I am sincerely indebted to my husband Shaker Abdulwahab, who has
been a true and great supporter. He has faith in me even the times I didn’t have faith in
myself. These past several years have not been an easy ride, both academically and

xx
personally, but with his support I was able to get through. I truly thank Shaker for his
unconditional love and support.
xxi
TECHNICAL ACKNOWLEDGEMENTS
This work was supported in part by the Turkish Ministry of Education by providing a
scholarship to Gulten Izmirlioglu, and the Pennsylvania Agricultural Experiment Station.
I also gratefully acknowledge Keystone Potato Products (Hegins, PA, USA) and
Pennsylvania Grain Processing, LLC® (Clearfield, PA, USA) for supplying waste potato
mash and enzymes, respectively.
I want to thank Dr. Anthony L. Pometto III for helping in manufacturing the plastic
composite supports at Iowa State University, Kay Dimarco, Agricultural and Biological
Engineering, Pennsylvania State University for her help in sugar analysis, and John J.
Cantolina of Microscopy and Cytometry Facility at Huck Institutes of the Life Sciences,
Pennsylvania State University for his help in SEM protocols.

1
CHAPTER 1
INTRODUCTION
During the last decades, demand for energy has been increased while environmental
issues have become more of concern. Society has realized that fossil fuel is not unlimited
and is also not an eco-friendly energy source. Renewable energy sources, therefore, are of
great interest to protect the environment, and supply our energy needs by reducing
dependence on foreign oil and non-renewable energy sources.
Bio–ethanol, a product of fermentation, has been utilized as a beverage, an industrial
alcohol, and now a biofuel. Most of the ethanol produced (73%) is utilized as fuel
worldwide, while percentages of beverage and industrial ethanol are 17% and 10%,
respectively (Sanchez & Cardona, 2008). Moreover, bioethanol is already being used in
pure form or blended with gasoline for transportation in Brazil and some other countries.
Bioethanol is also one of the components of a gasoline-ethanol blend called gasohol or
E10 (10% ethanol by volume) and is available for transportation use in some states of the
U.S. (Balat, Balat, & Oz, 2008). It is recognized that the use of bioethanol as a fuel may
be one of the solutions to global warming and reduce dependency on petroleum.
Bioethanol can be derived from various raw materials, such as pure sugars, starch,
lignocellulosic biomass, and algae. Corn is the most common raw material in the ethanol
industry in the U.S., while sugar cane is the major source for bioethanol in Brazil. In any
case, the carbon sources for bioethanol production are basically the glucose units, which
have different conformations or other forms of polysaccharide so that different enzymatic
systems are needed to degrade them. Amylases are starch hydrolyzing enzymes, which
are widely utilized by several industries. Although amylases are found in plants and
animals, microbial amylases are the most common in the industry. Several bacteria, yeast,
and fungus have been reported as amylase producers.

2
Combinations of various processes are preferred to improve the productivity and
economic feasibility of microbial products at the same time. To reach the maximum
ethanol yield and decrease the cost and time, integration of processes is preferred. By
integration of processes, several operations are combined and performed at the same unit.
Since the pretreatments play a crucial role in production of ethanol, most of the processes
involve integrated hydrolysis and fermentation. Simultaneous saccharification and
fermentation (SSF) is one of the common processes and found application in the starch-
based ethanol industry in the 1970s. In this system, saccharification and ethanol
fermentation are carried out simultaneously, after liquefaction is performed.
Another way of improving fermentation is to increase microbial population in the
bioreactors. One way of achieving that is utilization of biofilm in bioreactors. Biofilm is
defined as aggregation of microorganisms in which cells hold on to each other and/or to a
surface. These cells are embedded in a matrix of extracellular polymeric substance.
Wastewater treatment, water purification, and enhanced production of value-added
products are some of the applications of biofilms. Although wastewater treatment has
been studied extensively and employed in the industry, production of value added
products in biofilm have been studied only in lab scale to enhance productions of
bioethanol, organic acids, enzymes, cellulose, and pullulan (Cheng, Demirci, &
Catchmark, 2010a). Plastic composite supports (PCS) are types of solid supports made
from polypropylene and agricultural products and employed to promote the biofilm
formation. PCS provides an ideal physical structure for biofilm formation, besides release
nutrients for microorganisms. Moreover, nutrient composition can be customized to meet
the nutrient requirement of the target microorganism ( Demirci, Pongtharangkul, &
Pometto, 2007) .
In this dissertation, Chapter 1 presents the overall introduction to the dissertation. Chapter
2 summarizes in detail the literatures related to this dissertation along with some
expanded information which might be useful for the readers. Chapter 3 presents the
screening of amylase producing fungus and selection of the fungi that provides the

3
maximum enzyme activity and stability. Furthermore, a two-step medium optimization
study in which a medium ingredient screening experiment and statistical optimization of
selected components is presented. Chapter 4 deals with the study of medium
optimization for S. cerevisiae to improve the ethanol production while identifying the
essential medium components for the yeast. Chapter 5 presents a medium development
study for co-culture of A. niger and S. cerevisiae using industrial wastes of potato
industry. Also, an optimization of the developed medium is also studied. Chapter 6
presents the use of biofilm reactors for improved production of ethanol by S. cerevisiae.
A selection of plastic composite supports for biofilm formation is undertaken. Then, the
growth conditions of S. cerevisiae in biofilm reactor is optimized. During the
optimization, temperature, pH and agitation are taken into account as optimizing factors.
Chapter 7 deals with ethanol production from industrial potato waste in biofilm reactor
by application of SSF with employing A. niger and S. cerevisiae. The growth conditions
of co-culture in biofilm reactor is optimized and temperature, pH and aeration are taken
into account during optimization. Finally, Chapter 8 summarizes the outcomes of this
study and also presents potential future research topics to focus on.

4
CHAPTER 2
LITERATURE REVIEW
The literature review will provide a background about bioethanol and its worldwide
production, feedstocks for bioethanol production including first, second and third
generation feedstocks. Because the focus of this study is SSF production of ethanol,
information about amylases, the sources of amylases, and applications of amylases will
also be discussed. Finally, this literature review will provide information about bioreactor
design, biofilm reactors as a cell immobilization technique, and industrial potato waste as
an alternative substrate for ethanol production.
2.1 Bioethanol
Ethanol (C2H5OH), which is known as pure alcohol, ethylalcohol or bioethanol, is a
colorless, flammable, volatile liquid with a strong characteristic odor. Ethanol is an
alcohol which contains a hydroxyl group (-OH) attached to a carbon atom (C). The
hydroxyl group and the short carbon chain give the ethanol its characteristics (Baeyens et
al., 2015). Ethanol has a molecular weight of 46.07. The density of ethanol is 0.789 g/ml
at 20°C, the melting point is –114.1°C, and boiling point is 78.5°C. Due to the low
freezing point of ethanol, it has been using in thermometers for temperatures below –
40°C, and automobile radiators as antifreeze (Bajpai, 2013). A detailed list for the
properties of ethanol is given in Table 2.1. Ethanol burns without any residue and
significant energy which makes it a promising fuel. Ethanol has an ignition number of
425°C, which means 425°C is the lowest temperature in which ethanol will combust
independently at normal atmosphere without an external source. The flash point of
ethanol is 12.8°C, and at this temperature ethanol can become flammable in air because
of the concentration of vapor present in the air. Ethanol is miscible with water and most
of the organic solvents, such as acetone, acetic acid, toluene, and glycerol, which makes
it useful as a solvent and an ingredient for many products (Baeyens et al., 2015).

5
However, the flash point of the water-ethanol mixture is very important to establish a safe
handling, storage and transportation of the bioethanol.
Table 2.1 Properties of ethanol.*
* (Bajpai, 2013)
Ethanol can be produced synthetically and naturally by yeasts. Ethanol fermentation has
been used for the production of alcoholic beverages, and for the rising of bread dough for
centuries; recently, it has been produced to use industrially. Since 1980, fuel ethanol has
found use for transportation gasoline and today, 73% of ethanol production is consumed
as fuel worldwide. Bioethanol has become an attractive fuel because it is renewable and
oxygenated (Balat et al., 2008). Sanchez and Cardona (2008) reported that oxygenated
ethanol reduces the emission of carbon dioxide and aromatic compounds compared to the

6
other fuel additives such as methyl tertiary butyl ether (MTBE), and ethanol’s octane
booster properties are greater. Bioethanol is being used pure or blended with gasoline for
transportation in Brazil and in some states of the U.S. (Balat et al., 2008). Although
bioethanol has been introduced as an alternative to petroleum-derived fuels,
corrosiveness, low flame luminosity, low vapor pressure (compared to gasoline),
miscibility with water, and low energy density are some of the disadvantages of
bioethanol (Balat et al., 2008).
2.1.1 Worldwide Production of Bioethanol
The production of fuel ethanol reached 54 billion liters in 2014 in U.S. (RFA, 2015). An
increase in fuel ethanol production resulted from the fact that many countries want to
reduce dependency on foreign oil and enhance their air quality. Two leaders of ethanol
production in the world are Brazil and the United States, accounting for the 80% of the
world supply (Baeyens et al., 2015). In Brazil, more than 20% of the cars can run on
100% ethanol, while in the U.S. pure ethanol has not been allowed and ethanol-gasoline
blends (0-85%) are in use (Baeyens et al., 2015). The ethanol production from 2007-2015
by country or region can be seen in Figure 2.1.
Figure 2.1 Global ethanol production by country or region and years (USDE, 2016).
-
5
10
15
20
25
30
2007 2008 2009 2010 2011 2012 2013 2014 2015
Bill
ion
Gal
lon
s
Rest of World
Canada
China
Europe
Brazil
USA

7
Bioethanol can be produced from different feedstock, such as corn, sugar cane, cellulose,
potato, etc. Sugar cane, as a raw material, is used for 60% of global ethanol production,
while 40% of global production of ethanol comes from other crops. Corn grain is the
main raw material of ethanol production in the United States (90%) whereas domestically
grown sugar cane is the major source in Brazil (Baeyens et al., 2015). Sugar cane is easy
to process and contains more sucrose compared to corn and, thus a cheaper ethanol can
be produced from sugar cane. Developing countries, on the other hand, prefer feedstock
that are not categorized as food source, such as sorghum and cassava. Nigeria and Ghana
are the two countries focuses on cassava for ethanol production. China has been
producing ethanol mainly from cassava, wheat, and corn. Sweet sorghum is an important
feedstock for the U.S., while grape is the main feedstock in Italy and France. In Japan,
main feedstock for ethanol industry is rice (Baeyens et al., 2015). Desirable raw materials
for ethanol fermentation should be inexpensive and composed of sugars that can be
fermented by microorganisms. Sucrose containing feedstock, starchy feedstock, and
lignocellulose biomass can be used as raw materials for ethanol production.
2.1.2 Feedstock for Bioethanol Fermentation
Bioethanol can be produced from different feedstock including sugar containing
feedstock, starchy feedstock, and lignocellulosic feedstock. For ethanol fermentation, raw
material plays an important role in production costs (Cardona & Sanchez, 2007). Since
30% of medium costs affect the cost of the product, composition of media is very
important (B. Lee, Pometto, Demirci, & Hinz, 1998). By decreasing the cost of medium,
low cost ethanol can be produced without sacrificing ethanol yield and biomass. The
plant design and the process of fermentation are directly related to the type of feedstock.
Sugars can be converted to ethanol without any pretreatment, however starchy and
lignocellulosic materials need pretreatment prior to the fermentation process. The
pretreatment of starch involves hydrolysis, whereas lignocellulosic materials require
more complicated treatments. Table 2.2 is a summary of the various feedstocks for
ethanol production along with their potential ethanol yields.

8
In general, bioethanol is categorized into three groups in terms of the feedstock. First
generation ethanol is produced from sugar and starchy crops while lignocellulosic
biomass is the main feedstock for second generation ethanol. Microalgae is the preferred
biomass for the third generation ethanol, on the other hand.
Table 2.2 Different feedstock for bioethanol production and their comparative production
potential. *
Raw Material Potential of bioethanol production (L/ton)
Sugar cane 70
Sugar beet 110
Sweet potato 125
Potato 110
Cassava 180
Maize 360
Rice 430
Barley 250
Wheat 340
Sweet Sorghum 60
Bagasse and other cellulose biomass 280
*(Balat et al., 2008)
2.1.2.1 First Generation Bioethanol
First generation ethanol is produced from sugars and starchy crops, and production line
for this type of feedstock is well-established. Currently, major feedstock for industrial
production of ethanol are sugar cane, corn, wheat, rice, and grape. Those feedstock are
easy to process compared to lignocellulosic biomass and microalgae, and still
inexpensive in terms of processing costs. Because ethanol production from those
feedstocks are extensively studied, ethanol yields also higher than lignocellulosic
biomass and microalgae.

9
Sugars, hexo and pento carbons, do not require pretreatment, such as hydrolysis, prior to
fermentation. Thus, bioethanol fermentation is easier, compared to starchy materials or
lignocellulosic feedstock, when the raw material is already in the form of sugar.
However, the limitation of sugars is their high cost, because they are already valuable as
a food source. In addition, availability and transportation costs of sugar containing raw
materials increase the cost of ethanol production (Cardona & Sanchez, 2007).
Sugarcane is the major sugar-containing feedstock for ethanol production in Brazil
(Sanchez & Cardona, 2008). In Brazil, sugarcane juice is used to produce approximately
79% of total ethanol production, and 21% of ethanol is produced from cane molasses
(Wilkie, Riedesel, & Owens, 2000). In India, however, sugarcane molasses is the main
raw material for ethanol production (Ghose & Ghosh, 2003). The concentration of the
sugars and salts in the medium of cane molasses increases the osmolality, which is a
disadvantage for the fermentation of ethanol (Sanchez & Cardona, 2008). The juice of
sweet sorghum is another sugar containing feedstock for ethanol due to its high sucrose
content (Cardona & Sanchez, 2007).
Starch is a form of energy reserve for many economically important crops, for example
potato, wheat, rice, maize, etc. and composed of amylose and amylopectin, both of which
are glucose units (van der Maarel, van der Veen, Uitdehaag, Leemhuis, & Dijkhuizen,
2002). Amylopectin, which is highly branched by short chains, is 70-80% of starch by
composition. Amylose, a linear polysaccharide formed by α-1, 4-linked glucose residues
is the minor component of starch (20-30%) (Eksteen, Rensburg, Otero, & Pretorius,
2003). An illustration of the structures of amylose and amylopectin can be seen in
Figures 2.2a and 2.2b.

10
Figure 2.2 Representative structure of amylose (a) and amylopectin (b) (Bajpai, 2013).
Hydrolysis is a process of breaking down the amylopectin and the amylose linkages into
fermentable sugars and is needed before the fermentation of starchy materials (Figure
2.3). Even though, at low temperatures, hydrolyzing of starch is possible and can
contribute to energy savings, mostly, hydrolysis is carried out at high temperatures (90-
110ºC) (Sanchez & Cardona, 2008). To convert starch into fermentable sugars, either
acid hydrolysis or enzyme addition should be done. Both hydrolysis methods have
disadvantages and advantages. The limitations of acid hydrolysis include the by-products
inhibition on growth of yeast (such as 5-hydroxymethylfurfural (5-HMF)), neutralization
before fermentation, and expensive constructional material (Tasic, Konstantinovic, Lazic,
& Veljkovic, 2009). On the other hand, high prices of enzymes play a crucial role when
feasibility is of concern for enzyme hydrolysis. Enzyme hydrolysis is chosen despite the
high cost of enzymes and initial investment (Tasic et al., 2009) because of the high

11
conversion yield of glucose. Moreover, starch has extended storage and a low
transportation cost with the pretreatment cost of starch still competitive with pre-
treatment of lignocellulosic feedstock (Abouzied & Reddy, 1986).
Figure 2.3 Ethanol productions from starchy materials (Cardona & Sanchez, 2007).
Corn is the main feedstock for ethanol production in the U.S. Corn ethanol is obtained
from corn syrup produced enzymatically after the milling process (Sanchez & Cardona,
2008). The last step of ethanol production from corn is fermentation at 30-32ºC and is
accomplished by adding nitrogen sources (ammonium sulfate or urea) to medium
(Sanchez & Cardona, 2008). However, costs of feedstock, energy costs of wet milling,
and transportation expenses are the limitations of using corn crops. In addition, Nalley
and Hudson (2003) state that “For each gallon of corn ethanol produced, about 160
gallons of waste water are produced”.

12
Wheat is another starchy material that can be used for ethanol fermentation already used
in some countries like France (Sanchez & Cardona, 2008). To enhance ethanol
fermentation from wheat, some research such as determining the optimal fermentation
temperature has been completed (Sanchez & Cardona, 2008; S. Wang, Ingledew,
Thomas, Sosulski, & Sosulski, 1999). Longer fermentation times and incomplete
fermentations are the difficulties of this feedstock (Barber, Henningsson, & Pamment,
2002). However, Montesinos and Navarro (2000) reported that a mix of S. cerevisiae and
Aspergillus niger and glucoamylase produced 67 g/L ethanol after liquefaction with α-
amylase from raw wheat flour.
Cassava, a tropical plant, is another starchy raw material that is used for ethanol
fermentation. Although cassava is a good glucose source with high starch content (85-
90% dry matter) (Sanchez & Cardona, 2008), requirement of the tropical climate is a
limitation for cassava production. Jansson et al. (2009) presented that cassava has a 150
L/Ton conversion rate to ethanol. Other starchy feedstock that may serve as the source
for bioethanol include rye, barley, tricilate, sorghum, and potato (Zhan et al., 2003).
2.1.2.2 Second Generation Bioethanol
Second generation ethanol is produced from lignocellulosic biomass, agricultural
residues, wood, and energy crops (fast growing and low cost agricultural production).
Lignocellulosic materials are of interest due to their abundance, low cost, and ratio of
energy output to input (Bartle & Abadi, 2010). However, lignocellulosic materials need
to undergo very complex pretreatments prior to the fermentation process. Four main steps
have been used to produce ethanol from lignocellulosic biomass: biomass pretreatment,
cellulose hydrolysis, fermentation of hexoses, separation and distillation (Bajpai, 2013).
Figure 2.4 is a flowchart showing the basic steps of ethanol fermentation from
lignocellulosic biomass.

13
Figure 2.4 Ethanol productions from lignocellulosic material (Cardona and Sanchez,
2007).
Pretreatment of lignocellulosic materials can be performed by physical methods
(chipping, grinding, and milling), chemical methods (applications of ozone, acids, alkali,
peroxides, and organic solvents), physico-chemical methods (thermohydrolysis, ammonia
fiber explosion, etc.), and biological methods (microbiological applications) (Bajpai,
2013; Sanchez & Cardona, 2008). However, there is not only one method that can be
applied for all types of lignocellulosic biomass, and each lignocellulosic feedstock has its
own specific conditions. Optimization of the lignocellulosic pretreatment is necessary for
cost effective ethanol since pretreatment is one of the most expensive step in the process
of ethanol production from lignocellulosic biomass (Bajpai, 2013). The issues of
pretreatment still needs to be solved are generation of inhibitory chemicals, high particle

14
load, high energy input and efficient separation of sugars from solid residues (Bajpai,
2013). The pretreatment of lignocellulosic biomass still needs improvement to reduce the
cost of cellulosic ethanol.
Hydrolysis of cellulosic biomass is performed both with acid and enzymes. Acid
hydrolysis has some limitations, especially in application of dilute acid, and produce
fermentation inhibitors such as furan compounds, phenols, and carboxylic acids (Klinke,
Olsson, Thomsen, & Ahring, 2003). Even though enzymes do not produce any inhibitors,
the main downsides of the enzyme hydrolysis are the low glucose yield and high cost
(Bajpai, 2013).
Pretreated and hydrolyzed lignocellulosic material can be fermented to ethanol in various
processes, separate hydrolysis and fermentation (SHF), simultaneous saccharification and
fermentation (SSF), and consolidated bioprocessing (CBP). SHF is the process where
hydrolysis and fermentation steps are performed separately in which enzymatic
hydrolysis can be done at higher temperatures, while fermentation can be operated at
moderate temperatures. In this process, both enzymatic hydrolysis and fermentation steps
can be optimized easily. SSF, on the other hand, is where the enzyme hydrolysis and
fermentation take place simultaneously. The advantage of this process design is higher
ethanol yield because of the elimination potential product inhibition of glucose and
cellobiose. However, optimization of the enzymatic hydrolysis and fermentation in the
same vessel is changeling. Oberoi et al. (2011) reported that the highest ethanol
fermentation from banana peels, 28.2 g/L, was achieved after statistical optimization of
simultaneous saccharification and fermentation of banana peels. South et al. (1993)
reported that 20 g/L ethanol concentration was obtained in the application of continuous
SSF to pretreated hardwood flour by using S. cerevisiae and commercial cellulase
supplemented with β-glucosidase. CBP is the direct microbial conversion of cellulosic
biomass to ethanol in which production of saccharolytic enzymes, hydrolysis of
polysaccharides, fermentation of sugars are combined and performed in one vessel
(Mbaneme-Smith & Chinn, 2015). Even though CBP can reduce the cost of ethanol

15
drastically, it has not been considered as a promising process for industry due to the fact
that no microorganism is capable of producing cellulases or other enzymes as well as
ethanol at a high yield (Bajpai, 2013). It was reported that F. oxysporum yielded 0.35 g/g
cellulose with a productivity of 0.044 g/L/h when batch consolidated bioprocessing was
applied (Cardona & Sanchez, 2007).
Lignocellulosic biomass has a huge potential for bioethanol production; however, the cost
of production of bioethanol is high due to the expense of a pretreatment process using
current technologies (Balat et al., 2008) and more research is required before
commercialization of the process.
2.1.2.3 Third Generation Bioethanol
Third generation bioethanol is defined as the ethanol that is produced from algal biomass.
Even though algae was considered as an energy feedstock since 1950s (John, Anisha,
Nampoothiri, & Pandey, 2011), algal bioethanol production still needs to be improved.
Algae can be autotrophic, heterotrophic, or mixotrophic. Autotrophic algae is capable of
using sunlight and inorganic carbon from atmosphere to form food materials, carbon.
Heterotrophic algae, on the other hand, can utilize small organic material from their
environment and produce their food reserves as fats and proteins. The algae that can both
use inorganic carbon and organic carbon from the environment are called mixotrophic
algae (John et al., 2011). Algae are capable of storing large quantities of carbohydrates
which makes them a great candidate for ethanol production. Algae do not require
agricultural lands to be grown, and can be grown on fresh or saline water and marginal
lands. Low nutrient requirement of algae and short time period for harvesting are other
promising characteristics for bioethanol production (John et al., 2011; Leite, Abdelaziz,
& Hallenbeck, 2013). Some species of microalgae, such as Chlorella, Dunaliella,
Chlamydomonas, Scenedesmus, Spirulina, contain high amounts of starch and glycogen,
and are preferred for bioethanol production (Ueda, Hirayama, Sugata, & et.al, 1996).
Because naturally grown algae are low in density, for ethanol production, mass
production of algae should be carried out under controlled environment. Open ponds and

16
closed photobioreactors are the most common systems for algae production. Even though
open ponds are inexpensive, easy to build and run, low productivity, costly harvesting,
water loss, high risk of contamination, temperature fluctuations, and low carbon dioxide
efficiency are the disadvantages of those systems. Enclosed photobioreactors provide a
better controlled environmental conditions for the algal cultivations, however, the capital
cost of those systems are the major drawback (John et al., 2011).
Figure 2.5 Bioethanol production from algal biomass (Harun, Liu, & Danquah, 2011).
Once the algae are harvested, the cell walls are destroyed either mechanically (ultrasonic,
mechanical shear, explosive disintegration, etc.) or enzymatically before water or organic
17
solvent extraction of starch. Then, saccharification and fermentation of starch can be
carried out either in a single step or two step process. Since conventional method requires
high energy during the destruction of cell wall and gelatinization of starch, dark
fermentation can be an alternative method for algal bioethanol production. In absence of
light and in presence of oxygen, microalgae usually consumes reserved starch and
glycogen and produce carbon dioxide. However, under anaerobic conditions in the dark,
starch is catabolized to ethanol (John et al., 2011). Another solution to high energy
demand for algal starch to ethanol conversion of direct production of ethanol by
engineered microalgae. Although algal bioethanol is a promising feedstock for renewable
biofuel production, process economy is still preventing this process to be
commercialized.
2.1.3 Ethanologenic Yeast and Bacteria
Microorganisms meet their energy demand by converting the carbon sources to carbon
dioxide, lactic acid, ethanol, cellulose, etc. Ethanol is one of the end products of
fermentation, which can be performed by either bacteria or yeasts. Fermentation is an
energy generation process with no electron transport mechanism (Shuler & Kargi, 2008).
There are different pathways, which may be different from one microorganism to another
one, such as the Entner-Doudoroff and the Embden-Meyerhof pathways (Shuler & Kargi,
2008). The Embden-Meyerhof pathway is used by Saccharomyces cerevisiea to convert
glucose to ethanol under anaerobic conditions during fermentation, whereas the
bacterium Zymomonas mobilis follow the Entner-Doudoroff pathway (Shuler & Kargi,
2008).
S. cerevisiae has generally been recognized as safe (GRAS) and is the most commonly
used microorganism in the fermentation industry (Kunz, 2008). Production of alcoholic
beverages and bread dough rising are the two main application areas of S. cerevisiae.
Alcohol production occurs by converting sugars to energy, and simultaneously S.
cerevisiae meets its metabolic energy need. Under anaerobic conditions, yeast ferments
glucose, and ethanol and carbon dioxide are the end products of the Embden-Meyehof

18
pathway (EMP). Fermentation is carried out in an anaerobic environment, but S.
cerevisiae needs small amounts of oxygen to synthesize fatty acid and sterols (Sanchez &
Cardona, 2008). Although S. cerevisiae is the most common microorganism in ethanol
fermentation, it is not able to break down lignocellulosic and starchy material. One
approach to solve this problem is hydrolysis before the fermentation process, which
converts the non-fermentable sugars to glucose by hydrolyzing enzymes. In the process
of hydrolysis, either mixed cultures or genetically modified microorganisms can be
introduced. S. cerevisiae already has some genetically modified strains to enhance the
ethanol yield and ferment both pentoses and hexoses (Bera, Sedlak, Khan, & Ho, 2010).
A demonstration of anaerobic fermentation of glucose to ethanol in S. cerevisiae is
presented in Figure 2.6.
Figure 2.6 Simplified model of anaerobic fermentation of glucose to ethanol (Bai,
Anderson, & Moo-Young, 2008).

19
Kluyveromyces marxianus is another ethanol producer yeast. It is defined as respire-
fermentative, and regulates energy either via TriCarboxylic Acid (TCA) cycle or
fermentation to ethanol after glycolysis (Lane & Morrissey, 2010) . In general,
Kluyveromyces are Crabtree negative yeasts, and follows TCA cycle for optimum energy
(Bellaver, de Carvalho, Abrahao-Neto, & Gombert, 2004). However, K. marxianus still
has the genes for ethanol production by fermentation under certain conditions (Lane &
Morrissey, 2010). Strains of Kluyveromyces have a wide range of growth temperature.
Some of K. marxianus strains were reported as thermophilic which allows energy
savings, as well as higher saccharification and fermentation rates (Banat, Nigam, Singh,
Marchant, & McHale, 1998). It was reported that K. marxianus var. marxianus were able
to produce up to 6% ethanol at 43ºC at the end of 24-30 h of fermentation. However, cell
viability was low (30-50%) (Anderson, McNeil, & Watson, 1986). Another research
group was able to isolate thermotolerant strains of K. marxianus that are capable of
producing 7% (wt/v) ethanol on supplemented molasses at 40ºC (Banat, Nigam, &
Marchant, 1992). Furthermore, Manikandan and Viruthagiri (2009) studied optimization
of simultaneous saccharification and fermentation of liquefied wheat barn starch to
ethanol by Aspergillus niger and K. marxianus. The maximum ethanol concentration was
reported as 23.1 g/L after 48 h at 30ºC and 5.5 pH from 6% (wt/v) initial starch.
Zymomonas mobilis, Gram-negative facultative anaerobic bacterium, is also able to
metabolize glucose by the Entner-Doudoroff (ED) pathway to produce ethanol (Figure
2.7). Additionally, Z. mobilis is an ethanol tolerable microorganism that can tolerate up to
120 g/L ethanol (Lin & Tanaka, 2006). Z. mobilis is also able to ferment just glucose,
fructose and sucrose, however not starch or lignocellulosic biomass. So as it is true for S.
cerevisiae, utilization of starchy or lignocellulosic materials for ethanol production by Z.
mobilis requires various pretreatments. There have been recombinant Z. mobilis strains
which have been modified to transfer not only glucose, but also xylose to ethanol
(Cardona & Sanchez, 2007). Ethanol production from various carbon sources by Z.
mobilis, as well as process optimization have been studied. Ma et al. (2008) investigated
ethanol production from kitchen garbage by Z. mobilis, and optimized the process
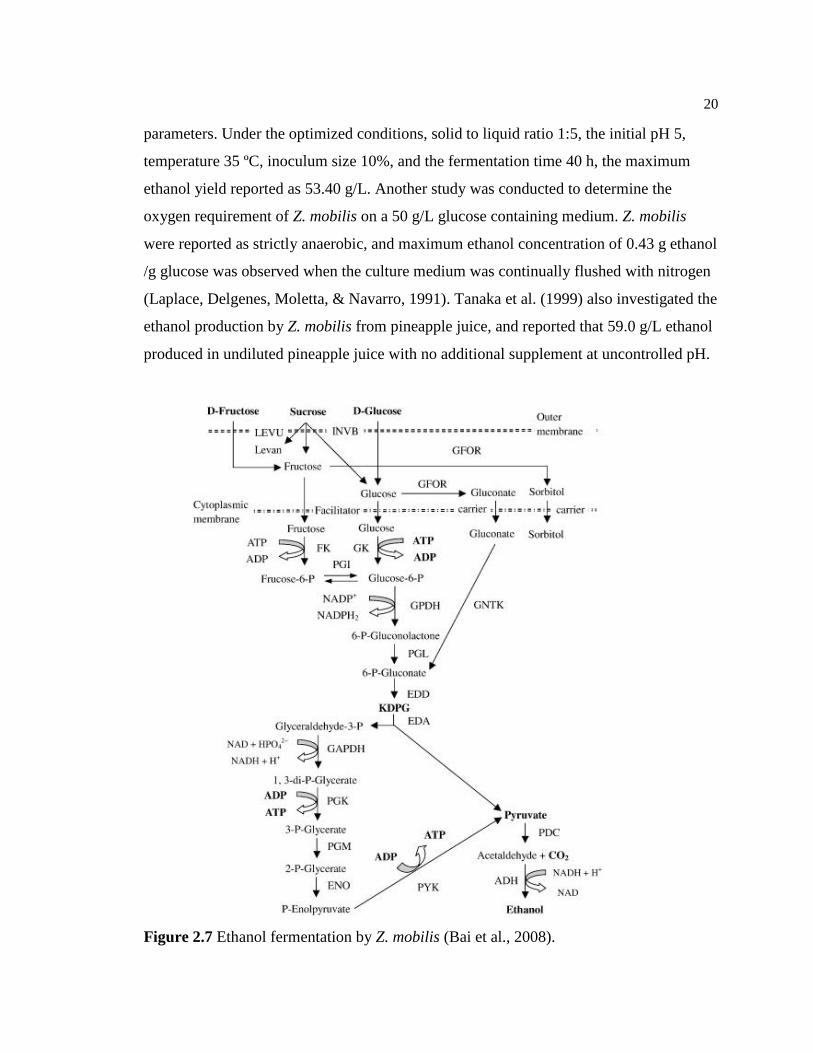
20
parameters. Under the optimized conditions, solid to liquid ratio 1:5, the initial pH 5,
temperature 35 ºC, inoculum size 10%, and the fermentation time 40 h, the maximum
ethanol yield reported as 53.40 g/L. Another study was conducted to determine the
oxygen requirement of Z. mobilis on a 50 g/L glucose containing medium. Z. mobilis
were reported as strictly anaerobic, and maximum ethanol concentration of 0.43 g ethanol
/g glucose was observed when the culture medium was continually flushed with nitrogen
(Laplace, Delgenes, Moletta, & Navarro, 1991). Tanaka et al. (1999) also investigated the
ethanol production by Z. mobilis from pineapple juice, and reported that 59.0 g/L ethanol
produced in undiluted pineapple juice with no additional supplement at uncontrolled pH.
Figure 2.7 Ethanol fermentation by Z. mobilis (Bai et al., 2008).

21
After discovering gene transfer from one organism to another, microorganisms have been
generated for ethanol fermentation, in which both hydrolysis and fermentation of hexose
and pentose can be done simultaneously (Figure 2.8). Escherichia coli and Klebsiella
oxytoca were modified as ethanol producers by transferring genes from Z. mobilis while
S. cerevisiae was engineered for xylose fermentation by introducing genes from Pichia
stipitis (Hahn-Hagerdal, Galbe, Gorwa-Grauslund, Liden, & Zacchi, 2006).
Figure 2.8 Engineered microorganisms for ethanol production from pentose
(Hahn-Hagerdal et al., 2006).
Eksteen et al. (2003) reported that recombinant S. cerevisiae strains were able to utilize
80% of starch after transferring α-amylase and amyloglucosidase genes from Lipomyces
kononenkoae and Saccharomycopsis fibuligera and engineered yeast produced 6.1 g/L
ethanol at the end of six days of fermentation. In another study, A five sugar (glucose,
galactose, mannose, xylose, and arabinose) fermenting S. cerevisiae was engineered by
Bera et al. (2010) and ethanol yield for the recombinant yeast reported 72.5%.
Although Z. mobilis, Kluyveromyces spp., Schizosaccharomyces pombe, and some
recombinant bacteria and yeast can ferment sugars to ethanol, S. cerevisiae is still the

22
standard ethanol producer microorganism in the industry (Kunz, 2008; Lin & Tanaka,
2006).
2.2 Amylases
Carbon sources are widely distributed which maintain most forms of life. Most of carbon
sources are composed of glucose units which have different conformations so that
different enzymatic systems are needed to degrade them. Enzymes which are capable of
hydrolyzing the glycosidic linkages of starch are called amylases (Vihinen & Mantsiila,
1989). Although amylases are found in plants and animals, microbial amylases are most
common in industry. α-Amylase (EC 3.2.1.1.) and glucoamylase (EC 3.2.1.3.) have been
reported as two major amylases (A Pandey et al., 2000).
2.2.1 Function of Amylases
Starch, which is produced mainly in higher plants as an energy storage, is composed of
two components, amylose, and amylopectin. Amylose is a mainly linear glucose chain,
which is formed by α-1,4 glycosidic linkages and some α -1,6-branching glycosidic
linkages. Amylopectin has a highly branched tree-like structure. The proportion of
branches is an important property of the substrate because enzymes hydrolyze different
substrates with differing specificities. Several amylolytic enzymes hydrolyze starch or its
degradation products (Figure 2.9).
The actions of these enzymes can be divided in four categories. Endo-amylases break
down linkages randomly in the interior of the starch molecule. Exo-amylases hydrolyze
from the non-reducing end (Figure 2.9), and result short end products. α-Amylase (endo-
1,4- α –D-glucan glucohydrolase) hydrolyses the 1,4- α –D-glucosidic linkages in the
linear amylase chain, randomly. However, glucoamylase (exo-1,4- α –D-glucan
glucohydrolase) cleaves the 1,6- α-linkages at the branching points of amylopecyin as
well as 1,4-linkages (A Pandey et al., 2000). β-amylase (α- 1,4-glucan maltohydrolase,
EC 3.2.1.2), another exo-amylase, is originally derived from plants even though there are
a few microbial strains which can produce. β-amylase can cleave non-reducing ends of

23
amylase and amylopectin which results incomplete degradation (A Pandey et al., 2000).
The third group involving the starch degradation are the debranching enzymes that cleave
α -1,6-branching bonds, such as isoamylase (EC 3.2.1.68) and pullulanase type I (EC
3.2.1.41). Isoamylase is only capable of hydrolyzing 1-6 bonds in amylopectin, whilst,
pullulanases can hydrolyze both 1-6 glycosidic bonds in pullulan and amylopectin, and
generates long linear polysaccharides (van der Maarel et al., 2002). The last group plays a
role in starch hydrolyzation is called transferases that hydrolyze 1,4- α glycosidic bond of
the donor molecule and forms s new glycosidic bond by transferring the donor to s
glycosidic acceptor. Amylomaltase (EC 2.4.1.25) and cyclodextrin gly-cosyltransferase
(EC 2.4.1.19) form a new ,1-4 glycosidic bond when branching enzyme forms a new ,1-6
glycosidic bond (van der Maarel et al., 2002).
Figure 2.9 Enzymatic degradation of starch (the open ring represents the reducing end of
a polyglucose molecule) (van der Maarel et al., 2002).

24
2.2.2 Production of Amylases
Amylases can be derived from different microorganisms, as well as plants and animals.
However, microbial production of starch hydrolyzing enzymes is most common (Pandey
et al., 2000). Selection of strain is the most challenging factor in amylase production, as
well as medium and growth conditions.
Glucoamylase can be produced by many microbial strains (P. Kumar & Satyanarayana,
2009), Aspergillus niger and Rhizopus oryzae are the major microorganisms used for its
commercial production (Norouzian, Akbarzadeh, Scharer, & Moo Young, 2006). The
reason behind the high preference for glucoamylases from these fungi stems are the high
enzyme activity at neutral pH values, as well as the thermal stability (Norouzian et al.,
2006). Previous studies have confirmed the effect of media composition and growth
conditions for glucoamylase production. Therefore, a number of studies attempted to
evaluate various substrates including wheat bran, green gram bran, black gram bran, corn
flour, barley flour, jowar flour, maize bran, rice bran, and wheat rawa (Ellaiah,
Adinarayana, & Bhavani, 2002), rice flakes (Anto, Trivedi, & Patel, 2006), and food
wastes (Q. Wang, Wang, Wang, & Ma, 2008). It was indicated that 126 U/ml of
glucoamylase was produced from the food waste of school cafeterias after 96 h of
submerged fermentation (Q. Wang et al., 2008). Several substrates were evaluated by
Ellaiah et al. (2002) and wheat bran shows the highest enzyme activity among the
evaluated substrates, 247 U/g under optimal conditions. A study of Chiquetto et al.
(1992) showed that maltose and cassava flour are glucoamylase inducers, whilst fructose
slowed down the production of glucoamylase. Another inhibitor of glucoamylase is
reported as glucose, even at low concentrations (Rajoka & Yasmeen, 2005). Another
supplement that should be considered for glucoamylase production is nitrogen sources,
and yeast extract, ammonium nitrate, ammonium sulphate, corn steep liquor, urea, meat
extract, and peptone are some examples of the nitrogen sources that have been used in
glucoamylase production (P. Kumar & Satyanarayana, 2007; A. Pandey, Selvakumar, &
Ashakumary, 1994; Rajoka & Yasmeen, 2005). Not only media composition, but also
optimal culture conditions, for example inoculum size, temperature, pH, aeration,

25
agitation, and type of fermenter, can enhance the enzyme production, but vary depending
on the microorganism (Ellaiah et al., 2002; P. Kumar & Satyanarayana, 2007; Ashok
Pandey, 1990; Silveira, Oliveira, Costa, & Kalil, 2006). Various bioreactor designs,
batch, chemostat, and fed-batch procedures for glucoamylase production by Aspergillus
niger, have also been evaluated for glucoamylase production by Pedersen et al. (2000).
Alpha-amylase production is mostly depends on Bacillus species for both SSF and SHF
processes, even though a number of microorganisms (Bifidobacterium species,
Clostridium strains, Aspergillus species, Rhizopus species, etc) are capable of (Pandey et
al., 2000). Similar to glucoamylase secretion, α-amylase production is also affected by
substrate and culture conditions, as well as the microbial strain. A study of Shukla and
Kar (2006) evaluated potato peel and wheat barn for the production of α-amylase by B.
licheniformis and B. subtilis species, and reported that potato peel was a better substrate
for enzyme production, with a 270 U/ml and 600 U /ml by B. licheniformis and B.
subtilis, respectively. On the other hand, Soni et al. (2003) reported high titers of α-
amylase (198,959 U/g dry matter) from wheat bran by Bacillus sp. in solid state
fermentation. Cheese whey was another substrate that was reported as a carbon source for
α-amylase production by Bacillus sp.(Bajpai, Gera, & Bajpai, 1992).
Thermophilic microorganisms are of special interest for the production of thermophilic
amylases, because thermostability is a wanted feature of most of the enzymes used in
industrial application. Recent research on thermostable amylases, especially a-amylase,
has concentrated on the enzymes of thermophiles. Facultative thermophiles generally
grow in the mesophilic temperature range. Whereas their growth may be optimum at
45°C, they are capable of growing well at higher temperatures, thus covering both the
mesophilic and thermophilic ranges (Pandey et al., 2000). However, not much is known
about the processes for enzyme production involving such organisms.

26
2.2.3 Amylase Producing Microorganisms
Amylases can be produced by several microorganisms. More than fifty strains are able to
derive α-amylase, however most commercial strains belong to Bacillus spp (A Pandey et
al., 2000). Aspergillus oryzae is also reported as a-amylase producer strain in batch and
continuous cultivations by Carlsen et al. (1996) and Spohr et al. (1997) Aspergillus niger
van Tieghem is another strain which is reported as a amylolytic enzyme producer
(Abouzied & Reddy, 1986). In their study, monocultures of A. niger and co-cultures of A.
niger and S. cerevisiae were investigated for ethanol fermentation on raw potato starch. It
was reported that co-culture process increased the amylolytic activity, rate, and amount of
starch utilization. Although enzymes of Bacillus and Aspergillus spp. are capable of
producing thermostable a-amylase, strains, itself, are mostly mesophilic. However,
Thermomyces lanuginosa, thermophilic fungus, is reported as a producer of a-amylase
(Haasum, Eriksen, Jensen, & Olsen, 1991; Jensen, Nebelong, Olsen, & Reeslev, 2002;
Kunamneni, Permaul, & Singh, 2005). Kunamneni et al. (2005) studied the production of
extracellular amylase by Thermomyces lanuginosus in solid state fermentation. They
reported that the maximum enzyme activity obtained was 534 U/g of wheat bran under
optimum conditions of an incubation period of 120 h, an incubation temperature of 50°C,
an initial moisture content of 90%, a pH of 6.0, an inoculum level of 10% (v/w), a salt
solution concentration of 1.5:10 (v/w) and a ratio of substrate weight to flask volume of
1:100 with soluble starch (1% w/w) and peptone (1% w/w) as supplements.
Myceliophthora thermophila is another thermophilic fungus reported as amylolytic
enzyme producer (Sadhukhan, Manna, Roy, & Chakrabarty, 1990). Effect of different
carbon sources, nitrogen sources, temperatures, pH, and metal ions on growth of M.
thermophila and production of amylolytic enzyme were studied and optimal conditions
were reported to be 5.5 for pH, 45 °C for temperature for maximal the growth of the
organism as well as biosynthesis of the enzyme, whereas the best yielding carbon source
was starch.

27
2.2.4 Applications of Amylases
Amylases have been employed by several of industries to hydrolyze the starch, such as
food, detergents, textiles, pharmaceuticals, and paper. Amylases are widely used in
baking industry for high quality products. Amylases have been used for a higher volume,
better color, and softer crumb during bread baking (Gupta, Gigras, Mohapatra, Goswami,
& Chauhan, 2003). Starch liquefaction and saccharification is the major market for
amylases in which high fructose syrups is produced (Figure 2.10)
Figure 2.10 Overview of the industrial processing of starch to its monomers
(van der Maarel et al., 2002).
In textile industry, starch is used to prevent yarn from breaking. Because starch needs to
be remove after processing without attacking the fibers, a-amylase is employed which

28
breaks down starch into dextrins, which are water soluble and can be removing by
washing with water (Gupta et al., 2003).
Paper industry, on the other hand, utilizes the amylases in the modification of starches for
coated papers. Papers are starch coated against mechanical damage, as well as to improve
erasability. However, natural starch has high viscosity and reduced by partially degrading
with amylases (Gupta et al., 2003).
Enzymes are also one of the ingredients of detergents. Before applications of enzymes in
detergent industry, dish detergents were very harsh and not compatible with delicate
china and wood dishware (Gupta et al., 2003). Currently, a-amylase is one of the major
ingredients of all liquid detergents.
2.3 Bioreactor Design
A bioreactor is an engineered enclosed system which is used to cultivate organisms in a
controlled environment for production of the product of interest from substrates via a
specific reactions. The bioreactors can be operated as batch, fed-batch, and continuous
modes, as well as integration of processes for increased benefits.
2.3.1 Batch Processes
Batch fermentation is carried out in a cultured vessel with an initial amount of medium
and during the fermentation no medium addition or removal occurs (Shuler & Kargi,
2008). Ethanol fermentation is performed after sterilization of the media and adjustment
of pH by either acid or alkali. After inoculation, fermentation process takes place by
controlling temperature, pH, agitation, and aeration depending on the characteristics of
the cultured microorganism. Because no medium addition occurs, the growth of
microorganism follows four main phases of the growth curve which include: lag phase,
log phase, stationary phase, and death phase. The growth of the microorganism is slow in
the lag phase, because this is an adaptation time for the cells to a new environment and
cells may have new metabolic path ways or synthesize enzymes (Shuler & Kargi, 2008).

29
Logarithmic growth is where microbial growth performs and reaches its maximum rate.
Stationary phase refers to the period where microbial growth rate equals the death rate. In
this phase, cells are still able to produce secondary products however. The last period of
batch fermentation is the death phase in which death rate is higher than the growth rate
due to lack of nutrients or accumulation of inhibitor primary or secondary metabolites,
etc. (Shuler & Kargi, 2008).
The advantages of batch processes are flexibility to adjust the process parameters, high
yields, and lower risks of contamination, microbial mutations during one batch, and
lower investment costs. However, repetition of inoculum sub-culturing, assurance of
inoculum quality for each batch, and time requirement for cleaning, sterilization, cooling,
etc. are the bottlenecks of this process (Kunz, 2008). Higher labor and process control
costs are another disadvantage of the batch fermentations. Substrate limitations and
product inhibition should also be considered as drawbacks of the batch systems.
In the ethanol fermentation, the batch process has a wide application. The batch
bioreactor design can be applied for all types of feedstocks, sugar-containing, starch,
lignocellulosic, or algal biomass. Although, the batch system can be conducted directly
for fermentation when the raw material is sugar containing materials, it also can be
combined with pretreatment processes for ethanol fermentation from starchy and
lignocellulosic materials. Hydrolysis of starch (mostly saccharification) and fermentation
can be performed either separately or simultaneously. Montesinos and Navarro (2000)
studied ethanol fermentation from raw wheat flour by applying batch and saccharification
and fermentation simultaneously. They reported that 67 g/L ethanol concentration was
obtained at the end of 31h fermentation. In another study, ethanol fermentation from
sweet sorghum stalks by using mix culture of Fusarium oxysporum and Saccharomyces
cerevisiae was investigated. F. oxysporum was grown aerobically for the production in
batch fermentation and reported 35-49 g/L ethanol concentration (Mamma et al., 1996) .

30
2.3.2 Fed-Batch Processes
Fed-batch processes can overcome substrate limitations, and increase the productivity. In
fed-batch process which is similar to the batch systems, fresh sterile medium is added to a
reactor continuously, while fermentation broth is either removed semi-continuously or
not removed. By addition of medium, two benefits can be obtained; microbial growth
will not be affected due to lack of nutrients and substrate inhibition will be overcome, if it
is a limitation for the process. Ethanol is a metabolic inhibitor for yeast and a point of
concern in fermentation, which will be eliminated in the use of fed-batch process.
However, to enhance productivity and ethanol yield, optimization of feeding should be
done properly (Sanchez & Cardona, 2008). Fed-batch culture is the most common
technology in the ethanol industry in Brazil (Sanchez & Cardona, 2008).
However, fed-batch processes are labor intensive. Similarly to the batch process, vacant
time for the preparation of the bioreactor (emptying, cleaning, and re-filling the reactor)
decreases the productivity (Kunz, 2008).
Fed-batch fermentation has been studied to overcome lack of nutrients during ethanol
production by S. cerevisiae by Alfenore et al. (2002). Fermentation medium was fed by
vitamins. By addition of vitamins exponentially, ethanol production increased from 126
to 147 g/L with a maximum productivity of 9.5 g/L/h. In another fed-batch fermentation
study, medium was fed and 63g/L ethanol and 5.3 g/L/ h productivity were obtained with
a 125 g/L sugar (Kargi & Ozmıhcı, 2006).
2.3.3 Continuous Fermentation Process
Continuous fermentation process, which is also known as chemostat, continuous stirred-
tank fermentation (CSTR), involves fresh sterile media fed into a reactor continuously. In
addition to feeding the reactor with fresh nutrients, the effluent is removed from the
reactor and the volume of the reactor always is constant since the rates of feeding and
removing are also equal. To avoid wash-out, which means taking away all the cells from

31
the reactor, growth rate of the microorganism is chosen as a rate of removing cells
(Shuler & Kargi, 2008).
Advantages of continuous fermentation over batch fermentation are low construction
costs of bioreactors, lower maintenance and operational requirements, higher yield, and a
better control of the process (Sanchez & Cardona, 2008). Stability of culture, however, is
an issue for continuous fermentation. Even small changes in any of parameters, such as:
temperature, dilution rate, substrate concentration of feed, etc., can decrease yield.
Different methods could be used to reduce the drawbacks of continuous fermentation. For
instance, Sanchez and Cardona (2008) offer utilization of immobilized cell technology in
which cells are captured in the reactor by biofilms, calcium alginate, chrysolite, etc., to
enhance yield.
Continuous simultaneous saccharification and fermentation was studied to produce
ethanol from grains by S. cerevisiae and 2.75 gal/bushel yields were obtained (Madson &
Monceaux, 1995). Kobayashi and Nakamura (2004) studied continuous ethanol
fermentation from starch containing medium by using recombinant S. cerevisiae and
reported 7.2 g/L ethanol and 0.23 g/L/h maximum ethanol productivity at 0.026 h−1 of the
dilution rate in the free cell culture, however, ethanol productivity increased
approximately 1.5 fold in the immobilized cell culture and reached 3.5 g/L/h productivity
at 0.4 h−1 dilution rate.
2.3.4 Integrated Processes
To attain the maximum ethanol yield and reduce the cost and time, integration of
processes is very effective. By integration of processes, several operations combine and
perform at the same unit. Since the pretreatments play a crucial role in production of
ethanol, most of the processes involve integrated hydrolysis and fermentation.

32
2.3.4.1 Simultaneous Saccharification and Fermentation (SSF)
Simultaneous saccharification and fermentation (SSF) is one of the common processes.
SSF found application to ethanol production in the starch-processing industry in the
1970s (Madson & Monceaux, 1995). After liquefaction, saccharification and ethanol
fermentation are carried out simultaneously in the same bioreactor. The benefit of this
process is elimination of substrate inhibition. Because the glucose is transferred into
ethanol right after its conversion from polysaccharides, no accumulation of glucose
occurs in the media. In addition, the hydrolysis reactor is not needed (Cardona &
Sanchez, 2007). The drawback of SSF is that both saccharification and fermentation have
different optimal conditions to obtain maximum yield, and it is difficult to optimize
parameters for both hydrolysis and fermentation. Optimizing temperature is especially an
issue, because hydrolysis of starch requires a high temperature, whereas high temperature
is an inhibitor for ethanol production. Costs of enzyme are of concern because more
enzymes are needed for a high yield (Cardona & Sanchez, 2007).
Because optimization of the process plays crucial role for SSF systems, a large and
growing body of literature has studied SSF processes optimization. Zhang et al. (2011)
were able to utilize SSF to reduce the viscosity of raw sweet potato for bioethanol
production by addition of xylanase enzyme, and achieved high concentration of ethanol
(128.51 g/L) in laboratory scale production of ethanol. Another research group applied
SSF process for ethanol production from very high gravity potato mash and investigate
various stress-tolerant yeasts for maximum ethanol production (Watanabe et al., 2010).
In their study highest ethanol concentration was reported as 137 g/L.
2.3.4.2 Co-culture Fermentation
Co-fermentation is also a promising application to improve ethanol fermentation from
starchy and lignocellulosic feedstocks. In this process, two or more microorganisms are
inoculated to enhance the ethanol yield. While one of the microorganisms converts
polysaccharides to glucose, the second microorganism produces the ethanol. Although,
this process prevents substrate and/or metabolite inhibition, growth parameters of

33
microorganisms are a problem. Temperature, pH range, requirement of oxygen, and
agitation are needed to be optimized for both of the microorganisms (Cardona &
Sanchez, 2007). Genetically modified microorganisms are promising to solve these
problems. By transferring the genes, which allow yeast to hydrolyze the starch, one
microorganism can be obtained for a whole process. S. cerevisiae and Z. mobilis are the
two microorganism that are mostly modified for this purpose, however E. coli and K.
oxytoca are designed as ethanol producing bacteria (Cardona & Sanchez, 2007).
Several studies investigated the co-culture fermentation for ethanol production from
starchy materials. Abouzied and Reddy (1986) studied ethanol fermentation from potato
starch by co-cultures of A. niger and S. cerevisiae. After comparing pure-culture vs co-
culture; pH, aeration, and effect of starch and yeast concentrations were investigated.
Maximum ethanol yield (5 g/100 ml) was achieved when 10% starch.
Another study is conducted to investigate the effect of agitation on ethanol fermentation
by suspended and immobilized S. cerevisiae co-cultured with suspended cells of A.
awamori (Farid, El-Enshasy, & Noor El-Deen, 2002). Immobilized yeast and free cells of
A. awamori yielded 3.7% (v/v) ethanol from12% (w/v) corn starch at 200 rpm after 72 h
of fermentation.
Suresh et al. (1999), on the other hand, compared sorghum and rice grains for SSF
ethanol production by A. niger and S. cerevisiae and reported that 2.9% (v/v) ethanol
was produced from 10% sorghum utilized as substrate after 5 days of fermentation.
Farid et al. (2002) studied the effect of agitation speed in ethanol production from starch
by co-cultures of suspended A. awamori and immobilized S. cerevisiae cells in batch and
repeated batch fermentation. Their results revealed that starch hydrolysis and glucose,
and accumulation of amyolytic enzymes were influenced by agitation speed. Maximum
amounts of enzymes were achieved at 150-200 rpm after 72 h, while the maximum
growth and glucose accumulations were observed at 200-300 rpm. Interestingly, ethanol

34
production was higher at low agitation speeds (50 rpm). Immobilized yeast and
suspended fungi produced 3.7% (v/v) ethanol from 12 % (w/v) corn starch in 72 h at 200
rpm.
2.4 Cell Immobilization
Immobilization is the prevention of the cell mobility in the fermentation reactor. Because
migration of cells are restricted, the cells can be reused over time. Long periods of
operation can be achieved by cell immobilization, while eliminating the expensive
processes of cell recovery and recycle. Genetic stability and resistance to harsh
environmental conditions while creating a favorable microenvironment for cells are also
benefits of cell immobilization. Immobilized cell systems also increases the volumetric
productivity as a result of high cell concentrations. In continuous fermentation processes,
cell immobilization also eliminates the cell wash out at high dilution rates. Product
recovery is also easier from a cell free-fermentation broth in comparison to suspended
cell fermentations (Demirci, Izmirlioglu, & Ercan, 2014; Shuler & Kargi, 2008).
Immobilization can be divided into four groups in terms of the physical mechanism,
entrapment within a porous matrix, cell flocculation, mechanical containment behind a
barrier, and immobilization on solid carrier surfaces (Demirci et al., 2014; Kourkoutas,
Bekatorou, Banat, Marchant, & Koutinas, 2004). Entrapment within a porous matrix is a
common method that is used in cell-immobilized reactors. In this technique, either cells
are diffused into a porous matrix or entrapped in situ. For diffusion of the cells, sponge,
sintered glass, ceramics, silicon carbide, polyurethane foam and chitosan are the common
materials, while hydrocolloidal gels are employed for in situ entrapment (Demirci et al.,
2014). Cells are trapped into polymeric beads by mixing the suspended cells and the
gelling material, such as agar, ca-alginate, gelatin, polystyrene, κ-carrageenan,
polyurethane. Although cell entrapment is a common method for immobilization,
instability of the gel, and limited transfer of nutrients and oxygen and cell leakage from
the matrix still remain as disadvantages of this technique.

35
Cell flocculation is the accumulation of the microbial cells to form a larger colony, and
commonly observed among fungi, molds, and plant cells. Accumulation of the cells can
be promoted by flocculating agents or cross-linkers. Cell aggregation is influenced by
number of factors, including cell wall composition, culture conditions, such as pH,
dissolved oxygen, agitation, temperature, and nutrient availability (Demirci et al., 2014).
Immobilization on solid surfaces is simply accumulation of the cells on a solid support by
physical adsorption, and called biofilm. Biofilm formation occurs naturally may
overcome the limitations of cell entrapment.
2.5 Principles of Biofilm
In nature, microorganisms occur as a part of structured communities, and in this
microbial community, a highly organized systems are created for metabolic cooperation
and communication between the cells (Maksimova, 2014). In general, this microbial
communities, biofilms, are described as structured communities of bacteria, algae,
cyanobacteria, fungi, and protozoa embedded in matrix of extracellular polymers.
Biofilm formation may occur as attachment of cells on a biotic or abiotic surfaces and/or
on the surface of other cells (Ercan & Demirci, 2015a; Z. Wang & Chen, 2009).
Extracellular polymers can be made up of protein, polysaccharide, nucleic acids, lipids,
and inorganic substances at different ratios and account for approximately 85% of the
biofilm while other 15% is cells (Ercan & Demirci, 2013; Z. Wang & Chen, 2009). The
presence of extracellular polymers create a microenvironment and cells in biofilm show
different metabolic activities and resistance to antimicrobial agents due to genetic
adaptation compared to suspended cells (Cheng et al., 2010a; Demirci, Pongtharangkul,
& Pometto, 2007; Z. Wang & Chen, 2009).
Biofilms have been of concern because of bio-corrosion of pipelines and communication
systems, biofouling of heat exchangers and other equipment in food processing industry,
infectious growth on medical equipment, on implants, and catheters (Cheng et al., 2010a;
Ercan & Demirci, 2015a; Z. Wang & Chen, 2009). In addition to detrimental effects of

36
biofilms, controlled biofilm systems can be used to solve environmental issues, such as
removal of contaminants from natural streams and in waste water treatment plants.
Furthermore, biofilms can be applied in biotechnology industry for improved productions
of value added products. Although waste water treatment has been studied extensively
and employed in the industry, production of value added products have studied only in
lab scale. Biofilm reactors, however, have been studied to enhance productions of
bioethanol, organic acids, and enzymes.
2.5.1 Biofilm Formation and Structure
Based on the environmental and physiological factors, such as cell density, nutrient
availability, and stress, microorganisms are capable of changing their life style from
planktonic mode to biofilm or vice versa (Ercan & Demirci, 2015a). Biofilms are formed
as a result of the cells capability to hold on to a surface, replicate, secrete extracellular
polymers, and metabolize the available nutrients in the surrounding liquid (Bryers, 1994).
Biofilm formation occurs in three steps (Figure 2.11) Attachment, the first step, is the rate
of cells transported to surface and highly depended on surface properties. Second stage is
colonization in which formations of polymer bridges occurs. Colonization is affected by
growth conditions, nutrient diffusion, and shear force. Last step is growth in which
availability nutrient and growth rate of microorganisms play a crucial role (Cheng et al.,
2010a).
The initial stage, attachment, is where the foundation of the biofilm, substratum, is
formed. Macromolecules in the fluid phase or artificially coated material forms the
substratum. The free cells in the medium attaches to the surface by sedimentation,
convention, motility and reversible adhesion forms (Bryers, 1993). After attachment,
colonization takes place. Colonization is an irreversible adhesion as consequence of the
building bridges between the substratum and extracellular polymers, known also as
matrix. In the final stage, microbial growth occur, and the growth is highly depended on
environmental factors, such as nutrient availability (Cheng et al., 2010a). Erosion,
detachment, and disruption can occur simultaneously because of hydrodynamic forces,

37
depletion of oxygen or nutrients, and stresses (Bryers, 1993). Sloughing is the
detachment of large section or the entire biofilm randomly. Once the system is in pseudo-
steady state in which growth balances with detachment, the biofilm reaches its maximum
thickness (Ercan & Demirci, 2015a).
Figure 2.11 Formation of biofilms (Cheng et al., 2010a).
Several studies have shown that biofilm structure is not uniform either in time or space
and different types of biofilm can be observed even in a well-agitated bioreactor (Demirci
et al., 2007). To date, three different models were suggested to explain the structure of
the biofilm, heterogeneous, heterogeneous mosaic, and mushroom models (Cheng et al.,
2010a; Demirci et al., 2007). Figure 2.12 is a demonstration of the proposed models.
Heterogeneous model is a dense, planar, and homogenous and biofilm is exposed the
flowing liquid. Heterogeneous mosaic model is the second model in which extracellular
polymers keeps the cells together and creates columns of cells that are separated by water
channels. The last model, mushroom, is a mushroom shaped column surrounded by water
channels (Demirci et al., 2007). It has been documented that biofilm structure is affected
by a number factors, nutrient availability, diffusion, extracellular polymer production and

38
adhesion, growth rate of microorganisms, shear force, culturing conditions (e.g.
temperature, pH, etc) (Cheng et al., 2010a; Demirci et al., 2007).
Figure 2.12 Biofilm Structure: (a) heterogeneous model, (b) heterogeneous mosaic
model, and (c) mushroom model ( Demirci et al., 2007).
Biofilm formation is affected by a number of factors, and biofilm thickness differ from a
few microns to a few centimeters. The factors effecting the thickness of the biofilm are
reported as microbial species, age of biofilm, nutrient availability, and shear stress (Ercan
& Demirci, 2015a). Another factor effecting the biofilm formation and structure is
extracellular polymers, since the biofilm matrix is made of 50-90% of the extracellular
polymer, as well as protein and inorganic matters (Ercan & Demirci, 2015a).
Polysaccharides and proteins, that are constituents of the extracellular polymers, play role
in the adhesion and accumulation of the cells, cohesion of the cells, stability of the
biofilm, communication among cells, and creates a microenvironment around the biofilm
and increase the resistance to inhibitors and antimicrobial agents (Ercan & Demirci,
2015a).
2.5.2 Biofilm Reactors
Biofilm reactors can be categorized as fixed bed and expanded- bed reactors. In fixed bed
reactors, biofilm formation occur in static medium. In submerged fixed bed reactors,

39
biofilm particles are fully submerged in the liquid, whereas in trickling filters, liquid runs
through the biofilm bed whilst the gas flows upward. Another type of the fixed bed
reactors is rotating biological contactor, and biofilm forms on the surface of a partially
immersed rotating vertical disk. Membrane biofilm reactors, a porous gas-permeable
membrane is employed to promote the biofilm formation (Demirci et al., 2007). In
contrast, biofilm develops in a continuously moving medium in expanded-bed reactors in
which high air or liquid velocity, or mechanical agitation is used as the stirring force.
Fluidized beds is designed to allow the vertical movement of the support materials in the
defined zone of the reactor. Air-lift reactor and circulating bed reactors are the two
examples of moving bed reactors in which expanded bed flows throughout the reactor
(Demirci et al., 2007).
2.5.3 Biofilm Support Materials
Support materials play a crucial role for a successful biofilm formation, and should be
selected in consideration of following factors; microbial adhesion, resistance to shear
forces and particle collision, cost-efficient, and availability. In addition, surface charge,
hydrophobicity, porosity, roughness, particle diameter, and density should be accounted
to promote the cell adhesion (Demirci et al., 2007). Some of the materials that are
employed for biofilm formation are woven mesh, polyester sponges, glass ceramic
material, coal, sand, polymeric materials, lignocellulosic materials (e.g. sawdust, wood
chips, rice husks, cotton towels and straw, corn stalks), and agricultural by-products
(Ercan & Demirci, 2015a).
A greater surface area on solid support can be achieved with a smaller diameter of carrier
particles and rough and/or porous surface materials. Increased porosity also provides
sheltered places for cells and decreases the negative effects of hydraulic shear forces.
Another advantage of porous material is encouraged biofilm formation not only on the
surface, but also within the pores. Previous studies suggested that surface colonization is
more favorable if pores are in agreement with microbial cell size. However, nutrient
deficiency and accumulation of gaseous metabolites inside porous carriers may cause

40
carrier washout, can be overcome by using materials with adequately large pores and
internal porous volume (Demirci et al., 2007).
Plastic composite supports (PCS) are a type of the solid supports made from
polypropylene and agricultural products which are developed at Iowa State University
(Pometto, Demirci, & Johnson, 1997) and is an extrusion product of polypropylene and
several agricultural products which can be custom-made for specific microorganism.
Polypropylene and agricultural by-products were mixed and extruded with twin screw
corotating Brabender PL2000 extruder (model CTSE-V; Brabender Instruments, South
Hackensack, NJ) at a rate of 11 rpm with a barrel temperature of 200ºC and a die
temperature of 167ºC to form a continuous tube. The tubes with a wall thickness of 3.5
mm and an outer diameter of 10.5mm can be sized down to desired dimension, such as
6.5 –cm length tubes (PCS tubes) or 3-mm slices (PCS rings) (K. L. Ho, Pometto, Hinz,
& Demirci, 1997) The PCS rings and tubes were used as solid supports with different
bioreactor designs for biofilm formation, for example in packed-bed reactors (K. L. Ho,
Pometto, & Hinz, 1997) or as PCS tubes attached to the bioreactor agitator shaft (Ercan
& Demirci, 2015b).
Polypropylene acts as a matrix to integrate the mixture of agricultural products, which
provide essential nutrients to sustain cell growth. Thus, PCS provides an ideal physical
structure for biofilm formation, besides releasing nutrients for microorganisms.
Moreover, nutrient composition can be customized to meet the requirement of the target
microorganism. PCS have been studied in various value added products by researchers in
bench-scale bioreactors. Pongtharankul and Demirci (2006) studied nisin production in
PCS reactors, and reported that nisin production rate increased 3.8 fold when using the
best complex medium. Demirci et al. (1997) evaluated various PCS compositions for
ethanol production by S. cerevisiae in biofilm reactors in repeated batch and continuous
fermentation and reported that 30 g/L ethanol produced on PCS bioreactors; whereas only
5 g/L ethanol produced polypropylene composite support is used alone. Cheng et
al.(2010b) studied pullulan production in PCS biofilm reactors. They reported that the

41
pullulan production reached 60.7 g/l, which was 1.8 times higher than the result from
initial medium, and was the highest yield reported to date with optimum condition.
2.5.4 Applications of Biofilm Reactors in Bioethanol Production
Biofilm reactors have been investigated for bioethanol production. In study of Zhang et
al. (2009) corn stalks were used as a solid support for biofilm formation of Clostridia
beijerinckii for continuous production of acetone-butanol-ethanol (ABE). The cell
immobilization was encouraged with medium circulation while product was removed. A
high solvent productivity, and the highest solvent yield was reported as 5.06 g/L/h and
0.25 h-1, respectively. An increase in yield, 0.8 g/g, was also observed when corn stalk
cell immobilization was used compared to suspended cell fermentation.
A comparison study of suspended cell culture vs biofilm of Z. mobilis were undertaken
by Todhanakasem et al. (2014) to evaluate the ethanol production efficiencies on rice
bran with different solid support, as well as tolerance to toxic inhibitors. It was reported
that Z. mobilis preferred plastic surfaces rather than glass for cell attachment. In the
presence of inhibitors, percentage of cell viability was higher in biofilm reactor (54.32%)
than suspended cell culture (28.69%). Metabolic activity and ethanol production, and
theoretical yields of ethanol were also reported higher for biofilm culture.
Chen et al. (2008) studied packed bed biofilm reactor and employed loofa sponge as a
solid support for cell immobilization to produce ethanol from raw starch. An engineered
S. cerevisiae strain coexpressing the glucoamylase from R. oryzae and α-amylase from
Streptococus bovis on cell surface was used for ethanol production. In batch
fermentation, 53 g/L ethanol production was observed at the end of 7 days fermentation
by using 50 g/L cells. The fermentation time was reduced to 3 days when cells were
immobilized in loofa sponge and 42 g/L ethanol production was achieved. Due to the
limited starch diffusion, reduced cell viability and decreased cell mass, the ethanol
production could not increase thereafter, and an addition of cells was proposed to
increase the ethanol production.

42
Abe et al. (2013) conducted a mix-specie biofilm study on cellulose and glass beads for
ethanol fermentation in repeated batch culture. S. cerevisiae and Lactobacillus plantarum
were employed for ethanol fermentation. Even though mixed-specie biofilm resulted
lower ethanol production compared to S. cerevisiae single culture system because of the
production of lactate, a higher resistance to contamination of Esherichia coli and Bacillus
subtilis was observed in mixed-specie biofilm. Also, cells of the mixed-specie biofilm
system were viable and stable during 10 times repeated batch cultures.
Ogbonna et al. (2001) designed a loofa sponge immobilized bioreactor for ethanol
production from sugar beet juice by S. cerevisiae. It was observed that a bed of sliced
loofa sponges in 8-L reactors caused mixing problems, and as a result of that cell
uniformity throughout the reactor was lacking, compared to 2-L bubble reactor. Ethanol
productivity was also decreased. However, using external loop bioreactor, the fixed bed
was constructed with cylindrical loofa sponges, and bed was divided into three sections,
upper, lower and middle with 1 cm spaces between them, and circulating the loop during
the immobilization, cell uniformity was achieved. The modified bioreactor design was
scaled up to 50-L and no difference was observed in ethanol productivity and yield
compared to 2 L bubble column reactor. Therefore, authors proposed that this design can
be scaled up for large scale ethanol productions.
Biofilm reactors with plastic composite supports were also studied for ethanol
production. Kunduru and Pometto (1996) evaluated different compositions of plastic
composite supports for ethanol production in packed bed biofilm reactor, and the PCS
composed of 25% corn hulls, cellulose, oat hulls, soybean hulls, starch, and
polypropylene was tested for ethanol production. Authors also investigated pure cultures
of Z. mobilis or S. cerevisiae, and mixed cultures of Z. mobilis and Streptomyces
viridosporus (as biofilm forming strain) or S. cerevisiae and S. viridosporous. Compared
to suspension cell fermentation, ethanol productivities of Z. mobilis and S. cerevisiae in
biofilm fermentations were 3 and 8 fold higher, respectively. Their results, also, revealed

43
that Z. mobilis did not benefit from mix culture, and its productivity and cell aggregation
characteristics were better than S. cerevisiae. However, mixed culture fermentation can
be used with S. cerevisiae to obtain higher productivities. Later, continuous ethanol
fermentations were conducted in PCS biofilm reactors for 60 days by Z. mobilis or S.
cerevisiae (Kunduru & Pometto, 1996a). The compositions of plastic composite-supports
were polypropylene (75%) with ground soybean-hulls (20%) and zein (5%) for Z.
mobilis, or ground soybean-hulls (20%) and soybean flour (5%) for S. cerevisiae.
Maximum productivity was reported as 499 g/ L /h (37% yield) by Z. mobilis while the
productivity without support was only 124 g/L/h by Z. mobilis.
Another study was conducted by Demirci et al. (1997) to evaluate ethanol production in
biofilm reactor with plastic composite support. The best composite composition was
reported as 40% soybean hull, 5% soybean flour, 5% yeast extract and salt and 50%
polypropylene. They also reported that S. cerevisiae produced 30 g/L ethanol on PCS
with ammonium sulfate medium, which had lowered nitrogen content, in repeated batch
fermentation. This production level was found two to ten times higher than on
polypropylene-alone support.
A recent study of Germec et al. (2015) biofilm reactors with PCS was studied for ethanol
production by S. cerevisiae using carob extract. Among tested PCS types, PCS containing
soybean hull, soybean flour, yeast extract, bovine albumin and salts was selected. After
statistical optimization of the process, 24.51 g/L of ethanol production was achieved at
the optimal conditions (initial sugar content of 7.71 ºBx, pH of 5.18, and agitation of 120
rpm. An 18 h reduction in fermentation time was also reported in use of biofilm reactors
compared to suspended cell fermentation.
2.5.5 Benefits and Limitations of Biofilm Reactors
Biofilm reactors has many advantages over suspended cell reactors, higher biomass
density, and operational stability. Biofilm reactors can carry 5 -10 times more biomass
per unit volume of reactor, therefore, increase the production rates, decrease the risk of

44
washing out when operating at high dilution rates during continuous fermentation, and
eliminate the need for re-inoculation during repeated-batch fermentation. The biofilm
matrix contributes to high resistance of microorganisms to extreme conditions of pH and
temperature, contaminations, hydraulic shocks, antibiotics, and toxic substances (Demirci
et al., 2007).
Although ethanol is product of fermentation, its inhibitory, antimicrobial, effect on
microbial growth is well known. Thus, conventional ethanol production systems can
tolerate up to 4 - 4.5% ethanol because of the product inhibition. Although developments
of ethanol-tolerant strains by genetic engineering, still ethanol tolerance is an issue in the
ethanol industry. Biofilm, on the other hand, is shown improvement on ethanol tolerance
for yeast and bacteria in comparison to suspended cell fermentations (Z. Wang & Chen,
2009). Biofilm increases the resistance to antimicrobial agents 10 to 1,000-fold compared
to suspended cells (Mah & O’Toole, 2001). Even though the mechanism of antimicrobial
resistance has not fully understood, common belief is slow microbial growth rate
improves the microbial tolerance to inhibitor (Wang & Chen, 2009). It is suggested that
antimicrobial agents act on fast growing bacteria, and cells exist in biofilm have limited
access to nutrients. Therefore, changes in cell wall components, for example fatty acids,
phospholipids, and protein causes slow growth (Z. Wang & Chen, 2009). Increased
ethanol tolerance in biofilm immobilized S. cerevisiae cells follow the same mechanism.
Moreover, biofilm improves the stability of the hydration layer around the cell, thereby,
provides increased protection. It is because it is suggested that inhibition of ethanol
caused by severe cell dehydration, and biofilm microenvironment keeps the water around
the yeast cells (Z. Wang & Chen, 2009).
Although biofilm reactors have benefits for most of the fermentation process, there are
still some limitations. In biofilm reactors, diffusion of oxygen and substrate into the cell
or release of the extracellular product to the medium can be limited. The number of the
cell layers in the biofilm may differ depending on the strain, and environmental
conditions. Changes in the cell layer may affect the biofilm thickness and create diffusion

45
resistance to the substrate and nutrients. Extended starting time of biofilm processes is
another limitation factor for biofilm reactors. Furthermore, biofilm reactor design may
cause some limitations itself (Ercan & Demirci, 2015a).
2.6 Industrial Potato Waste
Agro-industrial wastes have gained attention for bioethanol production not only to
manage the waste issues of industry economically and environmentally, but also its
abundance, availability, biodegradability, and also rich nutrient content (Gassara, Brar,
Tyagi, Verma, & Surampalli, 2010). The utilization of such waste in the fermentation
industry may help reduce the production costs of value-added products created via
fermentation.
Potato is a starchy, tuberous crop vegetable from the perennial Solanum tuberosum of the
Solanaceae family and composed of 80% moisture and 18% starch. Figure 2.13 is an
illustration of starch build up in potato. It is a high value crop as a food source, and
currently, potatoes are consumed fresh and frozen, such as chips, dehydrated, and canned
in the US (ERS, 2016).The U.S. produced about 22 million tons of potatoes, with
approximately 97,250 tons of potatoes produced in Pennsylvania during 2013 (NPC,
2015). Potato processing industry usually yields up to 50% of the incoming potatoes as
waste (Charmley, Nelson, & Zvomuya, 2006). Four to five million liters of ethanol could
be produced from 44,000 tons of processing waste potato according to a study in
Canada’s potato-growing province of New Brunswick (IYP, 2008).
Because of the high starch content, potato can be a feedstock for ethanol production.
Srichuwong et al. (2009) states that “ According to available amount of fermentable
sugars (soluble sugars and starch), 1 kg of fresh tuber (potato) would yield approximately
126 g or 160 ml of ethanol, if complete conversion of fermentable sugars to ethanol was
accomplished.”

46
Figure 2.13 Zoom in of how a potato starch tuber is built-up. A, tuber; B, electron
microscopic image of starch granules; C, slice of a starch granule showing
the growth rings consisting of semi-crystalline and amorphous regions; D,
detail of the semi-crystalline region; E, organization of the amylopectin
molecule into the tree-like structure; F, two glucose molecules with an 1-4
glycosidic bond (van der Maarel et al., 2002).
Although potato is a high-value product, the cost of bioethanol production can be
decreased by using wastes from the potato industry. The amount of the waste potato,
however, varies from one potato processing plant to another, as well as the type of the
waste. For example, according to the study of Oda et al. (2002) 10% waste potato pulp is
produced during the process by which approximately one million harvested potatoes are
processed. potato processing industry creates 10% waste potato pulp, 5-20% cull
potatoes (Liimatainen, Toiva, & Kaariainen, 2004), and 15-40% peel (Arapoglou,
Varzakas, Vlyssides, & Israilides, 2010). Moreover, in the potato chips industry, 18% of
the potatoes goes into waste and could be a raw material for fermentative alcohol
production (Fadel, 2000). There have been several studies demonstrated the potential of
industrial potato waste (including potato peels, potato mash, potato pulp, and potato
processing wastewater) for the production of bioethanol, α-amylase, lactic acid, and
pullulan (Arapoglou et al., 2010; Barnett, Smith, Scanlon, & Israilides, 1999; Fadel,
2000; Huang, Jin, Lant, & Zhou, 2005; Izmirlioglu & Demirci, 2012).

47
Currently, waste potato is utilized as animal feed after a drying process, which is an
energy demanding process. Without a drying process, waste potato could be used in the
production of ethanol. Waste potato is a promising feedstock for ethanol fermentation
and can provide growth of microorganisms, because of available carbohydrate, vitamins
(A,D,K,C, foliate, niacin, riboflavin, and thiamin) and minerals such as sodium,
potassium, magnesium, calcium, zinc, iodine and finally nitrogen (Diop, 1998; Le
Tourneau, 1956).
2.6.1 Ethanol Fermentation by using Potato Waste
Utilization of waste potato for high yield ethanol production is the main purpose of the
fermentation of potato medium. Because potato is a starchy material the fermentation
process of potato waste starts with hydrolysis. Fadel (2000) used acid hydrolysis with 0.5
N H2SO4 at 121ºCfor ethanol production from potato industry starchy waste. However,
inhibitory effects on yeast growth of by-products of acid hydrolysis is reported by Tasic
et al. (2009). In their study, neutralization of hydrolyzates and expensive constructional
equipment are also indicated as disadvantages of acid hydrolysis in the industry.
Liimatainen et al. (2004) applied an enzyme to carry out the liquefaction and
saccharification steps of hydrolysis. After hydrolyzation of the starch, fermentation can
be performed to produce ethanol.
Fadel (2000)carried out alcohol fermentation using various S. cerevisiae strains using
wastes of potato chips industry in batch fermentation, and reported effects of initial pH
value, nitrogen source and level, inoculum size, and agitation it has been reported that the
maximum alcohol production (9.42%) was at pH 5.5, whereas inoculation of 10% culture
of S. cerevisiae produced 12.9% of ethanol in the fermentation broth. To determine the
effect of the nitrogen source, six different inorganic nitrogen sources (diammonium
phosphate, ammonium hydrogen phosphate, ammonium sulfate, diammonium
phosphate:urea (1:2), urea+KH2PO4, and urea+H3PO4) were studied and it was reported
that diammonium phosphate resulted in higher ethanol production (9.42% alcohol)
among studied nitrogen sources. It was also found that ammonium sulfate yielded the

48
lowest alcohol (8.30%). However, overall results revealed that different nitrogen sources
are suitable for ethanol fermentation.
Liimatainen et al. (2004) studied the effect of potato cultivar and reported that “5-20% of
potato crops are by-products in potato cultivation.”. Properties of ten different waste
potato cultivars and ethanol yield of these different potato cultivars were compared after
fermentations and the effect of potato cultivar was reported. Their study showed that
ethanol yield varies among cultivars. The highest ethanol yield among ten different
cultivars was 9.5 g of ethanol/100 g of potato and the lowest one was 6.5 g of ethanol/100
g of potato.
Hashem and Darwish (2010) studied bioethanol production by S. cerevisiae from potato
starch residue stream produced during chips manufacturing in a repeated batch process.
Acid hydrolysis was carried out for starch hydrolysis at 100ºC for 1 h using 1% H2SO4.
The maximum ethanol yield was reported 5.52 g/L at 35ºC at the end of 36 h
fermentation. Even though 0.4 g/L of ZnCl2 supplementation enhanced the ethanol
production, addition of NH4NO3 showed no significant effect on either biomass or
ethanol production.
Another study was undertaken by Rani et al. (2010) to evaluate the ethanol production
from potato flour by S. cerevisiae in batch fermentation. Liquefaction and
saccharification of the starch were carried out with 2.05 DUN U/ g starch of α-amylase
and 20.5 GA U/g starch at 80 and 60ºC, respectively. Total reducing sugars of the
hydrolysate was reported to be 15.2%. S. cerevisiae produced 56.8 g/L of ethanol from
the hydrolysate at 30ºC for 48 h with no supplementation.
Another waste of potato processing that was investigated for ethanol production was
peels of potato (Arapoglou et al., 2010). In this study, three commercial enzyme was used
for hydrolysis, and 18.5 g/L of reducing sugar was released at the end of the
hydrolyzation process. The maximum ethanol production was reported as 7.6 g/L.

49
For more effective ethanol fermentation from waste potato, two or more fermentation
processes can be integrated. Simultaneous saccharification and fermentation of very high
gravity potato mash has already been investigated by Srichuwong et al. (2009) who
reported that 16.61% yield of ethanol was obtained. However, in this study one of the
drawbacks was the viscosity of the potato mash.
Lim et al. (2013) studied high gravity (28% solid content) ethanol fermentation from
potato tubers to achieve high ethanol yields. The viscosity of the potato was controlled
using Viscozyme (0.1%) at 50ºC for 30 min, and liquefaction was carried out with
Liquozyme (0.1%) at 90ºC for 30 min. Later, SSF conditions were optimized by using
statistical design, and optimal sachharifying enzyme dosage was found to be 1.45 AGU/g
dry matter at a 31.3ºC incubation time. At this optimal conditions for SSF, 14.92% (v/v)
ethanol was produced with a 91.0% of theoretical yield after 60 h.
By-products (potato peel and substandard mash) of a local plant in Japan were studied for
ethanol production by Yamada et al. (2009). In this study after liquefaction and partial
saccharification, hydrolysis of sugars by glucoamylase and fermentation were carried out
simultaneously. A reasonable conversion of sugars to ethanol was obtained with 42.5%
yield. Fresh potato peel, 12% (w/w) yielded 20 g/L ethanol, however, a mixture of
substandard mash and potato peel (1:1) produced 50 g/L of ethanol.
Watanabe et al. (2010) conducted a study to select a stress-tolerant yeast for simultaneous
saccharification and fermentation of very high gravity potato mash to ethanol. After
screening 1699 yeast strains, three Saccharomyces strains, NFRI3062, NFRI3213, and
NFRI3225 were the selected candidates. NFRI3225 produced the maximum ethanol at
the fastest rate among the tested strains in simultaneous saccharification and fermentation
of very high gravity potato mash. The maximum productivity and ethanol yields were
reported as 9.1 g/L/h and 92.3%, respectively with a 13.7% (w/v) ethanol.

50
2.7 Statistical designs
Fermentation optimization involves many biochemical and physical parameters,
including those of medium and growth. The classical method of studying one variable at
a time is time-consuming, laborious, and impractical. Statistical designs have already
been applied to fermentation studies and provide an efficient way of obtaining
meaningful results with a reduced number of experiments. Statistical designs can also be
adopted at various stages of the fermentation optimization process, such as during the
screening of a large number of factors or during the optimization of the process.
The Plackett-Burman statistical design (Plackett & Burman, 1946) is a particularly
effective method for screening a large number of factors. The Plackett-Burman design
provides sufficient information for investigating the significant factors in a given
response. The Plackett-Burman design is a fractional factorial that allows N-1 variables
with N experiments. This design utilizes two levels for each factor: the high (+) level and
the low (-) level. The effect of each variable on the response is calculated as shown in
Equation 3.1,
𝐸 =∑ 𝑦(+)
𝑁−
∑ 𝑦(−)
𝑁....……………………………………….. Eqn. 2.1
where E is the effect of the factor; y(+) and y(-) are the responses when a given factor is
at its high and low levels, respectively; and N is the total number of experiments. As seen
in Eqn. 2.1, the Plackett-Burman design does not consider the interactions among factors
and is instead used only to screen important factors that influence the response.
Response Surface Methodology (RSM) is a combination of mathematical and statistical
techniques and used for the modeling and analysis of problems in which a response of
interest is influenced by several variables and the objective is to optimize this response.
y = β0 + β1x1 + β2x2 + β12x1x2 + β11x12 + β22x2
2 + ε.................................Eqn. 2.2

51
The central composite design of surface response methodology is best suited for
optimizing with a smaller set of factors.
Figure 2.14 Illustration of central composite design
(https://onlinecourses.science.psu.edu/stat503/).
The central composite design is a factorial design with center points, which is improved
by the use of star points (α). If the distance from the center of the design space to a given
factorial point is ±1 unit for each factor, the distance from the center of the design space
to a star point must necessarily be |𝛼| > 1. The value of α depends on the specific
properties of the desired design. To maintain rotatability, the value of α depends on the
number of experimental runs in the factorial portion of the central composite design:
α=[number of factorial runs]1/4
If the factorial is a full factorial, then
α=[2k]1/4

52
Furthermore, Box-Behnken is a sub-category of response surface design and is used to
study the quadratic effect of factors after identifying the significant factors using
screening factorial experiments. In this design, center points of edges of the experimental
space are used for treatment. The figure illustrates a three-factor Box-Behnken design
showing the experimental runs that are carried out:
Figure 2.15 Representation of Box-Behnken design.
Box-Behnken designs provide estimation of the first- and second-order coefficients.
Because this design often has less points, it can be inexpensive to perform compared to
the central composite design with the same number of factors.
2.8 State-of-the-Art
Renewable energy sources are in demand due to increasing environmental concerns, as
well as depletion of petroleum reserves. Bioethanol, is one of the environment friendly-
renewable energy sources, has been considered as an alternative to petroleum-based fuel.
A variety of raw material is used for ethanol production however all of these materials
have advantages and disadvantages. Corn is the major source for ethanol production in
the U.S. (97%), but this production of crops causes more soil erosion and requires more
nitrogen fertilizer than other crops. In Brazil, sugar cane production also has the same
environmental limitations. Cellulosic feedstock requires expensive pretreatments to be

53
effective for ethanol production. Because of the cost of ethanol, inexpensive raw material
is important to produce economical ethanol. Therefore, the main goal of most of the
studies in bioethanol production is to produce economical and competitive ethanol
compared to gasoline. Because waste potato is neither a food source nor requires
expensive pretreatments compared to lignocellulosic raw materials, the waste of the
potato industry could be utilized as a raw material for the ethanol industry to produce
inexpensive bioethanol. However, the literature does not provide enough information
about utilization of waste potato mash of the potato industry since many types of waste
exist depending on the plant and processed potato product.
A simple process may not give the best productivity and economic feasibility at the same
time for ethanol production. To attain the maximum ethanol yield and reduce the cost and
time, integration of processes is very effective. Simultaneous saccharification and
fermentation (SSF) is one of the common integrated processes. SSF can be conducted as
a combination of enzyme and microorganism or microorganism and microorganism as
well. The benefit of this process is elimination of substrate inhibition; however,
optimization of saccharification and fermentation conditions is a bottleneck of process.
Co-fermentation is also promising application to improve ethanol fermentation in
cooperation with SSF. In this process, two or more microorganisms are inoculated to
enhance the ethanol yield. While one of the microorganisms converts polysaccharides to
glucose, the second microorganism produces the ethanol. Although, this process prevents
substrate and/or metabolite inhibition, growth parameters of co-cultured microorganisms
may be a problem.
Another common application to maximize the yield of value-added product fermentation
is cell immobilization. Biofilm, a cell immobilization technique, is attachment of
microorganisms to solid supports. Biofilms, basically, increase the cell population in the
reactor which also increases the production of fermentation by-products. Plastic
Composite Support (PCS) is one of the biofilms which are composed of polypropylene
and several agriculture products. Because agricultural products provide nutrients for cell

54
growth whereas polypropylene acts as a matrix, PCS slowly releases nutrients during
fermentation. Moreover, PCS can be composed depending on the nutrients requirements
of target microorganism.
Therefore, the goal of this research is to eliminate the limitations of integrated processes,
and enhance the ethanol production from waste potato mash. In order to achieve the goal,
several objectives have been fulfilled. First, a strain selection has been carried out for
glucoamylase production. After strain selection, glucoamylase production was improved
with statistical optimization of medium for selected strain (Chapter 3). Subsequently,
different medium constituents for S. cerevisiae was evaluated for enhanced ethanol
production, and the optimum fermentation medium for S. cerevisiae has been determined
for ethanol production using industrial potato waste (Chapter 4). Moreover, a medium has
been defined for simultaneous saccharification and fermentation by using co-cultures of
A. niger and S. cerevisiae. Then, defined medium was used to achieve the maximum
ethanol production from non-treated potato waste (Chapter 5). Later, biofilm reactors
have been utilized as a novel approach for production of bioethanol from potato waste
hydrolysate by optimizing the growth parameters for S. cerevisiae in biofilm reactor. In
order to achieve a successful biofilm formation, plastic composite supports evaluated.
Then, the optimum growth conditions (pH, temperature, and agitation) of S. cerevisiae
was determined for ethanol production in biofilm reactor with selected plastic composite
support (Chapter 6). Finally, the optimal growth conditions for co-cultures of A. niger
and S. cerevisiae for simultaneous saccharification and fermentation of ethanol using
industrial waste potato medium in biofilm reactor was determined and biofilm formation
was evaluated with scanning electron microscopy (Chapter 8).
2.9 References
Abe, A., Furukawa, S., Watanabe, S., & Morinaga, Y. (2013). Yeasts and lactic acid
bacteria mixed-specie biofilm formation is a promising cell immobilization
technology for ethanol fermentation. Applied Biochemistry and Biotechnology,
171(1), 72–79. http://doi.org/10.1007/s12010-013-0360-6

55
Abouzied, M. M., & Reddy, C. a. (1986). Direct fermentation of potato starch to ethanol
by co-cultures of Aspergillus niger and Saccharomyces cerevisiae. Applied and
Environmental Microbiology, 52(5), 1055–1059.
Albers, E., Larsson, C., Lidén, G., Niklasson, C., & Gustafsson, L. (1996). Influence of
the nitrogen source on Saccharomyces cerevisiae anaerobic growth and product
formation. Applied and Environmental Microbiology, 62(9), 3187–3195.
Alfenore, S., Molina-Jouve, S., Guillouet, S. E., Uribelarrea, L., Goma, G., & Benbadis,
L. (2002). Improving ethanol production and viability of Saccharomyces cerevisiae
by a vitamin feeding strategy during fed-batch process. Applied Microbiology and
Biotechnology, 60, 67–72. http://doi.org/10.1007/s00253-002-1092-7
Amirul, A. A., Khoo, S. L., Nazalan, M. N., Razip, M. S., & Azizan, M. N. (1996).
Purification and properties of two forms of glucoamylase from Aspergillus niger.
Folia Microbiologica, 41(2), 165–174. http://doi.org/9138312
Anderson, P. J., McNeil, K., & Watson, K. (1986). High-efficiency carbohydrate
fermentation to ethanol at temperatures above 40ºC by Kuyveromyces marxianus
var. marxianus isolated from sugar mills. Applied and Environmental Microbiology,
51(6), 1314–1320.
Anto, H., Trivedi, U. B., & Patel, K. C. (2006). Glucoamylase production by solid-state
fermentation using rice flake manufacturing waste products as substrate. Bioresource
Technology, 97, 1161–1166. http://doi.org/10.1016/j.biortech.2005.05.007
Arapoglou, D., Varzakas, T., Vlyssides, a., & Israilides, C. (2010). Ethanol production
from potato peel waste (PPW). Waste Management, 30(10), 1898–1902.
http://doi.org/10.1016/j.wasman.2010.04.017
Arnthong, J., Wanitchaploy, B., Sakai, K., Sanglier, J., & Kitpreechavanich, V. (2010).
Statistical screening of factors affecting glucoamylase production by a
thermotolerant Rhizopus microsporus TISTR 3518 using Plackett-Burman design.
African Journal of Biotechnology, 9(43), 7312–7316.
http://doi.org/10.5897/AJB10.049
Bader, J., Mast-Gerlach, E., Popović, M. K., Bajpai, R., & Stahl, U. (2010). Relevance of
microbial co-culture fermentations in biotechnology. Journal of Applied
Microbiology, 109(2), 371–387. http://doi.org/10.1111/j.1365-2672.2009.04659.x
Baeyens, J., Kang, Q., Appels, L., Dewil, R., Lv, Y., & Tan, T. (2015). Challenges and
opportunities in improving the production of bio-ethanol. Progress in Energy and
Combustion Science, 47, 60–88. http://doi.org/10.1016/j.pecs.2014.10.003
Bafrncová, P., Šmogrovičová, D., Sláviková, I., Pátková, J., & Dömény, Z. (1999).
Improvement of very high gravity ethanol fermentation by media supplementation
using Saccharomyces cerevisiae. Biotechnology Letters, 21(4), 337–341.
http://doi.org/10.1023/A:1005436816047
Bai, F. W., Anderson, W. a., & Moo-Young, M. (2008). Ethanol fermentation
technologies from sugar and starch feedstocks. Biotechnology Advances, 26, 89–105.
http://doi.org/10.1016/j.biotechadv.2007.09.002
Bajpai, P. (2013). Advances in Bioethanol. http://doi.org/10.1007/978-81-322-1584-4
Bajpai, P., Gera, R. K., & Bajpai, P. K. (1992). Optimization studies for the production of
a-amylase using cheese whey medium. Enzyme and Microbial Technology, 14, 679–
683.

56
Balat, M., & Balat, H. (2009). Recent trends in global production and utilization of bio-
ethanol fuel. Applied Energy, 86(11), 2273–2282.
http://doi.org/10.1016/j.apenergy.2009.03.015
Balat, M., Balat, H., & Oz, C. (2008). Progress in bioethanol processing. Progress in
Energy and Combustion Science, 34(5), 551–573.
http://doi.org/10.1016/j.pecs.2007.11.001
Banat, I. M., Nigam, P., & Marchant, R. (1992). Isolation of thermotolerant, fermentative
yeasts growing at 52ºC and producing ethanol at 45ºC and 50ºC. World Journal of
Microbiology & Biotechnology, 8, 259–263. http://doi.org/10.1007/BF01201874
Banat, I. M., Nigam, P., Singh, D., Marchant, R., & McHale, P. (1998). Review: Ethanol
production at elevated temperatures and alcolhol concentrations: Part I - Yeast in
general. World Journal of Microbiology and Biotechnology, 14(1971), 809–821.
Barber, A. R., Henningsson, M., & Pamment, N. B. (2002). Acceleration of high gravity
yeast fermentations by acetaldehyde addition, (Atcc 26786), 891–895.
Barnett, C., Smith, A., Scanlon, B., & Israilides, C. J. (1999). Pullulan production by
Aureobasidium pullulans growing on hydrolysed potato starch waste. Carbohydrate
Polymers, 38, 203–209. http://doi.org/10.1016/S0144-8617(98)00092-7
Bartle, J. R., & Abadi, A. (2010). Toward sustainable production of second generation
bioenergy feedstocks. Energy and Fuels, 24(1), 2–9.
http://doi.org/10.1021/ef9006438
Bellaver, L., de Carvalho, N., Abrahao-Neto, J., & Gombert, A. K. (2004). Ethanol
formation and enzyme activities around glucose-6-phosphate in Kluyveromyces
marxianus CBS 6556 exposed to glucose or lactose excess. FEMS Yeast Research,
4, 691–698. http://doi.org/10.1016/j.femsyr.2004.01.004
Bera, A. K., Sedlak, M., Khan, A., & Ho, N. W. Y. (2010). Establishment of l-arabinose
fermentation in glucose/xylose co-fermenting recombinant Saccharomyces
cerevisiae 424A(LNH-ST) by genetic engineering. Applied Microbiology and
Biotechnology, 87, 1803–1811. http://doi.org/10.1007/s00253-010-2609-0
Bhatti, H. N., Rashid, M. H., Nawaz, R., Asgher, M., Perveen, R., & Jabbar, A. (2007).
Optimization of media for enhanced glucoamylase production in solid-state
fermentation by Fusarium solani. Food Technology and Biotechnology, 45(1), 51–
56.
Box, G. E. P., & Behnken, D. . (1960). Some new three level designs for the study of
quantative variables. Technometrics, 2, 455–475.
Box, G. E. P., & Wilson, K. B. (1951). On the experimental attainment of optimum
conditions. JOURNAL OF THE ROYAL STATISTICAL SOCIETY SERIES B, 13, 1–
45.
Bryers, J. D. (1993). Bacterial biofilms. Current Opinion in Biotechnology, 4, 197–204.
Bryers, J. D. (1994). Biofilms and the technological implications of microbial cell
adhesion. Colloids and Surfaces B: Biointerfaces, 2, 9–23.
http://doi.org/10.1016/0927-7765(94)80013-8
Cardona, C. A., & Sanchez, O. J. (2007). Fuel ethanol production: Process design trends
and integration opportunities. Bioresource Technology, 98(12), 2415–2457.
http://doi.org/10.1016/j.biortech.2007.01.002
Carlsen, M., Spohr, A. B., Nielsen, J., & Villadsen, J. (1996). Morphology and

57
physiology of an α-amylase producing strain of Aspergillus oryzae during batch
cultivations. Biotechnology and Bioengineering, 49, 266–276.
http://doi.org/10.1002/(SICI)1097-0290(19960205)49:3<266::AID-BIT4>3.0.CO;2-
I
Chan-u-Tit, P., Laopaiboon, L., Jaisil, P., & Laopaiboon, P. (2013). High level ethanol
production by nitrogen and osmoprotectant supplementation under very high gravity
fermentation conditions. Energies, 6(2), 884–899. http://doi.org/10.3390/en6020884
Charmley, E., Nelson, D., & Zvomuya, F. (2006). Nutrient cycling in the vegetable
processing industry: Utilization of potato by-products. Canadian Journal of Soil
Science, 86(4), 621–629. http://doi.org/10.4141/S05-118
Chen, J., Wu, K., & Fukuda, H. (2008). Bioethanol production from uncooked raw starch
by immobilized surface-engineered yeast cells. Applied Biochemistry and
Biotechnology, 145, 59–67. http://doi.org/10.1007/s12010-007-8054-6
Cheng, K.-C., Catchmark, J. M., & Demirci, A. (2009). Enhanced production of bacterial
cellulose by using a biofilm reactor and its material property analysis. Journal of
Biological Engineering, 3, 12. http://doi.org/10.1186/1754-1611-3-12
Cheng, K.-C., Demirci, A., & Catchmark, J. M. (2010a). Advances in biofilm reactors for
production of value-added products. Applied Microbiology and Biotechnology, 87,
445–456. http://doi.org/10.1007/s00253-010-2622-3
Cheng, K.-C., Demirci, A., & Catchmark, J. M. (2010b). Enhanced pullulan production in
a biofilm reactor by using response surface methodology. Journal of Industrial
Microbiology & Biotechnology, 37, 587–594. http://doi.org/10.1007/s10295-010-
0705-x
Chiquetto, M. L., FAcciotti, M. C. R., Kilikian, Beatriz, V., & Schmidell, W. (1992).
Influence of carbon and nitrogen sources on glucoamylase production by Aspergillus
in batch process. Biotechnol Lett, 14(6), 465–470.
Demirbas, A. (2009). Political, economic and environmental impacts of biofuels: A
review. Applied Energy, 86, S108–S117.
http://doi.org/10.1016/j.apenergy.2009.04.036
Demirci, A., Izmirlioglu, G., & Ercan, D. (2014). Fermentation and enzyme technologies
in food processing. In S. Clark, S. Jung, & B. Lamsal (Eds.), Food Processing:
Principles and ApplicationsF (Second Edi, pp. 107–136). West Sussex, UK: Wiley
Blackwell.
Demirci, A., Pometto, A. L. I., & Ho, K. L. G. (1997). Ethanol production by
Saccharomyces cerevisiae in biofilm reactors. Journal of Industrial Microbiology &
Biotechnology, 19, 299–304. http://doi.org/10.1038/sj.jim.2900464
Demirci, A., Pongtharangkul, T., & Pometto, A. L. (2007). Applications of biofilm
reactors for production of value-added products by microbial. In H. P. Blaschek, H.
H. Wang, & M. . Agle (Eds.), Biofilms in the Food Environment. Ames, IA:
Blackwell.
Diaz, J. T., Chinn M., & Truong, V. D. (2014). Simultaneous saccharification and
fermentation of industrial sweetpotatoes for ethanol production and anthocyanins
extraction. Industrial Crops and Products, 62, 53–60.
Diop, A. (1998). Storage and Processing of Roots and Tubers in the Tropics. Retrieved
June 27, 2015, from http://www.fao.org/docrep/x5415e/x5415e00.htm#Contents

58
Djekrif-Dakhmouche, S., Gheribi-Aoulmi, Z., Meraihi, Z., & Bennamoun, L. (2006).
Application of a statistical design to the optimization of culture medium for ??-
amylase production by Aspergillus niger ATCC 16404 grown on orange waste
powder. Journal of Food Engineering, 73, 190–197.
http://doi.org/10.1016/j.jfoodeng.2005.01.021
Dombek, K. M., & Ingram, L. O. (1986). Magnesium limitation and its role in apparent
toxicity of ethanol during yeast fermentation. Applied and Environmental
Microbiology, 52(5), 975–981.
Dykstra, M. J. (1992). Biological electron microscopy: theory, techniques, and
troubleshooting. New York: Plenum Press.
Eksteen, J. M., Rensburg, P. Van, Otero, R. R. C., & Pretorius, I. S. (2003). Starch
fermentation by recombinant Saccharomyces cerevisiae strains expressing the b -
amylase and glucoamylase genes from Lipomyces kononenkoae and
Saccharomycopsis fibuligera. Biotechnology and Bioengineering, 84(6), 639–646.
http://doi.org/10.1002/bit.10797
El-Gendy, M. M. A. (2012). Production of glucoamylase by marine endophytic
Aspergillus sp. JAN-25 under optimized solid-state fermentation conditions on agro
Residues. Australian Journal of Basic & Applied Sciences, 6(4), 41. Retrieved from
http://connection.ebscohost.com/c/articles/88895194/production-glucoamylase-by-
marine-endophytic-aspergillus-sp-jan-25-under-optimized-solid-state-fermentation-
conditions-agro-residues
Ellaiah, P., Adinarayana, K., & Bhavani, Y. (2002). Optimization of process parameters
for glucoamylase production under solid state fermentation by a newly isolated
Aspergillus species. Process Biochemistry, 38(4), 615–620.
http://doi.org/10.1016/S0032-9592(02)00188-7
Ercan, D., & Demirci, A. (2013). Production of human lysozyme in biofilm reactor and
optimization of growth parameters of Kluyveromyces lactis K7. Applied
Microbiology and Biotechnology, 97(14), 6211–6221.
Ercan, D., & Demirci, A. (2014). Enhanced human lysozyme production in biofilm
reactor by Kluyveromyces lactis K7. Biochemical Engineering Journal, 92, 2–8.
http://doi.org/10.1007/s00253-013-4944-4
Ercan, D., & Demirci, A. (2015a). Current and future trends for biofilm reactors for
fermentation processes. Critical Reviews in Biotechnology, 35, 1–14.
http://doi.org/10.3109/07388551.2013.793170
Ercan, D., & Demirci, A. (2015b). Enhanced human lysozyme production by
Kluyveromyces lactis K7 in biofilm reactor coupled with online recovery system.
Biochemical Engineering Journal, 98, 68–74.
http://doi.org/10.1016/j.bej.2014.04.013
ERS. (2016). Potatoes. Retrieved April 1, 2016, from
http://www.ers.usda.gov/topics/crops/vegetables-pulses/potatoes.aspx#potatoes
Fadel, M. (2000). Alcohol production from potato industry starchy waste. Egyptian
Journal of Microbiology, 35(3), 273–287.
Farid, M. a., El-Enshasy, H. a., & Noor El-Deen, a. M. (2002). Alcohol production from
starch by mixed cultures of Aspergillus awamori and immobilized Saccharomyces
cerevisiae at different agitation speeds. Journal of Basic Microbiology, 42(3), 162–

59
171. http://doi.org/10.1002/1521-4028(200206)42:3<162::AID-
JOBM162>3.0.CO;2-C
Francis, F., Sabu, A., Nampoothiri, K. M., Ramachandran, S., Ghosh, S., Szakacs, G., &
Pandey, A. (2003). Use of response surface methodology for optimizing process
parameters for the production of α-amylase by Aspergillus oryzae. Biochemical
Engineering Journal, 15, 107–115. http://doi.org/10.1016/S1369-703X(02)00192-4
Fujii, N., Oki, T., Sakurai, a, Suye, S., & Sakakibara, M. (2001). Ethanol production
from starch by immobilized Aspergillus awamori and Saccharomyces pastorianus
using cellulose carriers. Journal of Industrial Microbiology & Biotechnology,
27(June), 52–57. http://doi.org/10.1038/sj.jim.7000162
Gassara, F., Brar, S. K., Tyagi, R. D., Verma, M., & Surampalli, R. Y. (2010). Screening
of agro-industrial wastes to produce ligninolytic enzymes by Phanerochaete
chrysosporium. Biochemical Engineering Journal, 49(3), 388–394.
http://doi.org/10.1016/j.bej.2010.01.015
Georgieva, T. I., & Ahring, B. K. (2007). Potential of agroindustrial waste from olive oil
industry for fuel ethanol production. Biotechnology Journal, 2(12), 1547–1555.
http://doi.org/10.1002/biot.200700128
Germec, M., Turhan, I., Karhan, M., & Demirci, A. (2015). Ethanol production via
repeated-batch fermentation from carob pod extract by using Saccharomyces
cerevisiae in biofilm reactor. Fuel, 161, 304–311.
http://doi.org/10.1016/j.fuel.2015.08.060
Ghose, T. K., & Ghosh, P. (2003). Advances in Biochemical Engineering / Biotechnology.
Springer.
Godard, P., Urrestarazu, A., Vissers, S., Kontos, K., Bontempi, G., van Helden, J., &
André, B. (2007). Effect of 21 different nitrogen sources on global gene expression
in the yeast Saccharomyces cerevisiae. Molecular and Cellular Biology, 27(8),
3065–3086. http://doi.org/10.1128/MCB.01084-06
Guo, Y., Xu, J., Zhang, Y., Xu, H., Yuan, Z., & Li, D. (2010). Medium optimization for
ethanol production with Clostridium autoethanogenum with carbon monoxide as
sole carbon source. Bioresource Technology, 101(22), 8784–8789.
http://doi.org/10.1016/j.biortech.2010.06.072
Gupta, R., Gigras, P., Mohapatra, H., Goswami, V. K., & Chauhan, B. (2003). Microbial
a -amylases : a biotechnological perspecti v e. Process Biochemistry, 38, 1599–1616.
http://doi.org/10.1016/S0032-9592(03)00053-0
Haasum, I., Eriksen, S. H., Jensen, B., & Olsen, J. (1991). Growth and glucoamylase
production by the thermophilic fungus Thermomyces lanuginosus in a synthetic
medium. Applied Microbiology and Biotechnology, 34, 656–660.
http://doi.org/10.1007/BF00167918
Hahn-Hagerdal, B., Galbe, M., Gorwa-Grauslund, M. F., Liden, G., & Zacchi, G. (2006).
Bio-ethanol – the fuel of tomorrow from the residues of today. Trends in
Biotechnology, 24(12), 549–556. http://doi.org/10.1016/j.tibtech.2006.10.004
Hall, J. L., & Hawes, C. R. (1991). Electron microscopy of plant cells. San Diego:
Academic Press Inc.
Harun, R., Liu, B., & Danquah, M. K. (2011). Analysis of process configurations for
bioethanol production from microalgal biomass. In S. Shaukat (Ed.), Progress in

60
Biomass and Bioenergy Production (pp. 395–408).
Hashem, M., & Darwish, S. M. I. (2010). Production of bioethanol and associated by-
products from potato starch residue stream by Saccharomyces cerevisiae. Biomass
and Bioenergy, 34(7), 953–959. http://doi.org/10.1016/j.biombioe.2010.02.003
Ho, D. P., Ngo, H. H., & Guo, W. (2014). A mini review on renewable sources for
biofuel. Bioresource Technology, 169, 742–749.
http://doi.org/10.1016/j.biortech.2014.07.022
Ho, K. L., Pometto, A. L., & Hinz, P. N. (1997). Optimization of L-(+)-lactic acid
production by ring and disc plastic composite supports through repeated-batch
biofilm fermentation. Applied and Environmental Microbiology, 63(7), 2533–2542.
Ho, K. L., Pometto, A. L., Hinz, P. N., & Demirci, A. (1997). Nutrient leaching and end
product accumulation in plastic composite supports for L-(+)-lactic acid biofilm
fermentation. Applied and Environmental Microbiology, 63(7), 2524–2532.
Hong, Y. S., & Yoon, H. H. (2011). Ethanol production from food residues. Biomass and
Bioenergy, 35(7), 3271–3275. http://doi.org/10.1016/j.biombioe.2011.04.030
Huang, L. P., Jin, B., Lant, P., & Zhou, J. (2005). Simultaneous saccharification and
fermentation of potato starch wastewater to lactic acid by Rhizopus oryzae and
Rhizopus arrhizus. Biochemical Engineering Journal, 23, 265–276.
http://doi.org/10.1016/j.bej.2005.01.009
IYP. (2008). International year of the potato.Fact sheet:Global potato economy. Retrieved
April 1, 2016, from http://www.potato2008.org/en/potato/economy.html
Izmirlioglu, G., & Demirci, A. (2012). Ethanol production from waste potato mash by
using Saccharomyces cerevisiae. Applied Sciences, 2, 738–753.
http://doi.org/10.3390/app2040738
Jansson, C., Westerbergh, A., Zhang, J., Hu, X., & Sun, C. (2009). Cassava , a potential
biofuel crop in ( the ) People ’ s Republic of China. Applied Energy, 86, S95–S99.
http://doi.org/10.1016/j.apenergy.2009.05.011
Jensen, B., Nebelong, P., Olsen, J., & Reeslev, M. (2002). Enzyme production in
continuous cultivation by the thermophilic fungus, Thermomyces lanuginosus.
Biotechnology Letters, 24, 41–45. http://doi.org/10.1023/A:1013805232462
Jeon, B. Y., Kim, D. H., Na, B. K., Ahn, D. H., & Park, D. H. (2008). Production of
ethanol directly from potato starch by mixed culture of Saccharomyces cerevisiae
and Aspergillus niger using electrochemical bioreactor. Journal of Microbiology and
Biotechnology, 18(3), 545–551. http://doi.org/7178 [pii]
Jeon, B. Y., Kim, S. J., Kim, D. H., Na, B. K., Park, D. H., Tran, H. T., … Ahn, D. H.
(2007). Development of a serial bioreactor system for direct ethanol production
fromk starch using Aspergillus niger and Saccharomyces cerevisiae. Biotechnology
and Bioprocess Engineering, 12, 566–573.
Jin, B., Van Leeuwen, H. J., Patel, B., Doelle, H. W., & Yu, Q. (1999). Production of
fungal protein and glucoamylase by Rhizopus oligosporus from starch processing
wastewater. Process Biochemistry, 34, 59–65. http://doi.org/10.1016/S0032-
9592(98)00069-7
John, R. P., Anisha, G. S., Nampoothiri, K. M., & Pandey, A. (2011). Micro and
macroalgal biomass : A renewable source for bioethanol. Bioresource Technology,
102(1), 186–193. http://doi.org/10.1016/j.biortech.2010.06.139

61
Kammoun, R., Naili, B., & Bejar, S. (2008). Application of a statistical design to the
optimization of parameters and culture medium for alpha-amylase production by
Aspergillus oryzae CBS 819.72 grown on gruel (wheat grinding by-product).
Bioresource Technology, 99, 5602–5609.
http://doi.org/10.1016/j.biortech.2007.10.045
Kargi, F., & Ozmıhcı, S. (2006). Utilization of cheese whey powder ( CWP ) for ethanol
fermentations : Effects of operating parameters. Enzyme and Microbial Technology,
38, 711–718. http://doi.org/10.1016/j.enzmictec.2005.11.006
Kim, J. K., Oh, B. R., Shin, H.-J., Eom, C.-Y., & Kim, S. W. (2008). Statistical
optimization of enzymatic saccharification and ethanol fermentation using food
waste. Process Biochemistry, 43, 1308–1312.
http://doi.org/10.1016/j.procbio.2008.07.007
Klinke, H. B., Olsson, L., Thomsen, a B., & Ahring, B. K. (2003). Potential inhibitors
from wet oxidation of wheat straw and their effect on ethanol production of
Saccharomyces cerevisiae: wet oxidation and fermentation by yeast. Biotechnology
and Bioengineering, 81(6), 738–747. http://doi.org/10.1002/bit.10523
Kobayashi, F., & Nakamura, Y. (2004). Mathematical model of direct ethanol production
from starch in immobilized recombinant yeast culture. Biochemical Engineering
Journal, 21, 93–101. http://doi.org/10.1016/j.bej.2004.03.004
Kourkoutas, Y., Bekatorou, a, Banat, I. ., Marchant, R., & Koutinas, a. . (2004).
Immobilization technologies and support materials suitable in alcohol beverages
production: a review. Food Microbiology, 21(4), 377–397.
http://doi.org/10.1016/j.fm.2003.10.005
Kumar, P., & Satyanarayana, T. (2007). Optimization of culture variables for improving
glucoamylase production by alginate-entrapped Thermomucor indicae-seudaticae
using statistical methods. Bioresource Technology, 98, 1252–1259.
http://doi.org/10.1016/j.biortech.2006.05.019
Kumar, P., & Satyanarayana, T. (2009). Microbial glucoamylases: characteristics and
applications. Critical Reviews in Biotechnology, 29(June), 225–255.
http://doi.org/10.1080/07388550903136076
Kumar, S., & Satyanarayana, T. (2001). Medium optimization for glucoamylase
production by a yeast, Pichia subpelliculosa ABWF-64, in submerged cultivation.
World Journal of Microbiology and Biotechnology, 17, 83–87.
http://doi.org/10.1023/A:1016699314244
Kunamneni, A., Permaul, K., & Singh, S. (2005). Amylase production in solid state
fermentation by the thermophilic fungus Thermomyces lanuginosus. Journal of
Bioscience and Bioengineering, 100(2), 168–171. http://doi.org/10.1263/jbb.100.168
Kunamneni, A., & Singh, S. (2005). Response surface optimization of enzymatic
hydrolysis of maize starch for higher glucose production. Biochemical Engineering
Journal, 27, 179–190. http://doi.org/10.1016/j.bej.2005.08.027
Kunduru, M. R., & Pometto, A. L. (1996a). Continuous ethanol production by
Zymomonas mobilis and Saccharomyces cerevisiae in biofilm reactors. Journal of
Industrial Microbiology, 16(January), 249–256.
Kunduru, M. R., & Pometto, A. L. (1996b). Evaluation of plastic composite-supports for
enhanced ethanol production in biofilm reactors. Journal of Industrial Microbiology,

62
16, 241–248.
Kunz, M. (2008). Bioethanol : Experiences from running plants , optimization and
prospects. Bocatalysis and Biotransformation, 26(February), 128–133.
http://doi.org/10.1080/10242420701806561
Lampitt, L. H. (1919). Nitrogen metabolism in Saccharomyces cerevisiae. In The
Biochemical journal (Vol. 13, pp. 459–486).
http://doi.org/10.1101/087969180.11B.39
Lane, M. M., & Morrissey, J. P. (2010). Kluyveromyces marxianus : A yeast emerging
from its sister ’ s shadow. Fungal Biology Reviews, 24(1-2), 17–26.
http://doi.org/10.1016/j.fbr.2010.01.001
Laopaiboon, L., Nuanpeng, S., Srinophakun, P., Klanrit, P., & Laopaiboon, P. (2009).
Ethanol production from sweet sorghum juice using very high gravity technology:
Effects of carbon and nitrogen supplementations. Bioresource Technology, 100(18),
4176–4182. http://doi.org/10.1016/j.biortech.2009.03.046
Laplace, J. M., Delgenes, J. P., Moletta, R., & Navarro, J. M. (1991). Alcoholic
fermentation of glucose and xylose by Pichia stipitis, Candida shehatae,
Saccharomyces cerevisiae and Zymomonas mobilis: oxygen requirement as a key
factor. Applied Microbiology and Biotechnology, 36(2), 158–162.
http://doi.org/10.1007/BF00164412
Le Tourneau, D. (1956). Potato composition: Carbohydrate components of the potato
tuber. Journal of Agricultural and Food Chemistry, 4(6), 543–545.
Lee, B., Pometto, A. L., Demirci, A., & Hinz, P. N. (1998). Media evaluation for the
production of microbial enzymes †. Journal of Agricultural and Food Chemistry,
4775–4778.
Lee, W. S., Chen, I. C., Chang, C. H., & Yang, S. S. (2012). Bioethanol production from
sweet potato by co-immobilization of saccharolytic molds and Saccharomyces
cerevisiae. Renewable Energy, 39(1), 216–222.
http://doi.org/10.1016/j.renene.2011.08.024
Leite, G. B., Abdelaziz, A. E. M., & Hallenbeck, P. C. (2013). Algal biofuels: Challenges
and opportunities. Bioresource Technology, 145, 134–141.
http://doi.org/10.1016/j.biortech.2013.02.007
Lemmel, S. A., Heimsch, R. C., & Korus, R. A. (1980). Kinetics of growth and amylase
production of Saccharomycopsis fibuligera on potato processing wastewater.
Applied and Environmental Microbiology, 39(2), 387–393.
Liang, X. H., Zhao, G. L., Guo, Z. F., & Tang, Y. (2011). Effect of plant starch on the
production of glucoamylase from Aspergillus niger. Advanced Materials Research,
396-398, 1502–1505. http://doi.org/10.4028/www.scientific.net/AMR.396-398.1502
Licht, F. O. (2013). World fuel ethanol production by country or region. Retrieved from
http://www.afdc.energy.gov/
Liimatainen, H., Toiva, K., & Kaariainen, J. (2004). Bio-ethanol production from waste
potatoes. Energy Research, 21–24.
Lim, Y., Jang, Y., & Kim, K. (2013). Production of a high concentration of ethanol from
potato tuber by high gravity fermentation. Food Science and Biotechnology, 22(2),
441–448. http://doi.org/10.1007/s10068-013-0099-4
Lin, Y., & Tanaka, S. (2006). Ethanol fermentation from biomass resources: Current state

63
and prospects. Applied Microbiology and Biotechnology, 69(6), 627–642.
http://doi.org/10.1007/s00253-005-0229-x
Liu, R., & Shen, F. (2008). Impacts of main factors on bioethanol fermentation from stalk
juice of sweet sorghum by immobilized Saccharomyces cerevisiae (CICC 1308).
Bioresource Technology, 99(4), 847–854.
http://doi.org/10.1016/j.biortech.2007.01.009
Ma, H., Wang, Q., Zhang, W., Xu, W., & Zou, D. (2008). Optimization of the medium
and process parameters for ethanol production from kitchen garbage by Zymomonas
mobilis. International Journal of Green Energy, 5(February 2015), 480–490.
http://doi.org/10.1080/15435070802498176
Madson, P. W., & Monceaux, D. A. (1995). Fuel ethanol production. In J. E. Murtagh
(Ed.), The alcohol textbook (pp. 257–268). Nottingham University Press.
Mah, T. C., & O’Toole, G. A. (2001). Mechanisms of biofilm resistance to antimicrobial
agents. Trends in Microbiology, 9(1), 34–39.
Maksimova, Y. G. (2014). Microbial Biofilms in Biotechnological Processes. Applied
Biochemistry and Microbiology, 50(8), 750–760.
http://doi.org/10.1134/S0003683814080043
Mamma, D., Koullas, D., Fountoukidis, G., Kekos, D., Macris, B. J., & Koukios, E.
(1996). Bioethanol from sweet sorghum : Simultaneous saccharification and
fermentation of carbohydrates by a mixed microbial culture. Process Biochemistry,
31(4), 377–381.
Manikandan, K., & Viruthagiri, T. (2009). Simultaneous saccharification and
fermentation of wheat bran flour into ethanol using co-culture of amylotic
Aspergillus niger and thermotolerant Kluyveromyces marxianus. Frontiers of
Chemical Engineering in China, 3(3), 240–249. http://doi.org/10.1007/s11705-009-
0205-6
Mbaneme-Smith, V., & Chinn, M. S. (2015). Consolidated bioprocessing for biofuel
production : recent advances. Energy and Emission Control Technologies, 3, 23–44.
Mojović, L., Pejin, D., Grujić, O., Markov, S., Pejin, J., Rakin, M., … Savić, D. (2009).
Progress in the production of bioethanol on starch-based feedstocks. Chemical
Industry and Chemical Engineering Quarterly, 15(4), 211–226.
http://doi.org/10.2298/CICEQ0904211M
Montesinos, T., & Navarro, J. M. (2000). Production of alcohol from raw wheat flour by
amyloglucosidase and Saccharomyces cerevisiae. Enzyme and Microbial
Technology, 27, 362–370. http://doi.org/10.1016/S0141-0229(00)00211-8
Mouillé, B., & U. Ruth Charrondière, Barbara Burlingame, N. L. (2008). Nutrient
composition of the potato.Interesting varieties from human nutrition perspective.
Retrieved January 14, 2016, from
http://www.fao.org/fileadmin/templates/food_composition/documents/upload/Poster
_potato_nutrient_comp.pdf
Nalley, L., & Hudson, D. (2003). The Potential Viability of Biomass Ethanol as a
Renewable Fuel Source : A Discussion.
Norouzian, D., Akbarzadeh, A., Scharer, J. M., & Moo Young, M. (2006). Fungal
glucoamylases. Biotechnology Advances, 24, 80–85.
http://doi.org/10.1016/j.biotechadv.2005.06.003
64
NPC. (2015). Potato Statistical Yearbook 2015. Retrieved from
http://yearbook2015.cloud-pages.com/#page/66
O’Rourke, T. (2002). Malt specifications & brewing performance. The Brewer
International, 2(10), 27–30.
Oberoi, H. S., Vadlani, P. V., Saida, L., Bansal, S., & Hughes, J. D. (2011). Ethanol
production from banana peels using statistically optimized simultaneous
saccharification and fermentation process. Waste Management, 31(7), 1576–1584.
http://doi.org/10.1016/j.wasman.2011.02.007
Oda, Y., Saito, K., Yamauchi, H., & Mori, M. (2002). Lactic acid fermentation of potato
pulp by the fungus Rhizopus oryzae. Current Microbiology, 45, 1–4.
http://doi.org/10.1007/s00284-001-0048-y
Ogbonna, J. C., Mashima, H., & Tanaka, H. (2001). Scale up of fuel ethanol production
from sugar beet juice using loofa sponge immobilized bioreactor. Bioresource
Technology, 76, 1–8. http://doi.org/10.1016/S0960-8524(00)00084-5
Pandey, A. (1990). Improvements in solid-state fermentation for glucoamylase
production. Biological Wastes, 34, 11–19. http://doi.org/10.1016/0269-
7483(90)90140-N
Pandey, A. (1995). Glucoamylase Research: An Overview. Starch - Stärke, 47(1), 439–
445. http://doi.org/10.1002/star.19950471108
Pandey, A., Nigam, P., Soccol, C. R., Soccol, V. T., Singh, D., & Mohan, R. (2000).
Advances in microbial amylases. Biotechnology and Applied Biochemistry, 31 ( Pt
2), 135–152.
Pandey, A., Selvakumar, P., & Ashakumary, L. (1994). Glucoamylase production by
Aspergillus niger on rice bran is improved by adding nitrogen sources. World
Journal of Microbiology & Biotechnology, 10, 348–349.
Pedersen, H., Beyer, M., & Nielsen, J. (2000). Glucoamylase production in batch,
chemostat and fed-batch cultivations by an industrial strain of Aspergillus niger.
Applied Microbiology and Biotechnology, 53, 272–277.
http://doi.org/10.1007/s002530050020
Pereira, F. B., Guimarães, P. M. R., Teixeira, J. a., & Domingues, L. (2010). Optimization
of low-cost medium for very high gravity ethanol fermentations by Saccharomyces
cerevisiae using statistical experimental designs. Bioresource Technology, 101(20),
7856–7863. http://doi.org/10.1016/j.biortech.2010.04.082
Pietrzak, W., & Kawa-Rygielska, J. (2015). Simultaneous saccharification and ethanol
fermentation of waste wheat–rye bread at very high solids loading: Effect of
enzymatic liquefaction conditions. Fuel, 147, 236–242.
http://doi.org/10.1016/j.fuel.2015.01.057
Plackett, R. L., & Burman, J. P. (1946). Design of optimum multifactorial experiments.
Biometrika, 33(4), 305–325.
Polakovič, M., & Bryjak, J. (2004). Modelling of potato starch saccharification by an
Aspergillus niger glucoamylase. Biochemical Engineering Journal, 18, 57–63.
http://doi.org/10.1016/S1369-703X(03)00164-5
Pometto, A. L. I., A.Demirci, & Johnson, K. E. (1997). Immobilization of
microorganisms on a support made of synthetic polymer and plant material. US.
Pongtharangkul, T., & Demirci, A. (2006). Evaluation of culture medium for nisin

65
production in a repeated-batch biofilm reactor. Biotechnology Progress, 22, 217–
224. http://doi.org/10.1021/bp050295q
Rajoka, M. I., & Yasmeen, A. (2005). Induction, and production studies of a novel
glucoamylase of Aspergillus niger. World Journal of Microbiology and
Biotechnology, 21, 179–187. http://doi.org/10.1007/s11274-004-1766-7
Rani, P., Sharma, S., Garg, F. C., Raj, K., & Wati, L. (2010). Ethanol production from
potato flour by Saccharomyces cerevisiae. Indian Journal of Science and
Technology, 3(7), 733–736. Retrieved from
http://www.indjst.org/index.php/indjst/article/view/29804
Reddy, L. V., Wee, Y. J., Yun, J. S., & Ryu, H. W. (2008). Optimization of alkaline
protease production by batch culture of Bacillus sp. RKY3 through Plackett-Burman
and response surface methodological approaches. Bioresource Technology, 99,
2242–2249. http://doi.org/10.1016/j.biortech.2007.05.006
RFA. (2015). Going Global 2015 Ethanol Industry Outlook. Retrieved January 1, 2016,
from http://www.ethanolrfa.org/wp-
content/uploads/2015/09/c5088b8e8e6b427bb3_cwm626ws2.pdf
Sadhukhan, R. K., Manna, S., Roy, S. K., & Chakrabarty, S. L. (1990). Thermostable
amylolytic enzymes from a cellulolytic fungus Myceliophthora thermophila D14.
Applied Microbiology and Biotechnology, 33, 692–696.
Sanchez, O. J., & Cardona, C. A. (2008). Trends in biotechnological production of fuel
ethanol from different feedstocks. Bioresource Technology, 99(13), 5270–5295.
http://doi.org/10.1016/j.biortech.2007.11.013
Sarkar, N., Ghosh, S. K., Bannerjee, S., & Aikat, K. (2012). Bioethanol production from
agricultural wastes: An overview. Renewable Energy, 37(1), 19–27.
http://doi.org/10.1016/j.renene.2011.06.045
Shukla, J., & Kar, R. (2006). Potato peel as a solid state substrate for thermostable α-
amylase production by thermophilic Bacillus isolates. World Journal of
Microbiology and Biotechnology, 22, 417–422. http://doi.org/10.1007/s11274-005-
9049-5
Shuler, M., & Kargi, F. (2008). Biopress Engineering. Prentice Hall PTR.
Silveira, S. T., Oliveira, M. S., Costa, J. a V, & Kalil, S. J. (2006). Optimization of
glucoamylase production by Aspergillus niger in solid-state fermentation. Applied
Biochemistry and Biotechnology, 128(1), 131–140.
http://doi.org/10.1385/ABAB:128:2:131
Soni, S. K., Kaur, A., & Gupta, J. K. (2003). A solid state fermentation based
bacterial alpha-amylase and fungal glucoamylase system and its suitability for the
hydrolysis of wheat starch. Process Biochemistry, 39, 185–192.
http://doi.org/10.1016/S0032-9592(03)00058-X
South, C. R., Hogsett, D. A., & Lynd, L. R. (1993). Continuous fermentation of cellulosic
biomass to ethanol. Applied Biochemistry and Biotechnology, 39, 587–600.
Spohr, A., Carlsen, M., Nielsen, J., & Villadsen, J. (1997). Morphological
characterization of recombinant strains of Aspergillus oryzae producing alpha-
amylase during batch cultivations. Biotechnol Lett, 19(3), 257–262.
Srichuwong, S., Fujiwara, M., Wang, X., Seyama, T., Shiroma, R., Arakane, M., …
Tokuyasu, K. (2009). Simultaneous saccharification and fermentation (SSF) of very

66
high gravity (VHG) potato mash for the production of ethanol. Biomass and
Bioenergy, 33(5), 890–898. http://doi.org/10.1016/j.biombioe.2009.01.012
Suresh, K., Kiran sree, N., & Venkateswer Rao, L. (1999). Utilization of damaged
sorghum and rice grains for ethanol production by simultaneous saccharification and
fermentation. Bioresource Technology, 68, 301–304. http://doi.org/10.1016/S0960-
8524(98)00135-7
Swift, R. J., Karandikar, A., Griffen, A. M., Punt, P. J., van den Hondel, C. a. M. J. J.,
Robson, G. D., … Wiebe, M. G. (2000). The effect of organic nitrogen sources on
recombinant glucoamylase production by Aspergillus niger in chemostat culture.
Fungal Genetics and Biology, 31(2), 125–133. http://doi.org/10.1006/fgbi.2000.1241
Tanaka, K., Hilary, Z. D., & Ishizaki, A. (1999). Investigation of the utility of pineapple
juice and pineapple waste material as low-cost substrate for ethanol fermentation by
Zymomonas mobilis. Journal of Bioscience and Bioengineering, 87(5), 642–646.
http://doi.org/10.1016/S1389-1723(99)80128-5
Tasic, M. ., Konstantinovic, B. V, Lazic, M. L., & Veljkovic, V. B. (2009). The acid
hydrolysis of potato tuber mash in bioethanol production. Biochemical Engineering
Journal, 43, 208–211. http://doi.org/10.1016/j.bej.2008.09.019
Thomas, K. C., & Ingeldew, W. M. (1992). Production of 21% (v/v) ethanol by
fermentation of very high gravity (VHG) wheat mashes. Journal of Industrial
Microbiology, 10(1), 61–68. http://doi.org/10.1007/BF01583635
Todhanakasem, T., Sangsutthiseree, A., Areerat, K., Young, G. M., & Thanonkeo, P.
(2014). Biofilm production by Zymomonas mobilis enhances ethanol production and
tolerance to toxic inhibitors from rice bran hydrolysate. New BIOTECHNOLOGY,
31(5), 451–459. http://doi.org/10.1016/j.nbt.2014.06.002
Turhan, I., Bialka, K. L., Demirci, A., & Karhan, M. (2010). Ethanol production from
carob extract by using Saccharomyces cerevisiae. Bioresource Technology, 101(14),
5290–5296. http://doi.org/10.1016/j.biortech.2010.01.146
Ueda, R., Hirayama, S., Sugata, K., & Et.al. (1996). Process for the production of ethanol
from microalgae. USA: Official Gazette of the United States Patent and Trademark
Office Patents.
Ueda, S. (1981). Fungal glucoamylases and raw starch digestion. Trends in Biochemical
Sciences, 6(1980), 89–90. http://doi.org/10.1016/0968-0004(81)90032-3
Uncu, O. N., & Cekmecelioglu, D. (2011). Cost-effective approach to ethanol production
and optimization by response surface methodology. Waste Management, 31(4), 636–
643. http://doi.org/10.1016/j.wasman.2010.12.007
USDE. (2016). Global ethanol production. Retrieved March 29, 2016, from
www.afdc.energy.gov/data/
van der Maarel, M. J. E. C., van der Veen, B., Uitdehaag, J. C. M., Leemhuis, H., &
Dijkhuizen, L. (2002). Properties and applications of starch-converting enzymes of
the a -amylase family. Journal of Biotechnology, 94, 137–155.
Velázquez, a. C., Pometto, a. L., Ho, K. L. G., & Demirci, a. (2001). Evaluation of
plastic-composite supports in repeated fed-batch biofilm lactic acid fermentation by
Lactobacillus casei. Applied Microbiology and Biotechnology, 55, 434–441.
http://doi.org/10.1007/s002530000530
Vihinen, M., & Mantsiila, P. (1989). I . Introduction 11 . the Substrate and the Enzymes,
67
24(4).
Vilanova, M., Ugliano, M., Varela, C., Siebert, T., Pretorius, I. S., & Henschke, P. a.
(2007). Assimilable nitrogen utilisation and production of volatile and non-volatile
compounds in chemically defined medium by Saccharomyces cerevisiae wine
yeasts. Applied Microbiology and Biotechnology, 77(1), 145–157.
http://doi.org/10.1007/s00253-007-1145-z
Wang, Q., Wang, X., Wang, X., & Ma, H. (2008). Glucoamylase production from food
waste by Aspergillus niger under submerged fermentation. Process Biochemistry,
43, 280–286. http://doi.org/10.1016/j.procbio.2007.12.010
Wang, S., Ingledew, W. M., Thomas, K. C., Sosulski, K., & Sosulski, F. W. (1999).
Optimization of fermentation temperature and mash specific gravity for fuel alcohol
production. Cereal Chemistry, 79(1), 82–86.
Wang, Z., & Chen, S. (2009). Potential of biofilm-based biofuel production. Applied
Microbiology and Biotechnology, 83, 1–18. http://doi.org/10.1007/s00253-009-
1940-9
Watanabe, T., Srichuwong, S., Arakane, M., Tamiya, S., Yoshinaga, M., Watanabe, I., …
Nakamura, T. (2010). Selection of stress-tolerant yeasts for simultaneous
saccharification and fermentation (SSF) of very high gravity (VHG) potato mash to
ethanol. Bioresource Technology, 101(24), 9710–9714.
http://doi.org/10.1016/j.biortech.2010.07.079
Wilkie, A. C., Riedesel, K. J., & Owens, J. M. (2000). Stillage characterization and
anaerobic treatment of ethanol stillage from conventional and cellulosic feedstocks
p. Biomass and Bioenergy, 19, 63–102.
Yan, S., Li, J., Chen, X., Wu, J., Wang, P., Ye, J., & Yao, J. (2011). Enzymatical
hydrolysis of food waste and ethanol production from the hydrolysate. Renewable
Energy, 36(4), 1259–1265. http://doi.org/10.1016/j.renene.2010.08.020
Ylitervo, P., Franzén, C. J., & Taherzadeh, M. J. (2011). Ethanol production at elevated
temperatures using encapsulation of yeast. Journal of Biotechnology, 156, 22–29.
http://doi.org/10.1016/j.jbiotec.2011.07.018
Zangirolami, T. C., Carlsen, M., Nielsen, J., & Jørgensen, S. B. (2000). Selection and
characterization of a high α-amylase-producing variant in glucose-limited continuous
cultures of Aspergillus oryzae. Mycological Research, 104(October), 1241–1249.
http://doi.org/10.1017/S0953756200002665
Zhan, X., Wang, D., Tuinstra, M. R., Bean, S., Seib, P. A., & Sun, X. S. (2003). Ethanol
and lactic acid production as affected by sorghum genotype and location, 18, 245–
255. http://doi.org/10.1016/S0926-6690(03)00075-X
Zhang, L., Zhao, H., Gan, M., Jin, Y., Gao, X., Chen, Q., … Wang, Z. (2011).
Application of simultaneous saccharification and fermentation (SSF) from viscosity
reducing of raw sweet potato for bioethanol production at laboratory, pilot and
industrial scales. Bioresource Technology, 102(6), 4573–4579.
http://doi.org/10.1016/j.biortech.2010.12.115
Zhang, Y., Ma, Y., Yang, F., & Zhang, C. (2009). Continuous acetone – butanol – ethanol
production by corn stalk immobilized cells. J Ind Microbiol Biotechnology, 36,
1117–1121. http://doi.org/10.1007/s10295-009-0582-3

68
CHAPTER 3
STRAIN SELECTION AND MEDIUM OPTIMIZATION FOR
GLUCOAMYLASE PRODUCTION FROM INDUSTRIAL POTATO WASTE BY
ASPERGILLUS NIGER1
3.1 Abstract
Glucoamylase is one of the most common enzymes used in food industry to break down
the starch into its monomers. Glucoamylase production and its activity are highly
dependent on medium composition. Starch is well known as glucoamylase inducer, and
utilization of industrial starchy potato waste is an inexpensive way of improving the
glucoamylase production. Since glucoamylase production is highly dependent on medium
composition, in this study, medium optimization for glucoamylase production was
considered to enhance the glucoamylase activity. Among the evaluated microbial species,
Aspergillus niger van Tieghem was found to be the best glucoamylase-producing fungus.
The Plackett-Burman design was used to screen various medium ingredients and malt
extract, FeSO4·7H2O, and CaCl22H2O were found to have significant effects on the
glucoamylase production. Finally, malt extract, FeSO4·7H2O, and CaCl22H2O were
optimized by using a central composite design of the response surface methodology. The
results showed that the optimal medium composition for A. niger van Tieghem was 50
g/L of industrial waste potato mash supplemented with 51.82 g/L of malt extract, 9.27
g/L of CaCl22H2O, and 0.50 g/L of FeSO4 7H2O . At the end of the optimization,
glucoamylase activity and glucose production were improved 126 and 98% compared to
only industrial waste potato mash basal medium and 274.4 U/ml glucoamylase activity
and 41.7 g/L glucose levels were achieved, respectively.
1A version of this chapter was published as: Izmirlioglu, G. and Demirci, A. (2015), Strain selection and
medium optimization for glucoamylase production from industrial potato waste by Aspergillus niger. J. Sci.
Food Agric.. In-print. DOI: 10.1002/jsfa.7445.

69
3.2 Introduction
Industrial waste represents one of the most abundant carbon sources in existence today.
The utilization of such waste in the fermentation industry may help reduce the production
costs of value-added products created via fermentation. Industrial waste potato mash is
waste produced in potato processing plants that can be utilized by the fermentation
industry. According to Oda et al. (2002), potato processing creates 10% waste potato
pulp. Another study suggests that 5-20% of potato crops that could be used for value-
added product fermentation are wasted during processing (Liimatainen et al., 2004). In
the potato chips industry, for example, 18% of the production is starchy waste that could
be used as raw material for fermentation (Fadel, 2000). There have been several studies
published demonstrating the potential of potato industry waste (including potato mash,
potato peels, potato pulp, and potato starch wastewater) for the production of bioethanol,
α-amylase, lactic acid, and pullulan (Barnett et al., 1999; Fadel, 2000; Huang et al., 2005;
Izmirlioglu & Demirci, 2012; Oda et al., 2002; Shukla & Kar, 2006). However, there is
no study specifically for glucoamylase production by using potato wastes.
Glucoamylase, also known as amyloglucosidase or γ-amylase, is a member of the
amylase family that works to degrade starch into its monomers. During starch hydrolysis,
glucoamylase releases single glucose units from the non-reducing ends of amylose and
amylopectin until complete glucose conversion is achieved. Glucoamylase cleaves α-1, 4-
and α-1, 6-glucosidic linkages in raw and soluble starch (Pandey et al., 2000). Even
though glucoamylase is capable of hydrolyzing α-1, 4- and α-1, 6-glucosidic linkages, its
activity on α-1, 6-glucosidic linkages is much less than its activity on α-1, 4-glucosidic
linkages (about 0.2% of the α-1, 6-glucosidic linkage is cleaved) (Norouzian et al., 2006).
Therefore, a cocktail of amylolytic enzymes, including glucoamylase, α-amylase, and
pullulanase, is used for ensuring complete hydrolysis (Rajoka & Yasmeen, 2005).
Glucoamylase can be produced by prokaryotes and eukaryotes. Although there are many
microbial sources for glucoamylase production ( Kumar & Satyanarayana, 2009),
Aspergillus niger and Rhizopus oryzae are those most commonly used for its commercial

70
production (Norouzian et al., 2006). The industry’s preference for glucoamylases from
these fungi stems from the high enzyme activity at neutral pH values, as well as the
thermal stability (Norouzian et al., 2006). Glucoamylase is used in the production of corn
syrups such as high glucose and fructose; it is also used in alcohol fermentation (beer and
wine). Because the most efficient and traditionally-used method of fermentation, that of
yeast (Saccharomyces cerevisiae), cannot ferment starch, glucoamylase is used for the
hydrolysis of starch in alcohol production. Other applications of glucoamylase can be
found in the baking, textile, and pharmaceutical industries. In the baking industry, for
instance, glucoamylase improves bread crust color (Kumar & Satyanarayana, 2009). In
the pharmaceutical industry, it is used as a digestive aid ( Kumar & Satyanarayana,
2009).
The production of glucoamylase by fermentation has been studied for various substrates
including wheat bran, green gram bran, black gram bran, corn flour, barley flour, jowar
flour, maize bran, rice bran, and wheat rawa (Ellaiah et al., 2002),rice flakes (Anto et al.,
2006), and food wastes (Q. Wang et al., 2008). Wang et al. (2008) have reported that 126
U/ml of glucoamylase is produced from food waste (collected from cafeterias) after 96 h
of submerged fermentation. Ellaiah et al. ( 2002) have reported that wheat bran shows the
highest enzyme activity among the tested substrates, 247 U/g under optimal conditions.
Many studies have indicated that glucoamylase production is influenced by media
composition and growth conditions. Maltose and cassava flour have been reported to be
glucoamylase inducers, while fructose has been suggested to slow the production of
glucoamylase (Chiquetto et al., 1992). Even at low concentrations, glucose has also been
reported to be an inhibitor for glucoamylase (Rajoka & Yasmeen, 2005). The source of
the nitrogen used for glucoamylase production varies. Some of the nitrogen sources that
have found application in glucoamylase production are yeast extract, ammonium nitrate,
ammonium sulphate, corn steep liquor, urea, meat extract, and peptone ( Kumar &
Satyanarayana, 2007; A. Pandey et al., 1994; Rajoka & Yasmeen, 2005). Optimal
production conditions, such as inoculum size, temperature, pH, aeration, agitation, and
type of fermentor, can improve enzyme production but vary depending on the
71
microorganism (Ellaiah et al., 2002; P. Kumar & Satyanarayana, 2007; Pandey, 1990;
Silveira et al., 2006). Different fermentation procedures have also been studied for
glucoamylase production. Pedersen et al. ( 2000) have studied batch, chemostat, and fed-
batch procedures for glucoamylase production by Aspergillus niger.
Fermentation optimization involves many biochemical and physical parameters,
including those of medium and growth. The classical method of studying one variable at
a time is time-consuming, laborious, and impractical. Statistical designs have already
been applied to fermentation studies and provide an efficient way of obtaining
meaningful results with a reduced number of experiments. Statistical designs can also be
adopted at various stages of the fermentation optimization process, such as during the
screening of a large number of factors or during the optimization of the process. The
Plackett-Burman statistical design (Plackett & Burman, 1946) is a particularly effective
method for screening a large number of factors. The Plackett-Burman design provides
sufficient information for investigating the significant factors in a given response. The
central composite design of surface response methodology, on the other hand, is best
suited for optimizing with a smaller set of factors.
Although industrial potato waste and glucoamylase production have been studied
separately in terms of fermentation technology, to the best of authors’ knowledge, there is
no single study on glucoamylase production from industrial potato waste by Aspergillus
niger. Jin et al. (1999) have evaluated starch processing water for glucoamylase using
Rhizopus oligosporus, while Liang et al.(2011) have studied the effects of plant starch on
the production of glucoamylase from Aspergillus niger. Relatedly, Polakovic & Bryjak
( 2004) have studied the modelling of potato starch saccharification using Aspergillus
niger on glucoamylase. Because it has been well-documented that glucoamylase
production and the characteristics of the enzyme depend on the medium and microbial
strain employed, there is a need for studying industrial potato waste as an inexpensive
substrate for glucoamylase production. This study, therefore, investigates waste potato
mash as a medium for glucoamylase production. To do so, eight Aspergillus strains were

72
screened for their glucoamylase production capabilities in the potato mash waste
medium. The Plackett-Burman statistical design was subsequently used to screen for the
effects of various medium ingredients on enzyme and glucose production. Finally, the
central composite design was employed in order to optimize the composition of the
medium.
3.3 Materials and Methods
3.3.1 Microorganisms and inoculum preparation
In this study, eight different strains of Aspergillus were evaluated. The Aspergillus strains
Aspergillus foetidus (NRRL 337), Aspergillus niger van Tieghem (NRRL 330),
Aspergillus niger van Tieghem (NRRL 1956), Aspergillus oryzae var. oryzae (NRRL
6270), Aspergillus niger van Tieghem (NRRL 326), and Aspergillus flavus var. oryzae
(NRRL449) were obtained from the United States Department of Agriculture’s (USDA)
Agricultural Research Service (Peoria, IL). Aspergillus brasiliensis (ATCC 16404) and
Aspergillus niger van Tieghem (ATCC 10864) were obtained from the American Type
Culture Collection (Manassas, VA). Cultures were grown on Petri plates containing malt
extract agar (20 g/L of malt extract, 20 g/L of glucose, 1 g/L of peptone, and 20 g/L of
agar) at 30°C for 72 h. In order to maintain viability, the fungus-grown plates were stored
at 4°C and sub-cultured every three weeks. For sub-culturing and inoculum preparation,
10 ml of 0.1% sterile peptone water was used to wash the plate surface. The collected
spore suspension was used as the inoculum. Stock spore cultures were prepared from the
fungus-grown plates, however, 20% glycerol was used to wash off the spores from the
plates, and stock cultures were kept in 20% glycerol at −80°C.
3.3.2 Industrial waste potato mash
Waste potato mash was obtained from a local potato processing plant that manufactures
potato flakes for commercial use. There were a variety of potatoes used throughout the
study, including Frito-Lay FL 1833, Snowden, and Russet Burbank potatoes. The starch

73
content of the waste potato mash ranged from 17–24%. The waste potato mash was not
pretreated and was stored at −20°C until use.
3.3.3 Strain selection
Strain screening was carried out in 100 ml of medium containing 50 g/L (dry basis) of
waste potato mash with no other supplement. The prepared waste potato mash medium
was autoclaved in a 250 mL flask at 121°C for 20 min. After sterilization of the medium,
the flasks were inoculated with the evaluated Aspergillus strains and incubated at 30°C,
150 rpm for 72 h in a shaker incubator (SHKE5000-7, Barnstead International, Dubuque,
Iowa). After 3 days fermentation, fermentation broths were analyzed for glucose and
enzyme activity. The strain with the highest enzyme activity and glucose yield was used
for further medium optimization.
3.3.4 Evaluation of medium ingredients
In order to complete an evaluation of the medium ingredients, the eight variables were
studied using the Plackett-Burman statistical design (Table 3.1).
Table 3.1. Concentrations of variables at high and low levels in Plackett - Burman design.
Variable Lower
level
High
level
Reference
Peptone (g/L) 0.2 2 (Kammoun, Naili, & Bejar, 2008)
Malt Extract (g/L) 2 20 (Abouzied & Reddy, 1986)
Yeast Extract (g/L) 0.5 5 (Abouzied & Reddy, 1986; Amirul et al., 1996;
Djekrif-Dakhmouche et al., 2006)
MgCl26H2O (g/L) 0.1 1 (Djekrif-Dakhmouche et al., 2006)
CaCO3 (g/L) 0.2 2 (Abouzied & Reddy, 1986)
NH4H2PO4 (g/L) 0.2 2 (Arnthong, Wanitchaploy, Sakai, Sanglier, &
Kitpreechavanich, 2010)
FeSO47H2O (g/L) 0.01 0.1 (Abouzied & Reddy, 1986;Djekrif-Dakhmouche et al., 2006;
Pedersen et al., 2000)
CaCl2.2H2O (g/L) 0.3 3 (Djekrif-Dakhmouche et al., 2006; Pedersen et al., 2000)

74
The selected ingredients (peptone, malt extract, yeast extract, MgCl2 6H2O, CaCO3,
NH4H2PO4, FeSO47H2O, and CaCl22H2O) were reported in previous publications as
comprising a medium supplement for amylolytic enzyme fermentation by the Aspergillus
species (Table 3.1). As suggested by the Plackett-Burman design, the fermentation
medium (100 mL) consisted of 50 g/L (d.b.) industrial waste potato mash functioning as a
carbon source and supplemented with nitrogen sources and inorganic salts. Fermentation
was carried out in 250 mL flasks at 30°C, 150 rpm for 72 h in a shaker incubator
(Barnstead International).
The Plackett-Burman design is a fractional factorial that allows N-1 variables with N
experiments. This design utilizes two levels for each factor: the high (+) level and the low
(-) level. The effect of each variable on the response is calculated as shown in Equation
3.1,
𝐸 =∑ 𝑦(+)
𝑁−
∑ 𝑦(−)
𝑁....……………………………………….. Eqn. 3.1
where E is the effect of the factor; y(+) and y(-) are the responses when a given factor is
at its high and low levels, respectively; and N is the total number of experiments. As seen
in Eqn. 3.1, the Plackett-Burman design does not consider the interactions among factors
and is instead used only to screen important factors that influence the response.
Each factor was investigated at two levels. The two levels of each ingredient can be seen
in Table 3.1. Each experiment was replicated as a block in the design. Statistical analysis
was performed using Minitab Statistical Software (Version 16.1; Minitab Inc., State
College, PA). Glucoamylase activity and glucose concentrations were used as responses
for statistical analysis of the design. After ANOVA analysis, statistically-important
effects were identified. To determine the optimum medium composition, comparison of
the three different medium compositions (medium A, medium B, and the control
medium) based on the Plackett-Burman results were performed. Medium A consisted of

75
significantly-positive factors at high levels and significantly-negative ones at low levels
(waste potato mash [50 g/L (d.b.)], malt extract [20 g/L], yeast extract [0.5 g/L], CaCO3
[0.2 g/L], FeSO4 7H2O [0.1 g/L], CaCl2 2H2O [3 g/L]). Medium B comprised only
significantly-positive factors at high levels (waste potato mash [50 g/L (d.b.)], malt
extract [20g/L], FeSO47H2O [0.1 g/L], CaCl22H2O [3 g/L]). Finally, the control
medium was made up of only waste potato mash [50 g/L (d.b.)]. Validation and
comparison of medium composition fermentations were done in triplicate. Glucoamylase
activity and glucose yield were used as responses for analysis of the design. ANOVA
table was generated to find out the statistical significance of medium compositions.
Because ANOVA results suggested that medium composition had a significant effect on
enzyme activity as well as glucose concentrations, Tukey test was conducted to outline
the differences of each medium composition.
3.3.5 Medium optimization
Medium ingredients (malt extract, FeSO47H2O, and CaCl22H2O) affecting
glucoamylase activity, as determined by the Plackett-Burman design, were optimized
using the central composite design of surface response methodology via Minitab (Version
16.1, State College, PA). Each factor was examined at five different levels (Table 3.2).
The ingredients were added to 50 g/L (d.b.) industrial waste potato mash (100 mL) at the
levels suggested by the central composite design and subsequently autoclaved. Then
flask-fermentations were carried out in 250-mL flasks at 30°C, 150 rpm for 72 h in a
shaker incubator.
Table 3.2. The central composite design levels of each factor.
Factors Coded values and corresponding concentrations
-1.68179
(−α)
-1 0 1 1.68179
(α)
Malt Extract 5 25 30 35 55
CaCl22H2O 1 4 5 6 10
FeSO47H2O 0.005 0.01 0.05 0.09 0.5

76
The central composite design is a factorial design with center points, which is improved
by the use of star points (α). If the distance from the center of the design space to a given
factorial point is ±1 unit for each factor, the distance from the center of the design space
to a star point must necessarily be |𝛼| > 1. The value of α depends on the specific
properties of the desired design. Validation of the model used in this study was carried
out. Fermentations with three replications were utilized to validate the determined
optimal medium composition via the central composite design of response surface
methodology. The results of the fermentations were compared with the predicted values
of the model.
3.3.6 Analysis
3.3.6.1 Glucose
Samples were analyzed for glucose using the YSI Biochemistry Analyzer (Model 2700,
Yellow Springs, OH). The procedure for glucose analysis was as follows: one mL of each
sample was diluted twentyfold (when needed) in order to keep the concentration of
glucose in the range provided by manufacturer. The sample was then analyzed using the
YSI Biochemistry Analyzer.
3.3.6.2 Glucoamylase activity
Extracellular glucoamylase activity in the culture broth was determined by measuring the
glucose released from the starch as described by Lemmel et al. (1980) with only one
modification. Samples were collected and centrifuged at 4°C for 20 min at 5,200 x g in
order to remove cells, and the supernatant was used for determining glucoamylase
activity. Culture supernatant (0.5 ml) was added to 0.5 ml of 1.0% potato starch dissolved
in a 0.01 M acetate buffer at pH 4.8. Tubes were incubated in a 30°C water bath for 30
min and then kept in boiling water for 15 min to halt the enzyme activity. After cooling
down, the released glucose was measured using the YSI Glucose Analyzer. One unit of

77
glucoamylase activity is defined as the amount of enzyme that releases 1 µM of glucose
from starch in 30 min at 30°C.
3.3.6.3 Statistical analyses
Statistical analyses were performed using Minitab (Version 16.1, State College, PA).
Plackett-Burman and central composite response surface designs were employed in
conducting medium screening and optimization. ANOVA and the Tukey test were used
to determine statistically-significant differences. A p-value < 0.05 was considered to be
significant.
3.4 Results and Discussion
3.4.1 Strain selection
Eight different Aspergillus strains were screened to determine which strain causes the
highest glucose production and glucoamylase activity in potato mash waste. As seen in
Figure 3.1, among the screened Aspergillus strains, A. niger NRRL 330 produced the
most glucose with 20.45 g/L; this was followed by A. niger ATCC 10864 (15.25 g/L), A.
foetidus NRRL 337 (15.1 g/L) and A. niger NRRL 1956 (15.1 g/L).
Figure 3.1 Comparisons of glucose production and glucoamylase activity of Aspergillus
strains at 72 h.
0
20
40
60
80
100
120
140
0
5
10
15
20
25
NRRL 337 ATCC16404
NRRL 330 ATCC10864
NRRL1956
NRRL6270
NRRL 326 NRRL449 Glu
coam
ylas
e A
ctiv
ity
(U/m
L)
Glu
cose
(g/
L)
Max Glucose (g/L) Max Enzyme Activity(U/ml)

78
The lowest amount of glucose, on the other hand, was obtained from A. brasiliensis
ATCC 16404 with 2.4 g/L; this was followed by A. flavus var. oryzae NRRL449 and A.
oryzae var. oryzae NRRL 6270 (with 3.94 g/L and 4.05 g/L, respectively). Statistical
analysis (Tukey test) showed a significant difference among glucose concentrations. It
was observed that glucose concentrations of A. niger NRRL 330, A. niger ATCC 10864,
A. foetidus NRRL 337, and A. niger NRRL 1956 were statistically different than others,
however, no statistically significant difference observed among glucose concentrations of
A. niger NRRL 330, A. niger ATCC 10864, A. foetidus NRRL 337, and A. niger NRRL
1956.
The highest enzyme activity registered at 121 U/mL with A. niger NRRL 330; this was
followed by A. niger ATCC 10864, A. foetidus NRRL 337, and A. niger NRRL 1956 with
111.72, 108.89 and 89.72 U/mL enzyme activity, respectively (Figure 3.1). The lowest
enzyme activity was observed for A. brasiliensis ATCC 16404 as 16.33 U/mL, followed
by A. flavus var. oryzae NRRL449 and A. oryzae var. oryzae NRRL 6270 (34.44 U/mL
and 34.5 U/mL enzyme activity, respectively (Figure 3.1). Tukey comparison test showed
that enzyme activities of A. niger NRRL 330, A. niger ATCC 10864, A. foetidus NRRL
337, and A. niger NRRL 1956 were statistically different than others, however, no
statistically significant difference observed among enzyme activities of A. niger NRRL
330, A. niger ATCC 10864, A. foetidus NRRL 337, and A. niger NRRL 1956. Because A.
niger NRRL 330 showed a more stable enzyme activity pattern among all screened fungi,
as well as high glucose concentrations and enzyme activity (Figure 3.2), it was selected to
be used for the remainder of the study.
Previously in the literature, it has reported that the Aspergillus species is capable of
producing both α-amylase and different forms of glucoamylase from the same strain. This
production depends on the carbon source and culture conditions, however. Aspergillus
oryzae, A. flavus and A. niger ATCC 16404 have been reported to be α-amylase
producers (Djekrif-Dakhmouche et al., 2006; Francis et al., 2003; Pandey et al., 2000;
Zangirolami, Carlsen, Nielsen, & Jørgensen, 2000) .
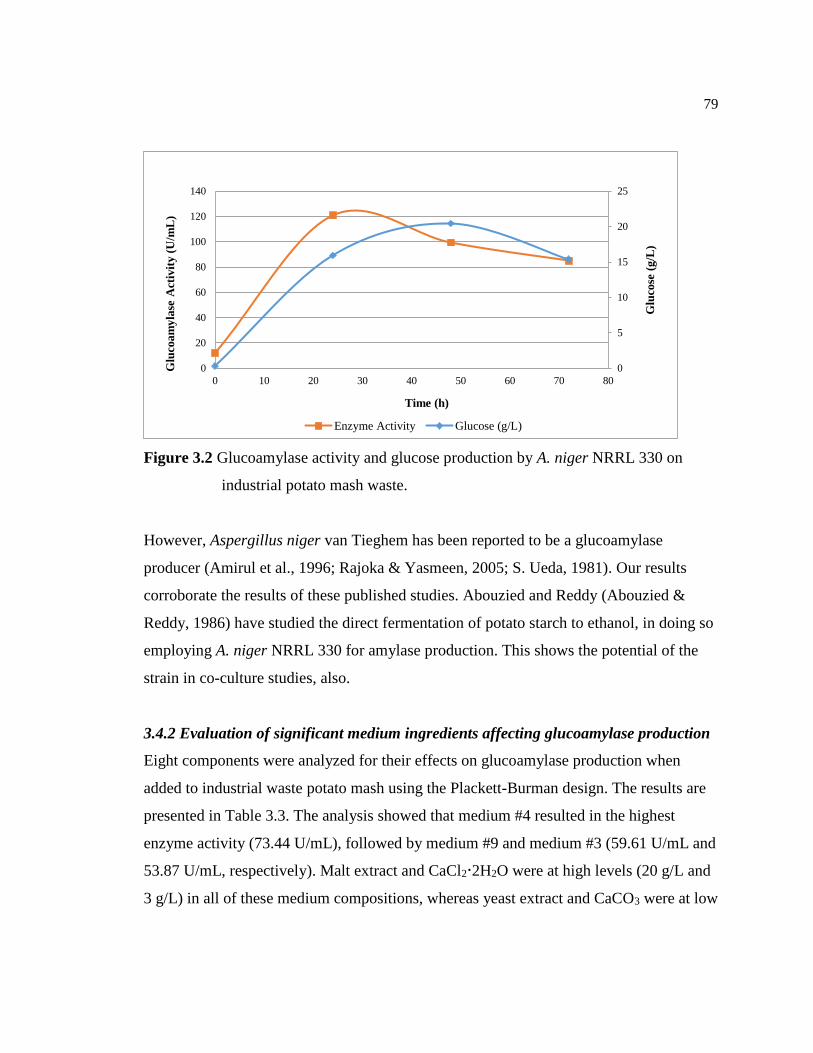
79
Figure 3.2 Glucoamylase activity and glucose production by A. niger NRRL 330 on
industrial potato mash waste.
However, Aspergillus niger van Tieghem has been reported to be a glucoamylase
producer (Amirul et al., 1996; Rajoka & Yasmeen, 2005; S. Ueda, 1981). Our results
corroborate the results of these published studies. Abouzied and Reddy (Abouzied &
Reddy, 1986) have studied the direct fermentation of potato starch to ethanol, in doing so
employing A. niger NRRL 330 for amylase production. This shows the potential of the
strain in co-culture studies, also.
3.4.2 Evaluation of significant medium ingredients affecting glucoamylase production
Eight components were analyzed for their effects on glucoamylase production when
added to industrial waste potato mash using the Plackett-Burman design. The results are
presented in Table 3.3. The analysis showed that medium #4 resulted in the highest
enzyme activity (73.44 U/mL), followed by medium #9 and medium #3 (59.61 U/mL and
53.87 U/mL, respectively). Malt extract and CaCl22H2O were at high levels (20 g/L and
3 g/L) in all of these medium compositions, whereas yeast extract and CaCO3 were at low
0
5
10
15
20
25
0
20
40
60
80
100
120
140
0 10 20 30 40 50 60 70 80
Glu
cose
(g
/L)
Glu
coam
yla
se A
ctiv
ity
(U
/mL
)
Time (h)
Enzyme Activity Glucose (g/L)

80
levels (0.5 g/L and 0.2 g/L). Media #7, # 2 and # 12 demonstrated the lowest enzyme
activity (4.48 U/mL, 4.75 U/mL, and 5.86 U/mL, respectively).
Table 3.3. Plackett-Burman experimental design and results.
Based on the ANOVA results, malt extract, yeast extract, CaCO3, FeSO47H2O, and
CaCl22H2O have statistically-significant effects on glucoamylase production (Table 3.4).
On the other hand, the rest of the ingredients (peptone, MgCl26H2O, and NH4H2PO4)
have no statistically-significant effects on enzyme production (p-value > 0.05). The
analysis of coefficients showed that malt extract, FeSO47H2O, and CaCl22H2O had
Peptone
(g/L)
Malt
Extract
(g/L)
Yeast
Extract
(g/L)
MgCl2.6H2O
(g/L)
CaCO3
(g/L)
NH4H2PO4
(g/L)
FeSO4.7H2O
(g/L)
CaCl2.2H2O
(g/L)
Enzyme
Activity
(U/mL)
1 0.2 20 5 0.1 2 0.2 0.01 0.3 7.15
2 0.2 2 5 1 2 0.2 0.1 3 4.755
3 2 2 5 0.1 0.2 0.2 0.1 3 53.87
4 0.2 20 0.5 0.1 0.2 2 0.1 3 73.44
5 2 2 0.5 0.1 2 2 0.1 0.3 19.285
6 2 20 0.5 1 2 0.2 0.1 0.3 9.15
7 0.2 2 0.5 0.1 0.2 0.2 0.01 0.3 4.485
8 2 2 5 1 0.2 2 0.01 0.3 10.61
9 2 20 0.5 1 0.2 0.2 0.01 3 59.61
10 0.2 2 0.5 1 2 2 0.01 3 23.14
11 0.2 20 5 1 0.2 2 0.1 0.3 37.28
12 2 20 5 0.1 2 2 0.01 3 5.865

81
positive effects on enzyme activity, while yeast extract and CaCO3 exerted negative
effects (p-value < 0.05). The most significant variable was FeSO47H2O, which had the
highest coefficient, followed only by CaCO3, CaCl22H2O, and malt extract.
Table 3.4. Effect of each component on glucoamylase production.
Component Name Effect
Peptone + NS Malt Extract + S Yeast Extract - S MgCl2.6H2O - NS CaCO3 - S Ammonium phosphate + NS FeSO4.7H2O + S CaCl2.2H2O + S
+: Components that showed a positive effect on glucoamlyase production, - ones showed negative
effect.
S: Statistically significant, NS: Not significant
To determine the best and most inexpensive medium, two different medium compostions
(media A and B) were tested and compared to the control medium (waste potato mash
with no supplement). Glucoamylase activity for media A, B, and control was at the levels
of 156.6, 174.43, and 132.9 U/mL, whereas glucose concentrations were observed to be
24.9, 27.3, and 16.9 g/L, respectively. ANOVA results suggested that there were
significant differences among the medium compositions (p-value =0.000) in terms of
glucoamylase activity and glucose concentration. Further comparison was conducted
using the Tukey test. The results clearly indicated that when glucoamylase activity was
chosen as the response, media A, B, and control were significantly different from each
other. In terms of glucose concentration, there was no significant difference between
media A and B. However, these two media were still significantly different than the
control medium. Consequently, the components had no significant effect, and the
ingredients that had significantly-negative effects on enzyme and glucose production
were excluded from the fermentation medium. Therefore, medium B was further
optimized.

82
Our study showed that yeast extract has a negative effect on glucoamylase production.
This aligns with the results of Bhatti et al. (2007), who have shown that enzyme yield
can be increased by nitrogen sources other than yeast extract. In another study, yeast
extract was reported to be a better supplement than malt extract for glucoamylase
production using Pichia subpelliculosa (S. Kumar & Satyanarayana, 2001). The positive
effects of malt extract may be due to its high sugar content that promotes biomass growth
during the lag phase, therefore increasing enzyme production. Arnthong et al. (Arnthong
et al., 2010) studied glucoamylase production using a thermotolerant Rhizopus
microsporus and has suggested that FeSO47H2O and CaCl2 increase glucoamylase
activity, which agrees with our results.
3.4.3 Optimization of medium composition by central composite design
In order to approach the overproduction of glucoamylase and glucose production,
significantly-positive variables (malt extract, FeSO47H2O, and CaCl22H2O) were
further studied, each at five levels according to the study’s central composite design.
Table 3.5 represents the design matrix of the coded variables together with the
experimental results of enzyme activity and glucose yield.
The regression model was determined by Minitab, and the model equations for glucose
and enzyme activity fitted by regression analysis used are as follows,
𝐺𝑙𝑢𝑐𝑜𝑠𝑒 (𝑔
𝐿) = 39.926 + 4.927 ∗ 𝑋 + 0.234 ∗ 𝑌 + 0.005 ∗ 𝑍 − 1.295 ∗ 𝑋2 + 0.331 ∗
𝑌2 − 0.0402 ∗ 𝑍2 + 1.85 ∗ 𝑋𝑌 − 0.125 ∗ 𝑋𝑍 + 0.1 ∗ 𝑌𝑍 ………...................….Eqn. 3.2
𝐸𝑛𝑧𝑦𝑚𝑒 𝐴𝑐𝑡𝑖𝑣𝑖𝑡𝑦 (𝑈
𝑚𝐿) = 149.304 + 10.798 ∗ 𝑋 + 1.644 ∗ 𝑌 + 12.995 ∗ 𝑍 + 3.546 ∗
𝑋2 − 7.492 ∗ 𝑌2 − 1.559 ∗ 𝑍2 − 16.528 ∗ 𝑋𝑌 + 0.695 ∗ 𝑋𝑍 − 0.695 ∗ 𝑌𝑍 .......Eqn. 3.3
where X is malt extract (g/L), Y is CaCl22H2O (g/L), and Z is FeSO47H2O (g/L).

83
Table 3.5. Central composite design and the experimental results.
Variables Experimental Results Predicted Results
Run
Order
Malt
Extract
(g/L)
CaCl22H2O
(g/L)
FeSO47H2O
(g/L)
Enzyme
Activity
(U/mL)
Glucose
(g/L)
Enzyme
Activity
(U/mL)
Glucose
(g/L)
1 0 0 0 131.11 42.7 149.30 39.926
2 0 -1.68179 0 109.11 43.6 125.34 40.4
3 0 0 0 170.00 40.8 149.30 39.9
4 0 0 0 153.33 37 149.30 39.9
5 1 -1 -1 160.00 39.6 155.09 41.9
6 1.68179 0 0 146.67 48.6 177.49 44.5
7 0 0 1.68179 148.89 39.3 166.74 39.8
8 -1 -1 -1 160.00 35.9 101.83 35.5
9 1 -1 1 158.89 37.7 183.86 41.5
10 0 0 0 173.33 40.6 149.30 39.9
11 0 0 0 182.22 39.6 149.30 39.9
12 1 1 -1 193.33 45.5 126.71 45.9
13 -1.68179 0 0 99.44 22.5 141.17 27.9
14 -1 1 1 174.44 36 162.77 32.6
15 0 0 -1.68179 175.56 38.9 123.03 39.8
16 -1 1 -1 211.11 37 139.56 32.1
17 0 0 0 195.56 39.1 149.30 39.9
18 -1 -1 1 201.11 37.1 127.82 35.6
19 0 1.68179 0 202.22 36.7 130.87 41.2
20 1 1 1 236.67 46.6 152.70 45.9
The results of the second-order response surface model were analyzed using ANOVA.
The Fisher F-test [F (5, 5) =7.48] showed the significance of the model (p-value=0.023).
Using the model equation, it was determined that the variables with the largest effects on

84
glucose were malt extract, the interaction of malt extract and CaCl22H2O, and to a lesser
extent to the quadratic term of malt extract. In terms of enzyme activity, the variables
with the largest effects were the interaction of malt extract and CaCl22H2O, the linear
term of FeSO47H2O, and malt extract.
The importance of malt extract on the production of glucoamylase was thus confirmed.
El-Gendy ( 2012) has reported that malt extract is the nitrogen source best able to
significantly increase glucoamylase production in Aspergillus spp. Furthermore,
CaCl22H2O, and FeSO47H2O were shown to have positive effects on glucoamylase and
glucose production. This is in agreement with the results reported by Arnthong et al.
(2010), who have demonstrated an increase in production in the presence of these salts.
3D response surface plots serve as graphical representations of the regression model
equation for glucoamylase and glucose production. They demonstrate the interaction
effects of two parameters when the third one is kept constant at a center point. Figure 3.3
and Figure 3.4 show the interaction effects of parameters on glucoamylase and glucose
production. In Figure 3.3, it can be seen that an increase in malt extract results in an
increased glucoamylase yield. Moreover, improved glucoamylase activity was observed
at higher levels of CaCl22H2O and FeSO47H2O.
The effect of CaCl22H2O is increased at a lower concentration of FeSO47H2O. In Figure
3.4, the effect of the parameters on glucose yield are illustrated. From the figure, it can be
seen that an increase in malt extract results in a higher glucose yield. However, an
increase in FeSO47H2O does not cause a dramatic change in glucose yield. CaCl22H2O,
on the other hand, yields a higher level of glucose when decreased and increased.
Although there is an increase at low concentrations of CaCl22H2O, the highest peak is
observed at high concentrations of this salt.

85
Figure 3.3 Surface plots of model regression equation for glucoamylase (U/mL) in
response to the interactions of malt extract, CaCl22H2O, and FeSO47H2O.

86
Figure 3.4 Surface plots of model regression equation for glucoamylase (U/mL) in
response to the interactions of malt extract, CaCl22H2O, and FeSO47H2O.

87
The optimal medium composition was found to be malt extract 51.82 g/L, CaCl22H2O
9.27 g/L, and FeSO47H2O 0.5 g/L, with waste potato mash at 50 g/L (d.b.) To validate
the proposed medium composition, fermentation experiments were carried out for
glucoamylase and glucose production by employing optimized medium
composition.Table 3.6 summarizes the glucoamylase and glucose productions for
optimized medium under experimental conditions, or conditions in which there is 41.7
g/L glucose and 274.4 U/mL enzyme activity. The results were 126 and 98% increases in
enzyme activity and glucose production, respectively, compared to the initial basal
medium.
Table 3.6. Comparison between the original and optimized media.
3.5 Conclusions
This study demonstrated that there is a substantial increase in glucoamylase and glucose
production via the strain selection of Aspergillus and medium optimization. This study
also demonstrated that industrial waste potato mash can be used as an effective carbon
source for fungus growth, as well as an effective inducer of glucoamylase production.
Among the eight investigated strains, Aspergillus niger van Tieghem NRRL 330 was
selected for glucoamylase production from industrial waste potato mash. Significantly-
positive effects of malt extract, CaCl22H2O, and FeSO47H2O were determined and

88
used for further optimization.. Finally, optimum medium composition was found to be
malt extract 51.82 g/L, CaCl22H2O 9.272 g/L, and FeSO47H2O 0.5 g/L, with industrial
waste potato mash of 50 g/L. In conclusion, this study suggests an inexpensive medium
composition for glucoamylase production by A. niger.
3.6 References
Abouzied, M. M., & Reddy, C.A. (1986). Direct fermentation of potato starch to ethanol
by co-cultures of Aspergillus niger and Saccharomyces cerevisiae. Applied and
Environmental Microbiology, 52(5), 1055–1059.
Amirul, A. A., Khoo, S. L., Nazalan, M. N., Razip, M. S., & Azizan, M. N. (1996).
Purification and properties of two forms of glucoamylase from Aspergillus niger.
Folia Microbiologica, 41(2), 165–174. http://doi.org/9138312
Anto, H., Trivedi, U. B., & Patel, K. C. (2006). Glucoamylase production by solid-state
fermentation using rice flake manufacturing waste products as substrate. Bioresource
Technology, 97, 1161–1166. http://doi.org/10.1016/j.biortech.2005.05.007
Arnthong, J., Wanitchaploy, B., Sakai, K., Sanglier, J., & Kitpreechavanich, V. (2010).
Statistical screening of factors affecting glucoamylase production by a
thermotolerant Rhizopus microsporus TISTR 3518 using Plackett-Burman design.
African Journal of Biotechnology, 9(43), 7312–7316.
http://doi.org/10.5897/AJB10.049
Barnett, C., Smith, A., Scanlon, B., & Israilides, C. J. (1999). Pullulan production by
Aureobasidium pullulans growing on hydrolysed potato starch waste. Carbohydrate
Polymers, 38, 203–209. http://doi.org/10.1016/S0144-8617(98)00092-7
Bhatti, H. N., Rashid, M. H., Nawaz, R., Asgher, M., Perveen, R., & Jabbar, A. (2007).
Optimization of media for enhanced glucoamylase production in solid-state
fermentation by Fusarium solani. Food Technology and Biotechnology, 45(1), 51–
56.
Chiquetto, M. L., FAcciotti, M. C. R., Kilikian, Beatriz, V., & Schmidell, W. (1992).
Influence of carbon and nitrogen sources on glucoamylase production by Aspergillus
in batch process. Biotechnol Lett, 14(6), 465–470.
Djekrif-Dakhmouche, S., Gheribi-Aoulmi, Z., Meraihi, Z., & Bennamoun, L. (2006).
Application of a statistical design to the optimization of culture medium for alpha-
amylase production by Aspergillus niger ATCC 16404 grown on orange waste
powder. Journal of Food Engineering, 73, 190–197.
http://doi.org/10.1016/j.jfoodeng.2005.01.021
El-Gendy, M. M. A. (2012). Production of Glucoamylase by Marine Endophytic
Aspergillus sp. JAN-25 under Optimized Solid-state Fermentation Conditions on
Agro Residues. Australian Journal of Basic & Applied Sciences, 6(4), 41. Retrieved
from http://connection.ebscohost.com/c/articles/88895194/production-glucoamylase-

89
by-marine-endophytic-aspergillus-sp-jan-25-under-optimized-solid-state-
fermentation-conditions-agro-residues
Ellaiah, P., Adinarayana, K., & Bhavani, Y. (2002). Optimization of process parameters
for glucoamylase production under solid state fermentation by a newly isolated
Aspergillus species. Process Biochemistry, 38(4), 615–620.
http://doi.org/10.1016/S0032-9592(02)00188-7
Fadel, M. (2000). Alcohol Production From Potato Industry Starchy Waste. Egyptian
Journal of Microbiology, 35(3), 273–287.
Francis, F., Sabu, A., Nampoothiri, K. M., Ramachandran, S., Ghosh, S., Szakacs, G., &
Pandey, A. (2003). Use of response surface methodology for optimizing process
parameters for the production of α-amylase by Aspergillus oryzae. Biochemical
Engineering Journal, 15, 107–115. http://doi.org/10.1016/S1369-703X(02)00192-4
Huang, L. P., Jin, B., Lant, P., & Zhou, J. (2005). Simultaneous saccharification and
fermentation of potato starch wastewater to lactic acid by Rhizopus oryzae and
Rhizopus arrhizus. Biochemical Engineering Journal, 23, 265–276.
http://doi.org/10.1016/j.bej.2005.01.009
Izmirlioglu, G., & Demirci, A. (2012). Ethanol production from waste potato mash by using
Saccharomyces Cerevisiae. Applied Sciences, 2, 738–753.
http://doi.org/10.3390/app2040738
Jin, B., Van Leeuwen, H. J., Patel, B., Doelle, H. W., & Yu, Q. (1999). Production of
fungal protein and glucoamylase by Rhizopus oligosporus from starch processing
wastewater. Process Biochemistry, 34, 59–65. http://doi.org/10.1016/S0032-
9592(98)00069-7
Kammoun, R., Naili, B., & Bejar, S. (2008). Application of a statistical design to the
optimization of parameters and culture medium for alpha-amylase production by
Aspergillus oryzae CBS 819.72 grown on gruel (wheat grinding by-product).
Bioresource Technology, 99, 5602–5609.
http://doi.org/10.1016/j.biortech.2007.10.045
Kumar, P., & Satyanarayana, T. (2007). Optimization of culture variables for improving
glucoamylase production by alginate-entrapped Thermomucor indicae-seudaticae
using statistical methods. Bioresource Technology, 98, 1252–1259.
http://doi.org/10.1016/j.biortech.2006.05.019
Kumar, P., & Satyanarayana, T. (2009). Microbial glucoamylases: characteristics and
applications. Critical Reviews in Biotechnology, 29(June), 225–255.
http://doi.org/10.1080/07388550903136076
Kumar, S., & Satyanarayana, T. (2001). Medium optimization for glucoamylase
production by a yeast, Pichia subpelliculosa ABWF-64, in submerged cultivation.
World Journal of Microbiology and Biotechnology, 17, 83–87.
http://doi.org/10.1023/A:1016699314244
Lemmel, S. A., Heimsch, R. C., & Korus, R. A. (1980). Kinetics of growth and amylase
production of Saccharomycopsis fibuligera on potato processing wastewater.

90
Applied and Environmental Microbiology, 39(2), 387–393.
Liang, X. H., Zhao, G. L., Guo, Z. F., & Tang, Y. (2011). Effect of Plant Starch on the
Production of Glucoamylase from Aspergillus niger. Advanced Materials Research,
396-398, 1502–1505. http://doi.org/10.4028/www.scientific.net/AMR.396-398.1502
Liimatainen, H., Toiva, K., & Kaariainen, J. (2004). Bio-ethanol production from waste
potatoes. Energy Research, 21–24.
Norouzian, D., Akbarzadeh, A., Scharer, J. M., & Moo Young, M. (2006). Fungal
glucoamylases. Biotechnology Advances, 24, 80–85.
http://doi.org/10.1016/j.biotechadv.2005.06.003
Oda, Y., Saito, K., Yamauchi, H., & Mori, M. (2002). Lactic acid fermentation of potato
pulp by the fungus Rhizopus oryzae. Current Microbiology, 45, 1–4.
http://doi.org/10.1007/s00284-001-0048-y
Pandey, A. (1990). Improvements in solid-state fermentation for glucoamylase
production. Biological Wastes, 34, 11–19. http://doi.org/10.1016/0269-
7483(90)90140-N
Pandey, A., Nigam, P., Soccol, C. R., Soccol, V. T., Singh, D., & Mohan, R. (2000).
Advances in microbial amylases. Biotechnology and Applied Biochemistry, 31 ( Pt
2), 135–152.
Pandey, A., Selvakumar, P., & Ashakumary, L. (1994). Glucoamylase production by
Aspergillus niger on rice bran is improved by adding nitrogen sources. World
Journal of Microbiology & Biotechnology, 10, 348–349.
Pedersen, H., Beyer, M., & Nielsen, J. (2000). Glucoamylase production in batch,
chemostat and fed-batch cultivations by an industrial strain of Aspergillus niger.
Applied Microbiology and Biotechnology, 53, 272–277.
http://doi.org/10.1007/s002530050020
Plackett, R. L., & Burman, J. P. (1946). Design of optimum multifactorial experiments.
Biometrika, 33(4), 305–325.
Polakovič, M., & Bryjak, J. (2004). Modelling of potato starch saccharification by an
Aspergillus niger glucoamylase. Biochemical Engineering Journal, 18, 57–63.
http://doi.org/10.1016/S1369-703X(03)00164-5
Rajoka, M. I., & Yasmeen, A. (2005). Induction, and production studies of a novel
glucoamylase of Aspergillus niger. World Journal of Microbiology and
Biotechnology, 21, 179–187. http://doi.org/10.1007/s11274-004-1766-7
Shukla, J., & Kar, R. (2006). Potato peel as a solid state substrate for thermostable α-
amylase production by thermophilic Bacillus isolates. World Journal of
Microbiology and Biotechnology, 22, 417–422. http://doi.org/10.1007/s11274-005-
9049-5
Silveira, S. T., Oliveira, M. S., Costa, J. a V, & Kalil, S. J. (2006). Optimization of
glucoamylase production by Aspergillus niger in solid-state fermentation. Applied
Biochemistry and Biotechnology, 128(1), 131–140.

91
http://doi.org/10.1385/ABAB:128:2:131
Ueda, S. (1981). Fungal glucoamylases and raw starch digestion. Trends in Biochemical
Sciences, 6(1980), 89–90. http://doi.org/10.1016/0968-0004(81)90032-3
Wang, Q., Wang, X., Wang, X., & Ma, H. (2008). Glucoamylase production from food
waste by Aspergillus niger under submerged fermentation. Process Biochemistry,
43, 280–286. http://doi.org/10.1016/j.procbio.2007.12.010
Zangirolami, T. C., Carlsen, M., Nielsen, J., & Jørgensen, S. B. (2000). Selection and
characterization of a high α-amylase-producing variant in glucose-limited continuous
cultures of Aspergillus oryzae. Mycological Research, 104(October), 1241–1249.
http://doi.org/10.1017/S0953756200002665

92
CHAPTER 4
ENHANCED BIO-ETHANOL PRODUCTION FROM INDUSTRIAL POTATO
WASTE BY STATISTICAL MEDIUM OPTIMIZATION2
4.1 Abstract
Industrial wastes are of great interest as a substrate in production of value-added
products to reduce cost, while managing the waste economically and
environmentally. Bio-ethanol production from industrial wastes has gained attention
because of its abundance, availability, and rich carbon and nitrogen content. In this
study, industrial potato waste was used as a carbon source and a medium was
optimized for ethanol production by using statistical designs. The effect of various
medium components on ethanol production was evaluated. Yeast extract, malt extract,
and MgSO4·7H2O showed significantly positive effects, whereas KH2PO4 and
CaCl2·2H2O had a significantly negative effect (p-value < 0.05). Using response
surface methodology, a medium consisting of 40.4 g/L (dry basis) industrial waste
potato, 50 g/L malt extract, and 4.84 g/L MgSO4·7H2O was found optimal and yielded
24.6 g/L ethanol at 30 °C, 150 rpm, and 48 h of fermentation. In conclusion, this study
demonstrated that industrial potato waste can be used effectively to enhance bioethanol
production.
2A version of this chapter was published as: Izmirlioglu, G.; Demirci, A. (2015). Enhanced Bio-Ethanol
Production from Industrial Potato Waste by Statistical Medium Optimization. Int. J. Mol. Sci, 16, 24490-
24505

93
4.2 Introduction
Alternative fuels are of great interest due to the price fluctuations of petroleum-based
fuels, government regulations on carbon dioxide emissions, and future depletion of
petroleum reserves. Biofuels such as ethanol, methanol, and biodiesel are considered as
alternatives to petroleum fuels, and worldwide production of fuel ethanol reached 91
billion liters in 2013 (Licht, 2013). Current ethanol production depends on first
generation crops, such as sugar cane, corn, wheat, cassava, and is commercialized
globally with approximately 650 plants with a total capacity of 100 billion liters (D. P.
Ho, Ngo, & Guo, 2014). Corn-based ethanol represents the major fraction of ethanol
production with 60 billion liters, followed by sugar cane-based ethanol with 20 billion
liters in 2012 (D. P. Ho et al., 2014). Uses of the first generation crops for ethanol
production raise concerns over limited agricultural land and water, as well as other
environmental issues in regards to land use (Hashem & Darwish, 2010; D. P. Ho et al.,
2014). Although second and third generation feedstocks, lignocellulosic biomass, and
algae, respectively, have been considered as alternatives to the first generation crops,
ethanol production from these feedstocks is not cost-competitive yet. Therefore, the agro-
industrial wastes for ethanol production have been considered as carbon source.
Agro-industrial wastes have drawn attention for ethanol production due to their
abundance, availability, biodegradability, rich carbon and nutrient content, and also to
manage the waste issues of industry economically and environmentally (Gassara et al.,
2010). Waste and by-products of the potato industry have potential for fermentation
industry due to their high starch content and availability. In the potato processing
industry, 50% of the potatoes are generally wasted (Charmley et al., 2006). However, the
percentage varies for different potato processing plants, e.g., potato processing industry
creates 10% of waste potato pulp (Oda et al., 2002), 5%–20% cull potatoes (Liimatainen
et al., 2004), and 15%–40% peel (Arapoglou et al., 2010). In the potato chips industry, on
the other hand, 18% of the production is starchy waste (Fadel, 2000). The use of
industrial potato waste (including potato peels, potato mash, potato pulp, and potato
94
processing wastewater) for the production of α-amylase, lactic acid, and pullulan have
been reported (Arapoglou et al., 2010; Barnett et al., 1999; Fadel, 2000; Huang et al.,
2005).
The production of ethanol from several agro-industrial wastes has been reported. These
include food waste (Uncu & Cekmecelioglu, 2011; Yan et al., 2011), banana peels
(Oberoi et al., 2011), carob extract (Turhan, Bialka, Demirci, & Karhan, 2010), pineapple
waste (Tanaka et al., 1999), potato peel (Arapoglou et al., 2010), and waste of the olive
oil industry (Georgieva & Ahring, 2007). Moreover, ethanol production from potatoes
and potato peels has been investigated. Rani et al. (Rani et al., 2010) have studied ethanol
fermentation from potato flour and reported 56.8 g/L ethanol production from liquefied
slurry (250 g/L potato flour) at 30 °C for 48 h by S. cerevisiae HAU-1 without nitrogen
supplementation. Another study was undertaken for utilization of potato peel waste, and
7.6 g/L ethanol was produced after enzymatic hydrolysis of potato peels (Arapoglou et al.,
2010). Izmirlioglu & Demirci (2012) have studied the ethanol production from waste
potato mash, and saw that it produced a maximum of 30.99 g/L ethanol with
enzymatically hydrolyzed waste potato mash at pH 5.5 and 30 °C after 48 h of
fermentation. These conditions reveal 0.44 g ethanol /g glucose, which is equal 86.7% of
the theoretical yield. Because medium cost represents a major fraction of fermentation
costs, medium optimization for ethanol from industrial waste potato still needs to be
investigated, since there has been no study that has an optimized medium for ethanol from
industrial waste potato mash by Saccharomyces cerevisiae in particular.
Medium optimization by the conventional methods, which usually studies one variable at
a time is not only time-consuming, but also laborious, and impractical. Statistical designs
are commonly utilized for medium optimization studies and are considered a better way
of interpreting the results than traditional one-variable-at-a-time studies. Statistical
designs can also be applied at the different phases of the optimization process, such as
during the screening of a large number of variables in the medium, or optimization of the
growth parameters such as temperature, pH, and agitation to achieve the maximum
95
production. For screening of a large number of variables, the Plackett-Burman statistical
design (Plackett & Burman, 1946) is well-known and commonly employed by
researchers. Reliable information in regards to investigate the linear effects of the
variables can be obtained with the Plackett-Burman design and reduced number of
medium components can be further optimized. On the other hand, Box-Behnken design
(Box & Behnken, 1960) using response surface methodology can be employed for further
optimization of selected medium components, while considering the linear and quadratic
interactions among the variables.
This study, therefore, investigates industrial waste potato mash as the carbon source, and
the medium optimization for ethanol production. To conduct this study, the Plackett-
Burman statistical design was employed to screen for the effects of various medium
ingredients on ethanol production and further optimization of the medium was conducted
using response surface methodology, the Box-Behnken design.
4.3 Experimental Section
4.3.1 Microorganisms and Inoculum Preparation
The yeast, Saccharomyces cerevisiae (ATCC 24859) was purchased from the American
Type Culture Collection (Manassas, VA, USA). Inoculum preparation was carried out as
follows: S. cerevisiae was grown in a medium including 20 g/L of glucose, 6 g/L of yeast
extract (Difco, Sparks, MD, USA), 0.3 g/L of CaCl2·2H2O, 4 g/L of (NH4)2SO2, 1 g/L of
MgSO4·7H2O, and 1.5 g/L of KH2PO4 at 30 °C for 24 h. Working culture was maintained
by storing at 4°C and sub-cultured every two weeks, while stock cultures were stored in
20% glycerol at −80 °C.
4.3.2 Industrial Waste Potato Mash
A local potato processing plant provided the waste potato mash, which was utilized as the
carbon source in the medium. Mash potato wastes were from different potato varieties, such
as Frito-Lay FL 1833, Snowden, and Russet Burbank potatoes. The moisture analysis

96
showed that the waste potato mash consisted of 17%–24% of starch. No pretreatment was
carried out prior to fermentation, and the waste potato mash stored at −20 °C until its use.
4.3.3. Hydrolysis of Starch
α-Amylase (EC 3.2.1.1) and amyloglucosidase (EC 3.2.1.3) were employed for
liquefaction and saccharification, respectively, during the hydrolysis of starch. These
enzymes were kindly provided by Pennsylvania Grain Processing, LLC® (Clearfield, PA,
USA). Enzymatic hydrolysis was performed in two steps (Izmirlioglu & Demirci, 2012).
Industrial waste potato mash slurry was prepared (40.4 g/L (d.b.)), and alpha amylase
was added (590 U/g dry substrate) to the slurry for liquefaction. Liquefaction was carried
out at 95 °C for 3 h in an autoclave. In the second step, saccharification was carried out
with the addition of amyloglucosidase (25 U/g dry substrate) after the liquefied slurry
cooled down. Saccharification was carried out at 60 °C, 150 rpm for 72 h in a shaker
incubator (SHKE5000-7, Barnstead International, Dubuque, IA, USA).
4.3.4 Experimental Design
4.3.4.1. Plackett-Burman Design
The Plackett-Burman statistical design was used in this study as a first step of medium
optimization to determine the statistically significant medium constituents on ethanol
production. For screening of medium components, eight variables—malt extract, yeast
extract, MgSO4·7H2O, (NH4)2SO4, KH2PO4, CaCO3, FeSO4·7H2O, and CaCl2·2H2O—
were selected. Those medium ingredients were used to supplement the medium for
ethanol fermentation by S. cerevisiae in the literature (Table 4.1). Because potato waste is
an organic complex source and contained some nutrients, in this part of study, glucose
(100 g/L) was used as a carbon source to determine the sole effect of each ingredient.
This way, the authors ensured that the observed effect of each ingredient did not interact
with nutrients that may be leached from potato waste.

97
Table 4.1. Concentrations of variables at high and low levels in Plackett-Burman design.
Variable Lower Level High Level Reference
Yeast Extract (g/L) 0.5 5 (Demirci et al., 1997)
Malt Extract (g/L) 2 20 (Chan-u-Tit, Laopaiboon,
Jaisil, & Laopaiboon, 2013)
(NH4)2SO4 (g/L) 2 6 (Arapoglou et al., 2010)
MgSO4·7H2O (g/L) 0.2 2 (Dombek & Ingram, 1986)
KH2PO4 (g/L) 0.5 3 (Arapoglou et al., 2010)
CaCO3 (g/L) 0.2 2 (Abouzied & Reddy, 1986)
FeSO4·7H2O (g/L) 0.01 0.1
(Pereira, Guimarães,
Teixeira, & Domingues,
2010)
CaCl2·2H2O (g/L) 0.3 3 (Pereira et al., 2010)
The Plackett-Burman design allows studying N-1 factors with N experiments. In the
design, each factor is represented at the high (+) level and the low (−) level. The calculation
of the effect of each variable is shown in Equation 4.1,
𝐸 =∑ 𝑦(+)
𝑁−
∑ 𝑦(−)
𝑁...............................................................Eqn 4.1
where E is the effect of the factor, y(+) and y(−) are the responses when a given factor is
at its high and low levels, respectively, and N is the total number of experiments. As
illustrated in Equation 4.1, the Plackett-Burman design is only for screening purpose due
to the fact that the interactions among the factors are neglected.
Two levels (low and high) for each factor were studied (Table 4.1). Also, 12 medium
compositions suggested by the Plackett-Burman design, were investigated (Table 4.2).
Fermentation was carried out in 250 mL flasks (with a 100-mL working volume) at 30 °C,
150 rpm for 48 h in a shaker incubator (Barnstead International). Each experiment was
replicated in triplicate. Minitab Statistical Software (Version 16.1; Minitab Inc., State

98
College, PA, USA) was employed for statistical analysis. After analysis of variance
(ANOVA), statistically significant effects were identified and validated.
4.3.4.2. Response Surface Methodology
Medium ingredients (yeast extract, malt extract, and MgSO4·7H2O) affecting bio-ethanol
production, as suggested by the Plackett-Burman design, were further optimized using the
Box-Behnken design of response surface methodology via Minitab (Version 16.1). The levels
of these factors are given in Table 4.3. The independent variables were coded as X1 (yeast
extract), X2 (malt extract), and X3 (MgSO4·7H2O), and the second-order model was used to
predict the response to the independent variables (Equation 4.2).
𝑦 = β0 + β1𝑋1 + β2𝑋2 + β3𝑋3 + β11𝑋12 + β22𝑋2
2 + β33𝑋22 + β12𝑋1𝑋2 + β13𝑋1𝑋3 +
β23𝑋2𝑋3 … … … … … … ….......................................Eqn 4.2
where y is the response (ethanol), β0, βi, and βii are the regression coefficients.
Fermentation runs were carried out in 250 mL flasks with a working volume of 100 mL.
Industrial waste potato mash was hydrolyzed as described and supplemented with malt
extract, yeast extract, and MgSO4·7H2O according to the Box-Behnken design (Table
4.3). The media was sterilized at 121 °C for 15 min. After cooling down the medium, 3%
inoculum (S. cerevisiae) was added under aseptic conditions. Fermentation experiments
were carried out in a shaker incubator at constant temperature and agitation, 150 rpm and
30 °C, respectively, for 48 h. All runs were repeated in triplicate. The ANOVA and
regression analysis were conducted to determine the coefficients of the predictive model
and significant terms (Minitab Statistical Software, State College, PA, USA).
Determination of the optimum medium composition was obtained by the Response
Optimizer tool in Minitab Software, and the identified optimum conditions were
validated experimentally.
99
4.3.5 Analysis
4.3.5.1 Ethanol and Glucose
The ethanol and glucose concentrations of the fermentation samples were determined
using a Waters’ high pressure liquid chromatography (HPLC) equipped with a refractive
index detector (Waters, Milford, MA, USA). Bio-Rad Aminex HPX-87H column (300
mm × 7.8 mm; Bio-Rad, Richmond, CA, USA) was used as the HPLC column with 0.8
mL/min of 0.012 N sulfuric acid as mobile phase. The detector and column temperatures
were constant at 35 and 65 °C, respectively. Ethanol and glucose concentrations were
quantified on the basis of peak area and retention time of the ethanol and glucose
standards that were prepared with 200 proof ethanol and D-glucose monomer (1, 5, 10,
20, 30 g/L). Prior to the HPLC analysis, samples were centrifuged at 4 °C for 20 min at
5200× g in order to separate the cells and potato particles. The supernatant were filtered
with 0.2 μm nylon syringe filters (VWR, Radnor, PA, USA) and injected to HPLC.
4.3.5.2 Microbial Cell Population
Cell population was determined with spiral plating method by using a spiral auto-plater
(Model 4000, Spiral Biotech, Norwood, MA, USA) and Q-count software (Version 2.1;
Spiral Biotech, Norwood, MA, USA). Serial dilution of the samples were carried out with
0.1% sterile peptone water and spirally plated on potato dextrose agar (Difco, Sparks,
MD, USA). Plates were incubated at 30 °C for 24 h. Enumeration of the grown colonies
were performed by Q-count software (Version 2.1). Results were reported as
Log10 CFU/mL.
4.3.5.3 Dry Weight Analysis
The dry weight of industrial potato waste was determined. Samples were weighed and
dried for 48 h at 105 °C in an oven, until constant weight was achieved within 48 h.

100
4.4 Results
4.4.1 Effects of Medium Components on Ethanol Production
Eight medium components that are chosen from the literature were examined using the
Plackett-Burman statistical design (Table 4.1). The experimental design matrix for
screening of important medium components and the experimental results are shown in
Table 4.2.
Table 4.2. Placket-Burman experimental design matrix for screening of important
variables for bio-ethanol production with results. *
* The medium also includes 100 g/L glucose as the carbon source.
The ethanol production by S. cerevisiae varied from 5.05 g/L to 36.85 g/L in 12
experiments, which proves the importance of medium components and their
concentrations on ethanol production. The analysis showed that medium #3 resulted in
the highest ethanol production (36.85 g/L), followed by medium #6 and medium #1 (36.8
Medium
Number
Yeast
Extract
(g/L)
Malt
Extract
(g/L)
MgSO4·7H2O
(g/L)
(NH4)2·SO4
(g/L)
KH2PO4
(g/L)
CaCO3
(g/L)
FeSO4·7H2O
(g/L)
CaCl2·2H2O
(g/L)
Ethanol
(g/L)
1 5 20 2 2 3 2 0.01 3 33.5
2 0.5 2 0.2 6 3 2 0.01 3 5.05
3 0.5 20 2 6 0.5 2 0.1 0.3 36.85
4 0.5 20 0.2 2 0.5 2 0.1 3 15.9
5 5 2 2 6 0.5 2 0.01 0.3 31.45
6 5 2 2 2 0.5 0.2 0.1 3 36.8
7 0.5 2 2 6 3 0.2 0.1 3 8.36
8 5 20 0.2 6 3 0.2 0.1 0.3 31.95
9 5 20 0.2 6 0.5 0.2 0.01 3 30.45
10 0.5 20 2 2 3 0.2 0.01 0.3 29.8
11 5 2 0.2 2 3 2 0.1 0.3 31.2
12 0.5 2 0.2 2 0.5 0.2 0.01 0.3 14.15

101
and 31.5 g/L, respectively). Either malt extract or yeast extract were at high levels (20
g/L and 5 g/L) in all of these medium compositions, showing the impact of those
components. Media #2, #7, and #12 demonstrated the lowest ethanol production (5.05,
8.36, and 14.15 g/L, respectively). All of the three media consisted of low concentration
of yeast extract, which demonstrates its significance. The main effects, regression
coefficients, F-values, and p-values of each variable are given in Table 4.3.
Table 4.3. Statistical analysis of Plackett-Burman design for ethanol production from
industrial waste potato mash by S. cerevisiae.
Variables Main Effect β-coefficients F-value p-value
Yeast Extract (g/L) 14.206 7.103 71.87 0.000
Malt Extract (g/L) 8.573 4.286 26.17 0.000
(NH4)2SO4 (g/L) −2.873 −1.436 2.94 0.109
MgSO4.7H2O (g/L) 8.009 4.004 22.84 0.000
KH2PO4 (g/L) −4.289 −2.144 6.55 0.023
CaCO3 (g/L) 0.407 0.203 0.06 0.811
FeSO4.7H2O (g/L) 2.776 1.388 2.74 0.120
CaCl2.2H2O (g/L) −7.556 −3.778 20.33 0.000
According to these Analysis of variance (ANOVA) results, the total of five variables—
yeast extract, malt extract, MgSO4·7H2O, KH2PO4, and CaCl2·2H2O—showed statistically
significant effects on ethanol production (p-value < 0.05), while effects of (NH4)2SO4,
CaCO3, and FeSO4·7H2O were not statistically significant. The analysis of coefficients
showed that yeast extract, malt extract, and MgSO4·7H2O had positive effects on ethanol
fermentation, while KH2PO4, and CaCl2·2H2O exerted negative effects (p-value < 0.05).
The most significant variable was yeast extract, which had the highest coefficient,
followed by malt extract and MgSO4·7H2O (Table 4.3). Figure 4.1 shows the counter
plots of the effects of the various combinations of the statistically-significant independent
variables on ethanol production by S. cerevisiae.
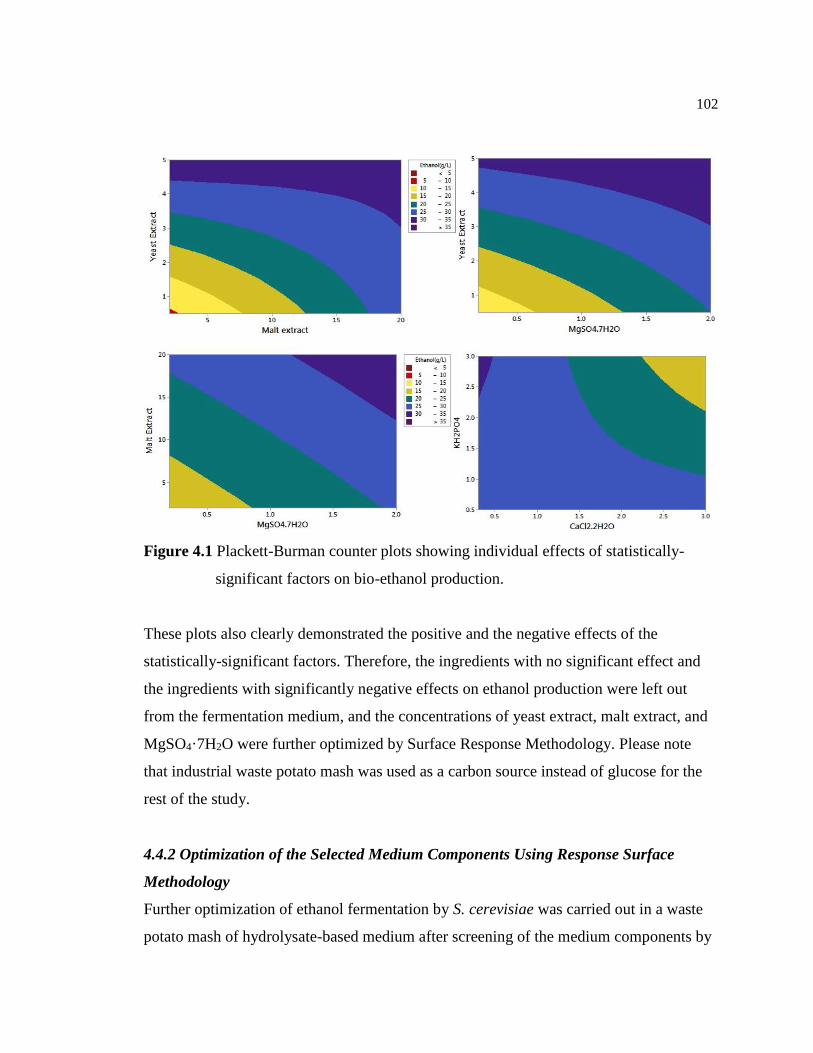
102
Figure 4.1 Plackett-Burman counter plots showing individual effects of statistically-
significant factors on bio-ethanol production.
These plots also clearly demonstrated the positive and the negative effects of the
statistically-significant factors. Therefore, the ingredients with no significant effect and
the ingredients with significantly negative effects on ethanol production were left out
from the fermentation medium, and the concentrations of yeast extract, malt extract, and
MgSO4·7H2O were further optimized by Surface Response Methodology. Please note
that industrial waste potato mash was used as a carbon source instead of glucose for the
rest of the study.
4.4.2 Optimization of the Selected Medium Components Using Response Surface
Methodology
Further optimization of ethanol fermentation by S. cerevisiae was carried out in a waste
potato mash of hydrolysate-based medium after screening of the medium components by

103
the Plackett-Burman design. Based on the results of the Plackett-Burman design, yeast
extract, malt extract, and MgSO4·7H2O were optimized using Response Surface
Methodology’s Box-Behnken design. The experimental matrix and the results of Box-
Behnken experiments are presented in Table 4.4.
Table 4.4. Box-Behnken experimental design matrix with the experimental values of bio-
ethanol production.*
Run
Order
Yeast Extract
(g/L)
Malt Extract
(g/L)
MgSO4·7H2O
(g/L)
Ethanol
(g/L)
Cell
Population
(log CFU/mL)
1 25 25 10 22.95 7.14
2 12.5 50 0 26.01 7.15
3 0 0 5 13.77 6.02
4 12.5 25 5 22.37 7.19
5 25 50 5 26.21 7.13
6 12.5 25 5 24.71 7.26
7 0 25 0 18.83 6.82
8 25 25 0 18.85 7.00
9 0 25 10 20.50 7.16
10 12.5 25 5 28.59 5.95
11 12.5 0 0 15.41 6.10
12 25 0 5 12.93 6.02
13 12.5 50 10 20.57 7.05
14 12.5 0 10 13.86 6.19
15 0 50 5 32.52 7.07
* The medium also includes 40.4 g/L (d.b.) industrial potato mash as the carbon source.
The highest ethanol production (32.52 g/L) was observed when waste potato mash
hydrolysate was supplemented with 50 g/L malt extract, 5 g/L MgSO4·7H2O, and 0 g/L
yeast extract. In contrast, the medium composition which consisted of 25 g/L yeast
extract, 5 g/L MgSO4·7H2O, and 0 g/L malt extract resulted in the lowest ethanol

104
production (12.93 g/L). Malt extract showed a strong influence on ethanol production.
Ethanol concentrations varied from 12.93 g/L to 26.21 g/L depending on the
concentration of malt extract, specifically when yeast extract and MgSO4·7H2O were
kept constant at 25 g/L and 5 g/L, respectively. Higher malt extract (50 g/L) enhanced
ethanol production and resulted in 26.21 g/L ethanol, whereas ethanol production
dropped to 12.93 g/L in the absence of malt extract. The same pattern was observed for
MgSO4·7H2O, and 22.95 g/L ethanol was produced when the medium supplemented with
10 g/L MgSO4·7H2O, 25 g/L malt extract, and 25 g/L yeast extract. However, 18.85 g/L
ethanol was produced when MgSO4·7H2O was not added to the medium even though
concentrations of yeast and malt extracts were the same. The data showed that yeast
extract did not have any significant impact on ethanol production in the evaluated range
when waste potato mash hydrolysate was used as a carbon source. When malt extract and
MgSO4·7H2O concentrations were kept constant at 50 and 5 g/L, respectively, 32.52 g/L
ethanol was obtained in the absence of yeast extract. Ethanol concentration, however,
decreased to 26.21 g/L when 25 g/L yeast extract was added to the medium. Even though
ethanol production was highly influenced by medium compositions in the design matrix,
cell population did not show a significant difference among runs (Table 4.4).
The regression analysis of the ethanol production and cell population data were
represented by a second order polynomial equation without the insignificant terms as
shown below:
𝐸𝑡ℎ𝑎𝑛𝑜𝑙 (𝑔
𝐿) = 13.61 + 0.2467 𝑋2 + 1.326𝑋3 − 0.1357𝑋3
2.........................Eqn 4.3
𝐶𝑒𝑙𝑙 𝑃𝑜𝑝𝑢𝑙𝑎𝑡𝑖𝑜𝑛 (𝐶𝐹𝑈
𝐿) = 6.082 + 0.0476 𝑋2 − 0.0005𝑋2
2..............................Eqn 4.4
where X2 and X3 are malt extract (g/L) and MgSO4·7H2O (g/L), respectively. The results
of ANOVA for ethanol production indicated that the model is reliable with a 73.8% r-
square and a 0.002 p-value with significant linear and quadratic effects when
insignificant effects are excluded. Statistical analysis showed that ethanol production was
highly affected by malt extract and MgSO4·7H2O, but the effect of yeast extract was not

105
significant (p-value > 0.1). Linear coefficient of malt extract was highly significant (p-
value < 0.000). In addition, ethanol production demonstrated a non-linear effect with the
increase of MgSO4·7H2O from 0 to 10 g/L under the studied conditions. The ethanol
production reached a peak value (> 30 g/L) at the mid-value of MgSO4·7H2O (5 g/L).
Figure 4.2 Response surface and contour plots for ethanol production showing the
interaction of malt extract and MgSO4·7H2O concentrations and their effects
on the bio-ethanol production.
Response surface and counter plots are graphical representations of the regression model
equation for ethanol production (Figure 4.2), and linear effect of malt extract and
quadratic effect of MgSO4·7H2O can be seen clearly. The ANOVA results of cell
population data, on the other hand, showed that only malt extract had a significant effect
on cell population (p-value < 0.05), while yeast extract and MgSO4·7H2O had no
statistical significance (p-value > 0.05). The regression model of cell population had an r-
square value of 66.2%. Malt extract showed a linear effect on cell population; however,

106
increasing the malt extract concentration above 25 g/L did not increase the cell
population further (Figure 4.3).
Figure 4.3 Response surface and contour plots for cell population showing the
interaction of malt extract and yeast extract concentrations and their effects
on the cell population (MgSO4·7H2O at mid-value).
The response optimizer tool in Minitab was used to determine the optimal medium
composition to maximize the production of ethanol. The optimum conditions were found
to be 50 g/L of malt extract and 4.84 g/L of MgSO4·7H2O with no yeast extract, which
yielded 24.6 g/L ethanol. Because the optimum amount of malt extract (50 g/L) found to
be at the high end of the tested range (0–50 g/L), another set of fermentation performed
to determine whether further increase in malt extract levels would improve the ethanol
yield or not. To conduct this study, only malt extract concentrations increased up to 100
g/L (50, 60, 70, 80, 90, 100 g/L) in the optimal medium. No further improvement in

107
Figure 4.4 Bio-ethanol production and glucose consumption using the statistically
optimized medium.
Table 4.5. Comparison between the basal and optimized media.
Media Ingredient name Ingredient Conc.
(g/L)
Ethanol (g/L)
Basal Waste potato mash 40.4 (dry weight) 11.63
Plackett-Burman
validation media
with potato
waste
hydrolysate
Waste potato mash 40.4 (dry weight) 17.03
Yeast Extract 5
Malt Extract 20
MgSO4·7H2O 2
Response
Surface
validation media
Waste potato mash 40.4 (dry weight) 24.6
Yeast Extract 0
Malt Extract 50
MgSO4·7H2O 4.84
0
5
10
15
20
25
30
35
40
45
0 10 20 30 40 50
Glu
cose
an
d E
than
ol (
g/L)
Time (h)Glucose (g/L) Ethanol (g/L)

108
ethanol yields was observed, but there was even a slight decrease in ethanol yield (data
not shown). Therefore, it was concluded that the optimum concentration of malt extract is
50 g/L. The experimental time course of optimal medium composition is presented in
Figure 4.4
Because glucose was used as a carbon source for the Plackett-Burman design
experiments, a comparison study was conducted where the waste potato mash
hydrolysate was used as the sole carbon source. Enhancement of ethanol production with
the medium optimization can be seen in Table 4.5, where ethanol production was
increased from 11.63 g/L to 24.6 g/L.
4.5 Discussion
The potato is an organic compound and composed of carbohydrates, proteins, fat,
carotene, thiamine, riboflavin, and ascorbic acid (Diop, 1998), and these components
might promote the cell growth and product formation during ethanol fermentation. In
order to determine the effect of medium ingredients, glucose was used as the carbon
source instead of the potato waste mash hydrolysate during the Plackett-Burman
screening. This way, the influence of the medium ingredients could be observed without
interactions of nutrients that would have otherwise leached from the waste potato mash.
Nitrogen is one of the key nutrients in ethanol fermentation by S. cerevisiae for protein
synthesis and cell growth (Chan-u-Tit et al., 2013; Demirci et al., 1997). Nitrogen,
furthermore, affects the alcohol tolerance of the yeast, as well as the production rate
(Bafrncová, Šmogrovičová, Sláviková, Pátková, & Dömény, 1999). S. cerevisiae has
developed a wide range of nitrogen regulation systems and can use up to 30 different
nitrogen containing compounds (Godard et al., 2007; Lampitt, 1919). The source of
nitrogen, however, is important in terms of by-product formation: glycerol. Ammonium
salts, when used as the sole nitrogen source, may increase the glycerol formation whereas
amino acids tend to decrease (Albers, Larsson, Lidén, Niklasson, & Gustafsson, 1996).
This might explain the negative effect of ammonium sulfate on ethanol production during

109
the Plackett-Burman screening experiments. Pereira et al. (2010) and other researchers
(Laopaiboon, Nuanpeng, Srinophakun, Klanrit, & Laopaiboon, 2009) observed a similar
pattern when studying medium optimization for very high gravity ethanol fermentation
and reported that ammonium sulfate decreased ethanol concentration. In contrast, yeast
extract showed statistically significant positive effects. Yeast extract is well known for its
high nitrogen content (>75%) (Chan-u-Tit et al., 2013), and has been studied extensively.
The effect of media supplementation for very high gravity ethanol production by S.
cerevisiae was studied by Bafrncová et al. ( 1999). The authors reported that a 17%
increase in ethanol production was observed when the concentration of free amino
nitrogen increased. Also, higher glucose consumption rate and biomass yield was
observed with an increase in yeast extract concentration (from 3 g/L to 9 g/L). Thomas &
Ingledew (1992) studied very high gravity fermentation of wheat mash and reported a
21% ethanol yield in four days when the medium was supplemented with 1% yeast
extract. In another study (Hong & Yoon, 2011), the highest ethanol concentration (36
g/L) was achieved in the presence of 10 g/L yeast extract when food waste was utilized as
feedstock. A decrease in the ethanol concentration was also observed when the yeast
extract concentration was decreased to 2.5 g/L, in the same study (Hong & Yoon, 2011).
These studies align with our Plackett-Burman screening results, and show the importance
of nitrogen source for the ethanol production.
On the other hand, the concentration of nitrogen source is another important factor for
efficient ethanol fermentation. Although yeast extract promoted ethanol fermentation
when glucose was used as sole carbon source, addition of yeast extract was found
unnecessary when waste potato mash was used as a carbon source during response
surface optimization. The nitrogen content of potato tubers has been reported as 4.5% (Le
Tourneau, 1956). This might be due to sufficient nitrogen levels of industrial waste
potato mash in combination with the malt extract. Rani et al. ( 2010) reported that no
nitrogen supplementation was necessary for ethanol fermentation from potato flour,
which is in agreement with our results. Vilanova et al. ( 2007) also reported that
excessive amounts of nitrogen decreased the ethanol concentration. Furthermore, high

110
concentrations of yeast extract did not promote ethanol production when nitrogen
supplementation for very high gravity ethanol production was studied (Chan-u-Tit et al.,
2013).
Malt extract showed a significantly positive effect in the Plackett-Burman screening test,
as well as in Response Surface Box-Behnken experiments. The positive effects of malt
extract may be due to its sugar and nitrogen contents that promote biomass growth and
result in higher ethanol yields. Nitrogen content of malt extract may vary from 1.4–1.8%
according to O’Rourke ( 2002). This amount may be insufficient itself, but when
combined with the nitrogen of waste potato mash, it was found to be satisfactory for S.
cerevisiae for both ethanol production and cell population. Further increases in malt
extract (up to 100 g/L), caused a slight decrease in ethanol production which can be
explained that high levels of nitrogen might decrease ethanol yields as reported in other
publications (Vilanova et al., 2007).
Magnesium sulfate also showed a significant effect on ethanol fermentation not only in
the Plackett-Burman screening, but also in Box-Behnken optimization, which is in
agreement with several publications that reported the positive effect of magnesium ions
on ethanol production. It is reported that magnesium ions prolonged exponential growth
and promoted yeast cell mass and enhance fermentative activity during batch cultures
(Dombek & Ingram, 1986). Pereira et al. (2010) also reported that MgSO4·7H2O
increased the final ethanol concentrations; however, increased concentrations of
MgSO4·7H2O resulted in a decrease in ethanol production. Authors reported 3.8 g/L of
MgSO4·7H2O was optimum for very high gravity ethanol fermentation by S. cerevisiae.
In this study, it was demonstrated that 11.63 g/L ethanol can be produced from 40.4 g/L
(d.b.) industrial waste potato mash without any supplementation after an enzyeme
hydrolysis. However, supplemention of a medium with 50 g/L malt extract and 4.84 g/L
MgSO4·7H2O increased the ethanol concentration and resulted in 24.6 g/L ethanol at the
end of 48 h fermentation. Our results show that the screening and optimization

111
methodologies described here enhanced the ethanol production from inudstrial waste
potato mash by S. cerevisiaie without yielding higher biomass. Further studies may be
conducted to substitue the malt extract with an inexpensive source of nitrogen, as well as
increased solid loading.
4.6 Conclusion
This study presented medium component screening and the effects of medium components
on ethanol production and the use of response surface methodology, Box-Behnken design
in particular, to determine ethanol production from industrial waste potato mash for various
media compositions. Yeast extract, malt extract, and MgSO4·7H2O were identified as the
variables that had statistically significant positive effects on ethanol production by S.
cerevisiae. Optimal medium composition was determined as 40.4 g/L industrial in waste
potato mash hydrolysate, 50 g/L malt extract, and 4.84 g/L MgSO4·7H2O, and resulted in
24.6 g/L ethanol concentration at 30 °C and 48 h of fermentation. The results imply that the
wastes of potato industry can serve as a inexpensive feedstock for ethanol industry.
4.7 References
Abouzied, M. M., & Reddy, C. A. (1986). Direct fermentation of potato starch to ethanol
by co-cultures of Aspergillus niger and Saccharomyces cerevisiae. Applied and
Environmental Microbiology, 52(5), 1055–1059.
Albers, E., Larsson, C., Lidén, G., Niklasson, C., & Gustafsson, L. (1996). Influence of
the nitrogen source on Saccharomyces cerevisiae anaerobic growth and product
formation. Applied and Environmental Microbiology, 62(9), 3187–3195.
Arapoglou, D., Varzakas, T., Vlyssides, a., & Israilides, C. (2010). Ethanol production
from potato peel waste (PPW). Waste Management, 30(10), 1898–1902.
http://doi.org/10.1016/j.wasman.2010.04.017
Bafrncová, P., Šmogrovičová, D., Sláviková, I., Pátková, J., & Dömény, Z. (1999).
Improvement of very high gravity ethanol fermentation by media supplementation
using Saccharomyces cerevisiae. Biotechnology Letters, 21(4), 337–341.
http://doi.org/10.1023/A:1005436816047
Barnett, C., Smith, A., Scanlon, B., & Israilides, C. J. (1999). Pullulan production by
Aureobasidium pullulans growing on hydrolysed potato starch waste. Carbohydrate
Polymers, 38, 203–209. http://doi.org/10.1016/S0144-8617(98)00092-7

112
Box, G. E. P., & Behnken, D. . (1960). Some new three level designs for the study of
quantative variables. Technometrics, 2, 455–475.
Chan-u-Tit, P., Laopaiboon, L., Jaisil, P., & Laopaiboon, P. (2013). High level ethanol
production by nitrogen and osmoprotectant supplementation under very high gravity
fermentation conditions. Energies, 6(2), 884–899. http://doi.org/10.3390/en6020884
Charmley, E., Nelson, D., & Zvomuya, F. (2006). Nutrient cycling in the vegetable
processing industry: Utilization of potato by-products. Canadian Journal of Soil
Science, 86(4), 621–629. http://doi.org/10.4141/S05-118
Demirci, A., Pometto, A. L. I., & Ho, K. L. G. (1997). Ethanol production by
Saccharomyces cerevisiae in biofilm reactors. Journal of Industrial Microbiology &
Biotechnology, 19, 299–304. http://doi.org/10.1038/sj.jim.2900464
Diop, A. (1998). Storage and Processing of Roots and Tubers in the Tropics. Retrieved
June 27, 2015, from http://www.fao.org/docrep/x5415e/x5415e00.htm#Contents
Dombek, K. M., & Ingram, L. O. (1986). Magnesium limitation and its role in apparent
toxicity of ethanol during yeast fermentation. Applied and Environmental
Microbiology, 52(5), 975–981.
Fadel, M. (2000). Alcohol Production From Potato Industry Starchy Waste. Egyptian
Journal of Microbiology, 35(3), 273–287.
Gassara, F., Brar, S. K., Tyagi, R. D., Verma, M., & Surampalli, R. Y. (2010). Screening
of agro-industrial wastes to produce ligninolytic enzymes by Phanerochaete
chrysosporium. Biochemical Engineering Journal, 49(3), 388–394.
http://doi.org/10.1016/j.bej.2010.01.015
Georgieva, T. I., & Ahring, B. K. (2007). Potential of agroindustrial waste from olive oil
industry for fuel ethanol production. Biotechnology Journal, 2(12), 1547–1555.
http://doi.org/10.1002/biot.200700128
Godard, P., Urrestarazu, A., Vissers, S., Kontos, K., Bontempi, G., van Helden, J., &
André, B. (2007). Effect of 21 different nitrogen sources on global gene expression
in the yeast Saccharomyces cerevisiae. Molecular and Cellular Biology, 27(8),
3065–3086. http://doi.org/10.1128/MCB.01084-06
Hashem, M., & Darwish, S. M. I. (2010). Production of bioethanol and associated by-
products from potato starch residue stream by Saccharomyces cerevisiae. Biomass
and Bioenergy, 34(7), 953–959. http://doi.org/10.1016/j.biombioe.2010.02.003
Ho, D. P., Ngo, H. H., & Guo, W. (2014). A mini review on renewable sources for
biofuel. Bioresource Technology, 169, 742–749.
http://doi.org/10.1016/j.biortech.2014.07.022
Hong, Y. S., & Yoon, H. H. (2011). Ethanol production from food residues. Biomass and
Bioenergy, 35(7), 3271–3275. http://doi.org/10.1016/j.biombioe.2011.04.030
Huang, L. P., Jin, B., Lant, P., & Zhou, J. (2005). Simultaneous saccharification and
fermentation of potato starch wastewater to lactic acid by Rhizopus oryzae and
Rhizopus arrhizus. Biochemical Engineering Journal, 23, 265–276.

113
http://doi.org/10.1016/j.bej.2005.01.009
Izmirlioglu, G., & Demirci, A. (2012). Ethanol production from waste potato mash by
using Saccharomyces cerevisiae. Applied Sciences, 2, 738–753.
http://doi.org/10.3390/app2040738
Lampitt, L. H. (1919). Nitrogen metabolism in Saccharomyces cerevisiae. In The
Biochemical journal (Vol. 13, pp. 459–486).
http://doi.org/10.1101/087969180.11B.39
Laopaiboon, L., Nuanpeng, S., Srinophakun, P., Klanrit, P., & Laopaiboon, P. (2009).
Ethanol production from sweet sorghum juice using very high gravity technology:
Effects of carbon and nitrogen supplementations. Bioresource Technology, 100(18),
4176–4182. http://doi.org/10.1016/j.biortech.2009.03.046
Le Tourneau, D. (1956). Potato Composition: Carbohydrate Components of the Potato
Tuber. Journal of Agricultural and Food Chemistry, 4(6), 543–545.
Licht, F. O. (2013). World fuel ethanol production by country or region. Retrieved from
http://www.afdc.energy.gov/
Liimatainen, H., Toiva, K., & Kaariainen, J. (2004). Bio-ethanol Production from Waste
Potatoes. Energy Research, 21–24.
O’Rourke, T. (2002). Malt specifications & brewing performance. The Brewer
International, 2(10), 27–30.
Oberoi, H. S., Vadlani, P. V., Saida, L., Bansal, S., & Hughes, J. D. (2011). Ethanol
production from banana peels using statistically optimized simultaneous
saccharification and fermentation process. Waste Management, 31(7), 1576–1584.
http://doi.org/10.1016/j.wasman.2011.02.007
Oda, Y., Saito, K., Yamauchi, H., & Mori, M. (2002). Lactic acid fermentation of potato
pulp by the fungus Rhizopus oryzae. Current Microbiology, 45, 1–4.
http://doi.org/10.1007/s00284-001-0048-y
Pereira, F. B., Guimarães, P. M. R., Teixeira, J. A., & Domingues, L. (2010).
Optimization of low-cost medium for very high gravity ethanol fermentations by
Saccharomyces cerevisiae using statistical experimental designs. Bioresource
Technology, 101(20), 7856–7863. http://doi.org/10.1016/j.biortech.2010.04.082
Plackett, R. L., & Burman, J. P. (1946). Design of optimum multifactorial experiments.
Biometrika, 33(4), 305–325.
Rani, P., Sharma, S., Garg, F. C., Raj, K., & Wati, L. (2010). Ethanol production from
potato flour by Saccharomyces cerevisiae. Indian Journal of Science and
Technology, 3(7), 733–736. Retrieved from
http://www.indjst.org/index.php/indjst/article/view/29804
Tanaka, K., Hilary, Z. D., & Ishizaki, A. (1999). Investigation of the utility of pineapple
juice and pineapple waste material as low-cost substrate for ethanol fermentation by
Zymomonas mobilis. Journal of Bioscience and Bioengineering, 87(5), 642–646.
http://doi.org/10.1016/S1389-1723(99)80128-5

114
Thomas, K. C., & Ingeldew, W. M. (1992). Production of 21% (v/v) ethanol by
fermentation of very high gravity (VHG) wheat mashes. Journal of Industrial
Microbiology, 10(1), 61–68. http://doi.org/10.1007/BF01583635
Turhan, I., Bialka, K. L., Demirci, A., & Karhan, M. (2010). Ethanol production from
carob extract by using Saccharomyces cerevisiae. Bioresource Technology, 101(14),
5290–5296. http://doi.org/10.1016/j.biortech.2010.01.146
Uncu, O. N., & Cekmecelioglu, D. (2011). Cost-effective approach to ethanol production
and optimization by response surface methodology. Waste Management, 31(4), 636–
643. http://doi.org/10.1016/j.wasman.2010.12.007
Vilanova, M., Ugliano, M., Varela, C., Siebert, T., Pretorius, I. S., & Henschke, P. a.
(2007). Assimilable nitrogen utilisation and production of volatile and non-volatile
compounds in chemically defined medium by Saccharomyces cerevisiae wine
yeasts. Applied Microbiology and Biotechnology, 77(1), 145–157.
http://doi.org/10.1007/s00253-007-1145-z
Yan, S., Li, J., Chen, X., Wu, J., Wang, P., Ye, J., & Yao, J. (2011). Enzymatical
hydrolysis of food waste and ethanol production from the hydrolysate. Renewable
Energy, 36(4), 1259–1265. http://doi.org/10.1016/j.renene.2010.08.02

115
CHAPTER 5
IMPROVED SIMULTANEOUS SACCHARIFICATION AND
FERMENTATION OF BIOETHANOL FROM INDUSTRIAL POTATO WASTE
WITH CO-CULTURES OF ASPERGILLUS NIGER AND SACCHAROMYCES
CEREVISIAE BY MEDIUM OPTIMIZATION3
5.1 Abstract
For economical production of bioethanol from industrial wastes, enzyme cost for
saccharification is the significant cost for the overall process. Therefore, the fermentation
medium optimization for simultaneous saccharification and fermentation (SSF) by using
co-culture of Aspergillus niger and Saccharomyces cerevisiae for potato wastes was
undertaken in this study. A medium consisted of waste potato mash, malt extract and
FeSO47H2O were defined as the optimum medium for co-culture of A. niger and S.
cerevisiae SSF. Statistical optimization of defined medium was conducted using central
composite design. Optimization results suggested that optimum concentrations of
industrial waste potato mash, malt extract, and FeSO47H2O were 92.37 g/L, 59.42 g/L
and 0.159 g/L, respectively. Under the optimal medium, 35.19 g/L ethanol production
and 31.36 U/ml enzyme activity giving a yield of 0.38 g ethanol/g starch and 0.34 U/ g
starch respectively, achieved at 30°C and 120 h of fermentation.
3 A version of this chapter was published as: Izmirlioglu G., and A. Demirci. 2016. Improved simultaneous
saccharification and fermentation of bioethanol from industrial potato waste with co-cultures of Aspergillus
niger and Saccharomyces cerevisiae by medium optimization. Fuel. 185, 684-691.
116
5.2 Introduction
Renewable energy sources are in demand due to increasing environmental concerns, as
well as depletion of petroleum reserves. Bioethanol, is one of the environment friendly-
renewable energy sources, has been considered as an alternative to petroleum-based fuel.
Bioethanol has already been produced from corn and sugar cane commercially (Balat &
Balat, 2009). However alternative sustainable feedstocks are in demand to meet with the
increasing energy requirement of the globe, while keeping the production cost low. In
order to decrease the production cost, inexpensive carbon sources should be utilized by
bioethanol industry. Agro-industrial wastes, in that regard, have gained attention for
bioethanol production not only to manage the waste issues of industry economically and
environmentally, but also its abundance, availability, biodegradability, and also rich
nutrient content (Gassara et al., 2010). In this context, waste and by-products of potato
industry have potential for fermentation due to their high starch content and availability.
Potato processing industry usually yields up to 50% of the incoming potatoes as
waste(Charmley et al., 2006). The percentage, however, varies from one potato
processing plant to another, as well as the type of the waste. For example, potato
processing industry creates 10% waste potato pulp (Oda et al., 2002), 5-20% cull
potatoes (Liimatainen et al., 2004), and 15-40% peel (Arapoglou et al., 2010). Moreover,
in the potato chips industry, 18% of the potatoes goes into waste (Fadel, 2000). There
have been several studies demonstrated the potential of industrial potato waste (including
potato peels, potato mash, potato pulp, and potato processing wastewater) for the
production of bioethanol, glucoamylase, lactic acid, and pullulan (Arapoglou et al., 2010;
Barnett et al., 1999; Fadel, 2000; Huang et al., 2005; Izmirlioglu & Demirci, 2012).
Bioethanol production process from starchy feedstocks involves three stages: (i) liquefaction
of starch with alpha-amylase, (ii) enzymatic saccharification of liquefied slurry, and (iii)
fermentation of glucose. Because of the high temperature requirements of enzymatic
hydrolysis, energy demand of the enzymatic liquefaction and saccharification has been
reported about 30-40% of the total consumed energy during bioethanol fermentation (W. S.
Lee, Chen, Chang, & Yang, 2012). The process of simultaneous saccharification and

117
fermentation (SSF) of starch is an alternative way of producing ethanol directly from starchy
feedstocks in which high energy costs need to be eliminated. Even though SSF can be
conducted with either commercial enzymes or ethanol producer microorganisms, commercial
enzymes still keep the cost high. Co-culturing, on the other hand, has been shown potential to
make SFF cost-competitive for bioethanol production. Co-culturing is defined as “anaerobic
or aerobic incubation of specified microbial strains under aseptic conditions” according to
Bader et al. (2010). However, the challenge of co-culturing is optimization of the process due
to the different nutrient and culture requirements of the strains (B.Y. Jeon et al., 2007). In
previous studies, Aspergillus and Saccharomyces strains have been studied for co-culturing
and optimization of culture conditions have been studied for bioethanol production
(Abouzied & Reddy, 1986; Farid et al., 2002; Fujii, Oki, Sakurai, Suye, & Sakakibara, 2001;
B.Y. Jeon et al., 2007; Bo Young Jeon, Kim, Na, Ahn, & Park, 2008). Abouzied and Reddy
(1986) studied ethanol fermentation from potato starch by co-cultures of A. niger and S.
cerevisiae. After comparing mono-culture vs co-culture; pH, aeration, and effect of starch
and yeast concentrations were investigated. Maximum ethanol yield (4.8 g/100 ml) was
achieved when 10% starch fermented with the inoculation of 12 g of dry yeast cells. Another
study is conducted to investigate the effect of agitation on ethanol fermentation by suspended
and immobilized S. cerevisiae co-cultured with suspended cells of A. awamori (Farid et al.,
2002). Immobilized yeast and free cells of A. awamori yielded 3.7% (v/v) ethanol from12%
(w/v) corn starch at 200 rpm after 72 h of fermentation. Suresh et al. (1999), on the other
hand, compared sorghum and rice grains for SSF ethanol production by A. niger and S.
cerevisiae and reported that 2.9% (v/v) ethanol was produced from 10% sorghum utilized as
substrate after 5 days of fermentation. However, in all of these studies, nutrient requirements
of co-culture and medium optimization have been ignored. It is well-documented that
Aspergillus strains are capable of producing different forms of amylolytic enzymes and
highly influenced by media composition and growth conditions (Amirul et al., 1996;
Norouzian et al., 2006; A. Pandey, 1995). It was indicated that A. niger is capable of
secreting α-glucosidase, α-amylase and two forms of glucoamylase on raw tapioca starch
medium (Amirul et al., 1996). But not only carbon source is influencing the enzyme
secretion, also nitrogen source has an effect on the enzyme production. It is reported by Swift

118
et al. (2000) that glucoamylase secretion dropped drastically when medium supplemented
with some organic nitrogen sources ; լ-alanine, լ-methionine and casamino acids.
Saccharomyces, also, has its own nutrient requirements for an efficient ethanol production.
Therefore, there is an urgent need to evaluate the media to support co-cultures during SSF for
ethanol production from starchy feedstocks. In order to do that, there is a need for statistical
designs.
Response surface methodology (RSM) is a useful statistical design for investigating
optimum conditions of a multivariable processes. RSM is more beneficial than one-variable-
at-a –time method since interactions among the variables are considered with less number of
experiments in a shorter time (Cheng et al., 2010b; Kunamneni & Singh, 2005; Reddy, Wee,
Yun, & Ryu, 2008). The Central composite design (Box & Wilson, 1951) of response surface
methodology is best suited for optimizing multifactor with a smaller set of experiments. The
optimization is performed in three phases; implementation of statistically designed
experiments, analysis of variance and estimation of coefficients, and finally determination of
optimal conditions followed by a validation. Statistical designs, in particularly central
composite design, have found numerous applications in bioprocess engineering (Guo et al.,
2010; Kim, Oh, Shin, Eom, & Kim, 2008; Yan et al., 2011).
Even though, optimization of growth conditions and reactor designs for co-culture systems
have been studied, the nutrient requirements and medium optimization for co-culture
fermentations are neglected. Therefore, in this study, a medium composition in which
industrial waste potato mash utilized as sole carbon source for SSF ethanol production by co-
cultures of Aspergillus niger and Saccharomyces cerevisiae was investigated by using
statistical methods, central composite design in particular.

119
5.3 Materials and Methods
5.3.1 Microorganisms and inoculum preparation
Saccharomyces cerevisiae (ATCC 24859) was obtained from the American Type Culture
Collection (Manassas, VA, USA). To prepare inoculum, S. cerevisiae was grown in
medium composed of 20 g/L of glucose, 6 g/L of yeast extract (Difco, Sparks, MD,
USA), 0.3 g/L of CaCl2·2H2O, 4 g/L of (NH4)2SO2, 1 g/L of MgSO4·7H2O, and 1.5 g/L
of KH2PO4 at 30°C for 24 h and 3% of 24 h grown culture was used for inoculation
(Izmirlioglu & Demirci, 2012). Viability of the culture was maintained by storing at 4°C
and sub-culturing were performed biweekly, whereas stock cultures were kept in 20%
glycerol at −80°C.
Aspergillus niger van Tieghem (NRRL 330) was obtained from the United States
Department of Agriculture’s (USDA) Agricultural Research Service (Peoria, IL). Fungus
was grown on Petri plates containing malt extract agar (20 g/L of malt extract, 20 g/L of
glucose, 1 g/L of peptone, and 20 g/L of agar) at 30 °C for 120 h. A. niger spore
suspension was prepared as follows: Fungi were grown on malt extract agar plates for 5
days at 30 °C. At the end of the incubation, A. niger spores were suspended by using 2 ml
of 0.1% sterile peptone water per plates. Then, 1 ml of spore suspension, which had 106
CFU/ml was used to inoculate the flasks containing 100 ml of medium. In order to
maintain viability, the cultures were stored at 4°C and sub-cultured every three weeks.
Stock spore cultures were grown as described above, however washed off with 20%
glycerol solution and kept in 20% glycerol at −80°C.
5.3.2 Industrial waste potato mash
Waste potato mash was provided by a local potato processing plant that manufactures
potato flakes for commercial use. The potatoes were of different varieties, including
Frito-Lay FL 1833, Snowden, and Russet Burbank potatoes. According to Food and
Agricultural Organization’s database, potato is composed of starch, protein, fibre, iron,
potassium, magnesium, phosphorus, calcium, and vitamin C (Mouillé & U. Ruth
Charrondière, Barbara Burlingame, 2008). The starch content of the waste potato mash

120
ranged from 17–24%. The waste potato mash was not pretreated and was stored at −20°C
until use.
5.3.3 Experimental design
5.3.3.1 Selection of medium composition
Effect of various medium ingredients on ethanol production by S. cerevisiae and
glucoamylase production by A. niger using industrial waste potato mash has been
previously studied by authors. In these studies, malt extract, FeSO4·7H2O, and
CaCl2.2H2O showed statistically significant effect on glucoamylase production from
waste potato mash by A. niger (Chapter 3). On the other hand, yeast extract, malt extract,
and MgSO4·7H2O showed positive effect on ethanol production by S. cerevisiae when
waste potato mash hydrolysate used as substrate (Chapter 4). Based on the findings of
mentioned studies, ingredients that showed positive effect on productions of enzyme and
ethanol (malt extract, yeast extract, MgSO47H2O, FeSO4 7H2O, and CaCl2 2H2O were
selected for further investigation to determine the best possible medium composition for
co-cultures of A. niger and S. cerevisiae. Three medium compositions were investigated
for SSF ethanol production by co-culture. Medium A consisted of waste potato mash [50
g/L (dry basis (d.b.))], malt extract [20 g/L], yeast extract [0.5 g/L], MgSO47H2O [2
g/L], FeSO4 7H2O [0.1 g/L], and CaCl2 2H2O [3 g/L]. Medium A is a combination of
the ingredients that influenced the enzyme and ethanol productions positively. Medium B
comprised waste potato mash [50 g/L (d.b.)], malt extract [20 g/L], and FeSO47H2O [0.1
g/L]. In this second medium, yeast extract, MgSO47H2O, and CaCl2 2H2O were
excluded due to the fact that yeast extract and CaCl2 2H2O showed negative effects on
enzyme activity and ethanol productions, respectively. Finally, medium C consisted of
waste potato mash [50 g/L (d.b.)], malt extract [20 g/L], FeSO4 7H2O [0.1 g/L], and
CaCl2 2H2O [3 g/L]. Even though, the negative effect of CaCl22H2O on ethanol
production is known, and added for that reason. Sterilized medium was inoculated with
3% S. cerevisiae inoculum an1% A. niger spore suspension (Izmirlioglu & Demirci,
2012).

121
Co-culture fermentation was carried out in 250 ml flasks (with a 100 ml working volume)
at 30°C, 150 rpm for 120 h in a shaker incubator (Barnstead International, Dubuque,
Iowa). Each experiment was replicated in triplicate.
5.3.3.2 Statistical medium optimization
After the comparison of three medium compositions, Medium B consisted of waste
potato mash, malt extract, and FeSO4 7H2O, were further optimized using central
composite Response Surface Methodology (RSM). The levels of these factors are given
in Table 5.2. The independent variables were coded as X1 (waste potato mash), X2 (malt
extract), and X3 (FeSO4 7H2O) and the second-order model used to predict the response
to the independent variables (Eqn 5.1).
y = β0 + β1X1 + β2X2 + β3X3 + β11X12 + β22X2
2 + β33X22 + β12X1X2 +
β13X1X3 + β23X2X3 .....………………………………………………………… Eqn 5.1
where y is the response (ethanol), β0, βi, and βii are the regression coefficients.
Twenty different medium composition obtained from the design (Table 5.2).
Fermentation runs were carried out as described in Section 5.2.3.1. All runs were
repeated in triplicate.
5.3.4 Analysis
5.3.4.1 Ethanol and glucose
Samples were analyzed for glucose and ethanol using the YSI Biochemistry Analyzer
(Model 2700, Yellow Springs, OH). 1 mL of each sample was diluted twentyfold (when
needed) in order to keep the concentration of glucose or ethanol in the ranges provided by
manufacturer. The sample was then analyzed using the YSI Biochemistry Analyzer.

122
5.3.4.2 Enzyme activity
Extracellular glucoamylase activity in the culture broth was determined by measuring the
glucose released from the starch as described by Lemmel at al. (1980) with slight
modification. Samples were collected and centrifuged at 4°C for 20 min at 5,200 x g in
order to remove cells, and the supernatant was used for glucoamylase activity analysis.
Culture supernatant (0.5 ml) was added to 0.5 ml of 1.0% potato starch dissolved in a
0.01 M acetate buffer at pH 4.8. Tubes were incubated in a 30°C water bath for 30 min
and then kept in boiling water for 15 min to halt the enzyme activity. After cooling down,
the released glucose was determined using the YSI Glucose Analyzer. One unit of
glucoamylase activity is defined as the amount of enzyme that releases 1 µmol of glucose
(0.18 mg) from starch in 30 min at 30°C.
5.3.4.3 Dry weight analysis
Dry weight of industrial potato waste was determined. Samples were weighed and drying
process was carried out at 105°C in an oven for 48 h until constant weight achieved
(Izmirlioglu & Demirci, 2012).
5.34.4 Statistical analysis
Ethanol production was chosen as responses to analyze the fermentations. The
comparison of the medium compositions was performed using ANOVA and the Tukey
test in which Minitab Software (Version 16.1, State College, PA) was employed. The
ANOVA and regression analysis were conducted to determine the coefficients of the
predictive model and significant terms (Minitab Statistical Software) for central
composite design results. The Response Optimizer tool in Minitab was used to determine
the optimum conditions. The identified optimum conditions were validated
experimentally.
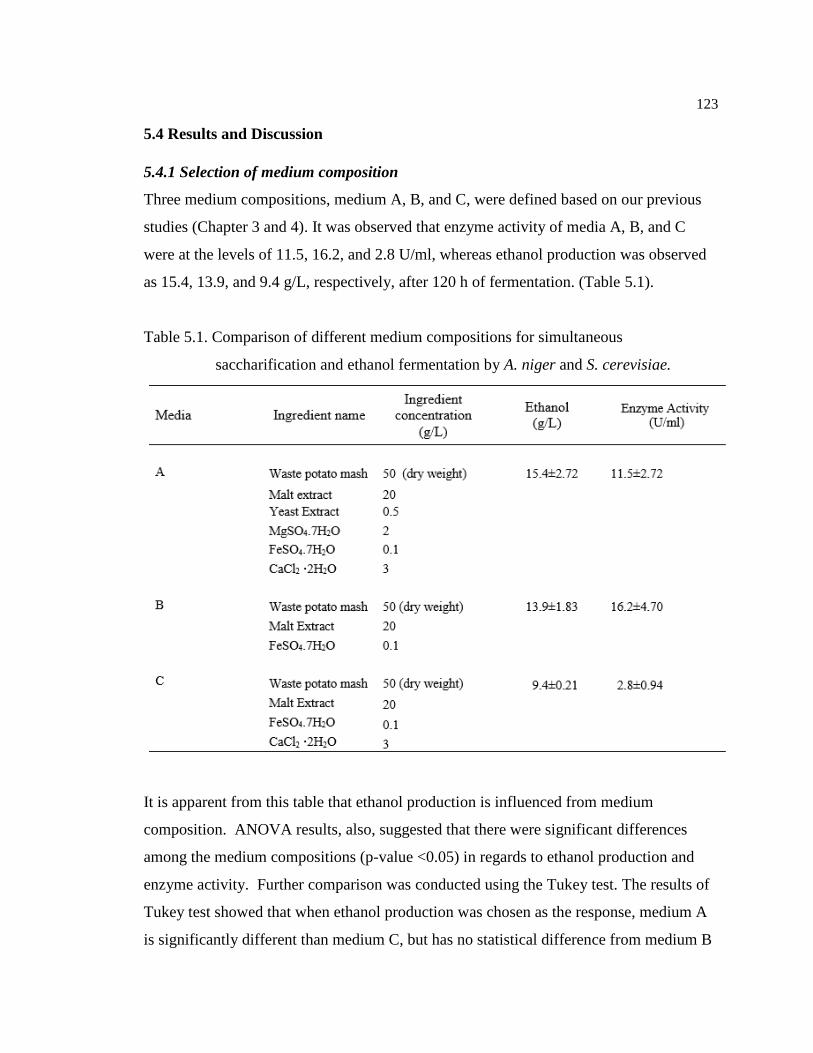
123
5.4 Results and Discussion
5.4.1 Selection of medium composition
Three medium compositions, medium A, B, and C, were defined based on our previous
studies (Chapter 3 and 4). It was observed that enzyme activity of media A, B, and C
were at the levels of 11.5, 16.2, and 2.8 U/ml, whereas ethanol production was observed
as 15.4, 13.9, and 9.4 g/L, respectively, after 120 h of fermentation. (Table 5.1).
Table 5.1. Comparison of different medium compositions for simultaneous
saccharification and ethanol fermentation by A. niger and S. cerevisiae.
It is apparent from this table that ethanol production is influenced from medium
composition. ANOVA results, also, suggested that there were significant differences
among the medium compositions (p-value <0.05) in regards to ethanol production and
enzyme activity. Further comparison was conducted using the Tukey test. The results of
Tukey test showed that when ethanol production was chosen as the response, medium A
is significantly different than medium C, but has no statistical difference from medium B

124
(Figure 5.1). As it is also true for medium C, the difference between medium C and B is
not significant in terms of ethanol production. On the other hand, in terms of enzyme
activity, medium A and B showed no statistically significant difference, while medium C
is lower than both media A and B. Although, yeast extract and MgSO47H2O have
positive impacts on ethanol production in case of single culture fermentations (Chapter
4), for co-culture their presence did not promote ethanol production significantly. This
might be due to negative effect of yeast extract on enzyme production by A. niger
(Chapter 3). The reason of the lowest ethanol production in medium C, on the other hand,
is probably due to presence of CaCl2 2H2O. CaCl2 2H2O showed negative effect for
ethanol production by S. cerevisiae (Chapter 4) and its presence in medium C might
cause low production of ethanol. Therefore, medium B comprised of waste potato mash
[50 g/L (d.b.)], malt extract [20g/L], and FeSO47H2O [0.1 g/L] was selected for the
further optimization.
Figure 5.1 Tukey comparison test results for medium selection when ethanol is the
response.
5.4.2 Optimization of the selected medium using response surface methodology
In order to achieve the optimum production of ethanol, medium B (waste potato mash,
malt extract, and FeSO47H2O, and) was further studied, each at five levels according to
the study’s central composite design.

125
Table 5.2. Central composite design and the experimental results for simultaneous
saccharification and ethanol fermentation by A. niger and S. cerevisiae.
Table 5.2 represents the design matrix of the variables together with the experimental
results of ethanol production and enzyme activity. The ethanol yield ranged from 6.4 to
19.4 g/L while the lowest and the highest enzyme activity levels observed as 4.1 and 55.9
U/ml, respectively, indicating the strong effect of medium composition in SSF using co-
Experimental Results Predicted Results
Run
Order
WPM*
(g/L)
Malt
Extract
(g/L)
FeSO4.7H2O
(g/L)
Ethanol
(g/L)
Enzyme Activity
(U/mL)
Ethanol
(g/L)
Enzyme
Activity
(U/mL)
1 50.00 60.00 0.50 14.2±1.12 5.6±2.34 14.7 3.2
2 32.96 50.00 1.00 13.3±0.34 24.9±1.67 12.4 21.4
3 100.00 60.00 1.50 6.8±0.98 36.7±3.49 6.9 23.7
4 100.00 40.00 1.50 7.4±1.23 25.0±3.98 7.3 21.4
5 75.00 50.00 1.84 6.4±2.34 37.7±3.42 6.3 42.4
6 117.05 50.00 1.00 10.0±1.34 6.8±1.23 10.4 18.6
7 75.00 50.00 1.00 14.4±3.19 34.4±10.48 13.8 36.5
8 75.00 50.00 1.00 17.8±3.20 42.7±10.48 13.8 36.5
9 75.00 33.18 1.00 9.6±0.67 30.7±3.03 10.9 32.5
10 75.00 50.00 1.00 16.0±3.19 26.0±10.48 13.8 36.5
11 75.00 50.00 1.00 11.6±3.19 55.9±10.48 13.8 36.5
12 50.00 40.00 1.50 11.4±2.12 38.1±4.09 10.7 39.4
13 50.00 40.00 0.50 11.2±1.13 22.9±1.79 11.1 25.3
14 100.00 60.00 0.50 19.4±2.34 17.1±1.04 22.8 9.5
15 75.00 66.82 1.00 15.2±1.20 4.1±2.34 12.4 10.2
16 75.00 50.00 1.00 17.3±3.19 31.9±10.48 13.8 36.5
17 100.00 40.00 0.50 13.5±1.23 43.7±3.45 11.5 31.3
18 75.00 50.00 0.16 13.5±1.65 9.0±2.30 14.0 15.7
19 50.00 60.00 1.50 7.3±3.23 32.9±7.45 8.1 33.7
20 75.00 50.00 1.00 9.8±3.19 34.0±10.48 13.8 36.5

126
culture. The lowest ethanol concentrations (6.4, 6.8, and 7.3 g/L) were observed when
FeSO47H2O levels are at the high end of the range (>1.5 g/L). The highest ethanol
yields (19.4, 17.8, and 17.3 g/L) were obtained with lower FeSO47H2O levels (0.5 -1
g/L).
The regression model was determined by Minitab, and the model equation for ethanol
production fitted by regression analysis used are as follows,
𝐸𝑡ℎ𝑎𝑛𝑜𝑙 (𝑔
𝐿) = −30.7 + 0.184𝑥1 + 0.891𝑋2 + 33.0𝑥3 − 0.00153𝑥1
2 −
0.00688𝑥22 − 6.14𝑥3
2 + 0.00319𝑥1𝑥2 − 0.1209𝑥1𝑥3 − 0.342𝑥2𝑥3 …......……..Eqn. 5.2
where x1 is waste potato mash (g/L), x2 malt extract (g/L), and x3 is FeSO47H2O (g/L).
The results of the second-order response surface model were analyzed using ANOVA.
The results of ANOVA for ethanol production indicated that model is reliable with a
76.17 % R- square, and 0.030 p- value with significant linear and quadratic effects.
Linear coefficients of malt extract was highly significant (p-value =0.000). It was
determined that the variables with the largest effects on ethanol production were linear
term of FeSO47H2O, the quadratic term of FeSO47H2O and to a lesser extent to the
interaction of malt extract and FeSO47H2O. In terms of enzyme activity, the variables
did not show a significant effect (p-value > 0.05). The importance of FeSO47H2O on the
production of ethanol in co-culture of A. niger and S. cerevisiae was thus confirmed.
Because FeSO47H2O and malt extract promotes the enzyme production and yields higher
glucose concentrations (Chapter 3), higher ethanol yields were achieved in presence of
those ingredients. El-Gendy (2012) has reported that malt extract is the nitrogen source
best able to significantly increase glucoamylase production in Aspergillus spp. Moreover,
FeSO47H2O were shown to have positive effects on glucoamylase. Arnthong et al.
(2010) also demonstrated an increase in production of glucoamylase in the presence of
FeSO47H2O.

127
3-D response surfaces and contour plots are representations of the regression model
equation for ethanol production. They demonstrate the interaction effects of two
parameters when the third one is kept constant at a center point.
Figure 5.2 Response surface plots showing the interactions of waste potato mash
(WPM), malt extract and FeSO47H2O concentrations and their effect on the
bio-ethanol production.

128
Figure 5.2 provides the interaction effects of parameters on ethanol production. As can be
seen from Figure 5.2, waste potato mash follow a non-linear pattern in which an increase
in waste potato mash did not show a dramatic change on ethanol yield until 100 g/L
levels. Ethanol production reached its highest production level (19.4 g/L) when around
100 g/L waste potato mash used, but decreased dramatically to 10.0 g/L, when waste
potato mash amount increased any further. On the other hand, malt extract showed a
linear relationship with ethanol production until its concentration of 60 g/L. Further
increase of malt extract levels did not improve the ethanol production.
FeSO47H2O promoted ethanol yield at lower concentrations, increased concentration of
this salt caused a decrease in ethanol yields (Figure 5.2). Contour plots of the model,
Figure 5.3, also demostrating the effects of the waste potato mash, malt extract and
FeSO47H2O clearly. From the figure, it can be seen that an increase in malt extract
results in a higher ethanol yield. High levels of FeSO47H2O (>1.0 g/L) did not promote
the ethanol production, however, reduced.
Figure 5.3 Contour plots showing the effect of waste potato mash, malt extract and
FeSO47H2O on the bio-ethanol production.

129
Under these results, according to the optimizer function, the optimal medium
composition was suggested as 92.37 g/L (d.b.) for waste potato mash, 59.42 g/L for malt
extract, and 0.159 g/L for FeSO47H2O. To validate the proposed optimum medium,
validation fermentation runs were carried out by employing the suggested optimized
medium composition. Figure 5.4 illustrates the experimental time course of optimal
medium composition for simultaneous saccharification and fermentation of ethanol by
co-culture of A. niger and S. cerevisiae. Ethanol production and enzyme activity were
found to be 35.19 g/L and 31.36 U/ml, respectively, with the production rates of 0.27
g/L/h and 0.54 U/ml/h (Table 5.3).
Table 5.3. Kinetic parameters of the optimum fermentation.
Kinetic Parameters Ethanol Enzyme Activity
Production 35.19 (g/L) 31.36 (U/ml)
Production Rate 0.27 (g/l/h) 0.54 (U/ml/h)
Yield (product/subs) 0.38 g ethanol/ g starch 0.34 U / g starch
Figure 5.4 Product formation curve for simultaneous saccharification and ethanol
fermentation from industrial waste potato mash using the statistically
optimized medium.
0
5
10
15
20
25
30
35
40
0
5
10
15
20
25
30
35
40
0 20 40 60 80 100 120 140
Enzy
me
Act
ivit
y (U
/ml)
Glu
cose
an
d E
than
ol (
g/L)
Time (h)
Glucose (g/L) Ethanol (g/L) Enzyme Activity (U/mL)

130
Abouzied and Reddy (1986) studied direct fermentation of raw potato starch from potato
chip manufacturing plant with co-cultures of A. niger and S. cerevisiae, and reported that
96% of theoretical ethanol yield (about 4.8 g/ 100 ml) was achieved after 4 days of
fermentation when 10% substrate was inoculated with 6% S. cerevisiae. Furthermore, it
was reported by a previous study of Suresh et al.(1999) that 22.4 g/L ethanol produced
when A. niger and S. cerevisiae co-cultured for simultaneous saccharification and
fermentation of damaged sorghum (10% substrate). Similarly, Farid et al.( 2002)
observed a maximum of 3.7% (v/v) ethanol from 12% (w/v) corn starch at 200 rpm using
immobilized S. cerevisiae and suspended A. awamori. In this study, 35.19 g/L ethanol
from 92.37 g/L of industrial waste potato mash was produced, which corresponds 0.38 g
ethanol / g starch. Results showed the potential of industrial waste potato mash as a
substrate for ethanol fermentation. This study demonstrated the importance of nutritional
requirements of co-cultures during SSF and the possibility of improving the fermentation
yields by optimizing the medium for co-cultures.
5.5 Conclusions
This study presented medium composition comparisons and use of response surface
methodology, central composite design in particular, to determine the ethanol production
from industrial waste potato mash for co-culture of A. niger and S. cerevisiae. A medium
compromised of waste potato mash, malt extract, and FeSO47H2O was found to be the
inexpensive medium with high production of ethanol by co-culture of A.niger and S.
cerevisiae. Optimal medium composition was determined as 92.37 g/L industrial waste
potato mash, 59.42 g/L malt extract, and 0.159 g/L FeSO47H2O and resulted in 35.19
g/L ethanol concentration at 30°C and 120 h of fermentation. To the best of authors’
knowledge, this is the only study that investigates the medium optimization for a co-
cculture SSF process and findings of this study imply that medium optimzation is an
important step to enhace SSF process in employment of co-culture.
131
5.6 References
Abouzied, M. M., & Reddy, C. a. (1986). Direct fermentation of potato starch to ethanol
by co-cultures of Aspergillus niger and Saccharomyces cerevisiae. Applied and
Environmental Microbiology, 52(5), 1055–1059.
Amirul, A. A., Khoo, S. L., Nazalan, M. N., Razip, M. S., & Azizan, M. N. (1996).
Purification and properties of two forms of glucoamylase from Aspergillus niger.
Folia Microbiologica, 41(2), 165–174. http://doi.org/9138312
Arapoglou, D., Varzakas, T., Vlyssides, a., & Israilides, C. (2010). Ethanol production
from potato peel waste (PPW). Waste Management, 30(10), 1898–1902.
http://doi.org/10.1016/j.wasman.2010.04.017
Arnthong, J., Wanitchaploy, B., Sakai, K., Sanglier, J., & Kitpreechavanich, V. (2010).
Statistical screening of factors affecting glucoamylase production by a
thermotolerant Rhizopus microsporus TISTR 3518 using Plackett-Burman design.
African Journal of Biotechnology, 9(43), 7312–7316.
http://doi.org/10.5897/AJB10.049
Bader, J., Mast-Gerlach, E., Popović, M. K., Bajpai, R., & Stahl, U. (2010). Relevance of
microbial co-culture fermentations in biotechnology. Journal of Applied
Microbiology, 109(2), 371–387. http://doi.org/10.1111/j.1365-2672.2009.04659.x
Balat, M., & Balat, H. (2009). Recent trends in global production and utilization of bio-
ethanol fuel. Applied Energy, 86(11), 2273–2282.
http://doi.org/10.1016/j.apenergy.2009.03.015
Barnett, C., Smith, A., Scanlon, B., & Israilides, C. J. (1999). Pullulan production by
Aureobasidium pullulans growing on hydrolysed potato starch waste. Carbohydrate
Polymers, 38, 203–209. http://doi.org/10.1016/S0144-8617(98)00092-7
Box, G. E. P., & Wilson, K. B. (1951). On the experimental attainment of optimum
conditions. JOURNAL OF THE ROYAL STATISTICAL SOCIETY SERIES B, 13, 1–
45.
Charmley, E., Nelson, D., & Zvomuya, F. (2006). Nutrient cycling in the vegetable
processing industry: Utilization of potato by-products. Canadian Journal of Soil
Science, 86(4), 621–629. http://doi.org/10.4141/S05-118
Cheng, K.-C., Demirci, A., & Catchmark, J. M. (2010). Enhanced pullulan production in
a biofilm reactor by using response surface methodology. Journal of Industrial
Microbiology & Biotechnology, 37, 587–594. http://doi.org/10.1007/s10295-010-
0705-x
El-Gendy, M. M. A. (2012). Production of Glucoamylase by Marine Endophytic
Aspergillus sp. JAN-25 under Optimized Solid-state Fermentation Conditions on
Agro Residues. Australian Journal of Basic & Applied Sciences, 6(4), 41. Retrieved
from http://connection.ebscohost.com/c/articles/88895194/production-glucoamylase-
by-marine-endophytic-aspergillus-sp-jan-25-under-optimized-solid-state-

132
fermentation-conditions-agro-residues
Fadel, M. (2000). Alcohol Production From Potato Industry Starchy Waste. Egyptian
Journal of Microbiology, 35(3), 273–287.
Farid, M. a., El-Enshasy, H. a., & Noor El-Deen, a. M. (2002). Alcohol production from
starch by mixed cultures of Aspergillus awamori and immobilized Saccharomyces
cerevisiae at different agitation speeds. Journal of Basic Microbiology, 42(3), 162–
171. http://doi.org/10.1002/1521-4028(200206)42:3<162::AID-
JOBM162>3.0.CO;2-C
Fujii, N., Oki, T., Sakurai, a, Suye, S., & Sakakibara, M. (2001). Ethanol production
from starch by immobilized Aspergillus awamori and Saccharomyces pastorianus
using cellulose carriers. Journal of Industrial Microbiology & Biotechnology,
27(June), 52–57. http://doi.org/10.1038/sj.jim.7000162
Gassara, F., Brar, S. K., Tyagi, R. D., Verma, M., & Surampalli, R. Y. (2010). Screening
of agro-industrial wastes to produce ligninolytic enzymes by Phanerochaete
chrysosporium. Biochemical Engineering Journal, 49(3), 388–394.
http://doi.org/10.1016/j.bej.2010.01.015
Guo, Y., Xu, J., Zhang, Y., Xu, H., Yuan, Z., & Li, D. (2010). Medium optimization for
ethanol production with Clostridium autoethanogenum with carbon monoxide as
sole carbon source. Bioresource Technology, 101(22), 8784–8789.
http://doi.org/10.1016/j.biortech.2010.06.072
Huang, L. P., Jin, B., Lant, P., & Zhou, J. (2005). Simultaneous saccharification and
fermentation of potato starch wastewater to lactic acid by Rhizopus oryzae and
Rhizopus arrhizus. Biochemical Engineering Journal, 23, 265–276.
http://doi.org/10.1016/j.bej.2005.01.009
Izmirlioglu, G., & Demirci, A. (2012). Ethanol Production from waste potato mash by
using Saccharomyces cerevisiae. Applied Sciences, 2, 738–753.
http://doi.org/10.3390/app2040738
Jeon, B. Y., Kim, D. H., Na, B. K., Ahn, D. H., & Park, D. H. (2008). Production of
ethanol directly from potato starch by mixed culture of Saccharomyces cerevisiae
and Aspergillus niger using electrochemical bioreactor. Journal of Microbiology and
Biotechnology, 18(3), 545–551. http://doi.org/7178 [pii]
Jeon, B. Y., Kim, S. J., Kim, D. H., Na, B. K., Park, D. H., Tran, H. T., … Ahn, D. H.
(2007). Development of a serial bioreactor system for direct ethanol production
fromk starch using Aspergillus niger and Saccharomyces cerevisiae. Biotechnology
and Bioprocess Engineering, 12, 566–573.
Kim, J. K., Oh, B. R., Shin, H.-J., Eom, C.-Y., & Kim, S. W. (2008). Statistical
optimization of enzymatic saccharification and ethanol fermentation using food
waste. Process Biochemistry, 43, 1308–1312.
http://doi.org/10.1016/j.procbio.2008.07.007
Kunamneni, A., & Singh, S. (2005). Response surface optimization of enzymatic
hydrolysis of maize starch for higher glucose production. Biochemical Engineering

133
Journal, 27, 179–190. http://doi.org/10.1016/j.bej.2005.08.027
Lee, W. S., Chen, I. C., Chang, C. H., & Yang, S. S. (2012). Bioethanol production from
sweet potato by co-immobilization of saccharolytic molds and Saccharomyces
cerevisiae. Renewable Energy, 39(1), 216–222.
http://doi.org/10.1016/j.renene.2011.08.024
Lemmel, S. A., Heimsch, R. C., & Korus, R. A. (1980). Kinetics of growth and amylase
production of Saccharomycopsis fibuligera on potato processing wastewater.
Applied and Environmental Microbiology, 39(2), 387–393.
Liimatainen, H., Toiva, K., & Kaariainen, J. (2004). Bio-ethanol production from waste
potatoes. Energy Research, 21–24.
Mouillé, B., & U. Ruth Charrondière, Barbara Burlingame, N. L. (2008). Nutrient
composition of the potato.Interesting varieties from human nutrition perspective.
Retrieved January 14, 2016, from
http://www.fao.org/fileadmin/templates/food_composition/documents/upload/Poster
_potato_nutrient_comp.pdf
Norouzian, D., Akbarzadeh, A., Scharer, J. M., & Moo Young, M. (2006). Fungal
glucoamylases. Biotechnology Advances, 24, 80–85.
http://doi.org/10.1016/j.biotechadv.2005.06.003
Oda, Y., Saito, K., Yamauchi, H., & Mori, M. (2002). Lactic acid fermentation of potato
pulp by the fungus Rhizopus oryzae. Current Microbiology, 45, 1–4.
http://doi.org/10.1007/s00284-001-0048-y
Pandey, A. (1995). Glucoamylase Research: An Overview. Starch - Stärke, 47(1), 439–
445. http://doi.org/10.1002/star.19950471108
Reddy, L. V. a, Wee, Y. J., Yun, J. S., & Ryu, H. W. (2008). Optimization of alkaline
protease production by batch culture of Bacillus sp. RKY3 through Plackett-Burman
and response surface methodological approaches. Bioresource Technology, 99,
2242–2249. http://doi.org/10.1016/j.biortech.2007.05.006
Suresh, K., Kiran sree, N., & Venkateswer Rao, L. (1999). Utilization of damaged
sorghum and rice grains for ethanol production by simultaneous saccharification and
fermentation. Bioresource Technology, 68, 301–304. http://doi.org/10.1016/S0960-
8524(98)00135-7
Swift, R. J., Karandikar, A., Griffen, A. M., Punt, P. J., van den Hondel, C. a. M. J. J.,
Robson, G. D., … Wiebe, M. G. (2000). The effect of organic nitrogen sources on
recombinant glucoamylase production by Aspergillus niger in chemostat culture.
Fungal Genetics and Biology, 31(2), 125–133. http://doi.org/10.1006/fgbi.2000.1241
Yan, S., Li, J., Chen, X., Wu, J., Wang, P., Ye, J., & Yao, J. (2011). Enzymatical
hydrolysis of food waste and ethanol production from the hydrolysate. Renewable
Energy, 36(4), 1259–1265. http://doi.org/10.1016/j.renene.2010.08.020

134
CHAPTER 6
ETHANOL PRODUCTION IN BIOFILM REACTORS FROM POTATO WASTE
HYDROLYSATE AND OPTIMIZATION OF GROWTH PARAMETERS FOR
SACCHAROMYCES CEREVISIAE4
6.1 Abstract
Bioethanol production is of great interest to meet the renewable energy demand and
reduce the negative environmental impacts of petroleum fuel while providing energy
security for countries. In order to make ethanol production cost-competitive, inexpensive
and easily available feedstocks are needed as well as novel processing technologies with
higher productivities. In this study, biofilm reactors have been utilized as a novel
approach for production of bioethanol from potato waste hydrolysate by optimizing the
growth parameters for Saccharomyces cerevisiae in biofilm reactor. First of all, in order
to achieve a successful biofilm formation, plastic composite supports (PCS) evaluated
and the PCS composed of polypropylene, soybean hull, soybean flour, yeast extract, and
salts was selected for ethanol fermentation with S. cerevisiae. Then Box-Behnken design
of response surface method (RSM) was employed to optimize the growth parameters, pH,
temperature, and agitation. Optimum conditions for ethanol fermentation was found to be
pH 4.2, temperature 34 ºC, and 100 rpm resulting 37.05 g/L ethanol with a 2.31 g/L/h
productivity and 92.08% theoretical yield. The results indicated that biofilm reactors with
PCS can enhance the ethanol fermentation from industrial potato wastes.
4 A version of this chapter was published as: Izmirlioglu G., and A. Demirci. 2016. Ethanol production in
biofilm reactors from potato waste hydrolysate and optimization of growth parameters for Saccharomyces
cerevisiae. Fuel. 181, 643-651.

135
6.2 Introduction
The current global economy relies on fossil energy sources for instance oil, coal, and
natural gas. However, using these energy sources has caused high levels of pollution over
the years, and increased the levels of greenhouse gasses in the atmosphere (Demirbas,
2009; Sarkar, Ghosh, Bannerjee, & Aikat, 2012). Not only environmental concerns, but
also limited reserves of petroleum-based fuels have increased the need for alternative
reneweable energy sources to secure the energy demand in an environment friendly
manner. Bioethanol is one of these alternatives, and the production of fuel ethanol
reached 54 billion liters in 2014 in U.S. (RFA, 2015). For the first generation ethanol
production in the world, crops such as sugar cane, corn, and wheat have been used as the
main feedstocks. For example, The U.S. and Brazil, the two major ethanol producers in
the world, rely on corn and sugar cane, respectively, as the feedstock for their ethanol
production. In 2012, 60 billion liters of commercial ethanol was produced from corn,
while sugar cane-based ethanol reached 20 billion liters (D. P. Ho et al., 2014). However,
ethanol production from the first generation crops is of concern due to agricultural land
and water use (Hashem & Darwish, 2010; D. P. Ho et al., 2014). Lignocellulosic
biomass and algae are getting significant attention as the alternative feedstocks as
opposed to the first generation feedstocks. However, commercialization of these
feedstocks for large scale ethanol producion is not cost-effective, yet. Therefore, wastes
of agricultural industry can be considered as a cost-competitive alternative feedstock for
ethanol industry. Because of their abundance, availability, biodegradability, rich carbon
and nutrient content, agro-industrial wastes are of interest for ethanol production (Gassara
et al., 2010). Among these agricultural wastes, potato, in particular, show great potential
for value-added product fermentation because of its high starch content. According to
study of Charmley et al. (2006), 50% of the potatoes go to the waste in the potato
industry in general. However, this portion can vary from 5 to 50% depending on the
potato processing plant (Arapoglou et al., 2010; Fadel, 2000; Liimatainen et al., 2004;
Oda et al., 2002). Various wastes of potato industry such as potato pulp, potato
processing water, and peels, have been investigated for several value added product
fermentation over the years, including lactic acid, pullulan, and ethanol (Arapoglou et al.,

136
2010; Barnett et al., 1999; Fadel, 2000; Huang et al., 2005). Utilization of potato flour for
ethanol production have been reported by Rani et al. (2010). In their study, 56.8 g/L
ethanol was produced from liqufied potato flour (25% (w/v)) at 30 °C for 48 h by S.
cerevisiae. Potato peel waste was investigated for ethanol fermentation in a different
study, and 7.6 g/L ethanol production was reported from enzymatically hydrolyzed potato
peels (Arapoglou et al., 2010). In a recent study, in order to maximize the ethanol
production from industrial waste potato mash, medium optimization for suspended cell
ethanol fermentation with S. cerevisiae was investigated and 24.6 g/L ethanol production
was achieved in the optimized medium (40.4 g/L “dry basis” waste potato hydrolysate,
50 g/L malt extract, and 4.84 g/L MgSO4·7H2O) (Chapter 4). Together, these studies
clearly indicated that wastes of potato industry can be utilized for ethanol fermentation.
However, there is still need for further research to increase the ethanol production
efficiency while reducing the cost with integration of novel fermentation technologies.
Cell immobilization is one of the methods that has been used to increase the
productivities of ethanol fermentation due to the higher cell populations (Demirci et al.,
1997; Fujii et al., 2001; Ogbonna et al., 2001). Biofilm, a natural form of cell
immobilization, is defined as aggregation of microorganisms in which cells attach on
each other and/or to a surface. Biofilm forms naturally without any agents in presence of
a support (Cheng et al., 2010). Biofilm reactors have advantages over hollow-fiber or
cell-recycled reactors due to low capital costs and reduced membrane fouling (Ercan &
Demirci, 2013). Additionally, microorganisms in a biofilm show better resistance to
extreme environmental conditions such as pH and temperature, contaminants, hydraulic
shocks, antibiotics, and toxic substances. Support material play a crucial role for a
successful biofilm formation (Ercan & Demirci, 2015a). Solid supports of biofilm
reactors should be favorable to microorganism, inexpensive, commonly available and
resistant to mechanical force (Cheng et al., 2010a). Plastic composite supports (PCS) are
one of the solid supports made from polypropylene and agricultural products which were
developed at Iowa State University (Pometto et al., 1997). Polypropylene acts as a matrix
to integrate the mixture of agricultural products, which provide essential nutrients to

137
sustain cell growth. Thus, PCS provides an ideal physical structure for biofilm formation,
besides releasing nutrients for microorganisms. Moreover, nutrient composition can be
customized to meet the requirement of the target microorganism. Biofilm reactors
equipped with PCS have been investigated for different value added products in bench-
scale bioreactors. Pongtharangkul and Demirci (2006) studied PCSs for an enhanced
nisin production, and reported 3.8 fold increase in nisin production rate when using the
best complex medium in biofilm reactor with PCS. In another study, Demirci et al.
(1997) evaluated various PCS compositions for ethanol production by S. cerevisiae in
biofilm reactors in repeated batch and continuous fermentation and reported that 30 g/L
ethanol was produced by using glucose based medium in biofilm reactor. Cheng et al.
(2010b) studied pullulan production in biofilm reactor and reported that the pullulan
production reached 60.7 g/l of pullulan, which was 1.8 times higher than the control.
Therefore, this study is undertaken to evaluate the biofilm reactors as a novel approach
for the production of bioethanol from potato waste hydrolysate by optimizing the growth
parameters for Saccharomyces cerevisiae for the biofilm reactors
6.3 Materials And Methods
6.3.1 Microorganism and medium
Saccharomyces cerevisiae (ATCC 24859) was obtained from the American Type Culture
Collection (Manassas, VA, USA). The culture was grown in a medium containing 20 g/L
of glucose, 6 g/L of yeast extract, 0.3 g/L of CaCl2·2H2O, 4 g/L of (NH4)2SO2, 1 g/L of
MgSO4·7H2O, and 1.5 g/L of KH2PO4 at 30°C for 24 h (Izmirlioglu & Demirci, 2012).
The glucose concentration was increased to 50 g/L when the medium was used for
culture tube fermentation runs during PCS selection. The working culture was maintained
by storing at 4°C and sub-cultured biweekly, whereas stock cultures were kept in 20%
glycerol at −80°C. The fermentation medium included 40.4 g/L (dry basis “d.b.”) of
waste potato mash hydrolysate, 50 g/L of malt extract, and 4.84 g/L of MgSO4·7H2O
based on our previous study (Chapter 4).

138
6.3.2 Preparation of waste potato mash hydrolysate
Waste potato mash was provided by a local potato processing plant that manufactures
potato flakes for commercial uses. Different varieties of potatoes used were Frito-Lay FL
1833, Snowden, and Russet Burbank throughout the study. The starch content of the
waste potato mash ranged from 17–24%. The waste potato mash was not pre-treated and
stored at −20°C until used.
Liquefaction and saccharification were carried out with additions of α-amylase (EC
3.2.1.1) and amyloglucosidase (EC 3.2.1.3), respectively, to hydrolyze the starch. These
enzymes were kindly provided by Pennsylvania Grain Processing, LLC® (Clearfield,
PA). A two-step enzyme hydrolysis procedure was used as described by our previous
study (Izmirlioglu & Demirci, 2012). Briefly, a slurry was prepared with 40.4 g/L (d.b.)
of waste potato mash. Liquefaction was performed at 95 °C for 3 h in an autoclave after
addition of 590 U of alpha amylase per gram of dry potato mash to the slurry.
Saccharification, the second step, took place in a shaker incubator (SHKE5000-7,
Barnstead International, Dubuque, Iowa) after addition of amyloglucosidase (25 U/g dry
substrate). The saccharification was performed at 60°C, 150 rpm and 72 h.
6.3.3 Plastic composite support (PCS)
PCS tubes used in this study were manufactured at Iowa State University (Ames, IA). A
twin-screw corotating Brabender PL2000 extruder (model CTSE-V; C.W. Brabender
Instruments, Inc., South Hackensack, NJ) was used to make the PCS tubes (Pometto et
al., 1997). Table 6.1 shows the compositions of PCS tubes studied in this study. These
types were selected based on the previous studies in our lab and other published studies.
The common ingredients for all of the PCS tubes were polypropylene (PP) 50% (w/w),
soybean hulls (SH), soybean flour (SF), and salts (S) while yeast extract (YE), dried
bovine albumin (BA) and dried bovine red blood cell (RBC) were the ingredients only
some of the PCS tubes contained.

139
6.3.4 Culture tube fermentation for PCS selection
Four types of PCSs (Table 6.1) were evaluated for both ethanol production and biomass
formation in culture tube fermentation in triplicate. PCS tubes were cut into
approximately 3 mm rings, and 3 g of those PCS rings were used for each replicate. PCS
rings were sterilized dry in culture tubes for 1 h at 121°C. The sterilized medium (15 ml)
was added aseptically to the sterile PCS rings and incubated at 30°C for 24 h to hydrate
them. The soaking medium was replaced with fresh sterile medium under aseptic
conditions and fermentation was started with 1% (v/v) 24-h grown inoculum.
Table 6.1. The composition of plastic composite supports (PCS) used in this study.
Support Types
Ingredients of extrusion mixture ( % [w/w])
PPa SHb SFc YEd BAe RBf Salts
SH-SF-S 50 40 10
+
SH-SF-YE-S 50 40 5 5
+
SH-SF-YE-BA-S 50 35 5 5 5
+
SH-SF-YE-RBC-S 50 35 5 5
5 +
aPP: Polypropylene resins (Quantum USI Divisions, Cincinnati, OH)
bSH: Ground (20-mesh), vacuum dried (48 h at 110 ̊C ; 30 in of mercury) soybean hulls (Cargill Soy
Processing Plant, Iowa Falls, Iowa)
cSF: Defeated soybean flour (Archer Daniels midland, Decature, III.)
dYE: Yeast extract (Ardamine Z; Champlain Industries Inc.)
eBA: Dried bovine albumin (American Protein Crop., Ames, Iowa)
fRB: Dried bovine red blood cells (American Protein Crop., Ames, Iowa)
gSalts: Mineral salts; 2 g/kg of sodium acetate, 1.2 g/kg MgSO4.7H2O, and 0.06g/kg MnSO4.7H2O
Fermentation was carried out at 30°C for 24 h at 150 rpm in a shaker incubator. Five
repeated-batch fermentation runs were conducted by replacing the broth with fresh sterile
medium every 24 h to promote biofilm formation. Ethanol production was evaluated

140
under three consecutive repeated-batch fermentations following biofilm formation, while
the biomass was determined at the end of three consecutive repeated-batch fermentations.
The PCS type that was selected to conduct the biofilm reactor was chosen according to
the biomass production on the PCS (log CFU/ g PCS) and ethanol production (g/L) in the
fermentation broth.
6.3.5 Ethanol fermentation in biofilm reactors
The selected PCS type was used to construct the biofilm reactor as shown in Figure 6.1.
The PCSs were cut into 6.5 cm long tubes and 12 PCS tubes were bounded to the agitator
shaft in a grid-like fashion creating six rows of two parallel tubes. Sartorious Biostat B
Plus bioreactor (Allentown, PA) equipped with a 2 L vessel was used. After the PCS
installation, the reactor vessel was autoclaved with deionized (DI) water at 121°C for 60
min. Followed by the sterilization, water was drained and 1.5 L of pre-sterilized
fermentation medium (121°C for 30 min) was pumped in aseptically to the reactor vessel.
After inoculation of the medium with 3% (v/v) 24 h grown culture of S. cerevisiae
(Izmirlioglu & Demirci, 2012), five repeated batch fermentations were completed to
promote the biofilm formation on PCS. The fermentation runs for biofilm formation were
carried out at pH 5.5, 30°C, 150 rpm, with no aeration for 48 h (Izmirlioglu & Demirci,
2012). pH was controlled by addition of either 2N NaOH or 2N HCl. Once biofilm
formed, batch fermentations were subsequently performed under the conditions designed
by Box-Behnken design of surface response methodology to evaluate temperature (25-35
°C), pH (4-6), and agitation (100-300 rpm) (Table 6.2). Samples were taken every two
hour during the first 12 h of fermentation and every 6-8 h during the last 36 h of the
fermentation time. Each condition was replicated, and ethanol production was used as the
response. The identified optimum conditions were validated experimentally.
After all the fermentation runs were completed, the biofilm reactor was disassembled
aseptically. The biofilm formation on PCS tubes were visually evaluated by scanning
electron microscope (SEM).

141
Figure 6. 1 Diagram of the PCS biofilm reactor and actual image of PCS tubes on the
agitator shaft.
6.3.6 Analysis
6.3.6.1 Cell Population determination on PCS
The biofilm population on the PCS was determined by stripping sand method (Demirci et
al., 1997). The PCS rings in the culture test tubes were washed in 100 ml of sterile 0.1%
(w/v) peptone water by turning the tubes upside-down 10 times. Then, PCS rings were
aseptically transferred into a 50-ml test tube, which includes 5 g of sterile sand and 9 ml
of sterile peptone water and vortexed three times in 30-s intervals. A serial dilutions of
sand stripped samples were conducted in 0.1% sterile peptone water and, then, spirally
plated on potato dextrose agar (Difco, MD, USA). Spiral plating was done to enumerate
the cell population using a spiral auto-plater (Model 4000, Spiral Biotech, Norwood, MA,
USA) and Q-count software (Version 2.1; Spiral Biotech, Norwood, MA, USA). Plates
were incubated at 30°C for 24 h. Q-count software (Version 2.1; Spiral Biotech) was
used for enumeration. Results were indicated as log10 CFU/g PCS.

142
6.3.6.2 Ethanol and glucose
Samples of the culture tube fermentation for PCS selection were analyzed for glucose and
ethanol using the YSI Biochemistry Analyzer (Model 2700, Yellow Springs, OH). The
analysis was performed as follows: In order to bring the concentration levels of glucose
and ethanol to the equipment’s measurement range, samples were diluted up to twenty-
fold by using DI water when needed. Then, the samples were analyzed using the YSI
Biochemistry Analyzer.
However, samples of the fermentations in biofilm reactors were analyzed for ethanol and
glucose with a Waters' high pressure liquid chromatography (HPLC) equipped with a
refractive index detector (Waters, Milford, MA). Ethanol and glucose were separated
using Bio-Rad Aminex HPX-87H column (300 mm × 7.8 mm; Bio-Rad, Richmond, CA)
with 0.8 ml/min of 0.012 N sulfuric acid as mobile phase. The detector and column
temperatures were constant at 35 and 65 °C, respectively. Prior to HPLC analysis, the
separation of the cells and potato particles from the samples were performed by
centrifugation at 4 °C for 20 min at 5,200 x g). Then, supernatant was filtered with
0.2 μm nylon syringe filters (VWR, Radnor, PA).
6.3.6.3. Sugar Analysis
Sugar composition of optimization run samples was assessed using Dionex IC 3000 Ion
Exclusion Chromatography (ICE). Samples were filtered through a 0.2 μm nylon filters
after serially diluted 104 fold. Sugars separation was performed by high pH anion
exchange at 30 ºC using CarboPac PA20 guard (3 x 30 mm) and analytical (3 x 150 mm)
columns with 200 mM sodium hydroxide (NaOH) for 40 min at a flow rate of 0.5
ml/min, and dropped to 50 mM during the samole injection. Monosaccharides were
detected by pulsed amperometric [electrochemical] detection at gold working electrodes,
using quadruple waveform.

143
6.3.6.4. Scanning Electron Microscope (SEM)
Biofilm formation on the exterior and interior surfaces of the PCS tubes were visually
evaluated by using SEM. To maintain the biofilm structure, chemical fixation of cells
were carried out. Briefly, PCS tubes were covered with 2.5% gluteraldehyde in 0.1M
phosphate buffer (pH 7.2) with 0.02 % Triton X-100 and stored at 4 ºC for overnight.
After primary fixative discarded, samples were washed 3-5 times with phosphate buffer.
Then, samples were serially washed for 5 min with 25, 50, 70, 85, 95, and 100% ethanol.
Following dehydration, critical point drying were carried out (Dykstra, 1992; Hall &
Hawes, 1991). Finally, SEM micrographs of critical-point dried PCS tubes were taken
with Zeiss Sigma Variable Pressured Field Emission Electron Scanning Microscope (VP-
FESEM).
6.3.6.5 Statistical Analysis
Fermentations were analyzed using ethanol production and cell population as responses.
PCS types for PCS selection were compared using ANOVA and the Tukey’s comparison
test by Minitab Software (Version 16.1, State College, PA). For statistical analysis of
Box-Behnken design, the ANOVA and regression analysis were obtained to determine
the coefficients of the predictive model and significant terms (Minitab Statistical
Software). The Response Optimizer tool in Minitab was also used to determine the
optimum conditions.
6.4 Results and Discussion
6.4.1 PCS Selection
The selection of PCS type was performed in culture tube fermentation to evaluate four
different PCS types. The ethanol productions and biofilm formations on these PCS types
were illustrated in Figure 6.2. The ethanol production was ranged from 20.7 g/L to 21.68
g/L depending on the PCS type, and the highest ethanol production (21.68 g/L) was
observed in the culture tube that had the PCS composed of SH-SF-YE-RBC-S, followed
by SH-SF-YE-S (21.58 g/L ethanol).

144
Figure 6.2 Effects of different PCS compositions on the biomass and ethanol production
in test tubes (n =3) (Different letters represents the significant difference
between treatments (p˂0.05)).
The lowest ethanol production obtained from the PCS with SH-SF-YE-BA-S (20.7 g/L).
There were no statistically significant difference in the ethanol production among the
PCSs which were composed of SH-SF-S, SH-SF-YE-S, and SH-SF-YE-RBC-S (p-value
>0.05). However, the PCS consisted of SH-SF-YE-BA-S produced significantly lower
ethanol than PCSs, SH-SF-YE-S and SH-SF-YE-RBC-S (p-value<0.05). Yet, no
significant difference was found between SH-SF-YE-BA-S and SH-SF-S in ethanol
production. The cell population on PCS, on the other hand, was ranged from 6.70
log10CFU / g PCS to 6.93 log10CFU/ g PCS. None of these differences, however, were
statistically significant (p-value >0.05). Though biofilm formation was very similar for
all of the PCS types, and similar ethanol productions were observed from SH-SF-S, SH-
SF-YE-S, and SH-SF-YE-RBC-S, the PCS with a composition of SH-SF-YE-S was
selected to form the biofilm in the reactor. In order to reduce the cost of the ethanol
production in general, and PCS manufacturing in particular, the PCS with less ingredient
ab
a
a
a
b
a
a
a
0
5
10
15
20
25
Ethanol (g/L) Biomass (log CFU/g PCS)
SH-SF-Salts
SH-SF-YE-Salts
SH-SF-YE-BA-SALTS
SH-SF-YE-RBC-SALTS

145
while still providing the comparable ethanol production was targeted. Because the
positive effect of yeast extract on ethanol production is known (Chapter 4), the PCS that
had the yeast extract considered for the biofilm reactor.
Although no significant difference was observed among the PCS types in terms of the
biofilm population, ethanol production varied. This might be due the slow leaching of
nutrients form PCS into the fermentation broth according to the study of Ho et al. (1997).
Prior studies that have also noted the importance of PCSs not only to promote the biofilm
formation but also to provide nutrients during the fermentation ( Cheng et al., 2010b;
Demirci et al., 1997). Demirci et al. ( 1997) evaluated ethanol production by S. cerevisiae
in biofilm reactors using eleven compositionally different PCS types, and also suggested
the PCS that was consisted of SH-SF-YE-S.
6.4.2 Optimization of growth parameters by response surface method in
biofilm reactor
Three variables (pH (4-6), temperature (25-35°C), and agitation (100-300 rpm) were
evaluated to determine the optimum fermentation conditions for S. cerevisiae in biofilm
reactors with selected PCS (SH-SF-YE-S), while utilizing industrial waste potato mash as
a carbon source. Table 6.2 presents the Box-Behnken design matrix with experimental
and predicted values for ethanol production.
The ethanol production was highly influenced by fermentation conditions and as a result
of this, ethanol concentration ranged from 3.3 g/L to 38.7 g/L. Lower pH values revealed
higher ethanol productions. A notable example of this, 34.11 g/L ethanol production was
obtained at pH 4, 30°C and 100 rpm. In case of pH 6, while temperature and agitation
kept constant, ethanol production dropped down to 24.03 g/L. A similar pattern was
observed also with agitation, in which higher agitation rates decreased the ethanol
production. For example, 33.34 g/L ethanol production attained at pH 5, 35 °C, and 100
rpm agitation, while the ethanol production drastically decreased to 3.29 g/L, when
agitation increased to 300 rpm at the constant pH and temperature. In contrast, ethanol

146
production increased at higher temperature levels. For example, the ethanol productions
of 29.33 g/L and 33.34 g/L were observed at 25 and 35°C, respectively, while pH and
agitation were 5 and 100 rpm, respectively, for both temperatures.
Table 6.2. Effect of growth parameters on ethanol production in biofilm reactors with
PCS.
Experimental Predicted
pH
Temperature
( ̊C)
Agitation
(rpm)
Ethanol
(g/L)
Ethanol
(g/L)
4 30 300 25.9 21.2
6 30 300 27.4 25.4
5 25 100 29.3 26.0
5 30 200 28.3 23.2
4 25 200 38.7 40.1
5 30 200 24.2 23.2
4 35 200 24.5 25.8
6 30 100 24.0 28.7
5 25 300 28.0 31.3
4 30 100 34.1 36.1
5 35 300 3.3 6.6
5 30 200 17.0 23.2
6 35 200 29.6 28.2
5 35 100 33.3 30.1
6 25 200 35.7 34.4
Second order polynomial equation (Eqn 6.1) for ethanol production was obtained by the
application of multiple regression analysis on the experimentally determined values and
shown below:

147
𝐸𝑡ℎ𝑎𝑛𝑜𝑙 (𝑔
𝐿) = 312 − 85.3𝑋1 − 5.70𝑋2 + 0.319𝑋3 + 6.67𝑋1
2 + 0.92𝑋22 −
0.000198𝑋32 + 0.401𝑋1𝑋2 + 0.0291𝑋1𝑋3 − 0.01436𝑋2𝑋3……………………Eqn 6.1
where X1, X2 and X3 are pH, temperature (ºC) and agitation (rpm), respectively. A R2
value of 83.41 % showed the predictive capability of the model for the ethanol
production. The ANOVA results revealed that ethanol production was affected by
temperature, agitation, pH*pH, and temperature*pH (p-value <0.1). A graphical
representation of the effects of each factor as well as interactions among the factors were
represented in Figure 6.3, counter plots and Figure 6.4, response surface plot. As it can be
seen in Figures 6.3 and 6.4, ethanol production reaches its high levels (>35 g/L) at lower
levels of pH and agitation while higher temperatures result higher ethanol production
(>30 g/L).
Figure 6. 3 Contour plots showing the effect of pH, temperature and agitation on the bio-
ethanol production.

148
Figure 6.4. Response surface plots showing the interactions of pH, temperature and
agitation and their effect on the bio-ethanol production.

149
The optimum culture conditions to maximize the ethanol production were determined by
the response optimizer tool in Minitab software as pH 4.2, 34ºC, and 100 rpm. Under the
optimum conditions, 37.05 g/L ethanol production was achieved, with a 0.459 g ethanol/
g glucose, and thus 92.08% of theoretical yield was achieved (Table 6.3).
Table 6.3. Kinetic parameters of ethanol fermentation in biofilm reactors under
statistically optimized conditions.
Parameter Value
Ethanol Produced (g/L) 37.05±0.56
Glucose Consumed (g/L) 80.57±1.2
Production Rate (g/L/h) 2.31±0.89
Consumption Rate (g/L/h) -5.77±0.96
Yield (product/subs) 45.99%
Theoretical Yield
92.08%
The ethanol productivity was 2.31 g/L/h. Sugar composition analysis showed that the
potato waste hydrolysate had 33.4 g/L maltose to begin with (0 h samples), and the
amount of maltose dropped down to 7.0 g/L during the fermentation (48 h samples)
(Figure 6.5). Furthermore, the waste potato hydrolysate included small amounts of
arabinose (35 mg/L), xylose (97 mg/L), galactose (about 1 g/L) and fructose (0.9 g/L -2.5
g/L). The growth curve of ethanol production from industrial waste potato mash
hydrolysate by S. cerevisiae in biofilm reactor with SH-SF-YE-S under the determined
optimum conditions is presented in Figure 6.5. In the first 24 h of fermentation, all of the
glucose was consumed and ethanol concentration (37.05 g/L) was reached to its
maximum.
By using biofilm reactors, comparable ethanol yields were achieved in a shorter time. In a
study of Demirci et al. ( 1997), it was reported that maximum 30 g/L ethanol was

150
produced in biofilm reactor with PCS, SH-SF-YE-S. In another study in which carob pod
extract utilized for ethanol production in PCS biofilm reactors, 24.51 g/L ethanol
produced under the optimized conditions (7.71 ºBx initial sugar content, 120 rpm, and pH
5.18) giving 2.14 g/L/h ethanol productivity (Germec et al., 2015). The results of this
study, thus, indicates that ethanol production can be improved with application of PCS
biofilm reactors while utilizing the industrial waste potato mash.
Figure 6.5 Product formation curve for ethanol fermentation from industrial potato waste
hydrolysate under the statistically optimized conditions.
The current study found that ethanol production in biofilm reactors is improved at higher
temperature levels. In contrast to earlier findings of Liu and Shen (Liu & Shen, 2008) and
Germec et al. (Germec et al., 2015) who reported pH 5 and 5.18 were the optimum pH
for ethanol production by immobilized S. cerevisiae, current study suggested a lower pH
(pH 4.2) as optimum pH level for ethanol production under studied conditions. These
results further support the idea that biofilm formation increases the resistance of
microorganisms to extreme environmental conditions such as pH, temperature, toxic
0
10
20
30
40
50
60
70
80
90
0 5 10 15 20 25 30 35 40 45 50
Glu
cose
(g/
L), M
alto
se (
g/L)
& E
than
ol (
g/L)
Time (h)
Glucose (g/L) Ethanol (g/L) Maltose (g/L)

151
substances (Ercan & Demirci, 2015a). Being able to run the fermentation at a low pH
level as suggested by this study can also decrease the risk of contamination. Another
important finding was lower agitation rate was suggested for maximum ethanol
production by the model. A possible explanation for this might be that the addition of
PCS tubes to the agitator shaft improves mixing properties of the impeller and provides a
homogenous environment at a lower agitation speed.
6.4.3 SEM Evaluation
Biofilm formation on selected PCS was further captured with scanning electron
microscopy and micrographs are presented in Figure 6.6. Micrographs of PCS in which
no microbial growth are shown in Figure 6.6A and 6.6B as the control. Figure 6.6A and
6.6B are the exterior and interior surfaces of the PCS, respectively. As it can be seen
from the micrographs, PCS is highly porous, a highly demanded characteristic for biofilm
formation in order to eliminate the hydraulic shear force while increasing the surface area
of the support material (Cheng et al., 2010a). As a results of this, photographs of the PCS
tubes show the very dense formation of biofilm on the outer surface of the PCS,
especially within the pores. Biofilm formation on the exterior surface of the PCS tubes
can be seen in Figure 6.6C and 6.6E, while Figure 6.6D and 6.6F provides a closer look
to the yeast cells in the biofilm with higher magnification. Figure 6.6G is showing the
biofilm formation on the interior surface of the PCS tube, cross section, while Figure
6.6H is illustrating the yeast cells in the biofilm for the interior surface. As it was
captured by the SEM, yeast cells were able to form biofilm not only on the outer surface
of the PCS, but also on the inner surface, thus an increased surface area was provided for
biofilm formation by application of PCS tubes.

152
(A) (B)
(C) (D)
(E) (F)

153
(G) (H)
Figure 6.6 Scanning electron micrographs of S. cerevisiae on the exterior and interior
surfaces SH-SF-YE-S PCS tubes in fermentation medium. A: Exterior surface
of PCS tubes before cell growth (control). B: Interior surface of PCS tubes
before cell growth (control). C and E: S. cerevisiae biofilms on the exterior
surface of PCS tubes. D and F: Enlargement of cell clusters shown in square
in images C and E, respectively, showing the yeast cells. G: S. cerevisiae
biofilms on the interior surface of PCS tubes. H: Enlargement of cell clusters
shown in image H showing the yeast cells.
6.5 Conclusions
This study set out to determine the optimum culture conditions for ethanol production in
biofilm reactor by S. cerevisiae while using waste potato mash as a carbon source for
bioethanol fermentation. The PCS composed of polypropylene, soybean hulls, soybean
flour, yeast extract and salts (SH-SF-YE-S) was selected based on ethanol production and
biofilm formation. It was identified that pH 4.2, 34ºC, and 100 rpm was the optimum
conditions for S. cerevisiae for ethanol production in biofilm reactor in the waste potato
mash medium, yielding 37.05 g/L of ethanol with 92.08% theoretical yield and 2.31g/L/h
ethanol productivity. The results of this study suggested that ethanol production can be
improved with application of biofilm reactors with PCS while utilizing organic wastes of
agriculture and industry.

154
6.6 References
Arapoglou, D., Varzakas, T., Vlyssides, a., & Israilides, C. (2010). Ethanol production
from potato peel waste (PPW). Waste Management, 30(10), 1898–1902.
http://doi.org/10.1016/j.wasman.2010.04.017
Barnett, C., Smith, A., Scanlon, B., & Israilides, C. J. (1999). Pullulan production by
Aureobasidium pullulans growing on hydrolysed potato starch waste. Carbohydrate
Polymers, 38, 203–209. http://doi.org/10.1016/S0144-8617(98)00092-7
Charmley, E., Nelson, D., & Zvomuya, F. (2006). Nutrient cycling in the vegetable
processing industry: Utilization of potato by-products. Canadian Journal of Soil
Science, 86(4), 621–629. http://doi.org/10.4141/S05-118
Cheng, K.-C., Demirci, A., & Catchmark, J. M. (2010a). Advances in biofilm reactors for
production of value-added products. Applied Microbiology and Biotechnology, 87,
445–456. http://doi.org/10.1007/s00253-010-2622-3
Cheng, K.-C., Demirci, A., & Catchmark, J. M. (2010b). Enhanced pullulan production in
a biofilm reactor by using response surface methodology. Journal of Industrial
Microbiology & Biotechnology, 37, 587–594. http://doi.org/10.1007/s10295-010-
0705-x
Demirbas, A. (2009). Political, economic and environmental impacts of biofuels: A
review. Applied Energy, 86, S108–S117.
http://doi.org/10.1016/j.apenergy.2009.04.036
Demirci, A., Pometto, A. L. I., & Ho, K. L. G. (1997). Ethanol production by
Saccharomyces cerevisiae in biofilm reactors. Journal of Industrial Microbiology &
Biotechnology, 19, 299–304. http://doi.org/10.1038/sj.jim.2900464
Dykstra, M. J. (1992). Biological electron microscopy: theory, techniques, and
troubleshooting. New York: Plenum Press.
Ercan, D., & Demirci, A. (2013). Production of human lysozyme in biofilm reactor and
optimization of growth parameters of Kluyveromyces lactis K7. Applied
Microbiology and Biotechnology, 97(14), 6211–6221.
Ercan, D., & Demirci, A. (2015). Current and future trends for biofilm reactors for
fermentation processes. Critical Reviews in Biotechnology, 35, 1–14.
http://doi.org/10.3109/07388551.2013.793170
Fadel, M. (2000). Alcohol Production From Potato Industry Starchy Waste. Egyptian
Journal of Microbiology, 35(3), 273–287.
Fujii, N., Oki, T., Sakurai, a, Suye, S., & Sakakibara, M. (2001). Ethanol production
from starch by immobilized Aspergillus awamori and Saccharomyces pastorianus
using cellulose carriers. Journal of Industrial Microbiology & Biotechnology,
27(June), 52–57. http://doi.org/10.1038/sj.jim.7000162

155
Gassara, F., Brar, S. K., Tyagi, R. D., Verma, M., & Surampalli, R. Y. (2010). Screening
of agro-industrial wastes to produce ligninolytic enzymes by Phanerochaete
chrysosporium. Biochemical Engineering Journal, 49(3), 388–394.
http://doi.org/10.1016/j.bej.2010.01.015
Germec, M., Turhan, I., Karhan, M., & Demirci, A. (2015). Ethanol production via
repeated-batch fermentation from carob pod extract by using Saccharomyces
cerevisiae in biofilm reactor. Fuel, 161, 304–311.
http://doi.org/10.1016/j.fuel.2015.08.060
Hall, J. L., & Hawes, C. R. (1991). Electron microscopy of plant cells. San Diego:
Academic Press Inc.
Hashem, M., & Darwish, S. M. I. (2010). Production of bioethanol and associated by-
products from potato starch residue stream by Saccharomyces cerevisiae. Biomass
and Bioenergy, 34(7), 953–959. http://doi.org/10.1016/j.biombioe.2010.02.003
Ho, D. P., Ngo, H. H., & Guo, W. (2014). A mini review on renewable sources for
biofuel. Bioresource Technology, 169, 742–749.
http://doi.org/10.1016/j.biortech.2014.07.022
Ho, K. L., Pometto, A. L., Hinz, P. N., & Demirci, A. (1997). Nutrient leaching and end
product accumulation in plastic composite supports for L-(+)-lactic acid biofilm
fermentation. Applied and Environmental Microbiology, 63(7), 2524–2532.
Huang, L. P., Jin, B., Lant, P., & Zhou, J. (2005). Simultaneous saccharification and
fermentation of potato starch wastewater to lactic acid by Rhizopus oryzae and
Rhizopus arrhizus. Biochemical Engineering Journal, 23, 265–276.
http://doi.org/10.1016/j.bej.2005.01.009
Izmirlioglu, G., & Demirci, A. (2012). Ethanol production from waste potato mash by
using Saccharomyces cerevisiae. Applied Sciences, 2, 738–753.
http://doi.org/10.3390/app2040738
Liimatainen, H., Toiva, K., & Kaariainen, J. (2004). Bio-ethanol Production from Waste
Potatoes. Energy Research, 21–24.
Liu, R., & Shen, F. (2008). Impacts of main factors on bioethanol fermentation from stalk
juice of sweet sorghum by immobilized Saccharomyces cerevisiae (CICC 1308).
Bioresource Technology, 99(4), 847–854.
http://doi.org/10.1016/j.biortech.2007.01.009
Oda, Y., Saito, K., Yamauchi, H., & Mori, M. (2002). Lactic acid fermentation of potato
pulp by the fungus Rhizopus oryzae. Current Microbiology, 45, 1–4.
http://doi.org/10.1007/s00284-001-0048-y
Ogbonna, J. C., Mashima, H., & Tanaka, H. (2001). Scale up of fuel ethanol production
from sugar beet juice using loofa sponge immobilized bioreactor. Bioresource
Technology, 76, 1–8. http://doi.org/10.1016/S0960-8524(00)00084-5

156
Pometto, A. L. I., A.Demirci, & Johnson, K. E. (1997). Immobilization of
microorganisms on a support made of synthetic polymer and plant material. US.
Pongtharangkul, T., & Demirci, A. (2006). Evaluation of culture medium for nisin
production in a repeated-batch biofilm reactor. Biotechnology Progress, 22, 217–
224. http://doi.org/10.1021/bp050295q
Rani, P., Sharma, S., Garg, F. C., Raj, K., & Wati, L. (2010). Ethanol production from
potato flour by Saccharomyces cerevisiae. Indian Journal of Science and
Technology, 3(7), 733–736. Retrieved from
http://www.indjst.org/index.php/indjst/article/view/29804
RFA. (2015). Going Global 2015 Ethanol Industry Outlook. Retrieved January 1, 2016,
from http://www.ethanolrfa.org/wp-
content/uploads/2015/09/c5088b8e8e6b427bb3_cwm626ws2.pdf
Sarkar, N., Ghosh, S. K., Bannerjee, S., & Aikat, K. (2012). Bioethanol production from
agricultural wastes: An overview. Renewable Energy, 37(1), 19–27.
http://doi.org/10.1016/j.renene.2011.06.045

157
CHAPTER 7
SIMULTANEOUS SACCHARIFICATION AND FERMENTATION OF
ETHANOL FROM POTATO WASTE BY CO-CULTURES OF ASPERGILLUS
NIGER AND SACCHAROMYCES CEREVISIAE IN BIOFILM REACTORS5
7.1 Abstract
Novel approaches for bioethanol production from industrial wastes have gained attention
due to not only maximize the ethanol production productivity, but also reduce the
production cost. Part of the production cost also includes cost of the enzymes needed for
saccharification step during the starch hydrolyzation, which can be significant cost
depending on the enzymes’ performances. Therefore, in this study, simultaneous
saccharification and fermentation (SSF) of ethanol by co-cultures of Aspergillus niger
and Saccharomyces cerevisiae was assessed in a potato waste based medium by using
biofilm reactors. The plastic composite supports (PCS) were studied for biofilm
formation. Effects of temperature, pH, and aeration rates in biofilm reactors were
evaluated by response surface methodology and the optimal conditions were found to be
35 ºC, pH 5.8, and no aeration. The maximum ethanol concentration of 37.93 g/L was
achieved at the end of 72h fermentation, with a 0.41 g ethanol /g starch yield. Finally,
biofilm formation of co-culture on PCS was also evaluated by scanning electron
microscope. In conclusion, the results demonstrated that PCS can be utilized for SSF
processes for ethanol production in biofilm reactors with co-cultures by using starchy
industrial wastes.
5A version of this chapter was submitted as: Izmirlioglu G., and A. Demirci. 2016. Simultaneous
saccharification and fermentation of ethanol from potato waste by co-cultures of Aspergillus niger and
Saccharomyces cerevisiae in biofilm reactors. In-review.

158
7.2 Introduction
Bioethanol is one of the alternative renewable fuels to substitute petroleum fuels and has
already been used in the transportation industry. Bioethanol production reached 54 billion
liters in 2014 in the USA (RFA, 2015). Currently, bioethanol is mainly produced from
sugar and starchy food crops, such as sugar cane (Brazil), corn (USA), wheat (European
countries), and sorghum since processing these crops are well established with higher
ethanol yields. However, using food crops for bioethanol production is of concern due to
agricultural land and water use (Hashem & Darwish, 2010), as well as the high costs of
food crops (Pietrzak & Kawa-Rygielska, 2015). Lignocellulosic biomass (agricultural
and forestry residues) and algae are promissing substrates in terms of cost and
availability, however, bioethanol production from these substrates, currently, faces some
processing difficulties, which yield lower ethanol productions athigher production costs
in comparison to simple sugars and starchy food crops. Utilization of wastes and by-
products of food industry, therefore, has great potantial for bioethanol production due to
the fact that these substrates contain sufficient amounts of fermentable sugars and/or
hydrolysable starch, and are inexpensive. Potato industry waste, especially, has great
potential for bioethanol production due to high starch content. The most notable
examples can be potato pulp, potato processing water, peels, and potato mash (Arapoglou
et al., 2010; Izmirlioglu & Demirci, 2012).
The conventional ethanol production from starch requires a two-step pretreatment
process, liquefaction and saccharification, before fermentation. Alpha-amylase is
employed for liquefaction, while glucoamylase is used for saccharification steps to
produce glucose monomers. Because liquefation and saccharification are usually
performed at elevated temperatures (around 95 ºC and 60 ºC, respectively), energy
demand is also high (W. S. Lee et al., 2012). Another drawback is enzyme inhibition
caused by accumulation of glucose during saccharification process (Diaz, Chinn, &
Truong, 2014). Therefore, simuleneous saccharification and fermentation (SSF) can be an
alternative to prevent enzyme inhibition, provide shorter processing times, decrease
energy demand, and eventually reduce production costs (Mojović et al., 2009; Ylitervo,
159
Franzén, & Taherzadeh, 2011). For SSF, either commercial enzymes or amylase
producing microorganims can be employed along with ethanol producing
microorganisms. However, the biggest challenge of co-culturing is different nutrient and
culture requirements of the microorganisms (W. S. Lee et al., 2012), and must be studied
for an efficient ethanol production. Oberoi et al. (2011) studied SSF ethanol production
from banana peels using enymes and S. cerevisiea and reported that under optimum
conditions (9 FPU/g-cellulose cellulase, 72 IU/g-pectin pectinase, 37 ºC and 15h), 28.2
g/L of ethanol was produced. In another study, SSF ethanol production from damaged
sorghum and rice grains by co-cultures of A. niger and S. cerevisiae were evaluated, and
the maximum ethanol production was reported as 29 and 20.9 g/L from damaged
sorghum and damged rice grains, respectively (Suresh et al., 1999).
Biofilm, the natural attachment of microorganisms to a surface, could resolve the
problems of co-culturing process. It is well documented that microorganisms in a biofilm
are resistant to extreme environmental conditions such as pH and temperature,
contaminants, hydraulic shocks, antibiotics, and toxic substances (Cheng et al., 2010a)
and co-immobilized microorganisms might adapt to their new environmental conditions
better than single culture systems (Ylitervo et al., 2011). Because biofilm formation
occur naturally, providing the right support material play a crucial role for a successful
biofilm formation (Ercan & Demirci, 2015a). The characteristics of a desirable solid
support can be listed as inexpensive, favorable to microorganisms, easily available,
resistant to mechanical force, sufficient surface area, and porosity (Ercan & Demirci,
2015a). Plastic composite supports (PCS) are one of the supports made from
polypropylene and agricultural products which were developed at Iowa State University
(Pometto et al., 1997). In this support, polypropylene provides the matrix for the mixture
of agricultural products. PCS is suitable for long run fermentations because of its
robustness, strength, longevity, as well as the slow nutrient leaching (Cheng et al.,
2010a). Application of PCS in biofilm reactors for various value-added products have
already been studied in bench-scale, and showed improvements in nisin, ethanol,
bacterial cellulose, pullulan, lactic acid and lysozyme productions (Cheng, Catchmark, &

160
Demirci, 2009; Cheng et al., 2010b; Demirci et al., 1997; Ercan & Demirci, 2014;
Pongtharangkul & Demirci, 2006; Velázquez, Pometto, Ho, & Demirci, 2001).
In this study, growth conditions of co-cultures of Aspergillus niger and Saccharomyces
cerevisiae were optimized for maximum ethanol production from waste potato mash in PCS
biofilm reactors. Even though, PCS has been investigated for various value-added products,
it has been only used for single culture systems. To the best of the authors’ knowledge, it is
the first study that PCS biofilm reactors were used for co-culturing as well as SFF process for
ethanol production.
7.3 Materials and Methods
7.3.1 Microorganisms and media
Saccharomyces cerevisiae (ATCC 24859) was obtained from the American Type Culture
Collection (Manassas, VA, USA). The culture was grown in a medium containing 20 g/L
of glucose, 6 g/L of yeast extract, 0.3 g/L of CaCl2·2H2O, 4 g/L of (NH4)2SO2, 1 g/L of
MgSO4·7H2O, and 1.5 g/L of KH2PO4 at 30°C for 24 h (Izmirlioglu & Demirci, 2012).
The activity of the culture was maintained by storing at 4°C and sub-cultured biweekly,
while stock cultures were kept in 20% glycerol at −80°C.
Aspergillus niger van Tieghem (NRRL 330) was obtained from the USDA’s Agricultural
Research Service (Peoria, IL). It was grown on Petri plates containing malt extract agar
(20 g/L of malt extract, 20 g/L of glucose, 1 g/L of peptone, and 20 g/L of agar) at 30 °C
for 120 h (Chapter 3). A. niger spore suspension was prepared as follows: Fungi were
grown on malt extract agar plates for 5 days at 30 °C. At the end of the incubation, A.
niger spores were suspended by using 2 ml of 0.1% sterile peptone water per plate. Then,
1 ml of spore suspension, which had 106 CFU/ml was used to inoculate the flasks
containing 100 ml of medium. In order to maintain viability, the cultures were stored at
4°C and sub-cultured every three weeks. Stock spore cultures were grown as described

161
above, however washed off with 20% glycerol solution and kept in 20% glycerol at −80
°C.
For PCS selection, the growth medium for each microorganism was used during the
culture tube fermentation. The glucose concentration of S. cerevisiae medium was
increased to 50 g/L. The fermentation medium that was used for biofilm reactor runs
consisted of 92.37 g/L of industrial waste potato mash, 59.42 g/L of malt extract, and
0.159 g/L of FeSO47H2O (Chapter 5). The industrial waste potato mash slurry was
blended for 3 min and strained with a regular kitchen strain to remove the large peels,
then, the slurry was supplemented with malt extract and FeSO47H2O. Then, the medium
was autoclaved for 30 min at 121°C.
7.3.2 Plastic composite support (PCS)
The PCS tubes evaluated in this study were manufactured at Iowa State University
(Ames, IA) using a twin-screw corotating Brabender PL2000 extruder (model CTSE-V;
C.W. Brabender Instruments, Inc., South Hackensack, NJ) (Pometto et al., 1997). The
polypropylene, organic and inorganic ingredients were mixed and extruded at 13 rpm
through a medium pipe die at high barrel temperatures, 200, 220, and 200 ºC. The PCS
tubes had 2.5 mm wall thickness and 10.5 mm outer diameter. According to the prior
studies conducted in our lab and other published work, four types of PCSs were selected.
Table 7.1 shows the compositions of PCS tubes studied in this study. The common
ingredients for all of the PCS tubes were polypropylene (PP) 50% (w/w), soybean hulls
(SH), soybean flour (SF), and salts (S) while yeast extract (YE), dried bovine albumin
(BA) and dried bovine red blood cell (RBC) were the ingredients only some of the PCS
tubes contained.
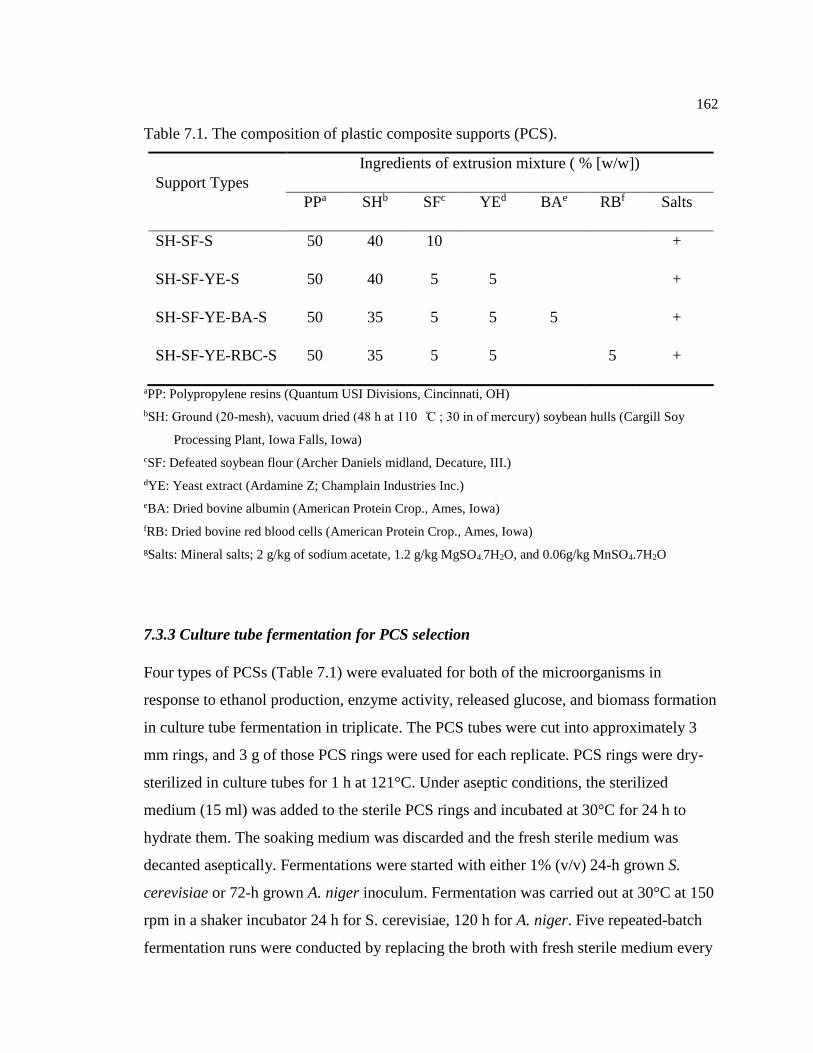
162
Table 7.1. The composition of plastic composite supports (PCS).
Support Types
Ingredients of extrusion mixture ( % [w/w])
PPa SHb SFc YEd BAe RBf Salts
SH-SF-S 50 40 10
+
SH-SF-YE-S 50 40 5 5
+
SH-SF-YE-BA-S 50 35 5 5 5
+
SH-SF-YE-RBC-S 50 35 5 5
5 +
aPP: Polypropylene resins (Quantum USI Divisions, Cincinnati, OH)
bSH: Ground (20-mesh), vacuum dried (48 h at 110 ̊C ; 30 in of mercury) soybean hulls (Cargill Soy
Processing Plant, Iowa Falls, Iowa)
cSF: Defeated soybean flour (Archer Daniels midland, Decature, III.)
dYE: Yeast extract (Ardamine Z; Champlain Industries Inc.)
eBA: Dried bovine albumin (American Protein Crop., Ames, Iowa)
fRB: Dried bovine red blood cells (American Protein Crop., Ames, Iowa)
gSalts: Mineral salts; 2 g/kg of sodium acetate, 1.2 g/kg MgSO4.7H2O, and 0.06g/kg MnSO4.7H2O
7.3.3 Culture tube fermentation for PCS selection
Four types of PCSs (Table 7.1) were evaluated for both of the microorganisms in
response to ethanol production, enzyme activity, released glucose, and biomass formation
in culture tube fermentation in triplicate. The PCS tubes were cut into approximately 3
mm rings, and 3 g of those PCS rings were used for each replicate. PCS rings were dry-
sterilized in culture tubes for 1 h at 121°C. Under aseptic conditions, the sterilized
medium (15 ml) was added to the sterile PCS rings and incubated at 30°C for 24 h to
hydrate them. The soaking medium was discarded and the fresh sterile medium was
decanted aseptically. Fermentations were started with either 1% (v/v) 24-h grown S.
cerevisiae or 72-h grown A. niger inoculum. Fermentation was carried out at 30°C at 150
rpm in a shaker incubator 24 h for S. cerevisiae, 120 h for A. niger. Five repeated-batch
fermentation runs were conducted by replacing the broth with fresh sterile medium every

163
24 h or 120 h to promote the biofilm formation. Ethanol production, enzyme activity, and
released glucose concentrations were evaluated under three consecutive repeated-batch
fermentations following biofilm formation, while the biomass was also determined at the
end of three consecutive repeated-batch fermentations. The PCS type that was selected to
conduct the biofilm reactor was chosen according to the biomass production on the PCS
(log CFU/ g PCS), ethanol production (g/L), enzyme activity (U/ml) and released glucose
concentrations in the fermentation broth.
7.3.4 SSF in biofilm reactor
The selected PCS type was used to build the biofilm reactor as demonstrated in Figure
7.1.
Figure 7.1 Diagram of the PCS biofilm reactor and actual image of PCS tubes on the
agitator shaft before (left) and after (right) biofilm formation.

164
The PCSs were cut into 6.5 cm long tubes and 12 PCS tubes were attached to the agitator
shaft in a grid-like fashion creating six rows of two parallel tubes. Sartorious Biostat B
Plus bioreactor (Allentown, PA) with a 2 L vessel was used. The reactor vessel was
sterilized with deionized (DI) water at 121°C for 60 min after the PCS installation. After
the sterilization, water was pumped out and 1.5 L of pre-sterilized fermentation medium
(121°C for 30 min) was pumped in aseptically to the reactor vessel. After inoculation
with 3% (v/v) 24-h grown culture of S. cerevisiae (Izmirlioglu & Demirci, 2012) and 1%
72-h grown spore suspension of A. niger, five repeated batch fermentations were
completed to allow the biofilm formation on the PCS. The fermentation runs for biofilm
formation were carried out at pH 5, 30°C, 150 rpm, with no aeration for 72 h. pH was
controlled by addition of either 2N NaOH or 2N HCl. Once biofilm formed, batch
fermentations were subsequently performed under the conditions designed by Box-
Behnken design of surface response methodology to evaluate temperature (25-35°C), pH
(4-6), and aeration rate (0-1.5 vvm) (Table 7.2). Samples were taken every 6 or 12 h
throughout of the 72-h fermentation. Each condition was replicated, and ethanol
production was used as the response for optimization. The identified optimum conditions
were validated twice experimentally. In addition, other sugars including maltose,
fructose, arabinose, xylose, galactose were analyzed for these validation runs to have a
better picture in terms of sugar profile during the SFF process.
After all the fermentation runs were completed, the biofilm reactor was disassembled and
the PCS tubes were removed aseptically. The biofilm formation on PCS tubes were
visually evaluated by scanning electron microscope (SEM).
7.3.5 Analysis
7.3.5.1 Biomass on PCS
The biofilm population on the PCS was enumerated by stripping sand method (Demirci
et al., 1997). The PCS rings in the culture test tubes were washed in 100 ml of sterile
0.1% (w/v) peptone water by turning the tubes upside-down 10 times. Then, PCS rings

165
were aseptically transferred into a 50-ml test tube containing 5 g of sterile sand and 9 ml
of sterile peptone water. Then, the tubes were vortexed three times in 30-s intervals. A
serial of dilutions of sand stripped samples were carried out in 0.1% sterile peptone water
and, then, S. cerevisiae and A. niger cells were spirally plated on potato dextrose agar
(Difco, MD) and malt agar, respectively . Spiral plating was done to enumerate the cell
population using a spiral auto-plater (Model 4000, Spiral Biotech, Norwood, MA) and Q-
count software (Version 2.1; Spiral Biotech, Norwood, MA). Plates were incubated at
30°C for 24 h and 72 h for S. cerevisiae and A. niger, respectively. Q-count software
(Version 2.1; Spiral Biotech) was used for enumeration. Results were indicated as log10
CFU/g PCS.
7.3.5.2 Ethanol and glucose
Samples of the culture tube fermentation for PCS selection were evaluated for glucose
and ethanol using the YSI Biochemistry Analyzer (Model 2700, Yellow Springs, OH).
Samples were diluted up to 20 fold by using DI water to bring the concentration levels of
glucose and ethanol to the equipment’s measurement range. Then, the samples were
analyzed using the YSI Biochemistry Analyzer.
However, samples of the fermentations in biofilm reactors were analyzed for ethanol and
glucose with a Waters' high pressure liquid chromatography (HPLC) equipped with a
refractive index detector (Waters, Milford, MA). Separation of ethanol and glucose was
carried out using Bio-Rad Aminex HPX-87H column (300 mm × 7.8 mm; Bio-Rad,
Richmond, CA) with 0.8 ml/min of 0.012 N sulfuric acid as mobile phase. The detector
and column temperatures were constant at 35 and 65 °C, respectively. The samples were
centrifuged 4 °C for 20 min at 5,200 x g) in order to separate the particles and the cells
from the samples. Then, supernatant was filtered with 0.2 μm nylon syringe filters
(VWR, Radnor, PA), and injected to the HPLC.

166
7.3.5.3 Enzyme Activity
Extracellular glucoamylase activity in the culture broth was determined by measuring the
glucose released from the starch as described by Lemmel et al. (1980) with minor
modification. In order to remove the cells, samples were centrifuged at 4°C for 20 min at
5,200 x g, and the supernatant was used for glucoamylase activity analysis. Culture
supernatant (0.5 ml) was mixed with 0.5 ml of 1.0% potato starch dissolved in a 0.01 M
acetate buffer at pH 4.8. Tubes were incubated in a 30°C water bath for 30 min and then
placed in boiling water for 15 min to stop the enzyme activity. Finally, the released
glucose was measured using the YSI Glucose Analyzer. One unit of glucoamylase
activity is defined as the amount of enzyme that releases 1 µmol of glucose (0.18 mg)
from starch in 30 min at 30°C.
7.3.5.4 Sugar Analysis
Sugar profile for the validation run at the optimum conditions was determined by Dionex
IC 3000 Ion Exclusion Chromatography (Dionex Corporation, Sunnyvale, CA). Samples
were filtered through a 0.2 μm nylon filters after serially diluted 103 fold. Separation was
carried out by high pH anion exchange at 30ºC using CarboPac PA20 guard (3 x 30 mm)
and analytical (3 x 150 mm) columns with 200 mM sodium hydroxide (NaOH) for 40
min at a flow rate of 0.5 ml/min, and dropped to 50 mM during the samole injection.
Sugars were detected by pulsed amperometric [electrochemical] detection at gold
working electrodes, using quadruple waveform.
7.3.5.5 Scanning Electron Microscope (SEM)
Exterior and interior surfaces of the PCS tubes were visually evaluated for biofilm
formation by using SEM. The biofilm structure was maintained by chemical fixation of
the cells. PCS tubes were soaked in 2.5% gluteraldehyde in 0.1M phosphate buffer (pH
7.2) with 0.02 % Triton X-100 and stored at 4 ºC for overnight. After primary fixative
discarded, samples were washed 3-5 times with phosphate buffer. Samples, then, were
serially washed with 25, 50, 70, 85, 95, and 100% ethanol for 5 min. Later, critical point

167
drying were carried out (Dykstra, 1992; Hall & Hawes, 1991). Finally, SEM micrographs
of critical-point dried PCS tubes were taken with Zeiss Sigma Variable Pressured Field
Emission Electron Scanning Microscope (VP-FESEM).
7.3.5.6 Statistical Analysis
Fermentations were analyzed using ethanol production, enzyme activity, released glucose
concentrations, and biomass as responses. Minitab Software (Version 16.1, State College,
PA) was used for ANOVA and the Tukey’s comparison test to determine the PCS type
for biofilm formation. During the statistical analysis of Box-Behnken design, the
ANOVA and regression analysis were obtained to determine the coefficients of the
predictive model and significant terms (Minitab Statistical Software). The optimum
conditions were determined by using the Response Optimizer tool in Minitab.
7.4 Results and Discussion
7.4.1 PCS Selection
The selection of PCS type was carried out in culture tube fermentation to investigate the
four different PCS types for A. niger and S. cerevisiae separately. The released glucose
concentrations, enzyme activity, and biomass for A. niger on each PCS types were
presented in Figure 7. 2(A). The released glucose concentrations were ranged from 4.4
g/L to 7.60 g/L depending on the PCS type, and the PCS composed of SH-SF-YE-BA-S
resulted the highest glucose release, 7.60 g/L. It was followed by SH-SF-S (7.30 g/L) and
SH-SF-YE-S (6.13 g/L). The lowest glucose release was obtained from the PCS with SH-
SF-YE-RBC-S (4.40 g/L). The differences among the means of released glucose of SH-
SF-S, SH-SF-YE-BA-S and SH-SF-YE-S were not statistically significant. However, the
PCS with SH-SF-YE-RBC-S produced significantly lower glucose than SH-SF-S and
SH-SF-YE-BA-S (p-value <0.05), though the difference between SH-SF-YE-RBC-S and
SH-SF-YE-S did not show a significant difference (p-value >0.05). Enzyme activity, on
the other hand, did not show any statistical difference among the

168
Figure 7.2 Effects of different PCS compositions on the glucose, enzyme activity,
biomass and ethanol production in test tubes (n =3) for A. niger (A) and S.
cerevisiae (B). (Different letters represents the significant difference between
treatments (p-value ˂ 0.05)).
ab
a
a
a
b
a
a
a
0
5
10
15
20
25
Ethanol (g/L) Biomass (log CFU/g PCS)
SH-SF-Salts
SH-SF-YE-Salts
SH-SF-YE-BA-SALTS
SH-SF-YE-RBC-SALTS
B
a
a
a
aba
b
a
a
c
b
a
d
0
1
2
3
4
5
6
7
8
Glucose (g/L) Enzyme Activity (U/ml) Biomass (log CFU /g PCS)
SH-SF-Salts
SH-SF-YE-Salts
SH-SF-YE-BA-SALTS
SH-SF-YE-RBC-SALTS
A

169
PCS types (p-value >0.05). The highest enzyme activity was found to be 6.87 U/ml and
obtained from the PCS composed of SH-SF-YE-BA-S. The lowest enzyme activity was
6.34 U/ml and observed with the PCS with SH-SF-S. On the other hand, the biomass on
PCS types were varied from 2.73 log10 CFU/ g PCS to 4.75 log10 CFU/ g PCS, and
revealed significant difference among the PCS types (p-value =0.00). The highest
biomass formation was observed on the PCS with SH-SF-YE-S, 4.75 log10 CFU/ g PCS
and followed by SH-SF-S (4.38 log10 CFU/ g PCS) and SH-SF-YE-RBC-S (2.97 log10
CFU/ g PCS). The lowest biofilm formation was resulted from the PCS with SH-SF-YE-
BA-S (2.73 log10 CFU/ g PCS).
For S. cerevisiae, the ethanol productions and biomass for each PCS types were presented
in Figure 7. 2(B). The ANOVA test revealed that PCS types had statistically significant
effect on ethanol productions (p-value <0.05). The highest ethanol production (21.68
g/L) was observed with the PCS composed of SH-SF-YE-RBC-S and followed by SH-
SF-YE-S (21.58 g/L ethanol). The lowest ethanol production, on the other hand, obtained
from the PCS with SH-SF-YE-BA-S (20.7 g/L). No statistically significant difference
were found among the PCSs that were composed of SH-SF-S, SH-SF-YE-S, and SH-SF-
YE-RBC-S. However, the ethanol production of the PCS composed of SH-SF-YE-BA-S
was significantly lower than the PCSs, SH-SF-YE-S and SH-SF-YE-RBC-S (p-
value<0.05). Yet, no significant difference was determined between SH-SF-YE-BA-S
and SH-SF-S in terms of ethanol production. For S. cerevisiae, the biomass formations on
PCS were varied from 6.70 log10 CFU / g PCS to 6.93 log10 CFU/ g PCS, however,
showed no significant difference among the PCS types (p-value >0.05). To form the
biofilm in the reactor, a PCS that is favorable to not only A. niger, but also S. cerevisiae
was targeted. According to these results, it was determined that the PCS with SH-SF-YE-
S was capable of promoting the biomass formation as well as the product for both of the
microorganisms, and selected to form the biofilm in the reactor for next phase of the
study.
170
Although no significant differences were detected among the PCS types in terms of the
enzyme activity for A. niger and biofilm formation for S. cerevisiae; glucose
concentration and biofilm formation for A. niger and ethanol production for S. cerevisiae
were varied. A possible explanation for this might be the different nutrient requirements
of the yeast and the mold and the slow leaching of nutrients from PCS into the
fermentation broth (K. L. Ho, Pometto, Hinz, et al., 1997). Several studies have shown
that the PCSs provide nutrients during the fermentation while supporting the biofilm
formation ( Cheng et al., 2010b; Demirci et al., 1997). These results are in agreement
with findings of Demirci et al. ( 1997) who also suggested the PCS composed of SH-SF-
YE-S for ethanol production by S. cerevisiae in biofilm reactors after assessing eleven
compositionally different PCS types.
7.4.2 Optimization of growth parameters by response surface method in biofilm reactor
After determining the type of PCS to be used, biofilm reactors were constructed as
described earlier with the selected PCS type (SH-SF-YE-S). Then, effects of temperature
(25-35 °C), pH (4-6), and aeration rate (0-1.5 vvm) were evaluated to optimize the SSF
of ethanol in biofilm reactors by co-cultures of A. niger and S. cerevisiae in industrial
waste potato mash medium. Table 7.2 provides the experimental and predicted results of
ethanol production and enzyme activity obtained from the Box-Behnken design matrix. It
is apparent from the table that ethanol production and enzyme activities were highly
affected by fermentation conditions, and ranged from 5.32 g/L to 37.58 g/L for ethanol
and from 0.1 U/ml to 40.11 U/ml for enzyme activity. A positive effect of temperature
was observed in which higher temperature profiles revealed higher results for both
ethanol productions and enzyme activity. This can be seen under the conditions of pH 6,
0.75 vvm aeration, and 25°C in which 24 g/L ethanol and 7.67 U/ml enzyme activity
observed, while at pH 6, 0.75 vvm and 35°C, ethanol production and enzyme activity
raised to 33.24 g/L and 14.11 U/ml, respectively. In case of pH, it was also observed that
higher pH profiles promoted the production of ethanol as well as enzyme activity.

171
Table 7.2. Effect of growth parameters on SSF ethanol production in biofilm reactors
with PCS by A. niger and S. cerevisiae.
Experimental Predicted
Temperature
(ºC)
pH
Aeration
(vvm)
Ethanol
(g/L)
Enzyme
Activity (U/ml)
Ethanol
(g/L)
Enzyme
Activity (U/ml)
30 4 0 13.08 26.5 10.82 19.61
30 5 0.75 15.07 7.36 18.03 5.29
30 6 0 37.58 40.11 35.52 38.86
35 5 1.5 15.94 25.67 12.35 16.92
25 4 0.75 10.12 2.92 8.80 1.07
35 4 0.75 10.09 0.10 11.62 7.50
25 5 1.5 12.86 0.88 12.12 1.48
25 6 0.75 24.00 7.67 22.48 0.18
35 5 0 22.84 22.11 23.58 21.51
30 5 0.75 18.35 3.73 18.03 5.29
30 6 1.5 22.86 7.58 25.12 14.47
25 5 0 5.32 5.99 8.91 14.74
30 4 1.5 11.14 24.89 13.20 26.15
35 6 0.75 33.24 14.11 34.56 15.96
30 5 0.75 20.68 4.79 18.03 5.29
As a notable example of this, 37.58 g/L ethanol and 40.11 U/ml enzyme activity were
obtained at pH 6, 30°C and 0 vvm aeration. At pH 4, however, both the values of ethanol
production and enzyme activity dropped down to 13.08 g/L and 26.5 U/ml, respectively
(when temperature and aeration kept constant). In contrast to temperature and pH,
increased rates of aeration caused a decrease in ethanol production while increased the
enzyme activity. For instance, 22.84 g/L ethanol attained at pH 5, 35°C, and 0 vvm
aeration, while ethanol production decreased to 15.94 g/L, when aeration increased to 1.5

172
vvm at the constant pH and temperature. Enzyme activity, however, increased from 22.11
U/ml to 25.67 U/ml in presence of aeration (1.5 vvm) compared to no aeration (0 vvm)
under same pH and temperature profiles, 5 and 35°C, respectively.
Second order polynomial equation (Eqn 7.1) for ethanol production was obtained using
Minitab software and shown below:
𝐸𝑡ℎ𝑎𝑛𝑜𝑙 (𝑔
𝐿) = −15 + 5.87𝑋1 − 42.8𝑋2 + 50.2𝑋3 − 0.1119𝑋1
2 + 4.13𝑋22 −
1.77𝑋32 + 0.464𝑋1𝑋2 − 0.963𝑋1𝑋3 − 4.26𝑋2𝑋3……………......................(Eqn. 7.1)
where X1, X2 and X3 are temperature (ºC), pH and aeration rate (vvm), respectively. The
results of ANOVA indicated that the model is reliable with R2 value of 93.68 % and
significant linear effects. The insignificant lack of fit proved that experimental data is
well fitted to the model (p-value =0.322). Figure 7.3 is the representation of response
surface plots, the effects of each factor as well as interactions among the factors. As it can
be seen in Figure 7.3, a linear correlation observed between pH and ethanol production,
resulting higher ethanol productions at pH 6. Ethanol production also showed a linear
increase with increased temperature up to about 34ºC, and then reaches its plateau around
35ºC. The relationship between aeration and ethanol production, on the other hand,
showed linear decrease in which ethanol productions decreases at increased aeration
rates.
The response optimizer tool in Minitab software was used to determine the optimum
level for the each factor to maximize the ethanol production. Figure 7.4 illustrates the
optimization graph for maximum ethanol production. Based on this, the optimum
conditions were determined as pH 5.8, 35 ºC, and 0 vmm, which estimate 37.95 g/L
ethanol production. The suggested optimum condition (pH 5.8, 35ºC, and 0 vmm) was
validated experimentally.

173
Figure 7.3 Response surface plot showing the interactions of pH, temperature and
aeration and their effect on ethanol production.
The averages of the results under the optimum conditions were presented in Figure 7.5.
The maximum ethanol production was measured as 37.93 g/L with a 0.410 g ethanol/g
starch yield and 1.044 g/L/h ethanol productivity. Because the pH showed a linear effect

174
on ethanol production (Figure 7.4), and the optimum value for pH was very close to the
highest limit of evaluated range, additional fermentation was carried out at pH 6.5 at
35ºC, and 0 vmm, as well as at uncontrolled pH to confirm this is indeed the optimum
condition. The ethanol productions for pH 6.5 and uncontrolled pH were significantly
lower than the suggested optimum pH, 32.98 g/L and 11.09 g/L, respectively. Thus, the
optimal pH was proven to be 5.8.
Figure 7.4 Optimization graph shows the optimal value for maximum ethanol
production.
Figure 7. 5 Product formation curve for SSF ethanol production from industrial potato
waste under the statistically optimized conditions in biofilm reactor by A.
niger and S. cerevisiae.
0
10
20
30
40
50
60
70
0
5
10
15
20
25
30
35
40
45
0 10 20 30 40 50 60 70 80
Enzy
me
Act
ivit
y (U
/ml)
Eth
ano
l an
d G
luco
se (
g/L)
Time (h)Glucose (g/L) Ethanol (g/L) Enzyme Activity (U/ml)

175
During the course of study, the focus was only on the glucose analysis as the main sugar
analysis. However, other sugars were also analyzed for the validation runs. Sugar
analysis revealed the presence of concentration of maltose in the fermentation broth, from
beginning to the end of the fermentation (9.7 g/L). Since the concentrations of maltose
were not constant (5.3 g/L to 14.55 g/L), it can be concluded that maltose was a by-
product of the fermentation as well as a substrate. Insignificant amounts of arabinose
(30.60 mg/L), xylose (77.16 mg/L), galactose (84.20 mg/L), and fructose (320 mg/L)
were also determined in the fermentation broth samples. The concentrations of those
sugars were constant throughout the SFF process. These results suggest that those sugars
were not by-products of the fermentation, however, released from potato and/or peels
during the sterilization of the medium. The fermentation time to reach the maximum
enzyme activity was reduced from 96 h to 24 h in biofilm reactors, which also decreased
the total fermentation time to 72 h instead of 120 h (Izmirlioglu & Demirci, 2016), which
makes the overall process 40% shorter.
The optimal pH was determined as 5.8. These results are in agreement with findings of
Liu and Shen ( 2008) and Germec et al. (2015) who reported pH 5 and 5.18 were the
optimum pH for ethanol production by immobilized S. cerevisiae. In contrast to earlier
findings, a relatively high temperature was found to be optimal for ethanol production. A
possible explanation of this can be the elevated temperature requirements of
glucoamylases (50 -70 ºC) for optimal activity (Norouzian et al., 2006). Furthermore,
biofilm formation increases the resistance of microorganisms to extreme environmental
conditions such as pH, temperature, toxic substances (Ercan & Demirci, 2015a), and
explain the higher productivity of S. cerevisiae at 35 ºC. Another important finding was
no aeration was suggested for maximum ethanol production by the model. It is well
known that ethanol productivity of S. cerevisiae decreases in the presence of oxygen;
however, A. niger requires some amounts of aeration. The results of this study further
supports the idea of co-immobilization can enhance the adaptation of co-cultures to the
harsh and inhibiting environments (Ylitervo et al., 2011).

176
As explained in previous chapter, growth conditions for ethanol production in biofilm
reactors by S. cerevisiae were optimized in an industrial potato waste based medium
(Chapter 6). Commercial enzymes were employed during hydrolyzation of the starch for
scarification before fermentation. In that study, under optimum conditions (pH 4.2, 34ºC,
and 100 rpm), 37.05 g/L of ethanol was obtained with 92.08% theoretical yield and
2.31g/L/h ethanol productivity. The results of our current study indicated that
comparable ethanol yields can be achieved with SSF of ethanol by co-cultures of A. niger
and S. cerevisiae in biofilm reactors without needing any added enzymes. Fuji et al.
(2001) reported 25.5 g/L maximum ethanol production by immobilized co-cultures of A.
awamori and S. pastorianus using cellulose carriers. The results of current study, thus,
indicates that PCS biofilm reactors can successfully employed for co-culture systems,
which provided 37.93 g/L ethanol production with a 0.410 g ethanol/g starch yield and
1.044 g/L/h ethanol. Furthermore, comparable amounts of ethanol can be produced using
SSF process with application of PCS biofilm reactors while utilizing the industrial
wastes.
7.4.3 SEM Evaluation
The co-culture biofilm formations on selected PCS were visually evaluated with scanning
electron microscopy (Figure 7.6). For the comparison, external and internal surfaces of
control PCS tubes before microbial growth were shown in Figure 7.6A and 7.6B,
respectively. A porous surface promote the biofilm formation (Cheng et al., 2010a). As
it can be seen in Figure 7.6A and 7.6B, PCS is highly porous and promoted biofilm
formation resulting very dense formation of biofilm on the outer surface of the PCS,
especially within the pores (Figure 7.6C). A closer look at the PCS at 1000X and 2500X
magnification clearly revealed the spores and mycelia of A. niger (Figure 7.6D and 7.6E).
Figure 7.6F is the enlargement of A. niger spores at 20K X magnification, while Figure
7.6G is the enlargement of mycelia at 15K X magnification SEM micrographs also
showed that S. cerevisiae cells bounded mostly on the mycelia. On the other hand,
biofilm formation at 60X magnification in the interior surface of the PCS shown in
Figure 7.6H As it can be seen in Figure 6I, microbial cells were captured at 6700X

177
magnification on the interior surface of PCS. Therefore, interior surface was more
favorable for S. cerevisiae cells than A. niger since no mycelia or spores were observed.
This might be due to the lack of oxygen in the interior surface, which is necessary for A.
niger however not required for yeast.
(A) (B)
(C) (D)
(E)
1

178
(F) (G)
(H) (I)
Figure 7.6 Scanning electron micrographs of SSF of ethanol by co-cultures of A. niger
and S. cerevisiae on the exterior and interior surfaces SH-SF-YE-S PCS
tubes in fermentation medium. A: Exterior surface of PCS tubes before cell
growth (control). B: Interior surface of PCS tubes before cell growth
(control). C: Co-culture biofilm on the exterior surface of PCS tubes at 60X
magnification. D: Enlargement of cell clusters shown in square in image C at
1000X magnification. E: Enlargement of the square in image D at 2500 X
magnification showing the spores and hyphae. F: Enlargement of A. niger
spores (Red box in E) at 20K X magnification. G: Enlargement of fungal
hyphae (White box in E) at 15K X magnification. H: Co-culture biofilm on
the interior surface of PCS tubes at 60X magnification. I: Enlargement of cell
clusters shown in image H showing the cells.

179
7.5 Conclusions
The present study was designed to determine the PCS composition for biofilm formation
of co-cultures of A. niger and S. cerevisiae and the effects temperature, pH, and aeration
rates on ethanol production in SSF of ethanol in PCS biofilm reactors from industrial
potato waste. The response surface methodology was used to determine the model to
predict the ethanol production under different combinations of temperature, pH and
aeration rates. The study has identified that PCS with SH-SF-YE-S were capable of
promoting biofilm formation for both cultures of A. niger and S. cerevisiae. In a PCS
biofilm reactor, optimum conditions for maximum ethanol production of SSF of potato
waste by co-cultures of A. niger and S. cerevisiae was 35ºC, pH 5.8, and no aeration (0
vvm). A maximum of 37.93 g/L ethanol was produced under optimum conditions, with
0.410 g ethanol/g starch yield and 1.044 g/L/h productivity. The results suggest that PCS
biofilm reactors can be used for co-immobilization of co-culture systems. Overall,
bioethanol production from starchy industrial wastes can be improved with application of
biofilm reactors while the production cost is reduced with integrations of SSF process
and co-culturing.
7.6 References
Arapoglou, D., Varzakas, T., Vlyssides, a., & Israilides, C. (2010). Ethanol production
from potato peel waste (PPW). Waste Management, 30(10), 1898–1902.
http://doi.org/10.1016/j.wasman.2010.04.017
Cheng, K.-C., Catchmark, J. M., & Demirci, A. (2009). Enhanced production of bacterial
cellulose by using a biofilm reactor and its material property analysis. Journal of
Biological Engineering, 3, 12. http://doi.org/10.1186/1754-1611-3-12
Cheng, K.-C., Demirci, A., & Catchmark, J. M. (2010a). Advances in biofilm reactors for
production of value-added products. Applied Microbiology and Biotechnology, 87,
445–456. http://doi.org/10.1007/s00253-010-2622-3
Cheng, K.-C., Demirci, A., & Catchmark, J. M. (2010b). Enhanced pullulan production in
a biofilm reactor by using response surface methodology. Journal of Industrial
Microbiology & Biotechnology, 37, 587–594. http://doi.org/10.1007/s10295-010-
0705-x

180
Demirci, A., Pometto, A. L. I., & Ho, K. L. G. (1997). Ethanol production by
Saccharomyces cerevisiae in biofilm reactors. Journal of Industrial Microbiology &
Biotechnology, 19, 299–304. http://doi.org/10.1038/sj.jim.2900464
Diaz, J. T., Chinn M., & Truong, V. D. (2014). Simultaneous saccharification and
fermentation of industrial sweetpotatoes for ethanol production and anthocyanins
extraction. Industrial Crops and Products, 62, 53–60.
Dykstra, M. J. (1992). Biological electron microscopy: theory, techniques, and
troubleshooting. New York: Plenum Press.
Ercan, D., & Demirci, A. (2014). Enhanced human lysozyme production in biofilm
reactor by Kluyveromyces lactis K7. Biochemical Engineering Journal, 92, 2–8.
http://doi.org/10.1007/s00253-013-4944-4
Ercan, D., & Demirci, A. (2015). Current and future trends for biofilm reactors for
fermentation processes. Critical Reviews in Biotechnology, 35, 1–14.
http://doi.org/10.3109/07388551.2013.793170
Fujii, N., Oki, T., Sakurai, a, Suye, S., & Sakakibara, M. (2001). Ethanol production
from starch by immobilized Aspergillus awamori and Saccharomyces pastorianus
using cellulose carriers. Journal of Industrial Microbiology & Biotechnology,
27(June), 52–57. http://doi.org/10.1038/sj.jim.7000162
Germec, M., Turhan, I., Karhan, M., & Demirci, A. (2015). Ethanol production via
repeated-batch fermentation from carob pod extract by using Saccharomyces
cerevisiae in biofilm reactor. Fuel, 161, 304–311.
http://doi.org/10.1016/j.fuel.2015.08.060
Hall, J. L., & Hawes, C. R. (1991). Electron microscopy of plant cells. San Diego:
Academic Press Inc.
Hashem, M., & Darwish, S. M. I. (2010). Production of bioethanol and associated by-
products from potato starch residue stream by Saccharomyces cerevisiae. Biomass
and Bioenergy, 34(7), 953–959. http://doi.org/10.1016/j.biombioe.2010.02.003
Ho, K. L., Pometto, A. L., Hinz, P. N., & Demirci, A. (1997). Nutrient leaching and end
product accumulation in plastic composite supports for L-(+)-lactic acid biofilm
fermentation. Applied and Environmental Microbiology, 63(7), 2524–2532.
Izmirlioglu, G., & Demirci, A. (2012). Ethanol production from waste potato mash by
using Saccharomyces cerevisiae. Applied Sciences, 2, 738–753.
http://doi.org/10.3390/app2040738
Lee, W. S., Chen, I. C., Chang, C. H., & Yang, S. S. (2012). Bioethanol production from
sweet potato by co-immobilization of saccharolytic molds and Saccharomyces
cerevisiae. Renewable Energy, 39(1), 216–222.
http://doi.org/10.1016/j.renene.2011.08.024
Lemmel, S. A., Heimsch, R. C., & Korus, R. A. (1980). Kinetics of growth and amylase
181
production of Saccharomycopsis fibuligera on potato processing wastewater.
Applied and Environmental Microbiology, 39(2), 387–393.
Liu, R., & Shen, F. (2008). Impacts of main factors on bioethanol fermentation from stalk
juice of sweet sorghum by immobilized Saccharomyces cerevisiae (CICC 1308).
Bioresource Technology, 99(4), 847–854.
http://doi.org/10.1016/j.biortech.2007.01.009
Mojović, L., Pejin, D., Grujić, O., Markov, S., Pejin, J., Rakin, M., … Savić, D. (2009).
Progress in the production of bioethanol on starch-based feedstocks. Chemical
Industry and Chemical Engineering Quarterly, 15(4), 211–226.
http://doi.org/10.2298/CICEQ0904211M
Norouzian, D., Akbarzadeh, A., Scharer, J. M., & Moo Young, M. (2006). Fungal
glucoamylases. Biotechnology Advances, 24, 80–85.
http://doi.org/10.1016/j.biotechadv.2005.06.003
Oberoi, H. S., Vadlani, P. V., Saida, L., Bansal, S., & Hughes, J. D. (2011). Ethanol
production from banana peels using statistically optimized simultaneous
saccharification and fermentation process. Waste Management, 31(7), 1576–1584.
http://doi.org/10.1016/j.wasman.2011.02.007
Pietrzak, W., & Kawa-Rygielska, J. (2015). Simultaneous saccharification and ethanol
fermentation of waste wheat–rye bread at very high solids loading: Effect of
enzymatic liquefaction conditions. Fuel, 147, 236–242.
http://doi.org/10.1016/j.fuel.2015.01.057
Pometto, A. L. I., A.Demirci, & Johnson, K. E. (1997). Immobilization of
microorganisms on a support made of synthetic polymer and plant material. US.
Pongtharangkul, T., & Demirci, A. (2006). Evaluation of culture medium for nisin
production in a repeated-batch biofilm reactor. Biotechnology Progress, 22, 217–
224. http://doi.org/10.1021/bp050295q
RFA. (2015). Going Global 2015 Ethanol Industry Outlook. Retrieved January 1, 2016,
from http://www.ethanolrfa.org/wp-
content/uploads/2015/09/c5088b8e8e6b427bb3_cwm626ws2.pdf
Suresh, K., Kiran sree, N., & Venkateswer Rao, L. (1999). Utilization of damaged
sorghum and rice grains for ethanol production by simultaneous saccharification and
fermentation. Bioresource Technology, 68, 301–304. http://doi.org/10.1016/S0960-
8524(98)00135-7
Velázquez, a. C., Pometto, a. L., Ho, K. L. G., & Demirci, a. (2001). Evaluation of
plastic-composite supports in repeated fed-batch biofilm lactic acid fermentation by
Lactobacillus casei. Applied Microbiology and Biotechnology, 55, 434–441.
http://doi.org/10.1007/s002530000530
Ylitervo, P., Franzén, C. J., & Taherzadeh, M. J. (2011). Ethanol production at elevated
temperatures using encapsulation of yeast. Journal of Biotechnology, 156, 22–29.

182
CHAPTER 8
CONCLUSION AND SCOPE FOR FUTURE RESEARCH
This study was designed to evaluate the potential of industrial potato waste for bioethanol
fermentation using simultaneous saccharification and fermentation process with
integration of biofilm cell immobilization.
First, various amylase producing microorganisms were screened to identify the
microorganism for amylase production. Among the four evaluated microbial species,
Aspergillus niger van Tieghem was found to be the best glucoamylase-producing fungus.
Later, a medium screening design was conducted using the Plackett-Burman statistical
design. Among the tested ingredients, malt extract, FeSO4·7H2O, and CaCl22H2O were
found to have statistically-significant effects on the glucoamylase production. Finally,
malt extract, FeSO4·7H2O, and CaCl22H2O were optimized by using the response
surface methodology and the results showed that the optimal medium composition for A.
niger van Tieghem was 50 g/L of industrial waste potato mash supplemented with 51.82
g/L of malt extract, 9.27 g/L of CaCl22H2O, and 0.50 g/L of FeSO4 7H2O . At the end
of the optimization, glucoamylase activity and glucose production were improved 126
and 98% compared to only industrial waste potato mash basal medium and 274.4 U/ml
glucoamylase activity and 41.7 g/L glucose levels were achieved, respectively (Chapter
3). Figure 8.1 represents the achieved improvement in glucoamylase production by
medium optimization.

183
Figure 8.1. Enhancement of enzyme activity by Aspergillis niger NRRL 330 by medium
optimization.
In addition, optimization of medium for Saccharomyces cerevisiae using industrial potato
waste was studied. The effect of various medium components on ethanol production by S.
cerevisiae was evaluated. Yeast extract, malt extract, and MgSO4·7H2O presented
significantly positive effects, whereas KH2PO4 and CaCl2·2H2O had a significantly
negative effect (p-value < 0.05). Using response surface methodology, a medium consisting
of 40.4 g/L (dry basis) industrial waste potato, 50 g/L malt extract, and 4.84 g/L
MgSO4·7H2O was found optimal and yielded 24.6 g/L ethanol at 30°C, 150 rpm, and 48 h of
fermentation (Chapter 4). Figure 8.2 visualizes the improvements in ethanol production.
After the medium optimization for A. niger and S. cerevisiae separately, a medium for
simultaneous saccharification and fermentation (SSF) by using co-cultures of Aspergillus
niger and Saccharomyces cerevisiae was defined and optimized. A medium consisted of
waste potato mash, malt extract and FeSO47H2O was defined as a promising medium for
co-culture of A. niger and S. cerevisiae SSF. Statistical optimization of defined medium
0
20
40
60
80
100
120
140
160
180
200
Strain Selection Plackett-Burman Central Composite
Glucose (g/L) Enzyme Activity (U/ml)

184
was conducted using central composite design. Optimization results suggested that
optimum concentrations of industrial waste potato mash, malt extract, and FeSO47H2O
were 92.37 g/L, 59.42 g/L and 0.159 g/L, respectively. Under the optimal medium, 35.19
g/L ethanol production and 31.36 U/ml enzyme activity giving a yield of 0.38 g
ethanol/g starch and 0.34 U/ g starch respectively, achieved at 30°C and 120 h of
fermentation (Chapter 5).
Figure 8.2 Improvement of ethanol production by medium optimization.
Furthermore, biofilm reactors have been utilized as a novel approach for production of
bioethanol from potato waste hydrolysate by optimizing the growth parameters for
Saccharomyces cerevisiae in biofilm reactor. First of all, in order to achieve a successful
biofilm formation, plastic composite supports (PCS) evaluated and the PCS composed of
polypropylene, soybean hull, soybean flour, yeast extract, and salts was selected for
ethanol fermentation with S. cerevisiae. Then, Box-Behnken design of response surface
method (RSM) was employed to optimize the growth parameters, pH, temperature, and
agitation. Optimum conditions for ethanol fermentation was found to be pH 4.2,
0
5
10
15
20
25
30
Basal Medium (WPM) Plackett-Burman Medium Optimized Medium
Eth
ano
l (g/
L)
185
temperature 34ºC, and 100 rpm resulting 37.05 g/L ethanol with a 2.31 g/L/h productivity
and 92.08% theoretical yield (Chapter 6).
Lastly, simultaneous saccharification and fermentation (SSF) of ethanol by co-cultures of
Aspergillus niger and Saccharomyces cerevisiae was studied in a potato waste based
medium by using biofilm reactors. The plastic composite supports (PCS) were studied for
biofilm formation. Effects of temperature, pH, and aeration rates in biofilm reactors were
evaluated by response surface methodology and the optimal conditions were found to be
35 ºC, pH 5.8, and no aeration. The maximum ethanol concentration of 37.93 g/L was
achieved at the end of 72h fermentation, with a 0.41 g ethanol /g starch yield. Finally,
biofilm formation of co-culture on PCS was also evaluated by scanning electron
microscope and this study showed PCSs can be applied for co-culture fermentations as
well as single culture (Chapter 7).
In conclusion, bioethanol production was enhanced. Optimization of the medium and
growth conditions for simultaneous saccharification and fermentation, and integration of
novel cell immobilization techniques further improved the ethanol production.
As future research, following points can be studied to improve the process further:
It is required to overcome the issues related to the viscosity of potato for biofilm
reactors. Because potato slurry has a high viscosity, handling the medium was
difficult especially during medium transferring caused tubing clogging. Another
reason for studying viscosity might be the high gravity fermentation. Ethanol yield
could increase with increased solid load. However, viscosity of potato would be
challenging. Therefore, a treatment with viscosity reduction enzyme or a pre-
fermentation with a microorganism that secretes viscosity reducing enzymes could
solve the problem.
Medium optimization studies suggested use of malt extract as a supplement. Since
malt extract is also a source of carbon, future research may be conducted to determine
whether malt extract is used up for solely biomass production or any portion of it

186
utilized for product formation. A. niger is capable of producing various enzymes. The
possibility of production of other enzymes to break down the complex carbohydrates
of malt extract should also be studied. Additionally, malt extract is an expensive
source of nitrogen. Inexpensive nitrogen sources should be studied to replace the malt
extract without compromising the ethanol yield and enzyme activity.
It is well known that amylases perform better at elevated temperatures while optimal
working temperature for yeast is at mesophilic range. Evaluation of thermophilic
ethanol producing microorganisms, such as thermotolerant Kluyveromyces species,
for SSF processes may overcome this issue. At high temperatures, a higher ethanol
yields can be achieved as a result of better enzyme activity and faster glucose
conversion. The study can be extended to the engineered the thermophilic ethanol
producer for high productivity to compete with the industrial strains.
Even though, substrate inhibition is eliminated in SSF processes, product inhibition is
still of concern for ethanol fermentation. As a solution to this, online product
recovery can be investigated. After product removal, the broth could be circulated
back to the reactor for maximum enzyme activity. Another option could be removal
of ethanol and amylase enzyme simultaneously, in which having enzyme as a by-
product can reduce the cost of ethanol.
Another progression of this study is to analyze the different fermentation processes,
such as fed-batch, continuous, and mixed culture. Fed-batch and continuous
fermentations can increase the productivity especially when coupled with online
product recovery. On the other hand, a mix culture of α-amylase and glucoamylase
producer microorganisms may improve the glucose conversion rates and increase the
ethanol yield, while reducing the fermentation time would decrease the ethanol cost.
Moreover, future research should assess the biofilm formation characteristics of co-
culture. This study showed that mold and yeast can form biofilm together, however,
many unknowns still awaiting to be discovered, such as what the structure of the
biofilm is for mold-yeast culture, how two microorganisms communicate, how they
benefit from each other in this microenvironment, etc.

187
Another area that should be further investigated is the evaluation of biofilm
formation. In this study, scanning electron microscopy (SEM) was employed for the
evaluation of biofilm formation. However, scanning the whole surface of the PCS
was not practical, therefore, randomly selected areas were evaluated by SEM.
Another limitation of SEM is the possible loss of biofilm during sample preparation
for SEM. Therefore, different microscopic methodologies may be compared for
evaluation of biofilm formation on PCS tubes and the most suitable methodology
might be selected.
Previous studies showed that PCS may leach nutrient during fermentation. Also,
product might be absorbed by the PCS as it was also reported earlier studies.
Therefore, a detailed mass balance study should be performed by considering nutrient
leaching from PCS as well as enzyme absorbance of the PCS.
To find an application in the ethanol industry, a scale-up study should be conducted.
A biofilm reactor with PCS for a plant scale may be designed with several scale-up
strategies, for example mixing time, Reynold’s number, and mass transfer coefficient.

188
CURRICULUM VITA
Gulten Izmirlioglu
EDUCATION
2010- Present Ph.D.in Agricultural and Biological Engineering, The Pennsylvania State
University, University Park, PA
Dissertation: Simultaneous saccharification and fermentation of waste potato mash to ethanol by
Aspergillus niger and Saccharomyces cerevisiae in biofilm reactors
2008-2010 M.Sc in Agricultural and Biological Engineering, The Pennsylvania State
University, University Park, PA
Thesis: Ethanol production from waste potato mash using Saccharomyces cerevisiae
2002-2006 B.S. in Food Engineering, Ankara University, Ankara, Turkey
PUBLICATIONS
Peer-reviewed:
Izmirlioglu, G., Demirci, A. 2012. Ethanol production from waste potato mash by using
Saccharomyces cerevisiae. Applied Sciences. 2: 738-753.
Izmirlioglu G., and A. Demirci. 2015. Strain selection and medium optimization for
glucoamylase production from industrial potato waste by Aspergillus niger. Journal of the
Science of Food and Agriculture. In-print.
Izmirlioglu G., and A. Demirci. 2015. Enhanced bio-ethanol production from industrial potato
waste by statistical medium optimization. Int. J. Mol. Sci. 16, 24490-24505.
Izmirlioglu G., and A. Demirci. 2016. Improved simultaneous saccharification and fermentation
of bioethanol from industrial potato waste with co-cultures of Aspergillus niger and
Saccharomyces cerevisiae by medium optimization. Fuel. 185, 684-691.
Izmirlioglu G., and A. Demirci. 2016. Ethanol production in biofilm reactors from potato waste
hydrolysate and optimization of growth parameters for Saccharomyces cerevisiae. Fuel.181,
643-651.
Izmirlioglu G., and A. Demirci. 2016. Simultaneous saccharification and fermentation of ethanol
from potato waste by co-cultures of Aspergillus niger and Saccharomyces cerevisiae in
biofilm reactors. In-review.
Book chapters:
Demirci, A., G. Izmirlioglu, and D. Ercan. 2014. Fermentation and enzyme technologies in food
processing: In Principles and Applications, 2nd Edition, S. Clark, S. Jung, and B. Lamsal,
Eds. Wiley-Blackwell, Hoboken, NJ.


![Simultaneous Saccharification and Fermentation of … 2016, 21, 1380 3 of 14 of galactose and rhamnose [15–17]. All of these building blocks were detected in our study during hydrolysis](https://img.dokumen.tips/doc/110x75/5af0bf0d7f8b9abc788d9350/simultaneous-saccharification-and-fermentation-of-2016-21-1380-3-of-14-of.jpg)