Embed Size (px)
Citation preview

____________________________________________________________________________________________
*Corresponding author: Email: [email protected], [email protected];
British Journal of Pharmaceutical Research4(13): 1568-1590, 2014
SCIENCEDOMAIN internationalwww.sciencedomain.org
Simultaneous Quantification of Mesalamine andIts Metabolite N-Acetyl Mesalamine in HumanPlasma by LC-MS/MS and Its Application to a
Bioequivalence Study
Kanchanamala Kanala1,2*, Nagiat T. Hwisa3, Babu Rao Chandu3,Fathi H. Assaleh3, K. Mukkanti4, Prakash Katakam3
and Bala Sekhara Reddy Challa5
1Research and Development, Jawaharlal Nehru Technological University AnantapurAndhrapradesh, India.
2Department of Pharmaceutics, Ratnam Institute of Pharmacy, Pidatapolur, Muthukur,Nellore, Andhrapradesh, India.
3Faculty of Pharmacy, University of Zawia, Al-Zawia, Libya.4Research and Development, Jawaharlal Nehru Technological University Hyderabad,
Andhrapradesh, India.5Department of Pharmaceutical Analysis, Vagdevi College of Pharmacy, Gurazala, Guntur,
Andhrapradesh, India.
Authors’ contributions
This work was carried out in collaboration between all authors. Authors KM, BRC and KKdesigned the study, author KM performed the statistical analysis, wrote the protocol, andwrote the first draft of the manuscript. Authors NTH, FHA and PK managed the literature
search. All authors read and approved the final manuscript.
Received 16th June 2013Accepted 3rd June 2014
Published 21st June 2014
ABSTRACT
Liquid chromatography–tandem mass spectrometry (LC–MS/MS) was used forsimultaneous quantification of mesalamine and its metabolite N-acetyl mesalamine inhuman plasma with N-acetyl mesalamine D3 as an internal standard (IS).Chromatographic separation was performed on a Thermo, HyPURITY C18 (150 x 4.6mm, 5 m) column with an isocratic mobile phase composed of 10 mM ammonium
Original Research Article

British Journal of Pharmaceutical Research, 4(13): 1568-1590, 2014
1569
acetate and methanol in the ratio of 85:15 (%v/v), at the flowrate of 0.6 mL/min. The drug,metabolite and internal standard were extracted by liquid-liquid extraction. The methodwas validated over a linear concentration range of 2-1500 ng/mL for mesalamine and 10-2000 ng/ml for N-acetyl mesalamine, which demonstrated intra and inter-day precisionranging from 1.60 to 8.63% and 2.14 to 8.67% for mesalamine and 0.99 to 5.67% and1.72 to 4.89% for N-acetyl mesalamine respectively. Similarly, the intra- and inter-dayaccuracy varied from 102.70 to 105.48% and 100.64 to 103.87% for mesalamine, 99.64 to106.22% and 100.71 to 104.27% for N-acetyl mesalamine respectively. Both analyteswere found to be stable throughout freeze–thawing cycles, bench top and postoperativestability studies. The method was successfully applied to support a bioequivalance studyof healthy subjects.
Keywords: Mesalamine; N-Acetyl mesalamine; LC/MS/MS; bioequivalence; pharmacokinetics.
1. INTRODUCTION
Mesalazine (INN, BAN), also known as mesalamine (USAN) or 5-aminosalicylic acid (5-ASA), is an anti-inflammatory drug used to treat inflammation of the digestive tract (Crohn'sdisease) and mild to moderate ulcerative colitis. Mesalazine is a bowel-specificaminosalicylate drug that is metabolized in the gut and has its predominant actions there,thereby having fewer systemic side effects. As a derivative of salicylic acid, 5-ASA is also anantioxidant that traps free radicals, which are potentially damaging by-products ofmetabolism. The major metabolite of mesalamine (5-aminosalicylic acid) is N-acetyl-5-aminosalicylic acid or N-acetyl mesalamine. Its formation is brought about by N-acetyltransferase activity in the liver and intestinal mucosa [1,2]. The recommended dosagefor the induction of remission in adult patients with active, mild to moderate ulcerative colitisis two to four 1.2g tablets to be taken once daily with meal for a total daily dose of 2.4g or4.8g [3,4]. Treatment duration in controlled clinical trials was up to 8 weeks. The totalabsorption of mesalamine from Lialda® 2.4g or 4.8g given once daily for 14 days to healthyvolunteers was found to be approximately 22% of the administered dose. Mesalamine isapproximately 43% bound to plasma proteins at the concentration of 2.5 µg/mL. Mesalamineis mainly eliminated of via the renal route following metabolism to N-acetyl-5-aminosalicylicacid (acetylation). However, there is also limited parent drug excreted in urine. Of theapproximately 22% of the dose absorbed, less than 8% of the dose compared with greaterthan 13% for N-acetyl-5- aminosalicylic acid was excreted unchanged in the urine [5-7].
The apparent terminal half-lives for mesalamine and its major metabolite were, on averageof 8 h. About 80% of N-Ac-5-ASA is bound to plasma proteins, whereas 40% of mesalamineis protein bound. The mean elimination half-life was 5 h for 5-ASA, and 6 h for N-acetyl-5-ASA following the initial dosing. At steady state, the mean elimination half-life was 7 h forboth 5-ASA and N-acetyl-5-ASA. Despite its effectiveness in Crohn's disease and mild tomoderate ulcerative colitis the use of Mesacol®, the original product, is limited as it is veryexpensive [8-9]. Availability of a more cost effective generic drug product will increasepatient accessibility, but it requires bioequivalence data to prove the generic drug product istherapeutically equivalent and can be used interchangeably with the brand name product[10-11]. Literature survey reveals several methods for quantification of mesalamine and N-Acetyl mesalamine by using LC-MS [12-16], HPLC [17-31], micellar electrokinetic capillarychromatography [32], differential pulse voltammetry [33], voltammetric studies [34] werereported. Amongthem , LC-MS [12-16] methods are most accurate. These methods were

British Journal of Pharmaceutical Research, 4(13): 1568-1590, 2014
1570
developed in biological matrices [12-14], Table 1, Gu et al. [12] reported sulphasalazine, itsmain metabolite sulphapyridine and 5-aminosalicylic acid in human plasma by LC-MS/MSand established pharmacokinetic study. The methods developed by Pastorini et al. [13] andNobilis, et al. [14] require larger volumes of plasma sample for extraction. These methods[12-14] have some drawbacks in terms of sensitivity, extraction procedure, repeatability andmatrix effect issues.
The main purpose of the present study is to develop and validate simple extraction method(LLE), high sensitive (5 times higher than that proposed by Gu GZ et al. [12], rugged andreproducible bioanalytical method. At the same time suitable deuterated internal standardwas used to compare analytes. Finally, the method was used to compute thepharmacokinetic parameters of two brands of mesalamine 400mg enteric coated tablets andthen to evaluate the bioequivalence between the two Mesacol®(SUN Pharma Ltd., India)was selected as the reference produce, while APL Research Centre brand (Pv.T., Ltd,India) as the test formulation.
2. MATERIALS AND METHODS
2.1 Chemicals and Standards
Mesalamine, N-Acetyl mesalamine, and N-Acetyl mesalamine D3 (Fig. 1) were obtainedfrom Aurobindo Pharma Ltd. (Hyderabad, India). Ammonium acetate, formic acid, propionicanhydride (all in reagent grade) were obtained from Merck Specialities (Mumbai, India).Methanol, Acetonitrile and Methyl-t-butyl ether (HPLC grade) were purchased fromJ.T.Baker (Mumbai, India).
Fig. 1. Chemical structures of Mesalamine (a), N-Acetyl Mesalamine (b) and N-AcetylMesalamine-D3 (c)
Test product: 400mg (APLRC)Batch No: 006Manufacturer: APL Research Centre(APLRC), Hyderabad, India.Reference product: Mesacol® 400 mg tabletsBatch No: 7D0912Manufacturer: SUN Pharma Ltd.,Baroda, India.The label claim of each study product was 400 mg. The clinical study was conducted atClinical and Pharmacological Research Unit, AXIS Life Sciences (Hyderabad,India.),sponsored by APL Research Centre, (a division of Aurobindo pharma Pv.t. Ltd., India).

British Journal of Pharmaceutical Research, 4(13): 1568-1590, 2014
1571
Table 1. The available LC-MS methods in the literature
Proposedmethod
Ref. 12 Ref. 13 Ref . 14
Type ofextractionmethod
LLE PPT with0.3mL of methanol
PPT with1.0mL ofmethanol
PPT BY HCLO4followed by LLEDerivatization
Plasmausage
100µL 100µL 490uL plasma 1 mL
IS N-AcetylmesalamineD3
dimenhydrinate 4-ASA and N-Ac-4-ASA
N-acetyl-4-ASAandN-propionyl-4-ASA
LOQ 2.0 ng/mL 10.0 ng/mL 50.0 ng/mL 43.3 ng/mLLinearity 2.0-1500.0
ng/mL forMesalamineand 10.0-2000.0 ng/mlfor N-acetylMesalamine.
10–10,000ng/mL(r>0.99) forsulphasalazineand 10–1000ng/mLfor sulphapyridineand 5-minosalicylicacid
50-4000ng/mL
43.3-4966.7 ng/mL
Instrument LC–MS/MSAPI-4000
API-3000 LC–MS/MS
HPLC HPLC, MS
Column Thermo,HyPURITYC18 (150 x4.6 mm, 5m)
XBP Phenyl column(100mm×2.1mm,5m)
SynergiHydro-RP(4m,150mm×2.0mm i.d.)protected by aguard col-umn(4m,10mm×2.0mmi.d.), bothsupplied byPhenomenex
LiChroCART®250mm×4mm columnpacked withPurospher RP-18e,5m andprecolumnLiChroCART®4-4with the samestationary phase
Mobilephase
10mMammoniumacetate andmethanol inthe ratio of85:15 (%v/v)
0.2% formic acid,2mM ammoniumacetate in water(mobile phase A)and 0.2% formicacid, 2mMammonium acetatein methanol (mobilephase B) by usinggradient elution
17.5mmol/Lacetic acid (pH3.3):acetonitrile85:15 (v/v)
acetonitrile–0.01MNa2HPO4buffer pH 3 in the15:85 ratio (v/v)
Retentiontime
12 min 9 min 10 min 23 min
PK 400mgTablet to34 healthyvolunteer
250mg SASPTablet to 10 healthyvolunteer
1200mg Tabletto 24 healthyvolunteers
500mg Tablet to14 healthyvolunteers
British Journal of Pharmaceutical Research, 4(13): 1568-1590, 2014
1572
2.2 Instrumentation and Conditions
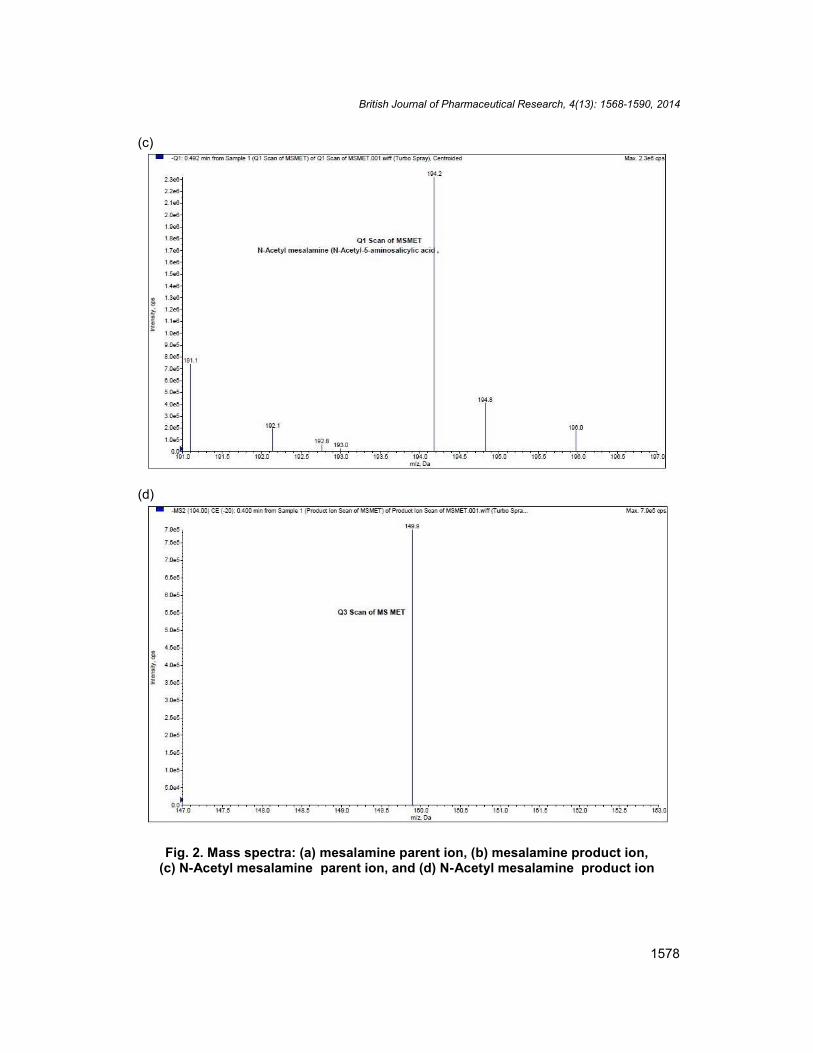
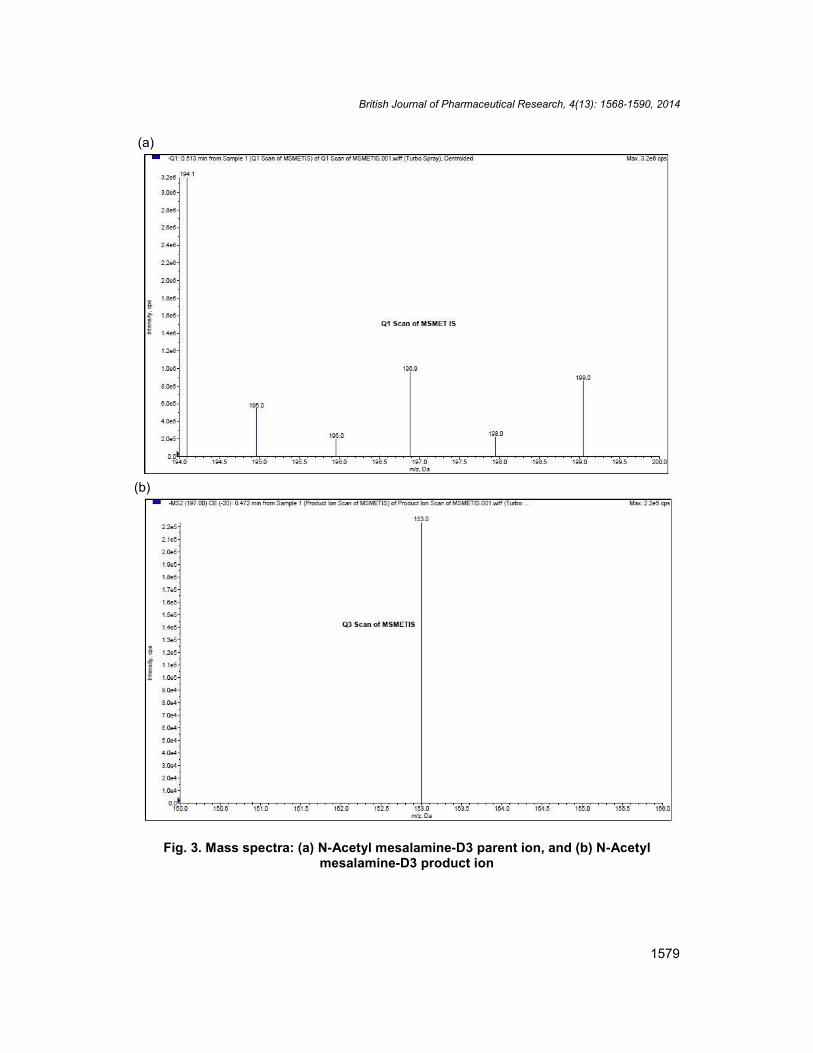
The LC system was manufactured by (Agilent Technologies, model series 1200, Waldbronn,Germany). Mass spectrometric detection was performed on an API 4200 triple quadrupoleinstrument (ABI-SCIEX, Toronto, Canada). Data were processed on Analyst 1.5.1 softwarepackage (SCIEX). Turbo ion spray (IS) negative mode with Unit Resolution, MRM was usedfor the detection. For mesalamine and N-acetyl mesalamine the [M-H]- were monitored atm/z 152.0 and m/z 194.2 as the precursor ion, and a fragment at m/z 108.0 and m/z 149.9as the product ion, respectively. For internal standard N-Acetyl mesalamine D3 the [M-H]-
was monitored at m/z 169.9 as the precursor ion and a fragment at m/z: 153.0, as theproduct ion. Mass parameters were optimized as source temperature 650ºC, nebulizer gas20 psi, heater gas 30 psi , curtain gas 30 psi, CAD gas 4 psi, IS voltage - 2000 volts, sourceflow rate 600 µL/min without split, entrance potential 10 V, Collision cell exit potential (CXP)12 V, Declustering potential (DP) 50 V, collision energy (CE) 35 V for mesalamine, N-acetylmesalamine, and N-Acetyl mesalamine D3, respectively.
2.3 Chromatographic Condition
Chromatography was performed on a Thermo, Hypurity-C18 (150 x 4.6 mm, 5 m) column.The mobile phase used as 10mM ammonium acetate: methanol, 85:15 v/v at the flow rate of0.6 mL/min. Injection volume was 10µL, column temperature was 40ºC with an isocraticelution mode.
2.4 Calibration and Quality Control Standards
Calibration curve of mesalamine/N-Acetyl mesalamine was prepared within theconcentration range of 2.00-1500.00 ng/mL (2, 4, 10, 75, 150, 300, 600, 900, 1200 and 1500ng/mL) for mesalamine and 10-2000 ng/mL (10, 20, 50, 100, 200, 400, 800, 1200,1600 and2000 ng/mL) for N-Acetyl mesalamine (r2 > 0.998). The calibration curve consisted of onereplicate of 10 non-zero standards. The concentrations of quality control (QC) samples were2, 6, 450 and 1050 ng/mL for mesalamine and 10, 30, 600 and 1400 ng/mL for N-Acetylmesalamine as low (LQC), middle (MQC) and high (HQC) concentrations, respectively.
2.5 Sample Preparation
Liquid-liquid extraction was used for extraction of drug and IS. For this purpose, an 100 μLinternal standard solution (150 ng/mL of N-Acetyl mesalamine-D3) was added to 100 µL ofplasma sample (respective concentration) into riavial. To this, 25 µL of derivatisationsolution(10% propionic anhydride in methanol) was added and vortexed briefly. After that,100 µL of 0.5% formic acid was added into each tube and vortexed briefly again. Then, 3 mLof methyl t-butyl ether was added and vortexed for 10 minutes. Samples were thencentrifuged for 5 minutes at 4000 rpm at 20ºC. Supernatant from each sample wastransferred into ria vial and evaporated to dryness. This was followed by reconstitution with800 µL of reconstitution solution (10 mM ammonium acetate : methanol, 85:15 v/v). andvortex briefly. From this, 5 μL of sample was injected into the LC–MS/MS system throughthe autosampler.

British Journal of Pharmaceutical Research, 4(13): 1568-1590, 2014
1573
2.6 Method Validation
2.6.1 Selectivity and specificity
The selectivity of the method was determined by six different human blank plasma samples,which were pretreated and analyzed to test the potential interferences of endogenouscompounds co-eluting with analyte and IS. Chromatographic peaks of analyte and IS wereidentified based on their retention times and MRM responses. The peak area of mesalamineand N-Acetyl mesalamine at the respective retention time in blank samples should not bemore than 20% of the mean peak area of LLOQ of mesalamine and N-Acetyl mesalamine.Similarly, the peak area of N-Acetyl mesalamine -D3 at the respective retention time in blanksamples should not be more than 5% of the mean peak area of LLOQ of N-Acetylmesalamine-D3.
2.6.2 Matrix effect
To predict the variability of matrix effects in samples from individual subjects, matrix effectwas quantified by matrix factor, which was calculated as Peak response ratio in presence ofextracted matrix (post extracted) to peak response ratio in aqueous standardsSix lots ofblank biological matrices were extracted each in triplicates and post spiked with the aqueousstandard at the Mid QC level, and compared with aqueous standards of same concentration.The overall precision of the matrix factor is expressed as coefficient of variation (CV in %)should be < 15%.
2.6.3 Linearity, precission and accuracy
The calibration curve was constructed using values ranging from 2.0 to 1500.0 ng/mL formesalamine and 10.0 to 2000.0 ng/mL for N-Acetyl mesalamine in human plasmarespectively. Calibration curve was obtained by linear model with weighted 1/x2 regressionanalysis. The peak area ratio of mesalamine / N-Acetyl mesalamine-D3 was plotted againstthe mesalamine concentration in ng/mL for mesalamine. The peak area ratio of N-Acetylmesalamine / N-Acetyl mesalamine-D3 was plotted against the N-Acetyl mesalamineconcentration in ng/mL for N-Acetyl mesalamine. Calibration curve standard samples andquality control samples were prepared in replicates (n=6) for analysis. Precision andAccuracy for the back calculated concentrations of the calibration points, should be within≤15 and ± 15% of their nominal values. However, for LLOQ, the Precision and Accuracyshould be within ≤ 20 and ± 20%.
2.6.4 Recovery
The extraction recovery of mesalamine / N-Acetyl mesalamine and N-Acetyl mesalamine -D3 from human plasma was determined by analyzing quality control samples. Recovery atthree concentrations (6, 450 and 1050 ng/mL for mesalamine and 30,600 and 1400 ng/mLfor N-Acetyl mesalamine) was determined by comparing peak areas obtained from theplasma sample and those from the standard solution spiked with the blank plasma residue.A recovery of more than 50% was considered adequate to obtain required sensitivity.
British Journal of Pharmaceutical Research, 4(13): 1568-1590, 2014
1574
2.6.5 LOQ and LOD
The response (peak area) was determined in blank plasma samples (six replicates fromdifferent plasma) and spiked LOQ sample prepared from the same plasma was determined.The peak area of blank samples should not be more than 20% of the mean peak area ofLOQ of mesalamine/ N-Acetyl mesalamine and not more than 5% of N-AcetylmesalamineD3. The precision and mean accuracy of the back calculated LOQ replicateconcentrations must be ≤ 20 and ± 20%, respectively. The limit of detection (LOD) is aparameter providing the lowest concentration in a sample that can be detected frombackground noise but can not be quantitated. LOD was determined using the signal-to-noiseratio (s/n) of 3:1 by comparing test results from samples with known concentrations ofanalyte with blank samples.
2.6.6 Stability
Low quality control and high quality control samples (n=6) were retrieved from deep freezerafter three freeze-thaw cycles according to the clinical protocols. Samples were stored at−30ºC in three cycles of 24, 36 and 48 h. In addition, the long-term stability of mesalamine /N-Acetyl mesalamine in quality control samples was also evaluated by analysis after 62 daysof storage at −30ºC. Autosampler stability was studied following 48 h storage period in theautosampler tray with control concentrations. Bench top stability was studied for period of 25h with control concentrations. Stability samples were processed and extracted along with thefreshly spiked calibration curve standards. The precision and accuracy for the stabilitysamples must be within ≤ 15 and ± 15% of their nominal concentrations, respectively.Stability of the mesalamine / N-Acetyl mesalamine, N-Acetyl mesalamine-D3 in stocksolution was evaluated for 9 days with comparision of freshly prepared stock solutions.Similarly stability of N-Acetyl mesalamine-D3 working solution was also proved for 9 dayswith comparision of freshly prepared working solutions
2.7 Bio Equivalence Study
2.7.1 Study subjects
The study was carried out in accordance with the current revision of the Declaration ofHelsinki concerning medical research in humans. Study protocol was approved by IEC(Institutional Ethics committee) as per DCGI (Drug control general of india). Thirty fourhealthy male subjects were included in the study. All volunteers gave a written informedconsent prior to participation, after they had been thoroughly informed and they understoodthe nature and details of the study. All clinical laboratory tests were performed by the ISO15189 certified laboratories. The daily results of the clinical laboratory tests including thequality control data were verified by its own independent quality assurance personnel beforereporting. Subject inclusion criteria included Indian male, aged between 18-45 years, noconsumption of drugs or food supplements for 4 weeks prior to the study, and noparticipation in any bioavailability or bioequivalence study at least 30 days prior to thepresent study.
2.7.2 Study design
The study was conducted as an open label, randomized two-period, two-sequence, single-dose crossover bioequivalence study under fasting condition, and a wash-out period of 14

British Journal of Pharmaceutical Research, 4(13): 1568-1590, 2014
1575
days. All subjects arrived at the clinical research laboratory, at least 12 h prior to the start ofthe study. They were housed in an air-conditioned facility and were given a standard dinner,which was finished at least 10 h before dosing in each period of the study. On the day ofdrug dosing in period 1, volunteers were randomly assigned to one of two treatmentsequences TR (sequence 1) or RT (sequence 2), as indicated in a pre-printed randomizationscheme, Subjects in sequence 1 received treatment T at the first dosing period and thencrossed over to receive treatment R at the second dosing period (after the 7-day washoutperiod). Subjects in sequence 2 received treatments in the order of R and T at the twodosing periods. The subjects administered the assigned mesalamine formulation with 240mL of plain drinking water. This was followed by an oral cavity check to ensure completion ofthe dose administration. Subjects were required to refrain from lying down during the first 4 hafter intaking the tablet. No meal was permitted until 4 h after dosing. Drinking water wasrestricted from 1 h before dosing till 2 h after excess water intake (> 100 mL/h) was notpermitted. Lunch, snacks, and dinner were served as per the scheduled time. All subjectsabstained from any xanthine-containing food or beverages for at least 72 h and alcoholicproducts for at least 7 days prior to formulation administration and throughout the samplingschedule during each period. No concomitant medication was permitted during the studyperiod.
2.7.3 Blood sampling
Blood samples were collected as the pre-dose 5 minutes prior to dosing followed by furthersamples at 2, 3, 4, 5, 6, 7, 8,9,10,11,12.5,14,16, 18, 20,22, 24, 26, 28, 30, 32, 36, 40, 44, 48,60, 72, 84 and 96 h after dosing 2.5 mL blood was collected each time in vaccutainerscontaining K2EDTA. A total of 60 time points (30 for Reference, 30 for Test) were collectedby using centrifugation 3200 rpm, 10ºC, 10 min and stored below -30ºC until sampleanalysis. Test and reference mesalamine tablets were administered to same humanvolunteers under fasting conditions separately with proper washing periods as per protocol(comparative, randomized, 2-way crossover) approved by IEC. During the sample collection,all subjects were under medical supervision. Vital signs were examined at scheduled time asdescribed in the protocol.
2.7.4 Pharmacokinetics and statistical analysis
Pharmacokinetic parameters from the human plasma samples were calculated by a non-compartmental statistic model using Win Nonlin 5.0. software (Pharsight, USA). Bloodsamples were taken for a period of 3 to 5 times the terminal elimination half-life (t1/2) and itwas considered as the area under the concentration time curve (AUC) ratio higher than 80%as per USFDA guidelines. Plasma mesalamine, N-Acetyl mesalamine concentration-timeprofiles were visually inspected, and Cmax and Tmax values were determined. The AUC0–t wasobtained by the trapezoidal method. AUC0–∞ was calculated up to the last measureableconcentration and extrapolations were obtained using the last measureable concentrationand the terminal elimination rate constant (Ke) was estimated from the slope of the terminalexponential phase of the plasma of the mesalamine, N-Acetyl mesalamine concentration-time curve (by linear regression method [35,36,37]. The terminal elimination half-life (t1/2),was then calculated as 0.693/Ke [38]. Regarding AUC0–t, AUC0–∞ and Cmax bioequivalencewere assessed by means of analysis of variance (ANOVA) and calculating the standard 90%confidence intervals (90% CIs) of the ratio's test/reference (logarithmically transformeddata). The bioequivalence was considered when the ratio of averages of log transformeddata was within 80-125% for AUC0–t, AUC0–∞ and Cmax.
British Journal of Pharmaceutical Research, 4(13): 1568-1590, 2014
1576
3. RESULTS AND DISCUSSION
3.1 Method Development
LC-MS/MS has been recognized as one of the most powerful analytical techniques in clinicalpharmacokinetics for its selectivity, sensitivity and reproducibility [12]. The goal of this workwas to develop and validate a simple, sensitive and rapid assay method for the quantitativedetermination of mesalamine, N-acetyl mesalamine from plasma samples. A simple liquid-liquid extraction technique was utilized in the extraction of mesalamine, N-acetyl mesalamineand N-Acetyl mesalamine-D3 from the plasma samples. Chromatographic conditions,especially the composition and nature of the mobile phase, were optimized through severaltrials to achieve best resolution and increase the signal of mesalamine, N-acetyl mesalamineand N-Acetyl mesalamine-D3. The MS optimization was performed by direct infusion ofsolutions of both mesalamine, N-acetyl mesalamine and N-Acetyl mesalamine D3 into theESI source of the mass spectrometer.
Other parameters, such as the nebulizer and the heater gases were optimized to obtain abetter spray shape, resulting in better ionization. mesalamine, N-acetyl mesalamine and N-Acetyl mesalamine-D3 were detected with proton adducts at m/z 152.0108.0,194.2149.9 and 169.9153.0 in multiple reaction monitoring (MRM) negative moderespectively (Fig. 2a-2b, Fig. 2c-2d, and Fig. 3a-3b). After the MRM channels were tuned,the mobile phase was changed from more organic phase to an aqueous phase to obtain afast and selective LC method. A good separation and elution were achieved using theproposed LC study condition.
3.2 Method Validation
3.2.1 Selectivity and specificity
The analysis of mesalamine, N-acetyl mesalamine and N-Acetyl mesalamine-D3 using MRMfunction was highly selective with no interfering compounds. Fig. 4 shows thechromatograms of one blank human plasma. Chromatograms obtained from plasma spikedwith mesalamine (2.0 ng/mL), N-Acetyl mesalamine (10.0 ng/mL) and N-Acetyl mesalamineD3 (150 ng/mL) are shown in (Figs. 4 and 5).
3.2.2 Matrix effect
Six lots of blank biological matrices were extracted each in triplicates and post spiked withthe aqueous standard at the mid QC level, and compared with aqueous standards of sameconcentration in alternate injections. The overall precision of the matrix factor is 2.83 formesalamine, and 2.80 for N-Acetyl mesalamine, respectively. There was no ion-suppression and ion- enhancement effect observed due to IS and analyte at respectiveretention time.

British Journal of Pharmaceutical Research, 4(13): 1568-1590, 2014
1577
(a)
(b)
British Journal of Pharmaceutical Research, 4(13): 1568-1590, 2014
1578
(c)
(d)
Fig. 2. Mass spectra: (a) mesalamine parent ion, (b) mesalamine product ion,(c) N-Acetyl mesalamine parent ion, and (d) N-Acetyl mesalamine product ion
British Journal of Pharmaceutical Research, 4(13): 1568-1590, 2014
1579
(a)
(b)
Fig. 3. Mass spectra: (a) N-Acetyl mesalamine-D3 parent ion, and (b) N-Acetylmesalamine-D3 product ion

British Journal of Pharmaceutical Research, 4(13): 1568-1590, 2014
1580
Fig. 4. Chromatogram of blank human plasma
3.2.3 Linearity, precision and accuracy
Calibration curves were plotted as the peak area ratio (Mesalamine / N-Acetyl mesalamine-D3) versus (mesalamine) concentration for Mesalamine and the peak area ratio (N-Acetylmesalamine / N-Acetyl mesalamine-D3) versus (N-acetyl mesalamine) concentration for N-acetyl mesalamine. Calibration was found to be linear over the concentration range of 2–15000 ng/mL for mesalamine and 10–2000 ng/mL for N-Acetyl mesalamine. The Precision(CV %) for mesalamine, N-Acetyl mesalamine was less than 8.67% and 5.67%respectively. The accuracy ranged from 100.64 to 105.48% for mesalamine and 98.55to 106.22% for N-acetyl mesalamine. The determination coefficients (r2) for mesalamineand N-acetyl mesalamine were greater than 0.9998 and 0.9987 respectively for all curves(Table 2).
Precision and accuracy for this method was controlled by calculating the intra and inter-batch variations of QC samples in six replicates at four concentrations (2, 6, 450 and 1050ng/mL) for mesalamine and (10, 30, 600 and 1400 ng/mL) N-Acetyl mesalaminerespectively as shown in (Table 3).

British Journal of Pharmaceutical Research, 4(13): 1568-1590, 2014
1581
Fig. 5. LOQ Chromatograms of mesalamine and N-Acetyl mesalamine
This method was demonstrated intra and inter-day precision 1.60 to 8.63 and 2.14 to 8.67%for mesalamine 0.99 to 5.67 and 1.72 to 4.89% for N-Acetyl mesalamine. This methoddemonstrated intra and inter-day accuracy 102.70 to 105.48 and 100.64 to 103.87% formesalamine, 99.64 to 106.22 and 100.71 to 104.27% for N-acetyl mesalamine. Theseresults indicate the adequate reliability and reproducibility of this method within the analyticalrange.
3.2.4 Recovery
The recovery following the sample preparation using Liquid-Liquid extraction method with t-butyl methyl ether was calculated by comparing the peak areas of drug in plasma sampleswith the peak area ratios of solvent samples and was estimated at control levels of drug. Therecovery of mesalamine (at concentrations 6,450 and 1050 ng/mL) and N-acetyl mesalamine(at concentrations 30,600 and 1400 ng/mL) were found to be 95.97, 91.79, 98.87% and88.27, 89.24,90.16%, respectively. The overall mean recovery of mesalamine, N-Acetylmesalamine, and N-Acetyl mesalamine-D3 were 95.54%, 89.22% and 86.71% respectively.
British Journal of Pharmaceutical Research, 4(13): 1568-1590, 2014
1582
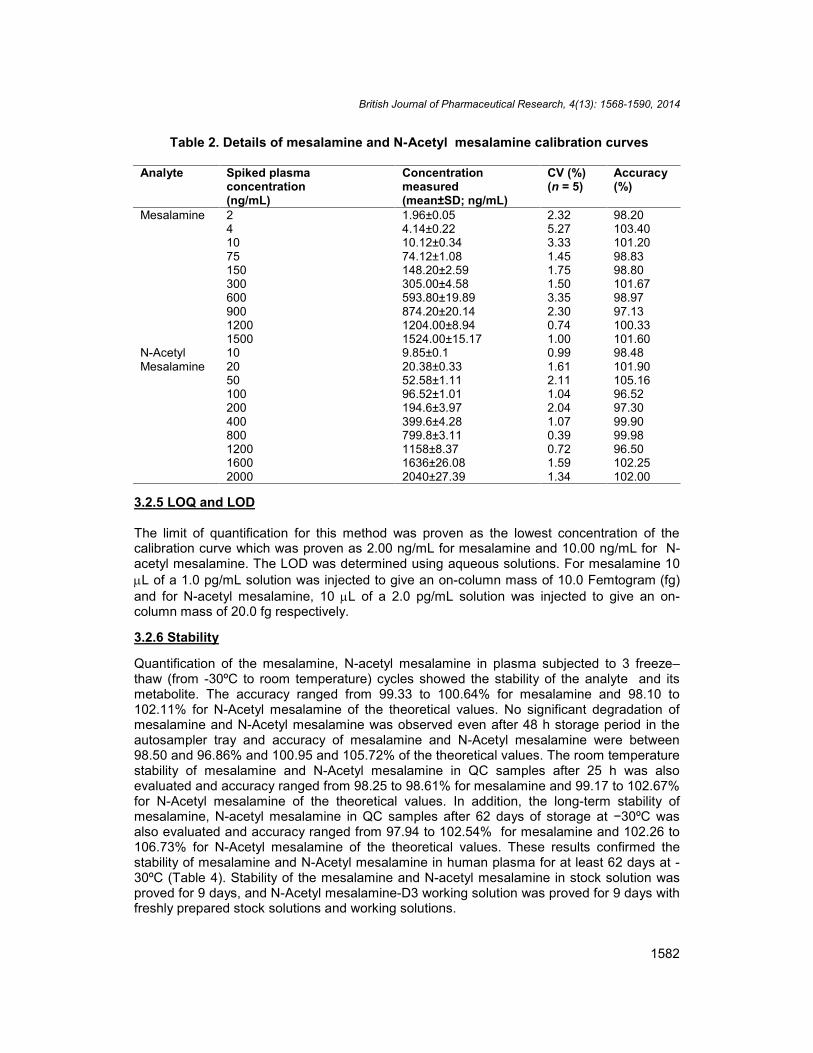
Table 2. Details of mesalamine and N-Acetyl mesalamine calibration curves
Analyte Spiked plasmaconcentration(ng/mL)
Concentrationmeasured(mean±SD; ng/mL)
CV (%)(n = 5)
Accuracy(%)
Mesalamine 2 1.96±0.05 2.32 98.204 4.14±0.22 5.27 103.4010 10.12±0.34 3.33 101.2075 74.12±1.08 1.45 98.83150 148.20±2.59 1.75 98.80300 305.00±4.58 1.50 101.67600 593.80±19.89 3.35 98.97900 874.20±20.14 2.30 97.131200 1204.00±8.94 0.74 100.331500 1524.00±15.17 1.00 101.60
N-AcetylMesalamine
10 9.85±0.1 0.99 98.4820 20.38±0.33 1.61 101.9050 52.58±1.11 2.11 105.16100 96.52±1.01 1.04 96.52200 194.6±3.97 2.04 97.30400 399.6±4.28 1.07 99.90800 799.8±3.11 0.39 99.981200 1158±8.37 0.72 96.501600 1636±26.08 1.59 102.252000 2040±27.39 1.34 102.00
3.2.5 LOQ and LOD
The limit of quantification for this method was proven as the lowest concentration of thecalibration curve which was proven as 2.00 ng/mL for mesalamine and 10.00 ng/mL for N-acetyl mesalamine. The LOD was determined using aqueous solutions. For mesalamine 10L of a 1.0 pg/mL solution was injected to give an on-column mass of 10.0 Femtogram (fg)and for N-acetyl mesalamine, 10 L of a 2.0 pg/mL solution was injected to give an on-column mass of 20.0 fg respectively.
3.2.6 Stability
Quantification of the mesalamine, N-acetyl mesalamine in plasma subjected to 3 freeze–thaw (from -30ºC to room temperature) cycles showed the stability of the analyte and itsmetabolite. The accuracy ranged from 99.33 to 100.64% for mesalamine and 98.10 to102.11% for N-Acetyl mesalamine of the theoretical values. No significant degradation ofmesalamine and N-Acetyl mesalamine was observed even after 48 h storage period in theautosampler tray and accuracy of mesalamine and N-Acetyl mesalamine were between98.50 and 96.86% and 100.95 and 105.72% of the theoretical values. The room temperaturestability of mesalamine and N-Acetyl mesalamine in QC samples after 25 h was alsoevaluated and accuracy ranged from 98.25 to 98.61% for mesalamine and 99.17 to 102.67%for N-Acetyl mesalamine of the theoretical values. In addition, the long-term stability ofmesalamine, N-acetyl mesalamine in QC samples after 62 days of storage at −30ºC wasalso evaluated and accuracy ranged from 97.94 to 102.54% for mesalamine and 102.26 to106.73% for N-Acetyl mesalamine of the theoretical values. These results confirmed thestability of mesalamine and N-Acetyl mesalamine in human plasma for at least 62 days at -30ºC (Table 4). Stability of the mesalamine and N-acetyl mesalamine in stock solution wasproved for 9 days, and N-Acetyl mesalamine-D3 working solution was proved for 9 days withfreshly prepared stock solutions and working solutions.

British Journal of Pharmaceutical Research, 4(13): 1568-1590, 2014
1583
Table 3. Precision and accuracy details for mesalamine and N-Acetyl mesalamine
Analyte Spiking plasmaconcentration(ng/mL)
Within-run Between-runConcentrationmeasured(mean±SD)(n=6; ng/mL)
CV (%) Accuracy(%) Concentrationmeasured(mean±SD)(n=6; ng/mL)
CV (%) Accuracy(%)
Mesalamine 2 2.07±0.18 8.63 103.25 2.01±0.17 8.67 100.646 6.29±0.43 6.79 104.83 6.23±0.33 5.31 103.87450 474.67±17.08 3.60 105.48 461.2±14.37 3.12 102.491050 1078.33±17.22 1.60 102.70 1067.67±22.85 2.14 101.68
N.AcetylMesalamine
10 10.14±0.57 5.67 101.42 9.86±0.48 4.89 98.5530 31.87±0.52 1.64 106.22 31.28±0.71 2.26 104.27600 602.33±7.15 1.19 100.39 605.77±10.42 1.72 100.961400 1395±13.78 0.99 99.64 1410±30.51 2.16 100.71

British Journal of Pharmaceutical Research, 4(13): 1568-1590, 2014
1584
Table 4. Stability of mesalamine and N.Acetyl mesalamine in six plasma samples
Stability paameters Plasmaconcentratin(ng/mL)
Concentrationmeasured(mean±SDng/mL)
CV (%) Accuracy
MesalamineRoom temperature stability(25 h)
6 5.92±0.34 5.76 98.611050 1031.67±24.01 2.33 98.25
Autosampler stability (48 h) 6 5.91±0.22 3.68 98.501050 1017.00±22.76 2.24 96.86
Freeze-thaw stability(3cycles)
6 5.96±0.3 4.99 99.331050 1056.67±21.60 2.04 100.64
Long term stability (62 days) 6 5.88±0.23 3.84 97.941050 1076.67±42.27 3.93 102.54
N-Acetyl mesalamineRoom temperature stability(25 h)
30 30.8±0.52 1.68 102.671400 1388.33±21.37 1.54 99.17
Autosampler stability (48 h) 30 31.72±0.50 1.56 105.721400 1413.33±29.44 2.08 100.95
Freeze-thaw stability(3cycles)
30 30.63±0.53 1.74 102.111400 1373.33±27.33 1.99 98.10
Long term stability (62 days) 30 32.02±1.14 3.56 106.731400 1431.67±47.92 3.35 102.26
3.3 Application to Biological Samples
The above validated method was used in the determination of mesalamine and N-Acetylmesalamine in plasma samples for establishing the bioequivalence of a single 400 mg dose(one 400 mg tablet) in Thirty four healthy volunteers. Typical plasma concentration versustime profiles is shown in (Figs. 6 and 7). All the plasma concentrations of mesalamine and N-Acetyl mesalamine were within the standard curve region and retained above the 2.0 ng/mLas the LOQ of mesalamine and above 10.0 ng/mL as the LOQ of N-Acetyl mesalamine forthe entire sampling period (Tables 5 and 6). The ANOVA results revealed that period,sequence and treatment had no statistically significant effects on Cmax, AUC0-tlast and AUC0-∞.Since the sequence or carry-over effect was not significant, the ANOVA test was valid. Thestatistically significant subject within sequence effect on Cmax, AUC0-tlast and AUC0-∞ wereobserved that are usually seen in large sample size study as in crossed over bioequivalencestudies. Bioequivalence between the 400 mg enteric coated tablet formulations ofmesalamine under fasting condition was demonstrated by the 90% CI of the geometric meanratios of Cmax, AUC0-tlast and AUC0-∞ lying within the acceptable criteria of 80-125%. The testand reference formulations had very similar t1/2 at approximately 9.5 h for mesalamine and15.5h for N-Acetyl mesalamine. Period, sequence and treatment had no significant effectson Cmax, AUC0-tlast and AUC0-∞.

British Journal of Pharmaceutical Research, 4(13): 1568-1590, 2014
1585
Fig. 6. Post dose chromatograms of mesalamine and N-Acetyl mesalamine at 24h
Fig. 7. Mean plasma concentrations versus time graph of milnacipran and N-Acetylmesalamine

British Journal of Pharmaceutical Research, 4(13): 1568-1590, 2014
1586
Table 5. Mean pharmacokinetic parameters for (a) mesalamine, and (b)N-Acetyl mesalamine. T and R were treatmentsequence assignments
(a) Cmax(ng/mL) Tmax(h) AUC0-tlast AUC0-∞
T R T R T R T RMean 1275.96 1155.74 9.18 10.43 8192.16 8210.63 8469.62 8553.22SD 861.52 730.30 4.46 5.93 3589.37 3583.30 3644.14 3813.59Min 113.35 210.18 4.00 4.00 1691.96 1619.39 1807.40 1653.72Median 999.43 913.96 8.00 9.00 8135.24 8270.01 8871.14 8399.75Max 3704.27 2910.73 24.00 32.00 17442.71 19011.11 17460.41 19032.36CV(%) 67.50 63.20 48.60 56.90 43.80 43.60 43.00 44.60(b) Cmax(ng/mL) Tmax(h) AUC0-tlast AUC0-∞
T T T T T R T RMean 1777.03 11.32 11.32 13.91 27773.79 27773.79 30537.83 30072.30SD 1247.60 6.36 6.36 8.22 13154.38 13154.38 16038.56 17043.46Min 75.85 5.00 5.00 5.00 318.43 318.43 389.94 4081.43Median 1587.65 9.00 9.00 11.00 28911.73 28911.73 30813.78 27667.55Max 5463.41 30.00 30.00 40.00 56070.22 56070.22 68121.11 83529.93CV(%) 70.20 56.20 56.20 59.10 47.40 47.40 52.50 56.70
Table 6. Test/Reference ratios of Cmax, AUC0-tlast and AUC0-∞ for mesalamine and N-Acetyl mesalamine following the oraladministration of 400 mg mesalamine enteric coated tablet formulations
MesalamineDependent TestGeoLSM RefGeoLSM Ratio[%Ref] CI_90_Lower CI_90_Upper Powerln(AUCINF_obs) 7582.05 7660.48 98.98 88.91 110.19 0.96ln(AUClast) 7327.56 7393.20 99.11 88.92 110.47 0.96ln(Cmax) 983.14 927.88 105.96 97.77 114.83 1.00N-Acetyl mesalamineDependent TestGeoLSM RefGeoLSM Ratio[%Ref] CI_90_Lower CI_90_Upper Powerln(AUCINF_obs) 23112.34 25078.13 92.16 69.88 121.55 0.37ln(AUClast) 21346.59 23032.79 92.68 70.63 121.61 0.38ln(Cmax) 1319.09 1236.11 106.71 82.70 137.70 0.42

British Journal of Pharmaceutical Research, 4(13): 1568-1590, 2014
1587
4. CONCLUSION
A method has been developed and validated over the concentration range of 2 - 1500 ng/mLfor mesalamine and 10 - 2000 ng/mL for N-Acetyl mesalamine in human plasma. Theselectivity, sensitivity, precision and accuracy obtained with this method enabled to test thepresent study. The validated method was successfully applied in 34 healthy volunteers anddemonstrated the bioequivalence of the 400 mg mesalamine enteric-coated tabletformulations of test product (APLRC) as well as the reference product (Mesacol®) .Theresults concluded that the two formulations can be used interchangeably.
CONSENT
Not applicable.
ETHICAL APPROVAL
All authors hereby declare that all experiments have been examined and approved by theappropriate ethics committee and have therefore been performed in accordance with theethical standards laid down in the 1964 Declaration of Helsinki.
ACKNOWLEDGEMENT
The authors thank all staff of the Manipal accunova clinical research and PharmacologicalResearch Unit, Manipal, India for providing research facilities. The authors also wish toacknowledge the staff of Clinical, Bio-analytical, Pharmacokinetic Unit for encouraging inmethod development, validation and sample analysis throughout the study as well as duringthe preparation of this manuscript.
COMPETING INTERESTS
Authors have declared that no competing interests exist.
REFERENCES
1. Small RE, Schraa CC. Chemistry, pharmacology, pharmacokinetics, and clinicalapplications of mesalamine for the treatment of inflammatory bowel disease.Pharmacotherapy. 1994;14(4): 385-98.
2. Gionchetti P, Campieri M, Belluzzi A, Boschi S, Brignola C, Miglioli M, Barbara L.Bioavailability of single and multiple doses of a new oral formulation of 5-ASA inpatients with inflammatory bowel disease and healthy volunteers. Aliment PharmacolTher. 1994;8(5):535-40.
3. Ito H, Furuta S, Sasaki H, Yoshida T, Takano Y, Hibi T. Pharmacokinetics and safetyof single and multiple doses of Asacol tablets in Japanese healthy volunteers. AdvTher. 2009;26(8):749-61.
4. Rasmussen SN, Bondesen S, Hvidberg EF, Hansen SH, Binder V, Halskov S, FlachsH. 5-aminosalicylic acid in a slow-release preparation: bioavailability, plasma level,and excretion in humans. Gastroenterology. 1982;83(5):1062-70.
British Journal of Pharmaceutical Research, 4(13): 1568-1590, 2014
1588
5. Kunes M, Kvetina J, Kholova D, Bures J, Tlaskalova-Hogenova H, Pavlik M.Absorption kinetics of 5-aminosalicylic acid in rat: influence of indomethacin-inducedgastrointestinal lesions and Escherichia Coli Nissle 1917 medication. NeuroEndocrinol Lett. 2011;32(1):46-52.
6. Sandborn WJ, Hanauer SB, Buch A. Comparative pharmacokinetics of equimolardoses of 5-aminosalicylate administered as oral mesalamine (Asacol) and balsalazide:a randomized, single-dose, crossover study in healthy volunteers. Aliment PharmacolTher. 2004;19(10):1089-98.
7. Christensen LA, Fallingborg J, Jacobsen BA, Abildgaard K, Rasmussen HH, HansenSH, Rasmussen SN. Comparative bioavailability of 5-aminosalicylic acid from acontrolled release preparation and an azo-bond preparation. Aliment Pharmacol Ther.1994;8(3):289-94.
8. Norlander B, Gotthard R, Strom M. Pharmacokinetics of a 5-aminosalicylic acidenteric-coated tablet in patients with Crohn's disease or ulcerative colitis and inhealthy volunteers. Aliment Pharmacol Ther.1990;4(5):497-505.
9. Vree TB, Dammers E, Exler PS, Maes RA. Mono- and biphasic plasma concentration-time curves of mesalazine from a 500 mg suppository in healthy male volunteerscontrolled by the time of defecation before dosing. J Pharm Pharmacol.2000;52(6):645-52.
10. Kvetina J, Svoboda Z, Nobilis M, Pastera J, Anzenbacher P. Experimental Goettingenminipig and beagle dog as two species used in bioequivalence studies for clinicalpharmacology (5-aminosalicylic acid and atenolol as model drugs). Gen PhysiolBiophys. 1999;18: 80-85.
11. Corey AE, Rose GM, Conklin JD. Bioavailability of single and multiple doses ofenteric-coated mesalamine and sulphasalazine. J Int Med Res. 1990;18(6):441-53.
12. Gu GZ, Xia HM, Pang ZQ, Liu ZY, Jiang XG, Chen J. Determination of sulphasalazineand its main metabolite sulphapyridine and 5-aminosalicylic acid in human plasma byliquid chromatography/tandem mass spectrometry and its application to apharmacokinetic study. J Chromatogr B Analyt Technol Biomed Life Sci. 2011;879(5-6):449-56.
13. Pastorini E, Locatelli M, Simoni P, Roda G, Roda E, Roda A. Development andvalidation of a HPLC-ESI-MS/MS method for the determination of 5-aminosalicylic acidand its major metabolite N-acetyl-5-aminosalicylic acid in human plasma. JChromatogr B Analyt Technol Biomed Life Sci. 2008;872(1-2):99-106.
14. Nobilis M, Vybiralova Z, Sladkova K, Lisa M, Holcapek M, Kvetina J. High-performance liquid-chromatographic determination of 5-aminosalicylic acid and itsmetabolites in blood plasma. J Chromatogr A.2006;1119(1-2):299-308.
15. Novak P, Tepes P, Fistrić I, Bratos I, Gabelica V. The application of LC-NMR and LC-MS for the separation and rapid structure elucidation of an unknown impurity in 5-aminosalicylic acid. J Pharm Biomed Anal. 2006;40(5):1268-72.
16. Orioli M, Marinello C, Cozzi R, Piodi LP, Carini M. LC-MS/MS and FT-IR analyses ofstones from a patient with Crohn's disease: a case report. J Pharm Biomed Anal.2004;35(5):1263-72.
17. Palumbo G, Bacchi S, Primavera L, Palumbo P, Carlucci G. A validated HPLC methodwith electrochemical detection for simultaneous assay of 5-aminosalicylic acid and itsmetabolite in human plasma. Biomed Chromatogr. 2005;19(5):350-4.
18. Hansen SH. Assay of 5-aminosalicylate and its acetylated metabolite in biologicalfluids by high-performance liquid chromatography on dynamically modified silica. JChromatogr. 1981;226(2):504-9.
British Journal of Pharmaceutical Research, 4(13): 1568-1590, 2014
1589
19. Fischer C, Maier K, Klotz U. Simplified high-performance liquid chromatographicmethod for 5-aminosalicylic acid in plasma and urine. J Chromatogr. 1981;225(2):498-503.
20. Bystrowska B, Nowak J, and Brandys J. Validation of a LC method for thedetermination of 5-aminosalicylic acid and its metabolite in plasma and urine. J PharmBiomed Anal. 2000;22(2):341-7.
21. Hussain FN, Ajjan RA, Moustafa M, Anderson JC, Riley SA. Simple method for thedetermination of 5-aminosalicylic and N-acetyl-5-aminosalicylic acid in rectal tissuebiopsies. J Chromatogr B Biomed Sci Appl. 1998;716(1-2):257-66.
22. Palumbo G, Carlucci G, Mazzeo P, Frieri G, Pimpo MT, Fanini D. Simultaneousdetermination of 5-aminosalicylic acid, acetyl-5-aminosalicylic acid and 2,5-dihydroxybenzoic acid in endoscopic intestinal biopsy samples in humans by high-performance liquid chromatography with electrochemical detection. J Pharm BiomedAnal. 1995;14(1-2):175-80.
23. De Vos M, Verdievel H, Schoonjans R, Beke R, De Weerdt GA, Barbier F. High-performance liquid chromatographic assay for the determination of 5-aminosalicylicacid and acetyl-5-aminosalicylic acid concentrations in endoscopic intestinal biopsy inhumans. J Chromatogr. 1991;564(1):296-302.
24. Nagy E, Csipo I, Degrell I, Szabo G. High-performance liquid chromatographic assayof 5-aminosalicylic acid and its acetylated metabolite in biological fluids usingelectrochemical detection. J Chromatogr. 1988;425(1):214-9.
25. Lee EJ, Ang SB., Simple and sensitive high-performance liquid chromatographicassay for 5-aminosalicylic acid and acetyl-5-aminosalicylic acid in serum. JChromatogr. 1987;413:300-4.
26. Brendel E, Meineke I, Witsch D, Zschunke M. Simultaneous determination of 5-aminosalicylic acid and 5-acetylaminosalicylic acid by high-performance liquidchromatography. J Chromatogr. 1987;385:299-304.
27. Cendrowska I, Drewnowska M, Grzeszkiewicz A, Butkiewicz K. Investigation of thestability of 5-aminosalicylic acid in tablets and suppositories by high-performanceliquid chromatography. J Chromatogr. 1990;509(1):195-9.
28. Kersten BS, Catalano T, Rozenman Y. Ion-pairing high-performance liquidchromatographic method for the determination of 5-aminosalicylic acid and relatedimpurities in bulk chemical. J Chromatogr. 1991;588(1-2):187-93.
29. Liu H, Zhang S, Yuan Z. Study on the analysis of zinc 5-aminosalicylate and relatedcompounds by high performance liquid chromatography. Se Pu. 1998;16(4):321-3.
30. Larsen J, Staerk D, Cornett C, Hansen SH, Jaroszewski JW. Identification of reactionproducts between drug substances and excipients by HPLC-SPE-NMR: ester andamide formation between citric acid and 5-aminosalicylic acid. J Pharm Biomed Anal.2009;9(3):839-42.
31. Elmasry MS, Blagbrough IS, Rowan MG, Saleh HM, Kheir AA, Rogers PJ.Quantitative HPLC analysis of mebeverine, mesalazine, sulphasalazine anddispersible aspirin stored in a Venalink monitored dosage system with co-prescribedmedicines. J Pharm Biomed Anal. 2011;54(4):646-52.
32. Allen L, Weinberger J, Weinberger R. Determination of impurities in the drug 5-aminosalicylic acid by micellar electrokinetic capillary chromatography using anelectrolyte pH that approaches the isoelectric point of the parent compound. JChromatogr A. 2004;1053(1-2):217-26.
33. Nigovic B, Simunic B. Determination of 5-aminosalicylic acid in pharmaceuticalformulation by differential pulse voltammetry. J Pharm Biomed Anal. 2003;31(1):169-74.

British Journal of Pharmaceutical Research, 4(13): 1568-1590, 2014
1590
34. Nigovic B, Mandic Z, Simunic B, Fistric I. Voltammetric studies of 2-hydroxy-5-[(4-sulfophenyl)azo]benzoic acid as a novel prodrug of 5-aminosalicylic acid. J PharmBiomed Anal. 2001;26(5-6):987-94.
35. Guidance for industry: bioanalytical method validation, U.S. Department of Health andHuman Services, Food and Drug Administration, Center for Drug Evaluation andResearch (CDER), Center for Biologics Evaluation and Research (CBER), May 2001.
36. Guidance for industry Food- effect bio availability and Fed Bio equivalence studies.U.S Department of Health and Human services Food and Drug Administration Centrefor Drug Evaluation and research (CDER), December 2002.
37. Guidance for industry Bio availability and Fed Bio equivalence Studies for OrallyAdministered Drug Products-General considerations U.S. Department of Health andHuman services Food and Drug Administration Centre for Drug Evaluation andresearch (CDER) March 2003.
38. Available: http://pharmacy.ucsf.edu/irc/pdfs/wnl_users_guide.pdf.Accessed 01.Dec 2009.
_________________________________________________________________________© 2014 Kanala et al.; This is an Open Access article distributed under the terms of the Creative CommonsAttribution License (http://creativecommons.org/licenses/by/3.0), which permits unrestricted use, distribution, andreproduction in any medium, provided the original work is properly cited.
Peer-review history:The peer review history for this paper can be accessed here:
http://www.sciencedomain.org/review-history.php?iid=574&id=14&aid=5044


![Mesalamine-induced Acute Intolerance Syndrome: Symptoms … · 2020. 10. 6. · [see Drug Interactions (7.1), Use in Specific Populations (8.6)]. 5.2 . Mesalamine-Induced Acute Intolerance](https://img.dokumen.tips/doc/110x75/60542890a7f57a24ec4e8cf4/mesalamine-induced-acute-intolerance-syndrome-symptoms-2020-10-6-see-drug.jpg)


![Rest API Documentation - Gier API... · Rest API Documentation {{}, {}],}](https://img.dokumen.tips/doc/110x75/5fdbbd98d3d6d85ee1033c5a/rest-api-documentation-gier-api-rest-api-documentation-.jpg)