Embed Size (px)
Citation preview

RSC Advances
PAPER
Ope
n A
cces
s A
rtic
le. P
ublis
hed
on 0
5 D
ecem
ber
2018
. Dow
nloa
ded
on 1
2/15
/202
1 7:
06:4
0 PM
. T
his
artic
le is
lice
nsed
und
er a
Cre
ativ
e C
omm
ons
Attr
ibut
ion-
Non
Com
mer
cial
3.0
Unp
orte
d L
icen
ce.
View Article OnlineView Journal | View Issue
Simultaneous op
aJiangsu Collaborative Innovation Cent
Industrialization, Jiangsu Key Laboratory
Formulae, National and Local Collabo
Medicinal Resources Industrialization and
University of Chinese Medicine, Nanjing 2
[email protected]; 2051001@sntcmbKey Laboratory of Shaanxi Administration
Compatibility, Shaanxi Key Laboratory of C
Drugs Research, Shaanxi Collaborative In
Resources Industrialization, Shaanxi Unive
ChinacJiangsu Rongyu Pharmaceutical Co., Ltd., H
† Electronic supplementary informa10.1039/c8ra07361a
Cite this: RSC Adv., 2018, 8, 40748
Received 4th September 2018Accepted 16th November 2018
DOI: 10.1039/c8ra07361a
rsc.li/rsc-advances
40748 | RSC Adv., 2018, 8, 40748–407
timization of ultrasonic-assistedextraction of antioxidant and anticoagulationactivities of compounds from Leonurus japonicusHoutt. by response surface methodology†
Ya-Jie Tan,a Gui-Sheng Zhou, *a Sheng Guo,a Hui Yan,a Jing Zhang,a
Zhen-Hua Zhu,a Xu-Qin Shi,a Shi-Jun Yue,b Yu-Ping Tang,*ab Sheng-Liang Huang,c
Guo-Ping Penga and Jin-Ao Duan a
Leonurus japonicusHoutt. is a herbaceous annual of the Lamiaceae family with pantropical distribution; it is
called motherwort in China. It plays important roles in anticoagulation and antioxidation. This study aimed
to explore the optimization of ultrasound-assisted extraction of multiple compounds from motherwort as
well as their antioxidant and anticoagulation activities using response surface methodology. Box–Behnken
design was employed to optimize three significant influences, namely extraction time, extraction
temperature and ethanol concentration. The optimum extraction parameters acquired based on
a combination of the yield of the target compounds and their antioxidant and anticoagulation activities
were an extraction time of 38.2 min, an extraction temperature of 30.0 �C, an ethanol concentration of
48.9% (v/v), a solid–liquid ratio of 30.0 mL g�1 and an ultrasonic power of 500.0 W. Under the optimal
conditions, the maximal yield of the anticoagulation and antioxidant compounds of motherwort was
0.994%; the thrombin time was 19.872 s; prothrombin time was 8.270 s; the activated partial
thromboplastin time was 15.535 s; the fibrinogen was 1.420 g L�1; and the 1,1-diphenyl-2-picrylhydrazyl
free radical scavenging activity was 1.503 mg mL�1. The optimized conditions model showed a good
correlation between the predicted and experimental values. According to the results of our study, the
optimization extraction significantly enabled study of the anticoagulation and antioxidant activities of
compounds in motherwort; this may contribute to future research on the pharmacological activities of
motherwort.
1. Introduction
Leonurus japonicus Houtt. (LJ), a traditional herb with a longhistory of medicinal use, is found in several regions in Asia,including China, Korea and Japan. China is the main produc-tive area of LJ.1 In China, LJ is an abundant resource, and theproduction of LJ is nearly hundreds of thousands of tons.2
er of Chinese Medicinal Resources
for High Technology Research of TCM
rative Engineering Center of Chinese
Formulae Innovative Medicine, Nanjing
10023, Jiangsu Province, China. E-mail:
.edu.cn
of Traditional Chinese Medicine for TCM
hinese Medicine Fundamentals and New
novation Center of Chinese Medicinal
rsity of Chinese Medicine, Xi'an 712046,
uaian 223200, Jiangsu Province, China
tion (ESI) available. See DOI:
59
In 1990, LJ was added to the Pharmacopoeia of the People'sRepublic of China. According to preliminary statistics, morethan 300 prescriptions containing LJ have been adopted to treatmany diseases, especially those interfering with blood coagu-lation, in China. Some well-known prescriptions are currentlywidely used, such as “Xin-Sheng-Hua Granule” and “Ba Zhen YiMuWan”.1,3–5 Currently, due to its pharmacological anti-cancer,anti-inammatory, antibacterial, antifungal and antioxidanteffects, LJ is widely used in health care products and/or func-tional foods to improve the symptoms of blood coagulation andoxidative damage in some common chronic diseases, such ascancer, diabetes and cardiovascular diseases.
Modern pharmacological research has indicated that exces-sive oxidative stress and blood coagulation are associated withcancer, diabetes and cardiovascular diseases.6–8 Furthermore,smoking, radiation and environmental pollutants may causeexcessive oxidative stress and blood coagulation in the humanbody. Therefore, anticoagulants and antioxidants can beregarded as effectual methods to prevent and decrease thenegative effects caused by blood coagulation and oxidative
This journal is © The Royal Society of Chemistry 2018

Paper RSC Advances
Ope
n A
cces
s A
rtic
le. P
ublis
hed
on 0
5 D
ecem
ber
2018
. Dow
nloa
ded
on 1
2/15
/202
1 7:
06:4
0 PM
. T
his
artic
le is
lice
nsed
und
er a
Cre
ativ
e C
omm
ons
Attr
ibut
ion-
Non
Com
mer
cial
3.0
Unp
orte
d L
icen
ce.
View Article Online
stress, respectively.9–11 Previous studies have reported thatcommon herbs, such as Persicae Semen, Carthami Flos andCrataegi Fructus, are excellent sources of natural anticoagulantsand antioxidants due to their high anticoagulation and anti-oxidant activities.12–17 According to social research, the use ofnatural anticoagulants and antioxidants in medicine, healthproducts, cosmetics and food processing is steadily increasing;therefore, it is necessary to identify and research natural anti-coagulants and antioxidants from plant sources.
As a traditional Chinese herbal medicine, previous reportsand our preliminary experiments simultaneously proved thatLJ possesses both high antioxidant and remarkable anti-coagulation activities.1,2 However, to date, there have been fewstudies on the connection between the effects of antioxidantand anticoagulation compounds in LJ. Additionally, LJ isinexpensive and readily available, and it is generally consid-ered as waste in the areas in which it is produced. In the localregion, LJ is commonly cremated and/or abundantly discardedin soil and water; no local enterprises collect LJ practically.Moreover, due to its vast planting area and detrimental effectson the environment, LJ is a pressing problem for local farmers,enterprises and governments. The main reason for the wasteof LJ is that there are few studies on its applications andadequate value-added processes. Additionally, only limitedresearch has focused on how to transform waste LJ into othervaluable products, which undoubtedly leads to further wasteof LJ. Therefore, we believe it is imperative to nd a new andenvironmentally friendly method to solve the above problem.An effective method would enable the preparation of theabundant antioxidants and anticoagulants in LJ as valuableproducts. This could provide a wide area for its developmentand utilization; this would not only reduce the pressure ofwaste LJ on abundant planting areas, but would also createmore assets for local farmers and decrease environmentalpollution.
To isolate natural bioactive compounds from plants,extraction is the rst key step. According to previous reports,conventional solvent and Soxhlet methods are commonly usedfor the extraction of antioxidant and anticoagulantcompounds from plants; these methods possess many short-comings, such as high usage of extraction solvents, longextraction times, inconvenient operation and poor extractionefficiency.18 Currently, increasing numbers of extractionmethods, including ultrasound-assisted extraction (UAE),19–21
microwave-assisted extraction (MAE),22 pressurized liquidextraction,23 and supercritical uid extraction, are beingdeveloped for the recovery of antioxidant and anticoagulationcompounds from plants.24 Comparatively speaking, MAE andUAE are better than other traditional extraction methods; theycan decrease the extraction time and the usage of solvents,optimize the extraction temperature and increase the yields oftarget compounds.25–28 Particularly, UAE can disrupt cellularwalls, allowing better penetration of solvents in the matrixmaterial; this improves mass transfer and increases therelease of cell contents.29 Moreover, UAE is the simplest andmost economical technique, and it can be readily scaled up forindustrial production. Many factors, including ultrasound
This journal is © The Royal Society of Chemistry 2018
power, extraction time and temperature, and solvent-to-material ratio, can inuence the UAE process individuallyand collectively; thus, it is difficult to identify main indepen-dent variables to optimise.30,31 From previous reports,conventional multivariable optimisation is usually based onsingle-factor experiments and orthogonal experimentaldesign; this method possesses many disadvantages, such ashigh cost, more experiments and inaccurate results.32
Response surface methodology (RSM) is a useful tool forevaluating multiple parameters; it can effectively overcome thedrawbacks of single-factor experiments and orthogonalexperimental design. RSM has been successfully used tooptimize the extraction of active compounds from plants, suchas polyphenols, polysaccharides and proteins.32–35
Additionally, it is recognized that the simultaneous analysisof acidic and alkaline components is difficult in plant matricesbecause they can undergo acid-base neutralization reactions.36
LJ contains a variety of alkaloids, avones, diterpenes andphenolic acids;1 thus, both acidic and alkaline components arepresent in extracts of LJ. Previous studies showed that highperformance liquid chromatography (HPLC) and ultra-performance liquid chromatography tandem mass-spectrometry (UPLC-MS/MS) can be used to analyze thedifferent components of LJ; however, these studies only focusedon the determination of alkaline (alkaloids) or acidic (avonesand phenolic acids) components, and there are few studies onthe simultaneous determination of alkaline and acidic compo-nents in LJ.37–39 To solve the problem of the coexistence of acidand alkaline compounds, in this paper, we developed a methodinvolving ultra-performance liquid chromatography coupledwith triple-quadrupole tandem mass spectrometry (UPLC-TQ-MS/MS) for simultaneous determination of alkaline and acidiccomponents in LJ.
Thus, the present study was designed to determine theoptimum UAE conditions for maximizing the yields and anti-oxidant and anticoagulation activities of compounds from LJ.As far as we know, there are no relevant reports on the appli-cation of RSM to the optimization of UAE conditions forobtaining remarkable antioxidant and anticoagulation activi-ties of compounds in LJ. Additionally, this is the rst time thata rapid and accurate quality control UPLC-TQ-MS/MS methodwas employed to simultaneously analyze acid and alkalinecompounds in LJ.
2. Materials and methods2.1. Herbal samples
The samples of Leonurus japonicus Houtt. (LJ) were collected inAugust 2017 from elds in Xuyi County, Jiangsu Province,China. The plant was authenticated by Dr Hui Yan (Departmentof Medicinal Plants, Nanjing University of Chinese Medicine,Nanjing, China). A voucher specimen (NJUCM-20170830) wasdeposited in the Herbarium of Nanjing University of ChineseMedicine.
RSC Adv., 2018, 8, 40748–40759 | 40749

Table 1 MS parameters of the 20 investigated target compounds
Compound MW MRM transition Cone voltage (V) Collision energy (eV) Rt (min) Ion mode
1 137.14 138.10 > 91.66 30 22 2.92 ES+2 179.50 144.07 > 84.10 36 22 2.99 ES+3 354.31 353.22 > 191.07 18 18 6.19 ES�4 347.79 312.14 > 181.04 26 24 6.94 ES+5 610.51 609.16 > 300.16 40 32 7.00 ES�6 138.13 139.00 > 95.01 28 12 7.00 ES+7 198.18 199.04 > 140.01 12 14 7.04 ES+8 180.15 181.10 > 163.06 12 10 7.06 ES+9 168.15 169.00 > 64.99 24 12 7.14 ES+10 594.52 593.22 > 284.82 40 28 7.33 ES�11 464.38 465.22 > 303.18 12 22 7.37 ES+12 464.38 463.15 > 301.09 14 12 7.41 ES+13 194.19 195.03 > 144.87 14 18 8.14 ES+14 122.12 123.00 > 78.99 24 8 9.30 ES+15 302.00 301.03 > 151.00 30 20 9.54 ES�16 270.24 271.10 > 152.96 62 30 10.18 ES+17 286.23 287.10 > 153.01 44 28 10.39 ES+18 316.26 315.16 > 299.99 38 22 10.44 ES�19 284.27 285.10 > 270.07 32 24 12.24 ES+20 284.27 285.08 > 242.02 56 30 12.47 ES+
RSC Advances Paper
Ope
n A
cces
s A
rtic
le. P
ublis
hed
on 0
5 D
ecem
ber
2018
. Dow
nloa
ded
on 1
2/15
/202
1 7:
06:4
0 PM
. T
his
artic
le is
lice
nsed
und
er a
Cre
ativ
e C
omm
ons
Attr
ibut
ion-
Non
Com
mer
cial
3.0
Unp
orte
d L
icen
ce.
View Article Online
2.2. Chemicals and solvents
All chemicals and reagents were of HPLC grade. The standard of1,1-diphenyl-2-picrylhydrazyl (DPPH) was purchased fromNanjing Jiancheng Bioengineering Institute (Nanjing, China).Activated partial thromboplastin time (APTT), prothrombintime (PT), thrombin time (TT) and brinogen (FIB) assay kitswere purchased from Nanjing Maibo Biotech Co. Ltd (Nanjing,China). Other standards of trigonelline (1), stachydrine hydro-chloride (2), chlorogenic acid (3), leonurine hydrochloride (4),rutin (5), p-hydroxybenzoic acid (6), syringic acid (7), caffeic acid(8), vanillic acid (9), kaempferol-3-O-rutinoside (10), hyperoside(11), isoquercitrin (12), ferulic acid (13), benzoic acid (14),quercetin (15), apigenin (16), kaempferol (17), isorhamnetin(18), wogonin (19) and genkwanin (20) were purchased fromNanjing Liangwei Biotech Co. Ltd (Nanjing, China). The purityof each compound was >98%. Deionized water was puried bya Milli-Q water purication system from Millipore (MA, USA).Other reagents such as formic acid, acetonitrile and anhydrousethanol were supplied by Merck (Darmstadt, Germany).
2.3. Determination of extraction yield
The extraction yield of LJ was represented by the total contentsof the main components, including alkaloids (1, 2 and 4),avonoids (5, 11, 12, 15, 16, 17, 18, 19 and 20), phenolic acids (3,6, 7, 8, 9, 13 and 14) and glycosides (10). These components, themain active compounds in LJ, were identied and determinedby UPLC-TQ-MS. UPLC was performed on a Waters AcquityUHPLC system (Waters, Milford, MA, USA) equipped witha quaternary pump solvent management system, an onlinedegasser, a triple quadrupole mass detector and an autosam-pler. An Acquity UPLC BEH C18 column (2.1 mm � 100 mm, 1.7mm) was used with an injection volume of 2 mL. The columntemperature was maintained at 35 �C. The mobile phase was
40750 | RSC Adv., 2018, 8, 40748–40759
composed of A (0.1% formic acid solution) and B (acetonitrilesolution). The ow rate was set at 0.4 mL min�1. The lineargradient conditions were: 90% A (0 to 1.0 min), 90% to 50% A(1.0 to 7.0 min), 50% to 10% A (7.0 to 13.0 min), 10% to 0% A(13.0 to 14.0 min) and 0% A (14.0 to 14.5 min). A Waters Synaptmass spectrometer (Waters) was used for the mass spectrometryanalysis; it was equipped with an electrospray ionization source(ESI) in both positive and negative modes with a scan range ofm/z 100 to 1000 Da. The MS parameters are listed in Table 1.Representative MRM chromatograms for the 50 ng mL�1
mixture of the 20 standard analytes and sample are shown inFig. 1a and b, respectively. Also, the chemical structures of the20 standards are shown in Fig. 2.
In this part, 20 standards were used to identify multiplecompounds from LJ, and the contents of the 20 components aredisplayed as the dry weight of LJ. The extraction yield of LJ wascalculated by the following formula:
Extraction yield (%) ¼ alkaloids (%) + flavonoids (%)
+ phenolic acids (%) + glycoside (%) (1)
2.4. Ultrasound-assisted extraction procedure
In this study, UAE was applied for the extraction of multiplecomponents from LJ. An ultrasonic device (KH-500 DB; Kun-shan Hechuang Ultrasonic Instrument Factory, Kunshan,China) was used for UAE; this device can be used to adjust andcontrol the sonication power, time and temperature simulta-neously. The samples of LJ were cut into segments and crushedinto powder, which was ltered through a no. 3 (355 mm � 13mm) sieve. Then, the powdered sample (0.5 g) was mixed withethanol solution in a conical ask. All the samples wereextracted in triplicate simultaneously. Aer UAE, the extracting
This journal is © The Royal Society of Chemistry 2018

Fig. 1 Representative MRM chromatogram of 20 compounds in 50.0 ng mL�1 mixture standards (a) and a sample (b). Peaks: 1 (trigonelline), 2(stachydrine hydrochloride), 3 (chlorogenic acid), 4 (leonurine hydrochloride), 5 (rutin), 6 (p-hydroxybenzoic acid), 7 (syringic acid), 8 (caffeicacid), 9 (vanillic acid), 10 (kaempferol 3-O-rutinoside), 11 (hyperoside), 12 (isoquercitrin), 13 (ferulic acid), 14 (benzoic acid), 15 (quercetin), 16(apigenin), 17 (kaempferol), 18 (isorhamnetin), 19 (wogonin) and 20 (genkwanin).
Paper RSC Advances
Ope
n A
cces
s A
rtic
le. P
ublis
hed
on 0
5 D
ecem
ber
2018
. Dow
nloa
ded
on 1
2/15
/202
1 7:
06:4
0 PM
. T
his
artic
le is
lice
nsed
und
er a
Cre
ativ
e C
omm
ons
Attr
ibut
ion-
Non
Com
mer
cial
3.0
Unp
orte
d L
icen
ce.
View Article Online
solution was centrifuged and the supernatant was collected forthe subsequent experiments, including UPLC-TQ-MS/MS anal-ysis and the determination of the antioxidant and anti-coagulation activities.
2.5. Experimental design
The experiments were executed in three phases. (1) The effectsof three solvents, namely water, methanol and ethanol, on theyield of compounds with antioxidant and anticoagulationactivities in LJ were compared. (2) Ethanol was chosen as theextraction solvent in the rst phase, and the following param-eters were investigated: ethanol concentration (10% to 90%),solid–liquid ratio (10 : 1 to 80 : 1 mL g�1), temperature (30 �C to70 �C), ultrasonic power (200 to 500W) and ultrasonication time(10 to 90min). (3) The variables of signicance determined fromthe single-factor experiment were investigated by RSM withBox–Behnken design (BBD). The independent variables (Table2) were selected based on previous reports.40,46 Also, the 17 BBDdesign experiments are displayed in Table 3.
2.6. Determination of anticoagulation activity
The anticoagulation activity of LJ was evaluated by activatingthe TT, PT, APTT and FIB assays in vitro. In this study, bloodsamples were collected from rabbit auricular vein (no: 2017-021)and deposited into a 10 mL centrifuge tube, where they weresoaked in sodium citrate (38 mg mL�1, 800 mL). Then, the aboveblood samples were centrifuged at 3000 rpm (4 �C) for 15 minand the plasma was acquired for the next experiments. All theanimal procedures and experiments were approved by theAnimal Ethical Committee of Nanjing University of ChineseMedicine, (Nanjing, China). All experiments were performedaccording to the guidelines of the National Institute of Healthand the institutional rules for the use and care of laboratory
This journal is © The Royal Society of Chemistry 2018
animals at Nanjing University of Chinese Medicine (Nanjing,China).
2.6.1. TT assay. TT is mainly reected by the time ofconversion from brinogen to brin. An increase in TT indi-cates that the sample has invigorating effects on blood circu-lation. The specic operation was as follows: 50 mL of LJ extractand 200 mL of plasma were added to the test cup, respectively;then, the mixture was incubated at 37 �C for 3 min. Finally, 200mL TT reagent were added, and the clotting time (TT value) wasrecorded.41
2.6.2. PT assay. PT mainly indicates the status of theextrinsic blood coagulation system. When a sample has aninvigorating effect on blood circulation, PT will increase. Incontrast, PT decreases if the sample causes blood coagulation.In this assay, 25 mL of LJ extract was added to the test cup,followed by 100 mL of plasma. Similarly, the mixture wasmaintained at 37 �C for 3 min; then, 200 mL PT reagent pre-heated to 37 �C was added to the test cup, and the coagulationtime (PT value) was then recorded.41
2.6.3. APTT assay. APTT mainly indicates the status of theintrinsic blood coagulation system. Like PT, APTT increaseswhen a sample invigorates blood circulation. The specicoperation of APTT was as follows: 100 mL of plasma, 25 mL of LJextract and 100 mL of APTT reagent preheated to 37 �C wereadded in sequence to the test cup. Then, the above mixture wasincubated at 37 �C for 3 min. In the last step, 100 mL of CaCl2solution preheated to 37 �C was added, and the coagulationtime (APTT value) was recorded.41
2.6.4. FIB assay. The FIB assay demonstrates the content ofbrinogen. FIB has a normal range of 2 to 4 g L�1, and itscontent decreases when the sample plays an invigorating role inthe blood circulation. Firstly, we drew a standard curveaccording to the specied requirements; then, sample deter-mination was performed. 100 mL of LJ extract, 200 mL of plasma
RSC Adv., 2018, 8, 40748–40759 | 40751

Fig. 2 Chemical structures of the 20 standards in Leonurus japonicus Houtt.
Table 2 Independent variables and levels used for the Box–Behnkendesign
Name,unit
X1:time (min)
X2:temperature (�C)
X3: ethanolconcentration (%(v/v))
Low 20 30 20High 50 70 70
RSC Advances Paper
Ope
n A
cces
s A
rtic
le. P
ublis
hed
on 0
5 D
ecem
ber
2018
. Dow
nloa
ded
on 1
2/15
/202
1 7:
06:4
0 PM
. T
his
artic
le is
lice
nsed
und
er a
Cre
ativ
e C
omm
ons
Attr
ibut
ion-
Non
Com
mer
cial
3.0
Unp
orte
d L
icen
ce.
View Article Online
and 700 mL of buffer were blended in a tube; then, 200 mL of themixture was removed and incubated at 37 �C for 3 min. Finally,100 mL thrombin solution was added to the above mixture andthe brinogen content was recorded; this content is the FIBvalue.41
For all the tests mentioned above, plasma and breviscapinewere used as the blank control and positive control, respec-tively. The TT, PT, APTT and FIB assays were conducted usinga semi-automatic coagulation analyzer.
2.7. Determination of DPPH free radical scavenging activity
To measure the antioxidant activities of the LJ extracts, weadopted the DPPH radical scavenging assay from a previousstudy with minor alterations.42–45 In brief, DPPH solution wasformulated by dissolving DPPH in absolute ethanol at
40752 | RSC Adv., 2018, 8, 40748–40759
a concentration of 0.1 mM. Then, 100 mL DPPH working solu-tion were added to 100 mL of LJ extracts with various concen-trations. Then, each mixture was shaken and incubated for30 min at room temperature in the dark. The absorbance ofeach solution was measured on a microplate reader at 517 nm.Necessarily, ascorbic acid (Vc) was used as a positive control.The radical scavenging activity was indicated by the percentageof DPPH according to the following formula:
DPPH% ¼241�
�A1 � A0
1
��A0 � A0
0
�35� 100 (2)
where A1 is the absorbance of the sample (containing DPPHsolution), A0 is the absorbance of the control (DPPH solutionwith no sample), A01 is the absorbance of the solvent (ethanolsolution with sample), and A00 is the absorbance of the solventcontrol (ethanol solution with no sample). All the experimentswere performed in triplicate and the average values werecalculated. The antiradical DPPH activity was shown as IC50 (mgmL�1), which is the concentration of sample required to scav-enge 50% of DPPH free radicals.
2.8 Data analysis
All the experiments were performed in triplicate, and DesignExpert soware version 8.0 (Stat-Ease Inc., Minneapolis, USA)
This journal is © The Royal Society of Chemistry 2018
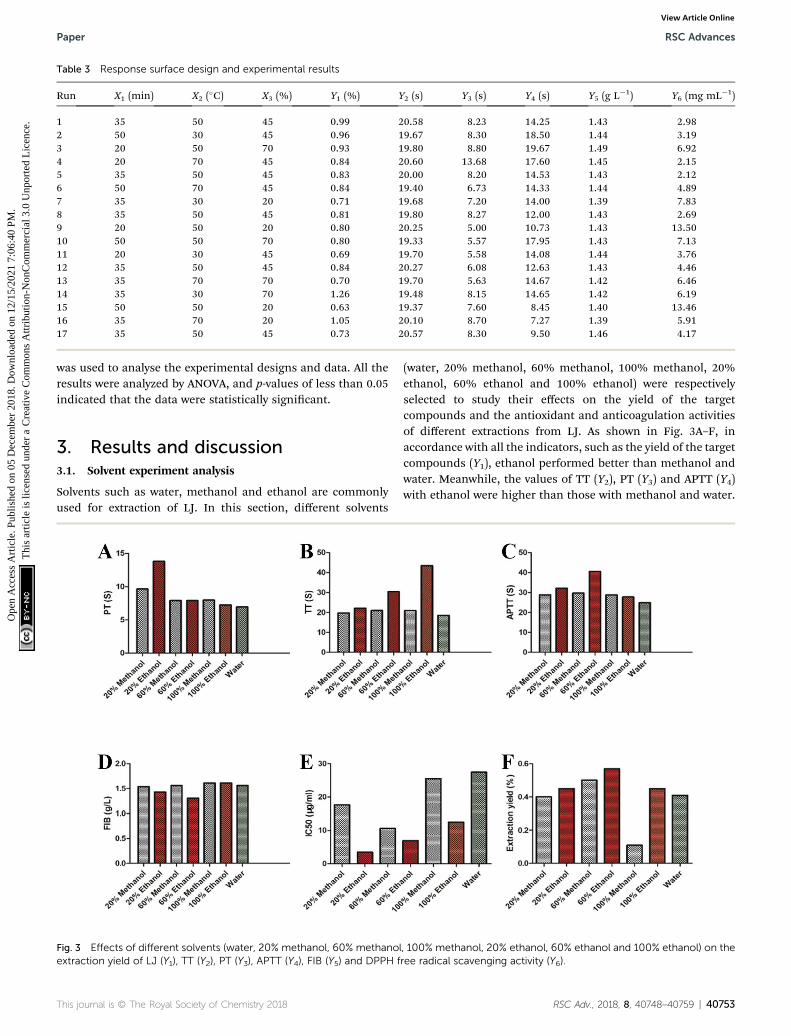
Table 3 Response surface design and experimental results
Run X1 (min) X2 (�C) X3 (%) Y1 (%) Y2 (s) Y3 (s) Y4 (s) Y5 (g L�1) Y6 (mg mL�1)
1 35 50 45 0.99 20.58 8.23 14.25 1.43 2.982 50 30 45 0.96 19.67 8.30 18.50 1.44 3.193 20 50 70 0.93 19.80 8.80 19.67 1.49 6.924 20 70 45 0.84 20.60 13.68 17.60 1.45 2.155 35 50 45 0.83 20.00 8.20 14.53 1.43 2.126 50 70 45 0.84 19.40 6.73 14.33 1.44 4.897 35 30 20 0.71 19.68 7.20 14.00 1.39 7.838 35 50 45 0.81 19.80 8.27 12.00 1.43 2.699 20 50 20 0.80 20.25 5.00 10.73 1.43 13.5010 50 50 70 0.80 19.33 5.57 17.95 1.43 7.1311 20 30 45 0.69 19.70 5.58 14.08 1.44 3.7612 35 50 45 0.84 20.27 6.08 12.63 1.43 4.4613 35 70 70 0.70 19.70 5.63 14.67 1.42 6.4614 35 30 70 1.26 19.48 8.15 14.65 1.42 6.1915 50 50 20 0.63 19.37 7.60 8.45 1.40 13.4616 35 70 20 1.05 20.10 8.70 7.27 1.39 5.9117 35 50 45 0.73 20.57 8.30 9.50 1.46 4.17
Paper RSC Advances
Ope
n A
cces
s A
rtic
le. P
ublis
hed
on 0
5 D
ecem
ber
2018
. Dow
nloa
ded
on 1
2/15
/202
1 7:
06:4
0 PM
. T
his
artic
le is
lice
nsed
und
er a
Cre
ativ
e C
omm
ons
Attr
ibut
ion-
Non
Com
mer
cial
3.0
Unp
orte
d L
icen
ce.
View Article Online
was used to analyse the experimental designs and data. All theresults were analyzed by ANOVA, and p-values of less than 0.05indicated that the data were statistically signicant.
3. Results and discussion3.1. Solvent experiment analysis
Solvents such as water, methanol and ethanol are commonlyused for extraction of LJ. In this section, different solvents
Fig. 3 Effects of different solvents (water, 20% methanol, 60% methanolextraction yield of LJ (Y1), TT (Y2), PT (Y3), APTT (Y4), FIB (Y5) and DPPH f
This journal is © The Royal Society of Chemistry 2018
(water, 20% methanol, 60% methanol, 100% methanol, 20%ethanol, 60% ethanol and 100% ethanol) were respectivelyselected to study their effects on the yield of the targetcompounds and the antioxidant and anticoagulation activitiesof different extractions from LJ. As shown in Fig. 3A–F, inaccordance with all the indicators, such as the yield of the targetcompounds (Y1), ethanol performed better than methanol andwater. Meanwhile, the values of TT (Y2), PT (Y3) and APTT (Y4)with ethanol were higher than those with methanol and water.
, 100% methanol, 20% ethanol, 60% ethanol and 100% ethanol) on theree radical scavenging activity (Y6).
RSC Adv., 2018, 8, 40748–40759 | 40753

RSC Advances Paper
Ope
n A
cces
s A
rtic
le. P
ublis
hed
on 0
5 D
ecem
ber
2018
. Dow
nloa
ded
on 1
2/15
/202
1 7:
06:4
0 PM
. T
his
artic
le is
lice
nsed
und
er a
Cre
ativ
e C
omm
ons
Attr
ibut
ion-
Non
Com
mer
cial
3.0
Unp
orte
d L
icen
ce.
View Article Online
Moreover, for the FIB (Y5) and DPPH free radical scavengingactivity (Y6), the values with ethanol were lower than those withmethanol and water. Therefore, ethanol was selected as theideal solvent for the subsequent experiments.43
3.2. Single factor experiment analysis
3.2.1. Effects of ultrasonication time. The effects of ultra-sonication time on the extraction yield of anticoagulant andantioxidant compounds from LJ were investigated at differenttimes (10, 20, 30, 40, 50, 60, 70, 80 and 90 min) while the otherextraction conditions were maintained as follows: ultra-sonication temperature of 30.0 �C, ethanol concentration of70.0% (v/v), ultrasonic power of 200.0 W and solid–liquid ratioof 20.0 mL g�1. As shown in Fig. 4, as the ultrasonication timeincreased from 10 to 50 min, Y1 was enhanced and then showedalmost no changes. Y2 to Y4 showed continuous changesbetween 10 and 50 min. Meanwhile, Y5 decreased from 20 to50 min and Y6 decreased from 30 to 50 min. Therefore, anultrasonication time range of 20 to 50 min was chosen asoptimal in the BBD experiments.45,46
3.2.2. Effects of ethanol concentration. In this part, tostudy the effects of ethanol concentration on the anticoagulantand antioxidant activities of LJ extracts, different ethanolconcentrations of 10% to 90% (v/v) were investigated, while theother extraction conditions were maintained as follows: ultra-sonication temperature, 30.0 �C; ultrasonication time, 30.0 min;solid–liquid ratio, 20.0 mL g�1; and ultrasonic power, 200.0 W.As shown in Fig. S1,† Y1 to Y4 showed increasing trends as theethanol concentration increased from 20% to 70%, while Y5 andY6 decreased to their valley values at ethanol concentrations of
Fig. 4 Effects of ultrasonication time on the extraction yield of LJ (Y1), TT(Y6).
40754 | RSC Adv., 2018, 8, 40748–40759
20% and 40%, respectively. Therefore, the ethanol concentra-tion range of 20% to 70% (v/v) was adopted as optimal in thesubsequent BBD experiments.45,47
3.2.3. Effects of solid–liquid ratio. The effects of the solid–liquid ratio on the yield of the anticoagulant and antioxidantcompounds of LJ were inspected at eight levels, from 10 : 1 to80 : 1 mL g�1, while the other conditions were maintained asfollows: ultrasonication temperature of 30.0 �C, ultrasonicationtime of 30.0 min, ethanol concentration of 70.0% (v/v) andultrasonic power of 200.0 W. From Fig. S2,† when the solid–liquid ratios were 10 : 1 to 80 : 1 mL g�1, Y1 to Y6 remainedsimilar and showed no obvious differences. However, when thesolid–liquid ratio was 30 : 1 mL g�1, Y1, Y2, Y4 and Y6 weremaximal. Thus, 30 : 1 mL g�1 was chosen for the followingstudy to optimize the extraction conditions of LJ.
3.2.4. Effects of temperature. Temperature is an importantfactor that inuences the extraction yield of the anticoagulantand antioxidant compounds of LJ. The effects of differenttemperatures (30 �C, 40 �C, 50 �C, 60 �C and 70 �C) on theextraction efficiency of LJ were investigated, and the otherextraction parameters were maintained as follows: ultra-sonication time, 30.0 min; ethanol concentration, 70.0% (v/v);ultrasonic power, 200.0 W; and solid–liquid ratio, 20.0 mLg�1. As shown in Fig. S3,† as the temperature increased from30 �C to 50 �C, Y1 and Y3 increased. Aer that, Y1 and Y3 werealmost unchanged from 50 �C to 70 �C. Y2 and Y4 showeductuations from 30 �C to 70 �C. Y5 and Y6 were similar.Therefore, the temperature range of 30 �C to 70 �C was adoptedas optimal in the BBD experiments.
3.2.5. Effects of ultrasonic power. The effects of ultrasonicpower on the yield of the anticoagulant and antioxidant
(Y2), PT (Y3), APTT (Y4), FIB (Y5) and DPPH free radical scavenging activity
This journal is © The Royal Society of Chemistry 2018
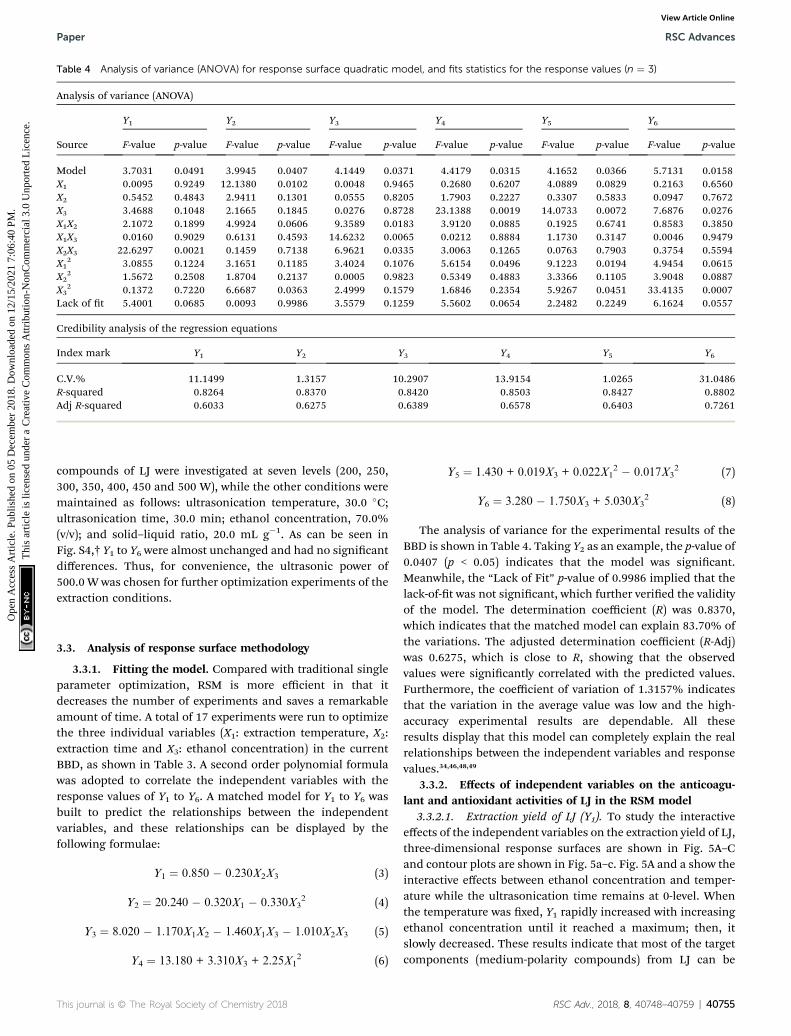
Table 4 Analysis of variance (ANOVA) for response surface quadratic model, and fits statistics for the response values (n ¼ 3)
Analysis of variance (ANOVA)
Source
Y1 Y2 Y3 Y4 Y5 Y6
F-value p-value F-value p-value F-value p-value F-value p-value F-value p-value F-value p-value
Model 3.7031 0.0491 3.9945 0.0407 4.1449 0.0371 4.4179 0.0315 4.1652 0.0366 5.7131 0.0158X1 0.0095 0.9249 12.1380 0.0102 0.0048 0.9465 0.2680 0.6207 4.0889 0.0829 0.2163 0.6560X2 0.5452 0.4843 2.9411 0.1301 0.0555 0.8205 1.7903 0.2227 0.3307 0.5833 0.0947 0.7672X3 3.4688 0.1048 2.1665 0.1845 0.0276 0.8728 23.1388 0.0019 14.0733 0.0072 7.6876 0.0276X1X2 2.1072 0.1899 4.9924 0.0606 9.3589 0.0183 3.9120 0.0885 0.1925 0.6741 0.8583 0.3850X1X3 0.0160 0.9029 0.6131 0.4593 14.6232 0.0065 0.0212 0.8884 1.1730 0.3147 0.0046 0.9479X2X3 22.6297 0.0021 0.1459 0.7138 6.9621 0.0335 3.0063 0.1265 0.0763 0.7903 0.3754 0.5594X1
2 3.0855 0.1224 3.1651 0.1185 3.4024 0.1076 5.6154 0.0496 9.1223 0.0194 4.9454 0.0615X2
2 1.5672 0.2508 1.8704 0.2137 0.0005 0.9823 0.5349 0.4883 3.3366 0.1105 3.9048 0.0887X3
2 0.1372 0.7220 6.6687 0.0363 2.4999 0.1579 1.6846 0.2354 5.9267 0.0451 33.4135 0.0007Lack of t 5.4001 0.0685 0.0093 0.9986 3.5579 0.1259 5.5602 0.0654 2.2482 0.2249 6.1624 0.0557
Credibility analysis of the regression equations
Index mark Y1 Y2 Y3 Y4 Y5 Y6
C.V.% 11.1499 1.3157 10.2907 13.9154 1.0265 31.0486R-squared 0.8264 0.8370 0.8420 0.8503 0.8427 0.8802Adj R-squared 0.6033 0.6275 0.6389 0.6578 0.6403 0.7261
Paper RSC Advances
Ope
n A
cces
s A
rtic
le. P
ublis
hed
on 0
5 D
ecem
ber
2018
. Dow
nloa
ded
on 1
2/15
/202
1 7:
06:4
0 PM
. T
his
artic
le is
lice
nsed
und
er a
Cre
ativ
e C
omm
ons
Attr
ibut
ion-
Non
Com
mer
cial
3.0
Unp
orte
d L
icen
ce.
View Article Online
compounds of LJ were investigated at seven levels (200, 250,300, 350, 400, 450 and 500 W), while the other conditions weremaintained as follows: ultrasonication temperature, 30.0 �C;ultrasonication time, 30.0 min; ethanol concentration, 70.0%(v/v); and solid–liquid ratio, 20.0 mL g�1. As can be seen inFig. S4,† Y1 to Y6 were almost unchanged and had no signicantdifferences. Thus, for convenience, the ultrasonic power of500.0 W was chosen for further optimization experiments of theextraction conditions.
3.3. Analysis of response surface methodology
3.3.1. Fitting the model. Compared with traditional singleparameter optimization, RSM is more efficient in that itdecreases the number of experiments and saves a remarkableamount of time. A total of 17 experiments were run to optimizethe three individual variables (X1: extraction temperature, X2:extraction time and X3: ethanol concentration) in the currentBBD, as shown in Table 3. A second order polynomial formulawas adopted to correlate the independent variables with theresponse values of Y1 to Y6. A matched model for Y1 to Y6 wasbuilt to predict the relationships between the independentvariables, and these relationships can be displayed by thefollowing formulae:
Y1 ¼ 0.850 � 0.230X2X3 (3)
Y2 ¼ 20.240 � 0.320X1 � 0.330X32 (4)
Y3 ¼ 8.020 � 1.170X1X2 � 1.460X1X3 � 1.010X2X3 (5)
Y4 ¼ 13.180 + 3.310X3 + 2.25X12 (6)
This journal is © The Royal Society of Chemistry 2018
Y5 ¼ 1.430 + 0.019X3 + 0.022X12 � 0.017X3
2 (7)
Y6 ¼ 3.280 � 1.750X3 + 5.030X32 (8)
The analysis of variance for the experimental results of theBBD is shown in Table 4. Taking Y2 as an example, the p-value of0.0407 (p < 0.05) indicates that the model was signicant.Meanwhile, the “Lack of Fit” p-value of 0.9986 implied that thelack-of-t was not signicant, which further veried the validityof the model. The determination coefficient (R) was 0.8370,which indicates that the matched model can explain 83.70% ofthe variations. The adjusted determination coefficient (R-Adj)was 0.6275, which is close to R, showing that the observedvalues were signicantly correlated with the predicted values.Furthermore, the coefficient of variation of 1.3157% indicatesthat the variation in the average value was low and the high-accuracy experimental results are dependable. All theseresults display that this model can completely explain the realrelationships between the independent variables and responsevalues.34,46,48,49
3.3.2. Effects of independent variables on the anticoagu-lant and antioxidant activities of LJ in the RSM model
3.3.2.1. Extraction yield of LJ (Y1). To study the interactiveeffects of the independent variables on the extraction yield of LJ,three-dimensional response surfaces are shown in Fig. 5A–Cand contour plots are shown in Fig. 5a–c. Fig. 5A and a show theinteractive effects between ethanol concentration and temper-ature while the ultrasonication time remains at 0-level. Whenthe temperature was xed, Y1 rapidly increased with increasingethanol concentration until it reached a maximum; then, itslowly decreased. These results indicate that most of the targetcomponents (medium-polarity compounds) from LJ can be
RSC Adv., 2018, 8, 40748–40759 | 40755
Fig. 5 Response surface (3-D) and contour plots showing the effects of (A and a) extraction temperature (X2) and ethanol concentration (X3), (Band b) ultrasonication time (X1) and ethanol concentration (X3) and (C and c) ultrasonication time (X1) and extraction temperature (X2) on theextraction yield of LJ (Y1).
RSC Advances Paper
Ope
n A
cces
s A
rtic
le. P
ublis
hed
on 0
5 D
ecem
ber
2018
. Dow
nloa
ded
on 1
2/15
/202
1 7:
06:4
0 PM
. T
his
artic
le is
lice
nsed
und
er a
Cre
ativ
e C
omm
ons
Attr
ibut
ion-
Non
Com
mer
cial
3.0
Unp
orte
d L
icen
ce.
View Article Online
easily dissolved in highly concentrated ethanol solution.Therefore, to improve the solubility of the medium-polaritytarget compounds, a higher ethanol concentration was usedto enhance the value of Y1. Fig. 5B and b show the interactiveeffects between ethanol concentration and ultrasonication timewhile the temperature remains at 0-level. The value of Y1remarkably improved with increasing ethanol concentrationfrom 20% to 60% (v/v), while Y1 increased slightly withincreasing ultrasonication time from 30 to 50 min. The mainreason for this may be saturation of the solution; as the timeincreased, most components were extracted completely. Fig. 5Cand c show the interactive effects between the temperature andultrasonication time while the ethanol concentration was xed.The value of Y1 increased remarkably with increasing temper-ature, while the changes in the ultrasonication time had almostno effect on Y1 aer 50 min. The above results are in accordancewith the ANOVA (Table 4). These results indicate that X2, X3 andX2X3 are signicant (p < 0.05) for Y1.
Aer optimization by the BBD soware, the optimumconditions were an ultrasonication time of 41.2 min, a temper-ature of 30.0 �C, an ethanol concentration of 70.0% (v/v),a solid–liquid ratio of 30.0 mL g�1 and an ultrasonic power of500.0 W.
3.3.2.2. TT assay (Y2). To explain the interactive effects onthe anticoagulation activities of LJ extracts, three dimensionalresponse surfaces are displayed in Fig. 6A–C; the contour plotsare shown in Fig. 6a–c. Fig. 6A and a show the interactive effectsbetween ethanol concentration and temperature with a xedultrasonication time. Y2 showed an enhancement and thendecreased slightly when the ethanol concentration increased
40756 | RSC Adv., 2018, 8, 40748–40759
from 20% to 50% (v/v) and the temperature increased from30 �C to 50 �C. Most of the components of LJ dissolved easily inhighly concentrated ethanol solution. At the same time, withincreasing temperature, the molecular movement becameviolent, resulting in complete extraction of the LJ. Moreextracted components may promote invigoration of the bloodcirculation. However, when the solution became saturated, theincreases in ethanol concentration and temperature becameunimportant. Fig. 6B and b show the interactive effects betweenethanol concentration and ultrasonication time at a xedtemperature. As before, Y2 improved remarkably when theethanol concentration increased from 20% to 60%. Fig. 6C andc show the interactive effects between the temperature andultrasonication time with a stable ethanol concentration. Y2increased as the temperature increased from 30 �C to 60 �C.However, extension of the ultrasonication time did not greatlyaffect Y2. The ANOVA results (Table 4) showed that X1 and X3
2
were signicant (p < 0.05) for Y2 and that X1 and X3 are the majorfactors affecting Y2. Therefore, for Y2, the optimum conditionswere found to be as follows: ultrasonication time, 20.0 min;temperature, 70.0 �C; ethanol concentration, 34.1% (v/v); solid–liquid ratio, 30.0 mL g�1; and ultrasonic power, 500.0 W.
3.3.2.3. PT assay (Y3). The three-dimensional responsesurfaces and contour plots for Y3 are displayed in Fig. S5A–Cand Fig. S5a–c,† respectively. Firstly, Fig. S5A and a† show theinteractive effects between ethanol concentration and temper-ature with a xed ultrasonication time. When the ethanolconcentration increased, Y3 improved. Secondly, Fig. S5B andb† show the interactive effects between ethanol concentrationand ultrasonication time at a stable temperature. Obviously, Y3
This journal is © The Royal Society of Chemistry 2018

Fig. 6 Response surface (3-D) and contour plots showing the effects of (A and a) extraction temperature (X2) and ethanol concentration (X3), (Band b) ultrasonication time (X1) and ethanol concentration (X3) and (C and c) ultrasonication time (X1) and extraction temperature (X2) on TT (Y2).
Paper RSC Advances
Ope
n A
cces
s A
rtic
le. P
ublis
hed
on 0
5 D
ecem
ber
2018
. Dow
nloa
ded
on 1
2/15
/202
1 7:
06:4
0 PM
. T
his
artic
le is
lice
nsed
und
er a
Cre
ativ
e C
omm
ons
Attr
ibut
ion-
Non
Com
mer
cial
3.0
Unp
orte
d L
icen
ce.
View Article Online
was affected by the ethanol concentration. Finally, Fig. S5C andc† showed the interactive effects between the temperature andultrasonication time at a xed ethanol concentration. Y3decreased markedly with increasing temperature and ultra-sonication time. The above results are in accordance with theANOVA (Table 4), which showed that X1X2, X1X3 and X2X3 aresignicant (p < 0.05) for Y3. For Y3, the optimum conditionswere found to be as follows: ultrasonication time, 20.0 min;temperature, 70.0 �C; ethanol concentration, 53.7% (v/v); solid–liquid ratio, 30.0 mL g�1; and ultrasonic power, 500.0 W.
3.3.2.4. APTT assay (Y4). Fig. S6A–C and Fig. S6a–c† showhow the ethanol concentration, temperature and ultra-sonication affect the blood circulation invigoration activities ofLJ extract. From the results, ethanol concentration plays themost important role of the three independent variables. Y4showed an obvious improvement with increasing ethanolconcentration and showed no changes with increasingtemperature and ultrasonication time. This analysis was inkeeping with the ANOVA (Table 4), which showed that X3 is themajor factor affecting Y4 and that X1
2 and X3 are signicant (p <0.05) for Y4. For Y4, the optimum conditions were found to be asfollows: ultrasonication time, 20.0 min; temperature, 70.0 �C;ethanol concentration, 70.0% (v/v); solid–liquid ratio, 30.0 mLg�1; and ultrasonic power, 500.0 W.
3.3.2.5. FIB assay (Y5). Y5 is closely connected with the bloodcirculation invigorating activities of LJ extract. Next, Fig. S7A–Cand Fig. S7a–c† show the relationships between the threeindependent variables and Y5. Fig. S7A and a† show the inter-active effects of ethanol concentration and temperature witha xed ultrasonication time. Y5 decreased as the ethanolconcentration increased. Fig. S7B and b† show the interactive
This journal is © The Royal Society of Chemistry 2018
effects of ethanol concentration and ultrasonication time ata stable temperature. The ethanol concentration also affected Y5remarkably, while the ultrasonication time showed no effects.Fig. S7C and c† show the interactive effects of temperature andultrasonication time at a constant ethanol concentration. Y5decreased with increasing temperature. The above results are inline with the ANOVA (Table 4), which indicates that X1
2, X32 and
X3 are signicant (p < 0.05) for Y5 and that X3 is the major factoraffecting Y5. For Y5, the optimum extraction parameters werefound to be as follows: ultrasonication time of 38.3 min,temperature of 30.1 �C, ethanol concentration of 20.4% (v/v),solid–liquid ratio of 30.0 mL g�1 and ultrasonic power of500.0 W.
3.3.2.6. DPPH free radical scavenging activity (Y6). To inves-tigate the interactive effects on the antioxidant activities of LJextract, three dimensional response surface and contour plotswere drawn and are displayed in Fig. S8A–C and Fig. S8a–c,†respectively. First, Fig. S8A and a† show that increasing theethanol concentration led to a rapid decrease of Y6 when theultrasonication time was xed. Fig. S8B and b† show that Y6decreased with increasing ethanol concentration and ultra-sonication time at the same time. Fig. S8C and c† show thatwhen the ethanol concentration was stable, Y6 changed slightlywith increasing temperature and ultrasonication time. Theabove results are in keeping with the ANOVA (Table 4), whichshows that X3 and X3
2 are signicant (p < 0.05) for Y6 and that X3
is the major factor affecting Y6. Therefore, for Y6, the optimumparameters were found to be as follows: ultrasonication time,30.6 min; temperature, 70.0 �C; ethanol concentration, 48.1%(v/v); solid–liquid ratio, 30.0 mL g�1; and ultrasonic power,500.0 W.
RSC Adv., 2018, 8, 40748–40759 | 40757

RSC Advances Paper
Ope
n A
cces
s A
rtic
le. P
ublis
hed
on 0
5 D
ecem
ber
2018
. Dow
nloa
ded
on 1
2/15
/202
1 7:
06:4
0 PM
. T
his
artic
le is
lice
nsed
und
er a
Cre
ativ
e C
omm
ons
Attr
ibut
ion-
Non
Com
mer
cial
3.0
Unp
orte
d L
icen
ce.
View Article Online
3.3.3. Validation of the predicted value. In consideration ofthe multiple indicators of this experiment model, it was difficultto consider all of them. Therefore, the function of Design Expertsoware version 8.0 called ‘Numerical Optimization’ was usedto coordinate all the conditions. Then, we acquired the optimalultrasonic extraction conditions according to the model equa-tion by predicting the response values: ultrasonication time,38.2 min; temperature, 30.0 �C; ethanol concentration, 48.9%(v/v); solid–liquid ratio, 30.0 mL g�1; and ultrasonic power,500.0 W. Under the optimal extraction conditions, the experi-mental values (extraction yield of LJ ¼ 0.994%, TT ¼ 19.872 s,PT ¼ 8.270 s, APTT ¼ 15.535 s, FIB ¼ 1.420 g L�1 and DPPH ¼1.503 mg mL�1) were acquired was and were well matched withthe predicted values (extraction yield of LJ ¼ 0.992%, TT ¼19.876 s, PT ¼ 8.249 s, APTT ¼ 15.452 s, FIB ¼ 1.420 g L�1 andDPPH ¼ 1.498 mg mL�1). The excellent correlations betweenthe experimental and predicted values indicated that the modelobtained by BBD can accurately predict the anticoagulant andantioxidant extraction yield of LJ using UAE.
4. Conclusion
In this study, UAE was successfully optimized for the maximumextraction of natural antioxidants and anticoagulants from LJusing BBD. Five impact factors of extraction (ethanol concen-tration, solid–liquid ratio, ultrasonication time, ultrasonicpower and temperature) were evaluated, and the results indi-cated that ethanol concentration, ultrasonication time andtemperature have signicant effects on the yield of antioxidantsand anticoagulants extracted from LJ. Furthermore, the optimaltechnology was determined to be an ultrasonication time of38.2 min; a temperature of 30.0 �C; an ethanol concentration of48.9% (v/v); a solid–liquid ratio of 30.0 mL g�1; and an ultra-sonic power of 500.0 W. These results demonstrate that UAEcoupled with RSM is an effectual and feasible method for theextraction of natural antioxidants and anticoagulants from LJ;this will provide a scientic basis for the comprehensive utili-zation and development of LJ.
Conflicts of interest
There are no conicts to declare.
Acknowledgements
This work was nancially supported by the National Standard-ization Project for Traditional Chinese Medicines (ZYBZH-C-JS-34), National Natural Science Foundation of China (81573714,81603257, 81773882, 81781260279 and 81803699) and 333High-level Talents Training Project Funded by Jiangsu Province(BRA2016387). This research was also nancially supported byJiangsu Collaborative Innovation Center of Chinese MedicinalResources Industrialization (No. 012092002006-4), A ProjectFunded by the Priority Academic Program Development ofJiangsu Higher Education Institutions (PAPD) and China Agri-culture Research System (CARS-21). We are also pleased tothank Waters Ltd. for technical support.
40758 | RSC Adv., 2018, 8, 40748–40759
References
1 X. Shang, H. Pan, X. Wang, H. He and M. Li, J.Ethnopharmacol., 2014, 152, 14–32.
2 A. S. Oliveira, L. M. Cercato, M. T. de Santana Souz, A. J. deOliveira Melo, B. d. S. Lima, M. C. Duarte, A. A. de SouzaAraujo, A. M. de Oliveira e Silva and E. A. Camargo, J.Ethnopharmacol., 2017, 206, 144–151.
3 H. Nagasawa, H. Inatomi, M. Suzuki and T. Mori, AnticancerRes., 1992, 12, 141–143.
4 H. Q. Pang, S. J. Yue, Y. P. Tang, Y. Y. Chen, Y. J. Tan,Y. J. Cao, X. Q. Shi, G. S. Zhou, A. Kang, S. L. Huang,Y. J. Shi, J. Sun, Z. S. Tang and J. A. Duan, Front.Pharmacol., 2018, 9, 1–18.
5 S. W. Park, R. Vepachedu, N. Sharma and J. M. Vivanco,Planta, 2004, 219, 1093–1096.
6 C. Kaur and H. C. Kapoor, Int. J. Food Sci. Technol., 2001, 36,703–725.
7 A. Kumar and A. Singh, Front. Pharmacol., 2015, 6, 1–13.8 I. S. Young and J. V. Woodside, J. Clin. Pathol., 2001, 54, 176–186.
9 A. W. Boots, G. R. M. M. Haenen and A. Bast, Eur. J.Pharmacol., 2008, 585, 325–337.
10 S. Li, H. Y. Tan, N. Wang, Z. J. Zhang, L. Lao, C. W. Wong andY. Feng, Int. J. Mol. Sci., 2015, 16, 26087–26124.
11 F. M. F. Roleira, E. J. Tavares-da-Silva, C. L. Varela,S. C. Costa, T. Silva, J. Garrido and F. Borges, Food Chem.,2015, 183, 235–258.
12 G. F. Deng, C. Shen, X. R. Xu, R. D. Kuang, Y. J. Guo,L. S. Zeng, L. L. Gao, X. Lin, J. F. Xie, E. Q. Xia, S. Li,S. Wu, F. Chen, W. H. Ling and H. B. Li, Int. J. Mol. Sci.,2012, 13, 8308–8323.
13 M. E. Embuscado, J. Funct. Foods, 2015, 18, 811–819.14 E. N. Frankel and J. W. Finley, J. Agric. Food Chem., 2008, 56,
4901–4908.15 P. V. Hung, Crit. Rev. Food Sci. Nutr., 2016, 56, 25–35.16 S. Li, S. K. Li, R. Y. Gan, F. L. Song, L. Kuang and H. B. Li, Ind.
Crops Prod., 2013, 51, 289–298.17 F. Shahidi and P. Ambigaipalan, J. Funct. Foods, 2015, 18,
820–897.18 B. Gullon, T. A. Lu-Chau, M. T. Moreira, J. M. Lema and
G. Eibes, Trends Food Sci. Technol., 2017, 67, 220–235.19 M. Arshadi, T. M. Attard, R. M. Lukasik, M. Brncic,
A. M. d. C. Lopes, M. Finell, P. Geladi, L. NoemiGerschenson, F. Gogus, M. Herrero, A. J. Hunt, E. Ibanez,B. Kamm, I. Mateos-Aparicio, A. Matias, N. E. Mavroudis,E. Montoneri, A. R. C. Morais, C. Nilsson,E. H. Papaioannou, A. Richel, P. Ruperez, B. Skrbic,M. B. Solarov, J. Svarc-Gajic, K. W. Waldron and F. J. Yuste-Cordoba, Green Chem., 2016, 18, 6160–6204.
20 F. Dahmoune, H. Remini, S. Dairi, O. Aoun, K. Moussi,N. Bouaoudia-Madi, N. Adjeroud, N. Kadri, K. Lefsih,L. Boughani, L. Mouni, B. Nayak and K. Madani, Ind. CropsProd., 2015, 77, 251–261.
21 L. Liu, B. J. Shen, D. H. Xie, B. C. Cai, K. M. Qin and H. Cai,Pharmacogn. Mag., 2015, 11, 682–689.
This journal is © The Royal Society of Chemistry 2018

Paper RSC Advances
Ope
n A
cces
s A
rtic
le. P
ublis
hed
on 0
5 D
ecem
ber
2018
. Dow
nloa
ded
on 1
2/15
/202
1 7:
06:4
0 PM
. T
his
artic
le is
lice
nsed
und
er a
Cre
ativ
e C
omm
ons
Attr
ibut
ion-
Non
Com
mer
cial
3.0
Unp
orte
d L
icen
ce.
View Article Online
22 F. Dahmoune, B. Nayak, K. Moussi, H. Remini andK. Madani, Food Chem., 2015, 166, 585–595.
23 D. Povilaitis, V. Sulniute, P. R. Venskutonis andV. Kraujaliene, J. Cereal Sci., 2015, 62, 117–123.
24 B. Diaz-Reinoso, A. Moure, H. Dominguez and J. C. Parajo, J.Agric. Food Chem., 2006, 54, 2441–2469.
25 Z. Zekovic, A. Cvetanovic, J. Svarc-Gajic, S. Gorjanovic,D. Suznjevic, P. Maskovic, S. Savic, M. Radojkovic andS. Đurovic, Ind. Crops Prod., 2017, 108, 423–430.
26 P. Maskovic, V. Velickovic, M. Mitic, S. Đurovic, Z. Zekovic,M. Radojkovic, A. Cvetanovic, J. Svarc-Gajic and J. Vujic,Ind. Crops Prod., 2017, 109, 875–881.
27 P. Maskovic, V. Velickovic, S. Đurovic, Z. Zekovic,M. Radojkovic, A. Cvetanovic, J. Svarc-Gajic, M. Mitic andJ. Vujic, Phytomedicine, 2017, 38, 118–124.
28 V. Velickovic, S. Đurovic, M. Radojkovic, A. Cvetanovic,J. Svarc-Gajic, J. Vujic, S. Trifunovic and P. Maskovic, J.Supercrit. Fluids, 2017, 128, 331–337.
29 E. Backes, C. Pereira, L. Barros, M. A. Prieto, A. K. Genena,M. F. Barreiro, et al., Food Res. Int., 2018, 113, 197–209.
30 M. D. Esclapez, J. V. Garcia-Perez, A. Mulet and J. A. Carcel,Food Eng. Rev., 2011, 3, 108–120.
31 O. Laguna, A. Barakat, H. Alhamada, E. Durand, B. Barea,F. Fine, P. Villeneuve, M. Citeau, S. Dauguet andJ. Lecomte, Ind. Crops Prod., 2018, 118, 160–172.
32 T. Zhang, A. Sharma, Y. Li, Y. Zhou and X. Ding, J.Photochem. Photobiol., A, 2018, 178, 568–576.
33 C. Li, H. Song, Y. Jiao and H. Gao, Sci. Technol. Food Ind.,2016, 37, 204–209.
34 I. Rodriguez Amado, D. Franco, M. Sanchez, C. Zapata andJ. Antonio Vazquez, Food Chem., 2014, 165, 290–299.
This journal is © The Royal Society of Chemistry 2018
35 S. Y. Yang, S. W. Kim, Y. Kim, S. H. Lee, H. Jeon andK. W. Lee, Food Chem., 2015, 176, 420–425.
36 M. Pei, X. Duan and X. Pei, China J. Chin. Mater. Med., 2009,34, 2047–2050.
37 X. Cheng, X. Sang, Q. Yang, J. Meng, X. Tang and C. Zhang,Chin. J. Hosp. Pharm., 2013, 33, 1850–1852.
38 B. Liu and Y. Chen, J. Shenyang Pharm. Univ., 2016, 33, 303–306.
39 C. Zhou, Y. Zhang, Y. He, Y. Wang, J. Yu, Z. Dai and S. Ma,Chin. J. Pharm. Anal., 2016, 36, 830–834.
40 S. Tahmouzi and M. Ghodsi, Carbohydr. Polym., 2014, 112,396–403.
41 Z. Yin, W. Zhang, J. Zhang andW. Kang, Chem. Cent. J., 2017,11, 1–10.
42 A. S. Ahmed, E. E. Elgorashi, N. Moodley, L. J. McGaw,V. Naidoo and J. N. Eloff, J. Ethnopharmacol., 2012, 143,826–839.
43 A. Pandey, T. Belwal, K. C. Sekar, I. D. Bhatt and R. S. Rawal,Ind. Crops Prod., 2018, 119, 218–225.
44 K. H. Wong, G. Q. Li, K. M. Li, V. Razmovski-Naumovski andK. Chan, Food Chem., 2017, 231, 231–237.
45 D. P. Xu, J. Zheng, Y. Zhou, Y. Li, S. Li and H.-B. Li, FoodChem., 2017, 217, 552–559.
46 S. Chen, Z. Zeng, N. Hu, B. Bai, H. Wang and Y. Suo, FoodChem., 2018, 242, 1–8.
47 A. B. Das, V. V. Goud and C. Das, Ind. Crops Prod., 2017, 95,332–341.
48 X. Guo, X. Shang, X. Zhou, B. Zhao and J. Zhang, Ultrason.Sonochem., 2017, 38, 246–255.
49 H. Zhang, J. Birch, C. Xie, H. Yang, G. Dias, L. Kong andA. E. D. Bekhit, Ind. Crops Prod., 2018, 119, 191–200.
RSC Adv., 2018, 8, 40748–40759 | 40759


![Combination of ultrasonic assisted liquid phase ...carbonlett.org/Upload/files/CARBONLETT/[050-054]-Zunli Mo.pdf · Combination of ultrasonic assisted liquid phase exfoliation process](https://img.dokumen.tips/doc/110x75/5ac697987f8b9a5c558e0d68/combination-of-ultrasonic-assisted-liquid-phase-050-054-zunli-mopdfcombination.jpg)