Embed Size (px)
Citation preview

http://dx.doi.org/10.5599/jese.650 231
J. Electrochem. Sci. Eng. 9(4) (2019) 231-242; http://dx.doi.org/10.5599/jese.650
Open Access: ISSN 1847-9286
www.jESE-online.org Original scientific paper
Simultaneous determination of trace levels of Cd(II) and Pb(II) in tap water samples by anodic stripping voltammetry with 2-mercaptobenzothiazole modified electrode
Sophy Phlay1, Weena Aemaeg Tapachai2, Supunnee Duangthong1, Puchong Worattananurak1 and Pipat Chooto1, 1Analytical Chemistry Division, Department of Chemistry, Faculty of Science, Prince of Songkla University, Hatyai, Songkhla, 90112, Thailand 2Inorganic Chemistry Division, Department of Chemistry, Faculty of Science, Prince of Songkla University, Hatyai, Songkhla, 90112, Thailand
Corresponding author: [email protected]
Received: December 12, 2018; Revised: May 7, 2019; Accepted: May 9, 2019
Abstract Glassy carbon electrode (GCE) modified by 2-mercaptobenzothiazole (MBT), mesoporous silica (Meso) and bismuth was developed to determine Cd(II) and Pb(II) simultaneously by square wave anodic stripping voltammetry (SWASV). In-situ preparation was found to work best in optimum conditions of acetate buffer pH 6, accumulation potential of -1.1 V, deposition time of 300 s and scan rate of 200 mV/s. SW peaks revealed the linear range of 5-50 µg/L Cd(II) and 5-50 µg/L Pb(II). LOD and LOQ for Cd(II) and Pb(II) were determined as 0.56, 0.80, 1.87 and 2.66 µg/L, respectively. The interaction of metals with bismuth and MBT, as well as higher surface area due to mesoporous silica, support beneficial performance of the modified electrode. Insignificant interferences from other regularly present metal ions were found. With SRM1640 standard, the SWASV results are found comparable to those obtained by inductive coupled plasma optical emission spectrometry (ICP-OES). The method was used to analyze the metals in tap water by standard addition method with the satisfactory recovery of 100.7 % for Cd(II) and 100.8 % for Pb(II).
Keywords Modified electrodes; 2-mercaptobenzothiazole; Square wave anodic stripping voltammetry
Introduction
Among heavy metals with high potential in contamination of water for daily consumptions are
Cd(II) and Pb(II). At present, the contamination problems from both metals are still found in a
number of areas all over the world. The main source of Cd(II) is from discarded batteries, whereas

J. Electrochem. Sci. Eng. 9(4) (2019) 231-242 DETERMINATION OF Cd(II) AND Pb(II) TRACES
232
Pb(II) can contaminate water via dyes, paints, pipes and solders. It has been known that these metals
can occur together and cause more damage especially to the brain [1,2]. The limits set by USEPA are
0.005 mg/L for Cd(II) and 0.015 mg/L for Pb(II) [3]. The techniques which are cost-effective, fast,
simple and sensitive are therefore required in testing water samples. Even though there are a
number of possibilities, a reference technique that can be applied for simultaneous determination
of Pb(II) and Cd(II) in problematic areas around the world is still a matter of challenge. Traditional
methods with high sensitivity have usually been used in laboratory conditions for the detection of
Pb(II) and Cd(II), such as UV–vis spectrophotometry [4], fluorescence method [5], ion-selective
electrode [6], graphite furnace atomic absorption spectrometry [7], atomic emission spectroscopy
[8,9] and inductively coupled plasma mass spectrometry [10]. However, these techniques have the
drawbacks of being time-consuming, complex, expensive and not suitable for onsite analysis.
With electrode modification by organic compounds, polymers and nanomaterials,
electrochemical methods, especially anodic stripping voltammetry (ASV), can provide some
advantages including speed, accuracy, sensitivity, selectivity, reproducibility and stability [11]. Boron
doped diamond electrode (BDD) [12] was found to work well with Pb(II) and its modification with 4-
aminomethyl benzoic acid provided figures of merits for Cd(II) analysis [13]. For simultaneous
determination of Cd(II) and Pb(II), the most widely investigated is the use of bismuth which forms
alloys with both metals [14,15]. Satisfactory LOD values were especially obtained when Bi was
coupled with various materials such as carbon nanotubes in order to facilitate formation of larger
surface areas. A variety of compounds such as graphene [16], Co3O4 [17], polymers [18,19] and
crown ether [20,21] were also found to be successful in pre-concentrating both metal ions. Organic
ligands with electron rich atoms including phytic acid oxygen [22,23], phenolic oxygen and nitrogen
[24], cysteine sulfur [25,26] and lysine nitrogen [27] were found to implement better analytical
performances for simultaneous determination of Cd(II) and Pb(II). MBT is an alternative ligand
containing nitrogen and sulfur [28] which was used in the extraction of both metals before analysis
by flame atomic absorption spectroscopy (FAAS) [29], as a biosensor for pesticides [30] and in
forming polymeric structure to accommodate more complexing sites [31].
This paper reports an investigation of using MBT modified electrode for the first time to analyze
Pb(II) and Cd(II) simultaneously by an ASV technique. The method is optimized, verified and then
applied to the real samples.
EXPERIMENTAL
Reagents and samples
All reagents were used as received without any further treatment. Cd(II) and Pb(II) standards
were prepared in-house from their nitrate salts as an atomic spectroscopy standard solution.
Tetrabutylammonium hexafluorophosphate with the purity of 98.0 % and bismuth (III) nitrate
pentahydrate were obtained from Fluka, whereas 2-mercaptobenzothiazole and mesoporous silica
were from Sigma-Aldrich. Other reagents and metal salts for interference studies were of the
highest purity commercially available. All subsequent solutions were prepared with deionized water
(resistivity not less than 18 MΩ cm, ELGA water purification system, England) and purged by
nitrogen gas (99.99 %) for 2 min before use. Laboratory glassware was cleaned with 10 % (v/v) nitric
acid solution and then rinsed with deionized water. Cd(II) and Pb(II) standard solutions were
prepared by diluting the respective stock solutions with the high purity deionized water and stored
in polyethylene bottles before use.

Sophy Phlay et al. J. Electrochem. Sci. Eng. 9(4) (2019) 231-242
http://dx.doi.org/10.5599/jese.650 233
NIST (National Institute of Standards and Technology) SRM 1640 composed of natural fresh water
from Clear Creek, Colorado USA, was used as a reference with the certified value of 22.79 ± 0.96 µg/L
Cd(II) and 27.89 ± 0.14 µg/L Pb(II).
Tap water samples were collected in different spots within the city of Hatyai, Songkhla, Thailand,
digested by mixing the aliquot of 500 mL with 2 mL of concentrated HNO3 and 2 mL of KNO3, put in
cleaned polyethylene bottles and kept at 4 °C before analysis.
Instrumentation
A PowerLab 2/20 with Potentiostat (ADInstrument, Australia) and EChem software was used for
cyclic voltammetry (CV) and square wave anodic stripping voltammetry (SWASV), whereas Metrohm
AUTOLAB PGSTAT 302N with NOVA software was used for EIS measurements. An Ag/AgCl, 3 M KCl
reference electrode (Metrohm), a platinum counter electrode (Metrohm) and a modified glassy
carbon electrode (Windsor Scientific Ltd., UK) with an inner diameter of 3 mm put in 50 mL cell were
used for electrochemical measurements. All voltages were reported versus Ag/AgCl reference
electrode. pH was measured by pH meter Model 510 (Eutech Instruments, USA) and inductively
coupled plasma optical emission spectrometer (ICP-OES) Optima 4300 DV (Perkin-Elmer, USA) was
used for the comparison of methods.
Preparation of modified electrode and starting procedure
The modified electrodes with different compositions and different orders of mixing were tested
to select the one with the best sensitivity enhancement. Differential pulse (DP) and square wave
(SW) results, as well as electrodes modified by in-situ and ex-situ Bi deposition were also compared.
The following starting procedure was designed for further optimization:
Three electrodes were put in 50 mL cell containing 50 mL of 0.1 M acetate buffer pH 6. Then,
0.1 g/L Cd(II) and Pb(II), 200 g/L Bi(III), 1000 mg/L Meso and 1000 mg/L MBT were added into
solution. The metals were then deposited under the initial conditions of -1.4 V for 300 s with stirring.
After the equilibration time of 30 s, SWASV potential was scanned from -1.0 to -0.2 V with the scan
rate of 250 mV/s, frequency of 50 Hz, amplitude of 75 mV and potential step of 160 mV to obtain
the stripping current signals for analysis. Optimization was conducted by varying a number of
parameters (vide infra) for the best analytical performance to be used in real sample analysis.
Results and discussion
Electrode modification and voltammograms of Cd(II) and Pb(II)
A number of modification experiments has been conducted to figure out the most suitable
materials and methods. Ex-situ Bi deposition was found to result in a lower current value and
unsymmetrical peak shape. As shown in Figure 1, the best sensitivity was obtained for in-situ
modified GCE in the order of Bi + Meso + MBT. The results reflect the role of Meso in increasing
surface areas and sites, and role of Bi and MBT in alloy forming and complexation, respectively.
Within the potential range of -1.0 to -0.2 V applied after the starting procedure, two well defined
stripping peaks at Bi + Meso + MBT modified electrode were observed at -0.72 V for Cd(II)
and -0.58 V for Pb(II), and the enhancement of stripping currents can be clearly seen for both metal
ions. This kind of electrode modification was therefore used for further optimization, verification
and analysis.

J. Electrochem. Sci. Eng. 9(4) (2019) 231-242 DETERMINATION OF Cd(II) AND Pb(II) TRACES
234
Figure 1. Comparison of stripping currents of 0.1 mg/L Cd(II) and Pb(II) at differently modified electrodes in
conditions of 0.1 M acetate buffer pH 6, deposition potential -1.4 V, deposition time 300 s, equilibration time 30 s and concentrations of Meso 1000 mg/L, MBT 1000 mg/L and Bi 0.2 mg/L.
CV and EIS for electrode characterizations
Figure 2 shows the cyclic voltammetry (CV) results of differently modified GCEs in acetate buffer
solution containing Ru(NH3)63+ (a) and Fe(CN)6
4- (b). It is clear that each modification step of GCE
supports the electron transfer well for both inner and outer spheres by maintaining reversibility and
increasing the current.
Figure 2. Cyclic voltammetry for bare GCE, Bi/GCE, Meso-Bi/GCE and Bi-Meso-MBT/GCE, with scan
rate 100 mV/s in 0.1 M acetate buffer containing 2.5 mM Ru(NH3)63+ (a) and Fe(CN)6
4- (b).

Sophy Phlay et al. J. Electrochem. Sci. Eng. 9(4) (2019) 231-242
http://dx.doi.org/10.5599/jese.650 235
The electron transfer capacities of modified electrodes were characterized by electrochemical im-
pedance spectroscopy (EIS). Less curvature in an impedance spectrum is well known to represent less
resistance to electron transfer. Therefore, Figure 3 reveals that addition of each modifying agent faci-
litates the electron transfer exhibiting less resistance, and the effect is highest after addition of MBT.
Z‛ /
Figure 3. Impedance spectra of the bare GCE, Bi/GCE, Bi-Meso/GCE, Bi-Meso-MBT/GCE.
Optimization
Comparison of SWASV and DPASV
SWASV and DPASV parameters are summarized in Table 1. Comparison of corresponding
stripping currents is presented in Figure 4, showing higher current enhancement in the case of
SWASV. Hence, SWASV technique is selected for the following experiments.
Table 1. SWASV and DPASV parameters
Parameter SWASV DPASV
Accumulation step Deposition potential Deposition time Equilibration time Measuring Step Frequency Step potential Amplitude
-1000 mV
400 s 30 s
50 Hz
160 mV 75 mV
-1000 mV
800 s 30 s
-
100 mV 75 mV
Figure 4. Comparison of stripping currents of 0.1 mg/L Cd(II) and Pb(II) from SWASV and DPASV.
-Z‛‛
/

J. Electrochem. Sci. Eng. 9(4) (2019) 231-242 DETERMINATION OF Cd(II) AND Pb(II) TRACES
236
Effect of pH
Within the experimental pH range of 1 to 7, the maximum peak current for both metals was
obtained at pH 6 as shown in Figure 5(a) and this value was used for the next investigations. pH 6 is
suitable for the formation of sulfide anions of MBT to form complexes with metal ions corresponding
with pKa of 6.93 [32]. If pH is lower than 6, protonation causes the formation of sulfhydryl groups
which make complex formation more difficult. At pH higher than 6, the metals are probably
susceptible to form hydroxides.
Deposition potential
The influence of deposition potentials was investigated over the potential range of -0.1 to
-1.5 V. As shown in Figure 5(b), the current firstly increased steeply up to -1.1 V and then became
almost constant. This is due to the greater extent of metal accumulation until the potential was high
enough for deposition of both metals. Beyond -1.4 V, the current started to drop, possibly because
greater thickness slows down the mass transfer and higher negative potential is susceptible to side
reactions. The highest current for both metals is found at -1.1 V which was fixed for metal
electrodeposition for the following study.
Deposition time
The deposition time was varied from 100 to 500 s. As shown in Figure 5(c), the current values
gradually increased with time up to 300 s because greater accumulation of bismuth facilitated
formation of alloys until surface saturation was reached. However, the current dropped before it
went up again, reflecting that certain time is needed for alloy rearrangement. The highest peak
current was found at 300 s and this was used for further optimizations and applications.
Effect of Bi concentration
The concentration of Bi was varied from 100 to 500 g/L. Figure 5(d) reveals firstly a normal trend
of increasing current which is due to the increase of film thickness and then the current decreased
because greater thickness can inhibit the mass transfer during the stripping step [33]. The
concentration of 200 g/L provided the greatest peak current for both metals and was therefore
selected for the following experiments.
Effect of Meso concentration
As shown in Figure 5(e), similar trend is obtained when Meso concentrations were changed from
100 to 600 µg/L. Similar to previous explanation of the effect of Bi concentration, the excess of Meso
can result in less current due to the obstruction of mass transfer. The concentration of 300 µg/L
showing the greatest current was chosen for further investigations.
Effect of MBT concentration
As shown in Figure 5(f), within the studied range of 100 to 600 µg/L, the stripping current increased
with MBT concentration up to 100 µg/L and then decreased for both metals. This is due to the fact
that high concentration of MBT could block the mass transfer of metal ions at electrodeposition sites.
The MBT concentration of 200 µg/L was therefore selected for further experiments.
Scan rate
The stripping scan rate was changed from 50 to 300 mV/s. The stripping peak height was found
to increase with the scan rate from 50 to 250 mV/s as shown in Figure 6. Under the criteria of peak
shapes, 250 mV/s is chosen for the further study.
For equilibration time, step potential and pulse amplitude, the optimization value based on the
greater current was selected.

Sophy Phlay et al. J. Electrochem. Sci. Eng. 9(4) (2019) 231-242
http://dx.doi.org/10.5599/jese.650 237
Figure 5. Effects of pH (a), deposition potential (b), deposition time (c), Bi concentration (d), Meso
concentration (e) and MBT concentration (f) on stripping peak currents of 20 μg/L Cd(II) and Pb(II).
All aforementioned optimized parameters are summarized in Table 2 and used in further
experiments.
Table 2. Summary of optimized operating conditions Parameter Studied Range Optimum Value
Deposition potential, V Deposition time, s pH Bi concentration, µg/L MBT concentration, µg/L Meso concentration, µg/L Equilibration time, s Step potential, mV Pulse amplitude, mV Scan rate, mV / s
-0.1 – -1.5 100 – 500
3 – 7 100 – 500 100 – 600 100 – 600
10 – 50 1 – 20
25 – 80 50 – 300
-1.1 300
6 200 200 300 30 5
75 250

J. Electrochem. Sci. Eng. 9(4) (2019) 231-242 DETERMINATION OF Cd(II) AND Pb(II) TRACES
238
Figure 6. Effect of scan rate on stripping currents for concentrations of Pb(II) and Cd(II)
0.1 mg/L, Bi 200 µg/L, MBT 200 µg/L, Meso 300 µg/L.
Analytical performance
SWASV was used for simultaneous determination of Cd(II) and Pb(II) with the modified electrode
Bi-Meso-MBT/GCE performed under optimized conditions to obtain current signals. The results for
certain typical concentrations of Cd(II) and Pb(II) are shown in Figure 7 and the corresponding cali-
bration curves are presented in Figure 8. The linearity in the range of 5-50 µg/L is observed for both
metals with the correlation coefficient of 0.9978 for Cd(II) and 0.9960 for Pb(II), respectively. The
linear regression equations of ip = 0.0142x + 0.0372 (ip: µA, x: µg/L) for Cd(II) and ip = 0.0113x - 0.0699
for Pb(II) are defined. The limits of detection are found to be 0.56 µg/L for Cd(II) and 0.80 µg/L for
Pb(II) by 3N/m, where N is the standard deviation of replicate (n=10) responses of 5 µg/L of both
metals taken as blank and m is the slope of the calibration curve. The limits of quantification, LOQ,
defined as 10 N/m, are determined as 1.87 µg/L for Cd(II) and 1.66 µg/L for Pb(II). The relative
standard deviations were 2.97 % for Cd(II) and 2.04 % for Pb(II) with repetitive determinations
(n=10) of 20.0 µg/L. All prove that the proposed method is satisfactorily reproducible and reliable
for simultaneous determination of Cd(II) and Pb(II) at trace level and can be applied to real samples.
Figure 7. Typical SWASV voltammograms of water samples after spiking with 5 (as a blank) to 50 µg/L of both Cd(II) and Pb(II) standard solutions. Conditions: accumulation potential -1.1 V,
accumulation time 300 s, acetate buffer solution pH 6, and scan rate 250 mV/s.

Sophy Phlay et al. J. Electrochem. Sci. Eng. 9(4) (2019) 231-242
http://dx.doi.org/10.5599/jese.650 239
Figure 8. Calibration curves for Cd(II) and Pb(II) obtained by the proposed method.
Effect of other ions
Due to the capability of MBT to coordinate with a number of metal ions, the level of interference
both from each other and other metal ions was investigated by the developed method under
optimized conditions and the results are shown in Table 3. With the increase of Pb(II) concentration,
no significant interference was observed for Cd(II) peak current. Other ions including Ca(II), Mg(II),
Zn(II), Mn(II), Fe(II), Cu(II) and Al(III) at 1000 µg/L were found to provide not high contributions for
both metals. The most interfering ions here if present at high concentration are Cu(II) and Co(II)
which normally can be masked by using a suitable and effective complexing agent such as
ferrocyanide before analysis.
Table 3. Interference study of the stripping current measurements of 20 μg/L Cd(II) and Pb(II) at Bi/Meso-MBT/GCE in the absence and presence of interfering metal ions
Interference Contribution, %a (Ip (Cd(II)) = 100 %) Contribution, %a (Ip (Pb(II)) = 100 %)
Cu(II)
Zn(II)
Mg(II)
Ca(II)
Al(III)
Mn(II)
Co(II)
Fe(III)
Ni(II)
-47.17
-16.68
37.49
0.48
2.34
13.36
-34.68
5.29
-4.37
-21.78
-13.44
14.98
-3.68
-7.63
0.65
-40.14
7.51
-5.87 aContribution = [(Ip with interferent - Ip without interferent) / Ip without interferent] 100
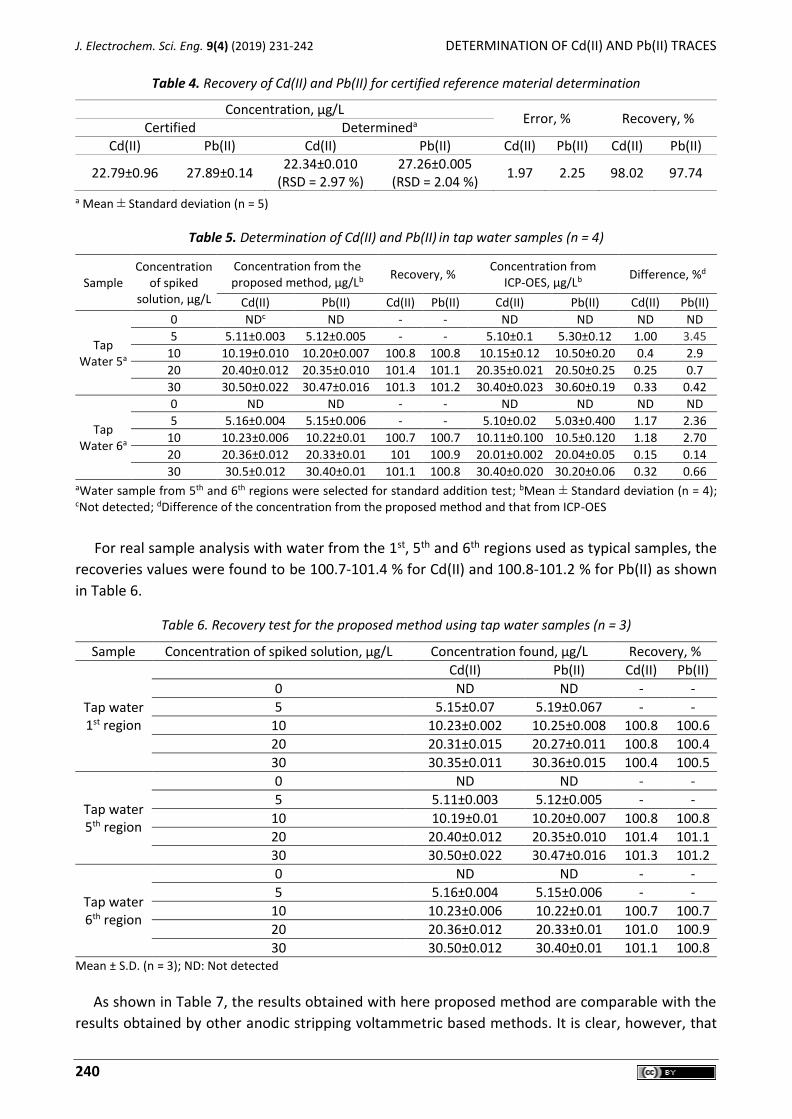
Certified reference material determination, method comparison and real sample analysis
The proposed method was applied to a certified reference material, natural water SRM 1640
from the National Institute of Standards and Technology (NIST), USA. As shown in Table 4,
satisfactory recoveries, of 98.02 % for Cd(II) and 97.74 % for Pb(II) were obtained.
The proposed method was then used in the analysis of Cd(II) and Pb(II) in tap water samples
collected from 11 sites in Hatyai city. Typical results of 5th and 6th regions are compared with ICP-
OES results and summarized in Table 5, reflecting good agreement between here proposed and
standard methods.
J. Electrochem. Sci. Eng. 9(4) (2019) 231-242 DETERMINATION OF Cd(II) AND Pb(II) TRACES
240
Table 4. Recovery of Cd(II) and Pb(II) for certified reference material determination
Concentration, µg/L Error, % Recovery, %
Certified Determineda Cd(II) Pb(II) Cd(II) Pb(II) Cd(II) Pb(II) Cd(II) Pb(II)
22.79±0.96 27.89±0.14 22.34±0.010
(RSD = 2.97 %) 27.26±0.005
(RSD = 2.04 %) 1.97 2.25 98.02 97.74
a Mean ± Standard deviation (n = 5)
Table 5. Determination of Cd(II) and Pb(II) in tap water samples (n = 4)
Sample Concentration
of spiked solution, µg/L
Concentration from the proposed method, µg/Lb
Recovery, % Concentration from
ICP-OES, µg/Lb Difference, %d
Cd(II) Pb(II) Cd(II) Pb(II) Cd(II) Pb(II) Cd(II) Pb(II)
Tap Water 5a
0 NDc ND - - ND ND ND ND
5 5.11±0.003 5.12±0.005 - - 5.10±0.1 5.30±0.12 1.00 3.45
10 10.19±0.010 10.20±0.007 100.8 100.8 10.15±0.12 10.50±0.20 0.4 2.9
20 20.40±0.012 20.35±0.010 101.4 101.1 20.35±0.021 20.50±0.25 0.25 0.7
30 30.50±0.022 30.47±0.016 101.3 101.2 30.40±0.023 30.60±0.19 0.33 0.42
Tap Water 6a
0 ND ND - - ND ND ND ND
5 5.16±0.004 5.15±0.006 - - 5.10±0.02 5.03±0.400 1.17 2.36
10 10.23±0.006 10.22±0.01 100.7 100.7 10.11±0.100 10.5±0.120 1.18 2.70
20 20.36±0.012 20.33±0.01 101 100.9 20.01±0.002 20.04±0.05 0.15 0.14
30 30.5±0.012 30.40±0.01 101.1 100.8 30.40±0.020 30.20±0.06 0.32 0.66 aWater sample from 5th and 6th regions were selected for standard addition test; bMean ± Standard deviation (n = 4); cNot detected; dDifference of the concentration from the proposed method and that from ICP-OES
For real sample analysis with water from the 1st, 5th and 6th regions used as typical samples, the
recoveries values were found to be 100.7-101.4 % for Cd(II) and 100.8-101.2 % for Pb(II) as shown
in Table 6.
Table 6. Recovery test for the proposed method using tap water samples (n = 3)
Sample Concentration of spiked solution, µg/L Concentration found, µg/L Recovery, %
Tap water 1st region
Cd(II) Pb(II) Cd(II) Pb(II)
0 ND ND - -
5 5.15±0.07 5.19±0.067 - -
10 10.23±0.002 10.25±0.008 100.8 100.6
20 20.31±0.015 20.27±0.011 100.8 100.4
30 30.35±0.011 30.36±0.015 100.4 100.5
Tap water 5th region
0 ND ND - -
5 5.11±0.003 5.12±0.005 - -
10 10.19±0.01 10.20±0.007 100.8 100.8
20 20.40±0.012 20.35±0.010 101.4 101.1
30 30.50±0.022 30.47±0.016 101.3 101.2
Tap water 6th region
0 ND ND - -
5 5.16±0.004 5.15±0.006 - -
10 10.23±0.006 10.22±0.01 100.7 100.7
20 20.36±0.012 20.33±0.01 101.0 100.9
30 30.50±0.012 30.40±0.01 101.1 100.8 Mean ± S.D. (n = 3); ND: Not detected
As shown in Table 7, the results obtained with here proposed method are comparable with the
results obtained by other anodic stripping voltammetric based methods. It is clear, however, that

Sophy Phlay et al. J. Electrochem. Sci. Eng. 9(4) (2019) 231-242
http://dx.doi.org/10.5599/jese.650 241
here proposed method has the advantage of wider linear range, lower detection limits and greater
simplicity. The only disadvantage could be a little longer deposition time, which can be adjusted
according to the required accuracy. Other very recent methods without using bismuth are also
included (Entry 1-6) as references to show that here proposed method is reasonably satisfactory.
Table 7. Comparison of the proposed method for determination of Cd(II) and Pb(II) in water sample with other recent anodic stripping voltammetric methods
Entry Electrodes Method Deposition
time, s
Linear range of concentration, µg/L
LOD, µg/L Ref
Cd(II) Pb(II) Cd(II) Pb(II)
1 HMgFe-EDG/G SWASV 180 11.2 – 207 11.2 – 207 1.22 0.304 [34]
2 ST PANI NTs SWASV 600 0.207 – 24.84 1.12 – 19.04 0.02 0.03 [35]
3 CA/RGO/GCE SWASV 1500 0.0207 – 2.07 0.112 – 13.44 0.004 0.002 [36]
4 Nafion/CLS/PGR/GCE SWASV 140 10.35 – 1035 5.60 – 560 2.06 0.336 [37]
5 GO/k-Car/L-Cys/GCE SWASV 120 1.03 – 10.35 0.56 – 5.60 0.12 0.12 [38]
6 NCQDs-GO DPASV 300 10.35 – 20.7 0.112 – 11200 1.16 7.4 [39]
7 In situ Bi/Graphite/Epoxy SWASV 120 41.4 – 352 56 – 280 14.5 5.60 [40]
8 Bi-Meso-MBT/GCE SWASV 300 5 - 50 5 – 50 0.56 0.80 This work
HMgFe-EDH/G: Hierarchical MgFe-layered double hydroxide microsphere graphene composite ST PANI NTs: Size-tunable polyaniline nanotube-modified electrode CA/RGO/GCE: calixarene functionalized reduced graphene oxide CLS/PGR: calcium lignosulphonate functionalized porous graphene nanocomposite
GO/-Car/L-Cys/GCE: graphene oxide -carrageenan L-cysteine nanocomposite NCQDs-GO: N-doped carbon quantum dots graphene oxide hybrid In situ Bi/Graphite/Epoxy: in situ bismuth film on graphite dispersed in epoxy resin Bi-Meso-MBT/GCE: Bismuth mesoporous silica 2-mercaptobenzothiazole modified GCE
Conclusions
GCE was modified with Bi, Meso and MBT and applied to simultaneous determination of Cd(II)
and Pb(II) in trace levels, using square wave anodic stripping voltammetry (SWASV). The method
provides satisfactory advantages of speed, simplicity, sensitivity and selectivity. Good recoveries of
Cd(II) (100.7 %) and Pb(II) (100.8 %) were obtained for the real sample, along with LOD of 0.56 µg/L
for Cd(II) and 0.80 µg/L for Pb(II), respectively. The method can be used satisfactorily for the analysis
of tap water in local areas and the results were found in good agreement with those obtained by
ICP-OES.
References
[1] V. Karri, M. Schuhmacher, V. Kumar, Environmental Toxicology and Pharmacology 48 (2015) 203-213.
[2] C. Yvonne H, M. P. Wilkie, Aquatic Toxicology 161 (2015) 176-188. [3] United States Environmental Protection Agency,
http://water.epa.gov/drink/contaminants/index/cfm (13th September 2017) [4] Q. Hu, G. Yang, Y. Zhao, J. Yin, Analytical and Bioanalytical Chemistry 375 (2003) 831-835. [5] S. Xu, S. Xu, Y. Zhu, W. Xu, P. Zhou, C. Zhou, B. Dong, H. Song, Nanoscale 6 (2014) 12573-12579. [6] M. Fouskaki, N. A. Chaniotakis, Analytical Chemistry 77 (2005) 1780-1784. [7] R. Liu, P. Liang, Journal of Hazardous Materials 152 (2008) 166–171. [8] G. Abbasse, B. Ouddane and J. C. Fischer, Journal of Analytical Atomic Spectrometry 17 (2002) 1354-
1358. [9] N. Pourreza, S. Rastegarzadeh, A. Larki, Journal of Industrial and Engineering Chemistry 20 (2014)
2680-2686.

J. Electrochem. Sci. Eng. 9(4) (2019) 231-242 DETERMINATION OF Cd(II) AND Pb(II) TRACES
242
[10] D. V. Biller, K. W. Bruland, Marine Chemistry 130-131 (2012) 12-20. [11] P. Chooto, Modified electrodes for determining trace metal ions. In: Application of the
Voltammetry. M. Stoytcheva, R. Zlatev, Ed(s)., Intech, Rijeka, Croatia: InTech; 2017 p. 129 [12] P. Chooto, P. Wararatananurak, C. Innuphat, ScienceAsia 36 (2010) 150-156. [13] C. Innuphat, P. Chooto, ScienceAsia 43 (2017) 33-41. [14] S. Cerovac, V. Guzsvány, Z. Kónya, A. M. Ashrafi, I. Švancara, S. Rončević, Á. Kukovecz, B. Dalmacija,
K. Vytřas, Talanta 134 (2015) 640-649. [15] D. Li, J. Jia, J. Wang, Talanta 83 (2010) 332-336. [16] L. Xiao, B. Wang, L. Ji, F. Wang, Q. Yuan, G. Hu, A. Dong, W. Gan, Electrochimica Acta 222 (2016)
1371-1377. [17] Y. Zuo, J. Xu, F. Jiang, X. Duan, L. Lu, H. Xing, T. Yang, Y. Zhang, G. Ye, Y. Yu, Journal of
Electroanalytical Chemistry 801 (2017) 146-152. [18] M. Arab Chamjangali, H. Kouhestani, F. Masdarolomoor, H. Daneshinejad, Sensors and Actuators B
Chemical 216 (2015) 384-393. [19] Y. Wu, N. B. Li, H. Q. Luo, Sensors and Actuators B 133 (2008) 677-681. [20] K. Keawkim, S. Chuanuwatanakul, O. Chailapakul, S. Motomizu, Food Control 31 (2013) 14-21. [21] N. Serrano, A. G. Calabuig, M. del Valle, Talanta 138 (2015) 130-137. [22] H. Dai, N. Wang, D. Wang, H. Ma, M. Lin, Chemical Engineering Journal 299 (2016) 150-155. [23] S. Kheirandish, M. Ghaedi, K. Dashtian, R. Jannesar, M. Montazerozohori, F. Pourebrahim, M. A.
Zare, Journal of Colloid and Interface Science 500 (2017) 241-252. [24] L. Zhu, L. Xu, B. Huang, N. Jia, L. Tan, S. Yao, Electrochimica Acta 115 (2014) 471-477. [25] J. P. Llovera, C. P. Ràfols, N. Serrano, J. M. Díaz-Cruz, C. Ariño, M. Esteban, Talanta 175 (2017) 501-
506. [26] Z. Guo, D. Li, X. Luo, Y. Li, Q. N. Zhao, M. Li, Y. Zhao, T. Sun, Chi Ma, Journal of Colloid and Interface
Science 490 (2017) 11-22. [27] I.P. Khullar, U. Agarwala, Canadian Journal of Chemistry 53 (1975) 1165-1171. [28] Ş. Tokalıoğlu, A. Papak, Ş. Kartal, Arabian Journal of Chemistry 10 (2017) 19-23. [29] V. S. Somerset, M. J. Klink, M. M. C. Sekota, P. G. L. Baker, E. I. Iwuoha, Analytical Letters 39 (2006)
1683-1698. [30] M. d. F. B. Sousa, E. J. Dallan, S. B. Yamaki, R. Bertazzoli, Electroanalysis 9 (1997) 614-618. [31] H. Huang, W. Zhu, X. Gao, X. Liu, H. Ma, Analytica Chimica Acta 947 (2016) 32-41. [32] Chemicalland21.com, http://chemicalland21.com/specialtychem/perchem/2-
MERCAPTOBENZOTHIAZOLE.htm (29th May 2018) [33] L. Cao, J. Jia, Z. Wong, Electrochimica Acta 53 (2008) 2177-2182. [34] Y. Ma, Y. Wang, D. Xie, Y. Gu, X. Zhu, H. Zhang, G. Wang, Y. Zhang, H. Zhao, Chemical Engineering
Journal 347 (2018) 953-962. [35] G. Zhu, Y. Ge, Y. Dai, X. Shang, J. Yang, J. Liu, Electrochimica Acta 268 (2018) 202-210. [36] C. Göde, M. L.i Yol, A. Yılmaz, N. Atar, S. Wang, Journal of Colloid and Interface Science 508 (2017)
525-531. [37] L. Yu, Q. Zhang, B. Yang, Q. Xu, Q. Xu, X. Hu, Sensors and Actuators B 259 (2018) 540-551. [38] T. Priya, N. Dhanalakshmi, S. Thennarasu, N. Thinakaran, Carbohydrate Polymers 182 (2018) 199-
206. [39] L. Li, D. Liu, A. Shi, T. You, Sensors and Actuators B 255 (2018) 1762-1770. [40] K. Pokpas, S. Zbeda, N. Jahed, N. Mohamed, P. G. Baker, E. I. Iwuoha, International Journal of
Electrochemical Science 9 (2014) 736-759.
©2019 by the authors; licensee IAPC, Zagreb, Croatia. This article is an open-access article distributed under the terms and conditions of the Creative Commons Attribution license
(http://creativecommons. org/licenses/by/4.0/)