Embed Size (px)
Citation preview

Simultaneous Determination of Seven Biogenic Aminesin Foodstuff Samples Using One-Step Fluorescence Labelingand Dispersive Liquid–Liquid Microextraction Followedby HPLC-FLD and Method Optimization Using ResponseSurface Methodology
Hongliang Wu & Guoliang Li & Shucheng Liu &
Zhongyin Ji & Qiulong Zhang & Na Hu & Yourui Suo &
Jinmao You
Received: 20 May 2014 /Accepted: 11 July 2014# Springer Science+Business Media New York 2014
Abstract A simple, sensitive and selective method based onone-step fluorescence labeling and ultrasound-assisted disper-sive liquid–liquid microextraction (UA-DLLME) was devel-oped for the determination of biogenic amines (BAs) in food-stuff samples by high-performance liquid chromatography(HPLC) with fluorescence detection (FLD). In this work,fluorescence probe 2-(11H-benzo[a]carbazol-11-yl) ethylcarbonochloridate (BCEC-Cl) was applied to label BAs.What followed was the UA-DLLME procedure that wascarried out using chloroform and acetone as extraction and
disperser solvents, respectively. A response surface method-ology (RSM) based on a Box–Behnken design (BBD) wasemployed to optimize the main parameters affecting the fluo-rescence labeling and DLLME efficiency. Under the optimalconditions, this method offered low limits of detection(LODs) of 1.1–7.8 ng/mL and limits of quantification(LOQs) of 3.5–26.1 ng/mL. Finally, the method was success-fully used for the determination of trace BAs in real samplesand exhibited powerful potential in the high-throughput sam-ple screening.
Keywords Biogenic amines . Fluorescence labeling .
Ultrasound-assisted dispersive liquid–liquidmicroextraction .
Foodstuff samples . Box–Behnken design
Introduction
Biogenic amines (BAs) are low-molecular-weight organicalkalis with aliphatic, aromatic or heterocyclic structures,formed mainly by decarboxylation of amino acids or byamination and transamination of aldehydes and ketone(Linares et al. 2011). BAs can be found in a wide range offoods and fermented beverages, including cheese, sausage,yogurt, milk, wine, beer, fish, soy sauces, aged meat, etc.(Aflaki et al. 2013; Önal 2007). Recent studies indicate BAsare hazardous and toxic microcomponents (Latorre-Moratallaet al. 2007) and can cause undesirable health problems, suchas difficulty in breathing, itching, rash, vomiting, fever, hy-pertension headache, heart palpitation, hypertension, nausea,emesis, and death in very severe cases (Li et al. 2014; Zotouand Notou 2012). In addition, the amounts of BAs usually
Hongliang Wu and Guoliang Li contributed equally to this work.
Electronic supplementary material The online version of this article(doi:10.1007/s12161-014-9943-2) contains supplementary material,which is available to authorized users.
H. Wu : Z. Ji :Q. Zhang :N. Hu :Y. Suo : J. YouKey Laboratory of Tibetan Medicine Research, Northwest Instituteof Plateau Biology, Chinese Academy of Sciences, Xining,People’s Republic of China
G. Li (*) : J. You (*)Key Laboratory of Life-Organic Analysis of Shandong Province,Qufu Normal University, Qufu, People’s Republic of Chinae-mail: [email protected]: [email protected]
H. Wu : Z. Ji :Q. Zhang :N. HuCollege of Life Sciences, University of Chinese Academy ofSciences, Beijing, People’s Republic of China
G. Li : S. LiuCollege of Food Science and Technology, Guangdong ProvincialKey Laboratory of Aquatic Product Processing and Safety,Guangdong Ocean University, Zhanjiang,People’s Republic of China
Food Anal. MethodsDOI 10.1007/s12161-014-9943-2

increase in the course of food spoilage or spontaneous micro-bial fermentation in nonstandard food storage conditions orinadequate fermentation treatments (Jastrzębska et al. 2011).Thus, BAs have been normally served as one potentially indexof freshness or spoilage of food (Koral et al. 2013; Linareset al. 2011; Martuscelli et al. 2013). So it is vital to develop asensitive, reliable and routine method for BA determinationensuring food safety.
For BA analysis, there are lots of methods that have beendeveloped, such as gas chromatography (Ali Awan et al. 2008;Hwang et al. 2003), thin-layer chromatography (Lapa-Guimarães and Pickova 2004; Latorre-Moratalla et al. 2009),capillary electrophoretic method (Bricio et al. 2004; Sun et al.2003) and high-performance liquid chromatography (HPLC)(Lázaro et al. 2013; Wang et al. 2014; Kabashima et al. 2008).Among the cited techniques, HPLC is considered the mostsuitable and frequently used for the separation and quantifica-tion of biogenic amines (Innocente et al. 2007; Lázaro andConte-Junior 2013). Moreover, because of the lack of suitablechromophoric or fluoropheric moieties in BAmolecules, chem-ical pre- or postcolumn derivatization strategy has been widelyaccepted to enhance the selectivity and sensitivity.2-(11H-benzo[a]carbazol-11-yl) ethyl carbonochloridate (BCEC-Cl) was synthesized according to our reported study (Youet al 2007a) and its application in aliphatic amines (You et al.2007b) and amino acids (You et al. 2007a; Zhao et al. 2008) .The labeling reagent possesses strong photoluminescence prop-erty and can rapidly react with primary and secondary aminocompounds with good selectivity and generate fewer by-products (Zhao et al. 2007).
In addition, real samples usually need to be purified due tothe complexity sample matrix and the low concentration ofBAs (Ahmar et al. 2013). For the analysis of BAs in variousfood matrices like milk, cheese, sausage and yogurt, the tradi-tional liquid–liquid extraction (LLE) is the most commonlyused technique as pretreatment procedure. However, LLE hasmany drawbacks, such as being time-consuming, requiringlarge amounts of toxic organic solvents and suffering from lossof target analytes (Moradi et al. 2013). To overcome thesedrawbacks, alternative pretreatment procedures have been de-veloped, such as solid-phase extraction (SPE) (Ali Awan et al.2008; De Mey et al. 2012), cloud point extraction (CPE)(Paleologos et al. 2003), solid-phase microextraction (SPME)(Saaid et al. 2009a) and dispersive liquid–liquidmicroextraction (DLLME) (Almeida et al. 2012). Among thesemethods, DLLME was an emerging, simple and widely usedtechnology in analytical fields (Jia et al. 2013). Contrary toother pretreatment procedures, DLLME presents many advan-tages such as high enrichment ability, simple operation, loworganic solvent consumption, time-saving, low cost and highrecovery (Donthuan et al. 2014).
The purposes of this study were to set up a novel analyticalmethod for the simultaneous determination of seven BAs
followed by HPLC-fluorescence detection (FLD) using one-step fluorescence labeling and dispersive liquid–liquidmicroextraction and optimize the main parameters affectingthe efficiency of fluorescence labeling and DLLME by re-sponse surface methodology (RSM).
Materials and Methods
Reagents
2-(11H-benzo[a]carbazol-11-yl) Ethyl carbonochloridate(BCEC-Cl) was synthesized in our laboratory (You et al.2007a). Tryptamine (Try), histamine (His), cadaverine(Cad), 2-phenylethylamine (Phe), 1,6-hexamethylenediamine(Hex), tyramine (Try) and spermine (Spe) were purchasedfrom Sigma (St. Louis, MO, USA). Water was purified on aMilli-Q system (Millipore, Bedford, MA, USA). HPLC-gradeacetonitrile was purchased from Yucheng Chemical ReagentCo. (Yucheng, Shandong Province, China). Other reagentswere of analytical grade from Jining Chemical Reagent(Jining, Shandong Province, China).
Apparatus
Chromatographic separations were performed with an Agilent1100 Series HPLC (Agilent Technologies, Palo Alto, CA,USA). The mass spectrometer (MSD Trap SL, modelG2445D) from Bruker Daltonik (Bremen, Germany) wasequipped with an atmospheric pressure chemical ionization(APCI) source (model G1947A). Ion source conditions wereas follows: APCI in positive ion detection mode, nebulizerpressure 60 psi, dry gas temperature 350 °C, dry gas flow 5 L/min, APCI Vap temperature 350 °C, corona current 4,000 nA,and capillary voltage 3,500 V. An ultrasonic cleaner(KQ3200E, Kunshan Ultrasonic Instrument, Jiangsu, China)set at 40 kHz (equivalent to the wavelength of 37.5 mm) wasused to emulsify the solutions.
Preparation of Standard Solutions
Individual stock solutions (1×10⁻² mol/L) of BAs were pre-pared in acetonitrile/water mixed solution (v/v, 1:1). The mixedstandard solutions (2×10⁻⁵ mol/L) for HPLC analysis wereprepared by diluting the stock solutions with acetonitrile/water. The labeling reagent solution (5×10⁻³ mol/L) was pre-pared by dissolving 16.15 mg of BCEC-Cl in 10 mL acetoni-trile. Then, all standard solutions were stored at 4 °C until use.
Sample Preparation
All foodstuff samples (beer, cheese, yogurt, ham sausage andrice wine) were purchased from a supermarket (Qufu City,
Food Anal. Methods

Shandong Province, China) east of Qufu NormalUniversity. According to several reported studies, theextractions of BAs were performed with minor revision(Saaid et al. 2009b). All solid samples were treated asfollows: 5 g of sample was extracted twice with 10 mL5 % trifluoroacetic acid (TCA) in an ultrasonic cleaner(10 min each extraction) and then centrifuged for 5 minat 5,000 rpm. Collecting the supernatants, the extractswere defatted twice with 20 mL n-hexane and thenfiltered through 0.45-μm nylon filters (AutomaticScience, Instrument Co., Ltd., Tianjin, China). For beer,6 mL beer was centrifuged for 5 min at 5,000 rpm andfiltered through 0.45-μm nylon filters. Moreover, allextracts need to be adjusted to pH 10.5 with NaOHsolution before utilized. They were then sealed andstored at 4 °C until analysis.
Fluorescence Labeling and Ultrasound-Assisted DispersiveLiquid–Liquid Microextraction Procedure
In a conical test tube, 50 μL of fluorescence reagentwas added to 6 mL sodium borate buffer (pH 10.5)involving 30 μL mixed standard solution (or 6 mL realsample extract solvent). The solution was shaken for10 s, sealed and then allowed to stand for 9 min at40 °C. When fluorescence labeling was accomplished,30 % acetic acid (v/v) was added into the solution untilneutral. Afterwards, DLLME process was immediatelyperformed; 105 μL chloroform (as extraction solvent)and 1,030 μL acetone (as disperser solvent) were wellmixed. The mixture solvent was rapidly injected into thesample solution by using the 1mL glass syringe, andthen the tube was immersed in an ultrasonic water bathfor 3.5 min. After centrifugation at 5,000 rpm for 5 min(800B centrifuge, Shanghai Anting Instruments Inc.,China), the organic phase containing the targetedanalytes was deposited at the bottom of the vial andwithdrawn with a 100 μL glass syringe, and then theorganic phase was injected into the HPLC system fordirect analysis.
HPLC Separation
Chromatographic separation was achieved on a HypersilC18 (4.6 mm×200 mm, 5 μm) column with a gradient
Fig. 1 The derivatization schemefor BCEC-Cl with biogenicamines
Fig. 2 Response using the Box–Behnken design obtained by plotting areaction time versus pH; b concentration of BCEC-Cl versus reactiontime; and c pH versus concentration of BCEC-Cl
Food Anal. Methods

elution. Mobile phase A was 5 % acetonitrile and B was100 % acetonitrile. The gradient conditions were select-ed at 65–70 % (B) from 0 to 10 min, 70–78 % (B)from 10 to 16 min, 78–80 % (B) from 16 to 20 min,80–100 % (B) from 20 to 25 min and keeping constantuntil 32 min. Then, the column was equilibrated withthe initial mobile phase for 10 min before injecting thenext sample. The flow rate was maintained at 1 mL/minand the column temperature was set to 30 °C. Theinjection volume was 10 μL for each analysis. Thefluorescence detector was set with the excitation wave-length (Ex) of 279 nm and the emission wavelength(Em) of 380 nm (You et al. 2007a).
Results and Discussion
Optimization of Fluorescence Labeling Conditions
BCEC-Cl has the same acyl chloride reaction with BAs asbenzoyl chloride does (Paleologos et al. 2003). Comparedwith the traditional reagents, it has larger conjugated substruc-ture which contributes to improve the fluorescence sensitivity.The molecular structure of BCEC-Cl and the derivatizationscheme with BAs are shown in Fig. 1. Before RSM optimi-zation, the effect of reaction temperature was tested from 30 to60 °C. It can be found that the peak area reached the maximumvalue, when the reaction temperature was 40 °C. Therefore,
Fig. 3 Effect of differentextraction solvents on theextraction efficiency (a); effect ofdifferent disperser solvents on theextraction efficiency (b). Trytryptamine, His histamine, Cadcadaverine, Phe 2-phenylethylamine, Hex 1,6-hexamethylenediamine, Tyrtyramine, Spe spermine
Food Anal. Methods

this temperature was used in this work. Then, the labelingtime, reaction buffer pH and concentration of BCEC-Cl werechosen as the main variables and further optimized by RSM.The experimental results are listed in Table S1. A regressionequation that could predict the optimum point within the givenrange was obtained by applying multiple regression analysison the experimental data. The second-order polynomial modelwas the following:
Y=311+22.61X1 + 37.70X2 + 66.41X3−14.23X1X2−13.00X1X3−25.23X2X3−40.53X1
2−41.35X22−46.38X3
2
Where, Y is the predicted average peak areas;X1, X2 and X3 arethe coded values of labeling time, pH of buffer and concen-tration of BCEC-Cl, respectively.
The surface response plot was seen as a visual process ofthe predicted model equation to study the effects of parametersand their interactions on fluorescence labeling reaction.Response surface plots are shown in Fig. 2. Figure 2a depictsthe combined effect of labeling time and pH of buffer on theresponse. The response initially increases when there is anincrease in labeling time and pH of buffer. With furtherincrease in labeling time and pH of buffer, a slightly declinedon the response was observed. Figure 2b describes the com-bined effect of labeling time and concentration of BCEC-Cl atthe fixed value of pH. Figure 3c depicts the combined effect ofbuffer pH and BCEC-Cl concentration on the response valueat the fixed value of labeling time.
The results of the analysis of variance (ANOVA) indi-cated all the linear parameters and quadratic parameters ofthe quadratic equation were significant at the level ofp<0.01. The value of R2 was 0.98, meaning that therewas a satisfactory agreement between experimental andpredicted values. The optimum conditions given by themodel were as follows: 9 min labeling time, pH 10.5borate buffers and 0.18 mmol/L BCEC-Cl. Under the bestconditions, the maximum predicted value of the peak areawas 326. And the actual peak area under the proposedconditions was 341 (n=6), very close to the predictedvalue. The excellent correlation between predicted andmeasured values verified the response model was adequateto reflect the expected optimization.
Types of Extraction Solvent and Disperser Solvent
In DLLME, extraction and disperser solvents have a significant-ly influence on extraction efficiency. According to our preex-periment, chloroform, ethylene dichloride, benzyl chloride andcarbon tetrachloride were selected as extraction solvents, andtheir extraction efficiencies were evaluated in presented study(Fig.3a). As can be seen from Fig.3a, chloroform has the highestextraction efficiency than the other tested solvents. For thedisperser solvent, the main criterion was that it ought to bemiscible with the aqueous phase as well as with the extractionsolvent. To seek a more acceptable disperser solvent, methanol,
acetone and acetonitrile were investigated as disperser solvents.Figure 3b shows the best extraction efficiency was found whenacetonewas selected as disperser solvent. Therefore, chloroformand acetone were selected as optimal extraction and dispersersolvents in the following work, respectively.
Fig. 4 Three-dimensional surface plot showing the significant interac-tion effects of the DLLME parameters: a volume of the extraction solventversus volume of disperser solvent; b volume of the extraction solventversus sonication time; and c volume of disperser solvent versus sonica-tion time
Food Anal. Methods

Fig. 5 The representative chromatograms for seven biogenic aminestandards (a), ham sausage sample (b) and rice wine (c). Chromatograph-ic conditions: column temperature at 30 °C; excitation wavelength λex279 nm, emission wavelength λem 380 nm; Hypersil C18 (4.6 mm×
200 mm, 5 μm) column; flow rate=1 mL/min; peak labels: Try trypt-amine,His histamine,Cad cadaverine, Phe 2-phenylethylamine,Hex 1,6-hexamethylenediamine, Tyr tyramine, Spe spermine
Food Anal. Methods

Optimization of DLLME
In order to obtain the highest extraction efficiency, the mainparameters affecting the DLLME efficiency including extrac-tion solvent volume, disperser solvent volume and sonicationtime were optimized by RSM. The predicted model thatreflected the empirical relationship between the response andthe three mentioned variables was obtained by analyzing theexperimental data (Table S2) and expressed by the followingsecond-order polynomial equation:
Y=260.2+39.51X1+5.490X2+6.900X3–13.80X1X2−2.020X1X3–7.880X2X3–55.01X1
2–39.16X22–14.64X3
2 Y is thepredicted response value and X1, X2 and X3 are the codedvalues of the extraction solvent volume, disperser solventvolume and sonication time mentioned, respectively. Three-dimensional response surface curves are shown in Fig. 4. InFig. 4a, when the extraction solvent volume increased from 60
to 150 μL, the response value rapidly increased and reached amaximum value and then slightly decreased as the furtherincreasing extraction solvent. Similarly, Fig. 4b, c describesthe interaction effect of sonication time and disperser solventvolume and extraction solvent volume on the response value,respectively.
The result of ANOVA indicated that the model was signif-icant at the level of p<0.01. The coefficient of determination(R2) was 0.93, indicating a high potential of the model to reflectthe experimental data. The optimal conditions were given byRSM as follows: extraction solvent volume=105 μL; dispersersolvent volume=1,030 μL and sonication time=3.5 min.Under the proposed conditions, the peak area was predictedto be 261. The suitability of the optimal derivatization condi-tions above was also tested by executing six experiments, andthe average peak area was 274, which was very close to thepredicted value. The excellent correlation between predicted
Fig. 6 The MS data and cleavage mode for labeled 2-phenylethylamine
Table 1 Linear regression equation, correlation coefficients (R), LOD, LOQ, reproducibility of retention time and peak area, intra- and inter-dayprecision
Analytes Linearity LOD(μg/L)
LOQ(μg/L)
Repeatability RSD (%) (n=6) Intra-day precisionRSD (%) (n=6)
Inter-day precisionRSD (%) (n=6)
Y=AX+B R Retention time Peak area
Tryptamine Y=20.586X−17.90 0.9997 3.2 10.7 0.09 3.1 3.7 4.7
Phenylethylamine Y=19.340X−4.600 0.9994 1.2 4.1 0.06 2.2 4.1 5.7
Histamine Y=7.8570X−6.250 0.9988 2.2 7.4 0.11 3.2 2.9 4.3
Cadaverine Y=29.667X−14.50 0.9995 1.1 3.5 0.08 2.2 3.4 5.1
Hexamethylenediamine Y=33.628X−18.50 0.9999 1.2 3.9 0.08 1.3 3.8 4.9
Tyramine Y=26.791X−9.000 0.9998 1.4 4.6 0.10 1.9 4.1 5.3
Spermine Y=4.1817X−21.24 0.9997 7.8 26.1 0.07 1.2 2.9 4.6
X the injected amounts (pmol), Y the peak area detected with fluorescence detector
Food Anal. Methods
and measured values verified that the response model wasadequate to reflect the expected optimization.
HPLC Separation and Mass Spectrometry Identification
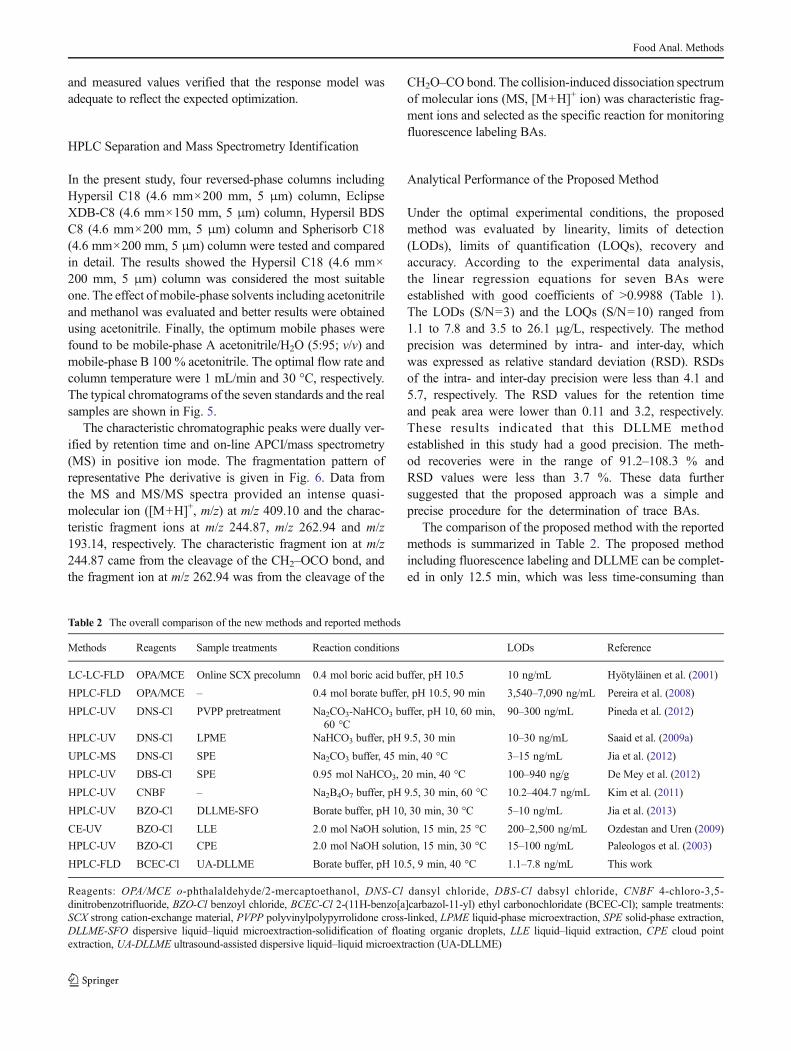
In the present study, four reversed-phase columns includingHypersil C18 (4.6 mm×200 mm, 5 μm) column, EclipseXDB-C8 (4.6 mm×150 mm, 5 μm) column, Hypersil BDSC8 (4.6 mm×200 mm, 5 μm) column and Spherisorb C18(4.6 mm×200 mm, 5 μm) column were tested and comparedin detail. The results showed the Hypersil C18 (4.6 mm×200 mm, 5 μm) column was considered the most suitableone. The effect of mobile-phase solvents including acetonitrileand methanol was evaluated and better results were obtainedusing acetonitrile. Finally, the optimum mobile phases werefound to be mobile-phase A acetonitrile/H2O (5:95; v/v) andmobile-phase B 100 % acetonitrile. The optimal flow rate andcolumn temperature were 1 mL/min and 30 °C, respectively.The typical chromatograms of the seven standards and the realsamples are shown in Fig. 5.
The characteristic chromatographic peaks were dually ver-ified by retention time and on-line APCI/mass spectrometry(MS) in positive ion mode. The fragmentation pattern ofrepresentative Phe derivative is given in Fig. 6. Data fromthe MS and MS/MS spectra provided an intense quasi-molecular ion ([M+H]+, m/z) at m/z 409.10 and the charac-teristic fragment ions at m/z 244.87, m/z 262.94 and m/z193.14, respectively. The characteristic fragment ion at m/z244.87 came from the cleavage of the CH2–OCO bond, andthe fragment ion at m/z 262.94 was from the cleavage of the
CH2O–CO bond. The collision-induced dissociation spectrumof molecular ions (MS, [M+H]+ ion) was characteristic frag-ment ions and selected as the specific reaction for monitoringfluorescence labeling BAs.
Analytical Performance of the Proposed Method
Under the optimal experimental conditions, the proposedmethod was evaluated by linearity, limits of detection(LODs), limits of quantification (LOQs), recovery andaccuracy. According to the experimental data analysis,the linear regression equations for seven BAs wereestablished with good coefficients of >0.9988 (Table 1).The LODs (S/N=3) and the LOQs (S/N=10) ranged from1.1 to 7.8 and 3.5 to 26.1 μg/L, respectively. The methodprecision was determined by intra- and inter-day, whichwas expressed as relative standard deviation (RSD). RSDsof the intra- and inter-day precision were less than 4.1 and5.7, respectively. The RSD values for the retention timeand peak area were lower than 0.11 and 3.2, respectively.These results indicated that this DLLME methodestablished in this study had a good precision. The meth-od recoveries were in the range of 91.2–108.3 % andRSD values were less than 3.7 %. These data furthersuggested that the proposed approach was a simple andprecise procedure for the determination of trace BAs.
The comparison of the proposed method with the reportedmethods is summarized in Table 2. The proposed methodincluding fluorescence labeling and DLLME can be complet-ed in only 12.5 min, which was less time-consuming than
Table 2 The overall comparison of the new methods and reported methods
Methods Reagents Sample treatments Reaction conditions LODs Reference
LC-LC-FLD OPA/MCE Online SCX precolumn 0.4 mol boric acid buffer, pH 10.5 10 ng/mL Hyötyläinen et al. (2001)
HPLC-FLD OPA/MCE – 0.4 mol borate buffer, pH 10.5, 90 min 3,540–7,090 ng/mL Pereira et al. (2008)
HPLC-UV DNS-Cl PVPP pretreatment Na2CO3-NaHCO3 buffer, pH 10, 60 min,60 °C
90–300 ng/mL Pineda et al. (2012)
HPLC-UV DNS-Cl LPME NaHCO3 buffer, pH 9.5, 30 min 10–30 ng/mL Saaid et al. (2009a)
UPLC-MS DNS-Cl SPE Na2CO3 buffer, 45 min, 40 °C 3–15 ng/mL Jia et al. (2012)
HPLC-UV DBS-Cl SPE 0.95 mol NaHCO3, 20 min, 40 °C 100–940 ng/g De Mey et al. (2012)
HPLC-UV CNBF – Na2B4O7 buffer, pH 9.5, 30 min, 60 °C 10.2–404.7 ng/mL Kim et al. (2011)
HPLC-UV BZO-Cl DLLME-SFO Borate buffer, pH 10, 30 min, 30 °C 5–10 ng/mL Jia et al. (2013)
CE-UV BZO-Cl LLE 2.0 mol NaOH solution, 15 min, 25 °C 200–2,500 ng/mL Ozdestan and Uren (2009)
HPLC-UV BZO-Cl CPE 2.0 mol NaOH solution, 15 min, 30 °C 15–100 ng/mL Paleologos et al. (2003)
HPLC-FLD BCEC-Cl UA-DLLME Borate buffer, pH 10.5, 9 min, 40 °C 1.1–7.8 ng/mL This work
Reagents: OPA/MCE o-phthalaldehyde/2-mercaptoethanol, DNS-Cl dansyl chloride, DBS-Cl dabsyl chloride, CNBF 4-chloro-3,5-dinitrobenzotrifluoride, BZO-Cl benzoyl chloride, BCEC-Cl 2-(11H-benzo[a]carbazol-11-yl) ethyl carbonochloridate (BCEC-Cl); sample treatments:SCX strong cation-exchange material, PVPP polyvinylpolypyrrolidone cross-linked, LPME liquid-phase microextraction, SPE solid-phase extraction,DLLME-SFO dispersive liquid–liquid microextraction-solidification of floating organic droplets, LLE liquid–liquid extraction, CPE cloud pointextraction, UA-DLLME ultrasound-assisted dispersive liquid–liquid microextraction (UA-DLLME)
Food Anal. Methods
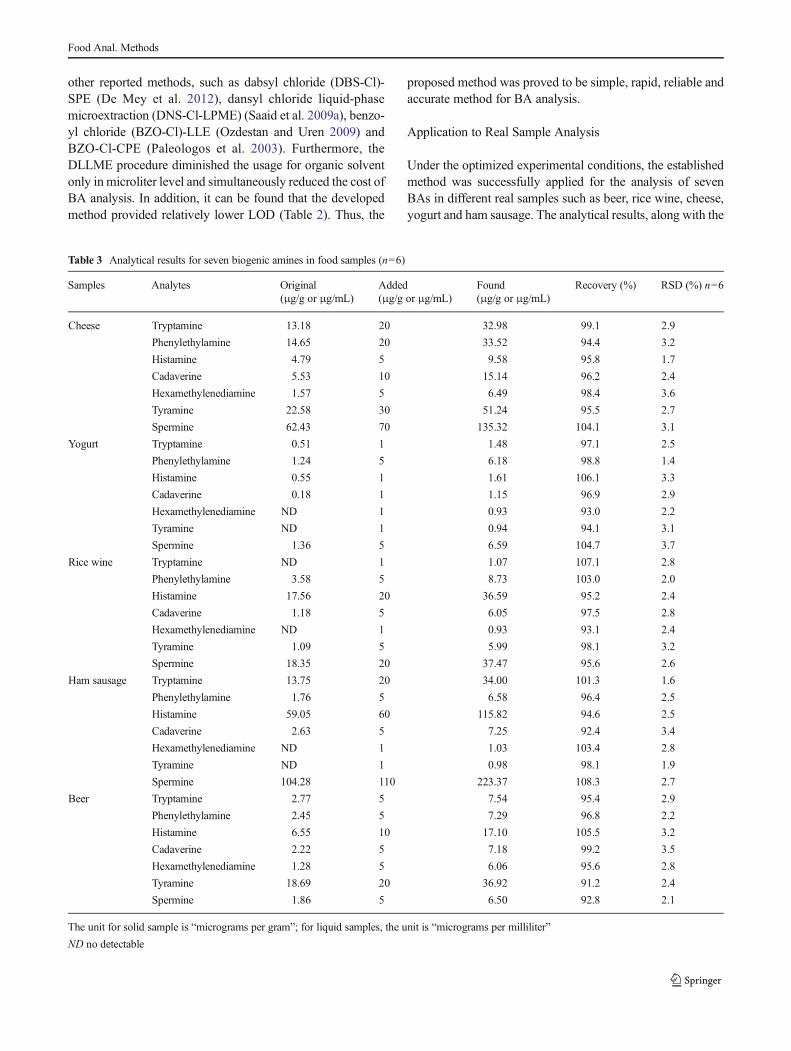
other reported methods, such as dabsyl chloride (DBS-Cl)-SPE (De Mey et al. 2012), dansyl chloride liquid-phasemicroextraction (DNS-Cl-LPME) (Saaid et al. 2009a), benzo-yl chloride (BZO-Cl)-LLE (Ozdestan and Uren 2009) andBZO-Cl-CPE (Paleologos et al. 2003). Furthermore, theDLLME procedure diminished the usage for organic solventonly in microliter level and simultaneously reduced the cost ofBA analysis. In addition, it can be found that the developedmethod provided relatively lower LOD (Table 2). Thus, the
proposed method was proved to be simple, rapid, reliable andaccurate method for BA analysis.
Application to Real Sample Analysis
Under the optimized experimental conditions, the establishedmethod was successfully applied for the analysis of sevenBAs in different real samples such as beer, rice wine, cheese,yogurt and ham sausage. The analytical results, along with the
Table 3 Analytical results for seven biogenic amines in food samples (n=6)
Samples Analytes Original(μg/g or μg/mL)
Added(μg/g or μg/mL)
Found(μg/g or μg/mL)
Recovery (%) RSD (%) n=6
Cheese Tryptamine 13.18 20 32.98 99.1 2.9
Phenylethylamine 14.65 20 33.52 94.4 3.2
Histamine 4.79 5 9.58 95.8 1.7
Cadaverine 5.53 10 15.14 96.2 2.4
Hexamethylenediamine 1.57 5 6.49 98.4 3.6
Tyramine 22.58 30 51.24 95.5 2.7
Spermine 62.43 70 135.32 104.1 3.1
Yogurt Tryptamine 0.51 1 1.48 97.1 2.5
Phenylethylamine 1.24 5 6.18 98.8 1.4
Histamine 0.55 1 1.61 106.1 3.3
Cadaverine 0.18 1 1.15 96.9 2.9
Hexamethylenediamine ND 1 0.93 93.0 2.2
Tyramine ND 1 0.94 94.1 3.1
Spermine 1.36 5 6.59 104.7 3.7
Rice wine Tryptamine ND 1 1.07 107.1 2.8
Phenylethylamine 3.58 5 8.73 103.0 2.0
Histamine 17.56 20 36.59 95.2 2.4
Cadaverine 1.18 5 6.05 97.5 2.8
Hexamethylenediamine ND 1 0.93 93.1 2.4
Tyramine 1.09 5 5.99 98.1 3.2
Spermine 18.35 20 37.47 95.6 2.6
Ham sausage Tryptamine 13.75 20 34.00 101.3 1.6
Phenylethylamine 1.76 5 6.58 96.4 2.5
Histamine 59.05 60 115.82 94.6 2.5
Cadaverine 2.63 5 7.25 92.4 3.4
Hexamethylenediamine ND 1 1.03 103.4 2.8
Tyramine ND 1 0.98 98.1 1.9
Spermine 104.28 110 223.37 108.3 2.7
Beer Tryptamine 2.77 5 7.54 95.4 2.9
Phenylethylamine 2.45 5 7.29 96.8 2.2
Histamine 6.55 10 17.10 105.5 3.2
Cadaverine 2.22 5 7.18 99.2 3.5
Hexamethylenediamine 1.28 5 6.06 95.6 2.8
Tyramine 18.69 20 36.92 91.2 2.4
Spermine 1.86 5 6.50 92.8 2.1
The unit for solid sample is “micrograms per gram”; for liquid samples, the unit is “micrograms per milliliter”
ND no detectable
Food Anal. Methods

recovery for the spiked samples to establish the accuracy ofthe proposed method, are listed in Table 3. The results showedcheese contained higher contents of relevant biogenic aminesthan do other samples. The most abundant biogenic amines inthe tested samples were Cad, Phe, Spe and His. No concen-tration of rice wine, yogurt, and ham sausage was detected forHex. Tyr was absent from both yogurt and ham sausage, aswas Try only from rice wine. The typical chromatograms ofham sausage and rice wine are illustrated in Fig. 5b, c,respectively.
Conclusion
In this study, a one-step fluorescence labeling and ultrasound-assisted dispersive liquid–liquid microextraction (UA-DLLME) method followed by HPLC-FLD for the simulta-neous determination of seven BAs in foodstuff samples wasdeveloped and optimized. In order to obtain the optimalexperiment conditions, various parameters affecting the effi-ciency of fluorescence labeling and DLLME were optimizedby RSM based on Box–Behnken design. The proposed meth-od possesses the advantages of both fluorescence labeling andUA-DLLME, including rapidity, simplicity, low cost, highsensitivity and excellent selectivity. Moreover, this methodhas the powerful potential of practical applications for theanalysis of BAs in many other samples.
Acknowledgments This work was supported by The National NaturalScience Foundation of China (No. 31301595 andNo. 21275089), Guang-dong Provincial Key Laboratory of Aquatic Product Processing andSafety (GDPKLAPPS1401) and Ph.D. research start-up funds of QufuNormal University (bsqd 2012017).
Conflict of Interest Hongliang Wu declares that he has no conflict ofinterest. Guoliang Li declares that he has no conflict of interest. ShuchengLiu declares that he has no conflict of interest. Zhongyin Ji declares thathe has no conflict of interest. Qiulong Zhang declares that he has noconflict of interest. Na Hu declares that she has no conflict of interest.Yourui Suo declares that he has no conflict of interest. Jinmao Youdeclares that he has no conflict of interest. This article does not containany studies with human or animal subjects.
References
Aflaki F, Ghoulipour V, Saemian N, Sheibani S (2013) Biogenic aminecontents in non-alcoholic beers: screening and optimization of de-rivatization. Food Anal Methods 7:713–720
Ahmar H, Fakhari AR, Tabani H, Shahsavani A (2013) Optimization ofelectromembrane extraction combined with differential pulse volt-ammetry using modified screen-printed electrode for the determina-tion of sufentanil. Electrochim Acta 96:117–123
Ali Awan M, Fleet I, Paul Thomas CL (2008) Determination of biogenicdiamines with a vaporisation derivatisation approach using solid-
phase microextraction gas chromatography–mass spectrometry.Food Chem 111:462–468
Almeida C, Fernandes JO, Cunha SC (2012) A novel dispersive liquid–liquid microextraction (DLLME) gas chromatography-mass spec-trometry (GC–MS) method for the determination of eighteen bio-genic amines in beer. Food Control 25:380–388
Bricio Santos BMS, Ríos A, Valcárcel M (2004) Direct automatic deter-mination of biogenic amines in wine by flow injection-capillaryelectrophoresis-mass spectrometry. Electrophoresis 25:3427–3433
DeMey E, Drabik-Markiewicz G, DeMaere H, Peeters MC, DerdelinckxG, Paelinck H, Kowalska T (2012) Dabsyl derivatisation as analternative for dansylation in the detection of biogenic amines infermented meat products by reversed phase high performance liquidchromatography. Food Chem 130:1017–1023
Donthuan J, Yunchalard S, Srijaranai S (2014) Ultrasound-assisted dis-persive liquid–liquid microextraction combined with high perfor-mance liquid chromatography for sensitive determination of fivebiogenic amines in fermented fish samples. Anal Methods 6:1128
Hwang B, Wang J, Choong Y (2003) A rapid gas chromatographicmethod for the determination of histamine in fish and fish products.Food Chem 82:329–334
Hyötyläinen T, Savola N, Lehtonen P, Riekkola M-L (2001)Determination of biogenic amines in wine by multidimensionalliquid chromatography with online derivatisation. Analyst 126:2124–2127
Innocente N, Biasutti M, Padovese M, Moret S (2007) Determination ofbiogenic amines in cheese using HPLC technique and direct deriv-atization of acid extract. Food Chem 101:1285–1289
Jastrzębska A, Kurzawa M, Piasta A, Szłyk E (2011) Determination ofhistamine in some foods by isotachophoretic method with simplesample preparation. Food Anal Methods 5:1079–1087
Jia S, Kang YP, Park JH, Lee J, Kwon SW (2012) Determination ofbiogenic amines in Bokbunja (Rubus coreanus Miq.) wines using anovel ultra-performance liquid chromatography coupled withquadrupole-time of flight mass spectrometry. Food Chem 132:1185–1190
Jia S, Ryu Y, Kwon SW, Lee J (2013) An in situ benzoylation-dispersiveliquid-liquid microextraction method based on solidification offloating organic droplets for determination of biogenic amines byliquid chromatography-ultraviolet analysis. J Chromatogr A 1282:1–10
Kabashima T, Kabashima T, Yu Z, Tang C, Nakagawa Y, Okumura K,Shibata T, Lu J, Kai M (2008) A selective fluorescence reaction forpeptides and chromatographic analysis. Peptides 29:356–363
Kim JY, Kim D, Park P, Kang H-I, Ryu EK, Kim SM (2011) Effects ofstorage temperature and time on the biogenic amine content andmicroflora in Korean turbid rice wine, Makgeolli. Food Chem 128:87–92
Koral S, Tufan B, Ščavničar A, Kočar D, Pompe M, Köse S (2013)Investigation of the contents of biogenic amines and some foodsafety parameters of various commercially salted fish products.Food Control 32:597–606
Lapa-Guimarães J, Pickova J (2004) New solvent systems for thin-layerchromatographic determination of nine biogenic amines in fish andsquid. J Chromatogr A 1045:223–232
Latorre-MoratallaML, Bover-Cid S, Aymerich T,Marcos B, Vidal-CarouMC, Garriga M (2007) Aminogenesis control in fermented sausagesmanufactured with pressurized meat batter and starter culture. MeatSci 75:460–469
Latorre-Moratalla ML, Bover-Cid S, Veciana-Nogues T, Vidal-CarouMC (2009) Thin-layer chromatography for the identification andsemi-quantification of biogenic amines produced by bacteria. JChromatogr A 1216:4128–4132
Lázaro CA, Conte-Junior CA (2013) Chromatographic methods forbiogenic amines determination in foods of animal origin. Braz JVet Res Anim Sci 50:430–446
Food Anal. Methods

Lázaro CA, Conte-Júnior CA, Cunha FL, Mársico ET, Mano SB, FrancoRM (2013) Validation of an HPLC methodology for the identifica-tion and quantification of biogenic amines in chicken meat. FoodAnal Methods 6:1024–1032
Li G, Dong L, Wang A, Wang W, Hu N, You J (2014) Simultaneousdetermination of biogenic amines and estrogens in foodstuff by animproved HPLC method combining with fluorescence labeling.LWT Food Sci Technol 55:355–361
Linares DM, Martin MC, Ladero V, Alvarez MA, Fernandez M (2011)Biogenic amines in dairy products. Crit Rev Food Sci 51:691–703
Martuscelli M, Arfelli G, Manetta AC, Suzzi G (2013) Biogenic aminescontent as a measure of the quality of wines of Abruzzo (Italy). FoodChem 140:590–597
Moradi M, Yamini Y, Seidi S, Ghambarian M, Esrafili A (2013)Ultrasound-assisted emulsification microextraction using low den-sity solvent for analysis of toxic nitrophenols in natural waters. Int JEnviron Anal Chem 93:199–212
Önal A (2007) A review: current analytical methods for the determinationof biogenic amines in foods. Food Chem 103:1475–1486
Ozdestan O, Uren A (2009) Amethod for benzoyl chloride derivatizationof biogenic amines for high performance liquid chromatography.Talanta 78:1321–1326
Paleologos EK, Chytiri SD, Savvaidis IN, Kontominas MG (2003)Determination of biogenic amines as their benzoyl derivatives aftercloud point extraction with micellar liquid chromatographic separa-tion. J Chromatogr A 1010:217–224
Pereira V, Pontes M, Camara JS, Marques JC (2008) Simultaneousanalysis of free amino acids and biogenic amines in honey and winesamples using in loop orthophthalaldeyde derivatization procedure.J Chromatogr A 1189:435–443
Pineda A, Carrasco J, Peña-Farfal C, Henríquez-Aedo K, Aranda M(2012) Preliminary evaluation of biogenic amines content inChilean young varietal wines by HPLC. Food Control 23:251–257
Saaid M, Saad B, Ali AS, Saleh MI, Basheer C, Lee HK (2009a) In situderivatization hollow fibre liquid-phase microextraction for the de-termination of biogenic amines in food samples. J Chromatogr A1216:5165–5170
Saaid M, Saad B, Hashim NH, Mohamed Ali AS, Saleh MI (2009b)Determination of biogenic amines in selected Malaysian food. FoodChem 113:1356–1362
Sun X, Yang X, Wang E (2003) Determination of biogenic amines bycapillary electrophoresis with pulsed amperometric detection. JChromatogr A 1005:189–195
Wang Y, Ye D, Zhu B, Wu G, Duan C (2014) Rapid HPLC analysis ofamino acids and biogenic amines in wines during fermentation andevaluation of matrix effect. Food Chem 163:6–15
You J, Liu L, Zhao W, Zhao X, Suo Y, Wang H, Li Y (2007a) Study of anew derivatizing reagent that improves the analysis of amino acidsby HPLC with fluorescence detection: application to hydrolyzedrape bee pollen. Anal Bioanal Chem 387:2705–2718
You J, Zhao W, Liu L, Zhao X, Suo Y, Wang H, Li Y, Ding C (2007b)Determination of amines using 2-(11H-benzo[a]carbazol-11-yl) ethylchloroformate (BCEC-Cl) as labeling reagent by HPLC with fluores-cence detection and identification with APCI/MS. Talanta 72:914–925
Zhao W, Liu L, Zhu F, Zhao X, Liu S, Suo Y, You J (2007) Massspectrometric identification of aliphatic amines using 2-(11h-benzo[a]carbazol-11-yl) ethyl chloroformate as fluorescence label-ing reagent. Chin J Anal Chem Chin 35:1251–1256
Zhao W, Liu L, Zhao X, Ding C, Suo Y, You J (2008) Application of 2-(11h-benzo[a]carbazol-11-yl) ethyl carbonochloridate as aprecolumn derivatization reagent of amino acid by high perfor-mance liquid chromatography with fluorescence detection. Chin JAnal Chem 36:1071–1076
Zotou A, NotouM (2012) Enhancing fluorescence lc analysis of biogenicamines in fish tissues by precolumn derivatization with naphthalene-2,3-dicarboxaldehyde. Food Anal Methods 6:89–99
Food Anal. Methods