Embed Size (px)
Citation preview

©20
14 N
atu
re A
mer
ica,
Inc.
All
rig
hts
res
erve
d.
1816 VOLUME 17 | NUMBER 12 | DECEMBER 2014 nature neurOSCIenCe
t e C h n I C a l r e p O r t S
Linking neural microcircuit function to emergent properties of the mammalian brain requires fine-scale manipulation and measurement of neural activity during behavior, where each neuron’s coding and dynamics can be characterized. We developed an optical method for simultaneous cellular-resolution stimulation and large-scale recording of neuronal activity in behaving mice. Dual-wavelength two-photon excitation allowed largely independent functional imaging with a green fluorescent calcium sensor (GCaMP3, l = 920 ± 6 nm) and single-neuron photostimulation with a red-shifted optogenetic probe (C1V1, l = 1,064 ± 6 nm) in neurons coexpressing the two proteins. We manipulated task-modulated activity in individual hippocampal CA1 place cells during spatial navigation in a virtual reality environment, mimicking natural place-field activity, or ‘biasing’, to reveal subthreshold dynamics. Notably, manipulating single place-cell activity also affected activity in small groups of other place cells that were active around the same time in the task, suggesting a functional role for local place cell interactions in shaping firing fields.
The development of recent optical sensors, probes and methods for imaging or perturbing activity in the behaving mammalian brain is a promising step toward the functional characterization of brain dynamics on a large scale, at high resolution (thousands of individual neurons during a behavior). For example, population dynamics in behaving rodents may be measured at cellular resolution using two-photon excitation (TPE) fluorescence imaging1–4 or perturbed on a scale of genetically defined populations using optogenetic stimulation5–7. Combining the different advantages of these two approaches would create a new class of experiments to examine behavioral substrates in neural microcircuits by allowing cell-specific perturbation of activity in neurons on the basis of patterns of natural activity during behavior.
Several experimental challenges have hindered the combined use of cellular-resolution photostimulation and imaging in behaving rodents. The first problem is that existing optogenetic probes, cal-cium sensors and microscope fluorescence detectors are all sensitive to visible-wavelength light. In practice, this introduces substantial crosstalk in all-optical experiments using visible-light illumination,
as imaging light may perturb cellular activity and photostimula-tion may interrupt fluorescence detection8–14. Second, although wide-field optogenetic stimulation (for example, with unfocused blue light) only requires illuminating enough total membrane area to recruit large photocurrents from many cells, spatially resolved photostimulation also requires confining the illuminated area to the cell(s) of interest. Experimentally, cellular-resolution stimulation can be achieved with low-intensity excitation of a volume around the size of a cell soma in an opsin-photocycle time constant15–19. For visible- wavelength illumination, which is the most commonly adopted approach in optogenetic experiments, this is difficult to achieve in intact brain tissue at depths much below a mean-free light-scattering path (50–100 µm (refs. 20,21)), after which visible-wavelength light becomes defocused. Moreover, scattered or ballistic visible-light single-photon excitation, which is linearly proportionate to the incident inten-sity, may also stimulate photocurrents in dendrites, axons or somas of many other cells away from the plane of focus. We developed an approach that addresses these challenges, combining cellular- resolution photostimulation and simultaneous imaging in a densely labeled population of neurons in awake mice, and demonstrate how this approach can be used to mimic or modify activity of individual neurons during a behavior.
RESULTSOur approach is based on the combined application of two spectrally separated infrared TPE sources for both fluorescence imaging and photostimulation, and the use of a green calcium sensor (GCaMP3)22 and a red-shifted optogenetic probe (C1V1)18,23 that are coexpressed in a population of neurons (Fig. 1). Neurons were visualized in head-restrained, mobile mice through a sealed optical window3 using TPE fluorescence imaging at sub-micron wavelengths (typically, λ = 920 ± 6 nm) that preferentially excited GCaMP3 fluorescence over C1V1 photocurrents, and wide-field raster-scanning acquisition that did not concentrate imaging light on any one cell. Neurons of interest were selected as targets for photostimulation, which used a second TPE source operating at longer wavelengths (λ = 1,064 ± 6 nm) to prefer-entially excite C1V1 photocurrents over GCaMP3 fluorescence, and temporal focusing optics16,24,25 to generate an illumination spot pat-terned after the dimensions of a pyramidal neuron soma (≈10–15 µm
1Princeton Neuroscience Institute, Princeton University, Princeton, New Jersey, USA. 2Bezos Center for Neural Circuit Dynamics, Princeton University, Princeton, New Jersey, USA. 3Lewis-Sigler Institute for Integrative Genomics, Princeton University, Princeton, New Jersey, USA. 4Department of Molecular Biology, Princeton University, Princeton, New Jersey, USA. 5Department of Bioengineering, Stanford University, Stanford, California, USA. 6CNC Program, Stanford University, Stanford, California, USA. 7Department of Psychiatry and Behavioral Sciences, Stanford University, Stanford, California, USA. 8Howard Hughes Medical Institute, Stanford University, Stanford, California, USA. Correspondence should be addressed to D.W.T. ([email protected]).
Received 16 July; accepted 15 October; published online 17 November 2014; doi:10.1038/nn.3866
Simultaneous cellular-resolution optical perturbation and imaging of place cell firing fieldsJohn Peter Rickgauer1–4, Karl Deisseroth5–8 & David W Tank1–4
©20
14 N
atu
re A
mer
ica,
Inc.
All
rig
hts
res
erve
d.
nature neurOSCIenCe VOLUME 17 | NUMBER 12 | DECEMBER 2014 1817
t e C h n I C a l r e p O r t S
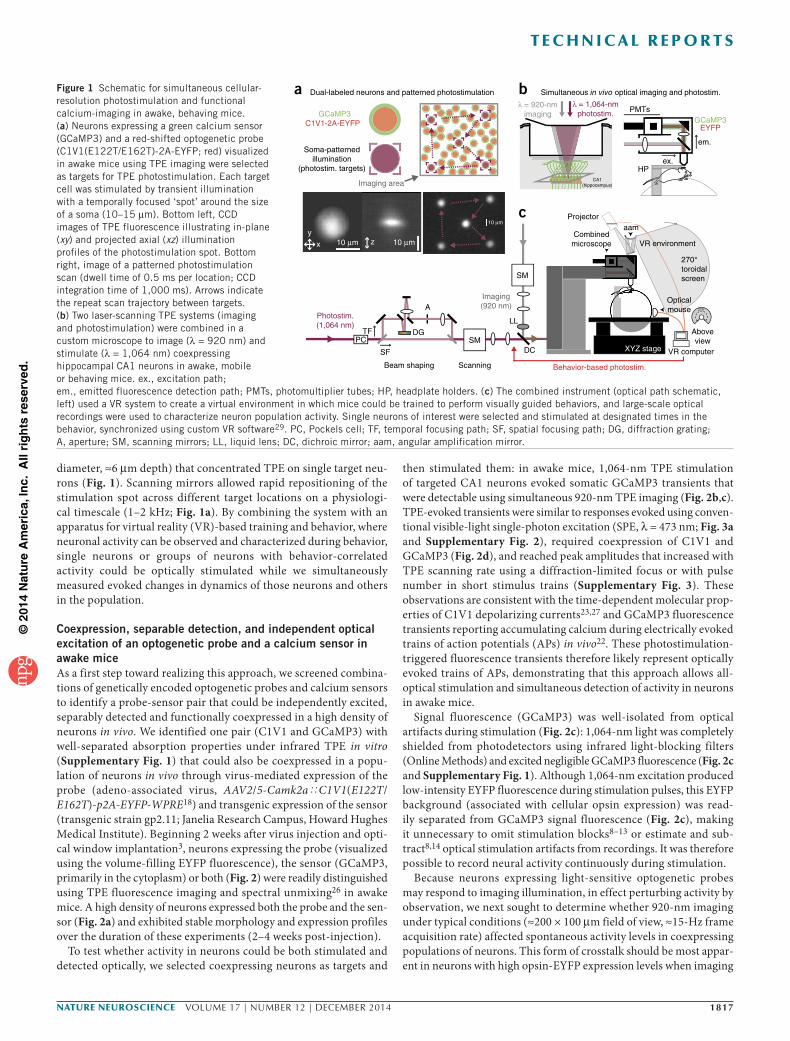
Figure 1 Schematic for simultaneous cellular- resolution photostimulation and functional calcium-imaging in awake, behaving mice. (a) Neurons expressing a green calcium sensor (GCaMP3) and a red-shifted optogenetic probe (C1V1(E122T/E162T)-2A-EYFP; red) visualized in awake mice using TPE imaging were selected as targets for TPE photostimulation. Each target cell was stimulated by transient illumination with a temporally focused ‘spot’ around the size of a soma (10–15 µm). Bottom left, CCD images of TPE fluorescence illustrating in-plane (xy) and projected axial (xz) illumination profiles of the photostimulation spot. Bottom right, image of a patterned photostimulation scan (dwell time of 0.5 ms per location; CCD integration time of 1,000 ms). Arrows indicate the repeat scan trajectory between targets. (b) Two laser-scanning TPE systems (imaging and photostimulation) were combined in a custom microscope to image (λ = 920 nm) and stimulate (λ = 1,064 nm) coexpressing hippocampal CA1 neurons in awake, mobile or behaving mice. ex., excitation path; em., emitted fluorescence detection path; PMTs, photomultiplier tubes; HP, headplate holders. (c) The combined instrument (optical path schematic, left) used a VR system to create a virtual environment in which mice could be trained to perform visually guided behaviors, and large-scale optical recordings were used to characterize neuron population activity. Single neurons of interest were selected and stimulated at designated times in the behavior, synchronized using custom VR software29. PC, Pockels cell; TF, temporal focusing path; SF, spatial focusing path; DG, diffraction grating; A, aperture; SM, scanning mirrors; LL, liquid lens; DC, dichroic mirror; aam, angular amplification mirror.
diameter, ≈6 µm depth) that concentrated TPE on single target neu-rons (Fig. 1). Scanning mirrors allowed rapid repositioning of the stimulation spot across different target locations on a physiologi-cal timescale (1–2 kHz; Fig. 1a). By combining the system with an apparatus for virtual reality (VR)-based training and behavior, where neuronal activity can be observed and characterized during behavior, single neurons or groups of neurons with behavior-correlated activity could be optically stimulated while we simultaneously measured evoked changes in dynamics of those neurons and others in the population.
Coexpression, separable detection, and independent optical excitation of an optogenetic probe and a calcium sensor in awake miceAs a first step toward realizing this approach, we screened combina-tions of genetically encoded optogenetic probes and calcium sensors to identify a probe-sensor pair that could be independently excited, separably detected and functionally coexpressed in a high density of neurons in vivo. We identified one pair (C1V1 and GCaMP3) with well-separated absorption properties under infrared TPE in vitro (Supplementary Fig. 1) that could also be coexpressed in a popu-lation of neurons in vivo through virus-mediated expression of the probe (adeno-associated virus, AAV2/5-Camk2aøC1V1(E122T/E162T)-p2A-EYFP-WPRE18) and transgenic expression of the sensor (transgenic strain gp2.11; Janelia Research Campus, Howard Hughes Medical Institute). Beginning 2 weeks after virus injection and opti-cal window implantation3, neurons expressing the probe (visualized using the volume-filling EYFP fluorescence), the sensor (GCaMP3, primarily in the cytoplasm) or both (Fig. 2) were readily distinguished using TPE fluorescence imaging and spectral unmixing26 in awake mice. A high density of neurons expressed both the probe and the sen-sor (Fig. 2a) and exhibited stable morphology and expression profiles over the duration of these experiments (2–4 weeks post-injection).
To test whether activity in neurons could be both stimulated and detected optically, we selected coexpressing neurons as targets and
then stimulated them: in awake mice, 1,064-nm TPE stimulation of targeted CA1 neurons evoked somatic GCaMP3 transients that were detectable using simultaneous 920-nm TPE imaging (Fig. 2b,c). TPE-evoked transients were similar to responses evoked using conven-tional visible-light single-photon excitation (SPE, λ = 473 nm; Fig. 3a and Supplementary Fig. 2), required coexpression of C1V1 and GCaMP3 (Fig. 2d), and reached peak amplitudes that increased with TPE scanning rate using a diffraction-limited focus or with pulse number in short stimulus trains (Supplementary Fig. 3). These observations are consistent with the time-dependent molecular prop-erties of C1V1 depolarizing currents23,27 and GCaMP3 fluorescence transients reporting accumulating calcium during electrically evoked trains of action potentials (APs) in vivo22. These photostimulation-triggered fluorescence transients therefore likely represent optically evoked trains of APs, demonstrating that this approach allows all-optical stimulation and simultaneous detection of activity in neurons in awake mice.
Signal fluorescence (GCaMP3) was well-isolated from optical artifacts during stimulation (Fig. 2c): 1,064-nm light was completely shielded from photodetectors using infrared light-blocking filters (Online Methods) and excited negligible GCaMP3 fluorescence (Fig. 2c and Supplementary Fig. 1). Although 1,064-nm excitation produced low-intensity EYFP fluorescence during stimulation pulses, this EYFP background (associated with cellular opsin expression) was read-ily separated from GCaMP3 signal fluorescence (Fig. 2c), making it unnecessary to omit stimulation blocks8–13 or estimate and sub-tract8,14 optical stimulation artifacts from recordings. It was therefore possible to record neural activity continuously during stimulation.
Because neurons expressing light-sensitive optogenetic probes may respond to imaging illumination, in effect perturbing activity by observation, we next sought to determine whether 920-nm imaging under typical conditions (≈200 × 100 µm field of view, ≈15-Hz frame acquisition rate) affected spontaneous activity levels in coexpressing populations of neurons. This form of crosstalk should be most appar-ent in neurons with high opsin-EYFP expression levels when imaging
SF
DG
A
TFLL
SM
DC XYZ stage VR computer
Behavior-based photostim.
Projectoraam
270°toroidalscreen
VR environmentCombinedmicroscope
Opticalmouse
Imaging(920 nm)
Photostim.(1,064 nm)
SM
Beam shaping Scanning
PC
10 µm 10 µmx zy
PMTs
ex.HP
em.
GCaMP3EYFP
Soma-patternedillumination
(photostim. targets)
GCaMP3C1V1-2A-EYFP
Imaging area
λ = 920-nmimaging
λ = 1,064-nmphotostim.
CA1(hippocampus)
Simultaneous in vivo optical imaging and photostim.Dual-labeled neurons and patterned photostimulationa b
c
Aboveview
270°
10 µm

©20
14 N
atu
re A
mer
ica,
Inc.
All
rig
hts
res
erve
d.
1818 VOLUME 17 | NUMBER 12 | DECEMBER 2014 nature neurOSCIenCe
t e C h n I C a l r e p O r t S
at high laser power. To define a regime for low-crosstalk imaging, we measured how the rate of spontaneous activity in neuron populations varied as a function of laser power and opsin expression level (esti-mated using cellular EYFP intensity; 220 neurons across 4 fields of view were analyzed). As expected, when imaging at high laser power (≈60–70 mW), neurons with high probe expression showed slightly elevated levels of spontaneous activity compared with imaging the same neurons at lower power (≤40 mW) or compared with other neurons expressing the probe at lower levels (Fig. 2d). This helped to define a range for imaging in our experiments (≈30–40 mW) where this effect was small (<1 additional calcium event in total from 50 coexpressing neurons during 3 min of imaging; Fig. 2d). Using this approach, neural activity can be measured in a population of cells expressing both a light-sensitive probe and a sensor without substan-tially changing underlying activity (see Discussion).
Cellular-resolution stimulation of neurons in awake miceThe main anticipated advantage of infrared TPE over visible-light SPE photostimulation was the ability to stimulate nearby cells sepa-rably in densely labeled tissue. To test this, we first compared the response profiles of single cells targeted for photostimulation using either focused visible-light SPE or patterned TPE. SPE produced responses that were broad in space (Fig. 3b), exciting other nearby cells as well as the targeted cell (N = 5 targeted cells, both in-plane and along the optical axis). By contrast, TPE-stimulated responses were limited to the independently responsive cells that were targeted in 99% of cell-cell pairs tested (101 neurons in total, 1,237 of 1,248 pairwise combinations of independently responsive neurons, median separation of 56 µm between targeted somas). In most cases in which photostimulation of one targeted cell also evoked activity in another independently responsive cell (≈1%; 11 of 1,248), those cells were very close in space and had some spatial overlap between the photo-stimulation intensity pattern and the non-targeted cell soma (median separation 11 µm; Fig. 3c).
Optogenetic stimulation can also occur through light focused away from a neuron soma (for example, through out-of-focus excitation15 or illumination of neuronal processes18,19,28), potentially causing dif-fuse responses that limit the separability of single-cell stimulation.
We therefore asked, in a separate analysis, what fraction of experi-ments produced a response in any cell that was not targeted (regardless of that cell’s ability to respond when targeted) using stimulation that produced robust responses in target neurons. In 82% of experiments targeting one soma, no single other neuron in the same field of view (FOV) responded (16 FOVs, 37–123 neurons per FOV, including 101 responsive target neurons of 182 tested). We also estimated out- of-plane activation in a subset of these experiments (5 FOVs, including 36 responsive target neurons), repeating stimulation after refocusing the 1,064-nm path by 15 or 25 µm to target locations directly above or below the original target neurons (≈1–2 cell body separation). At most of these out-of-focus locations, stimulation elicited no detect-able responses in any neurons (83 and 86%, 79 of 95 locations at 15 µm out of focus, 95 of 110 at 25 µm).
The spatial resolution of this approach, as defined using the half-width extinction distance of excited fluorescence amplitudes in tar-geted neurons, was approximately 10 µm (along optical axis; Fig. 3b) and <10 µm (lateral). It was therefore possible, using TPE at low power (typically <100 mW) and subsaturating exposure trains (illumination periods shorter than, and separated by intervals longer than, the C1V1 integration time constant of ≈50 ms), to evoke activity in single neu-rons without activating other, immediately adjacent neurons.
Optical perturbation of hippocampal place cellsWe next trained mice expressing the probe-sensor pair to perform a visually guided spatial behavior in a VR environment, navigating a virtual linear track (Fig. 4a), to determine whether it was possible to measure and then manipulate patterns of task-modulated activity in single neurons. In these experiments, task-modulated activity in CA1 pyramidal neuron populations was optically mapped using GCaMP3 imaging and neurons were classified as either place cells or silent cells (firing fields at specific locations on the track, or no place-specific firing fields; Online Methods). Then, using custom VR software to compute ‘gate’ signals in real time29, we stimulated neurons of interest
100%∆F/F
10 Hz
20 Hz
500 ms
EYFP (stim. signature)
GCaMP3
Stim. (1,064 nm)
Imaging (920 nm)
C1V1-2A-EYFP
GCaMP3
Frame 1 2 3
4 5 6
7 8 9
C1V1-2A-EYFP
GCaMP3
Merge
a
c d
b
15 µm
15 µm
40 50 60 700.02
0.04
0.06
0.08
0.10
0.12
0.14
Spo
nt. e
vent
s pe
r s
(Hz)
Imaging laser power (mW)
EYFP/GCaMP3fluor. ratios
>0.5
0.250.35
0.4
0.2
<0.1
Figure 2 All-optical stimulation and recording of neural activity in awake mice. (a) TPE fluorescence image of CA1 hippocampal neurons expressing GCaMP3 (green) and C1V1(E122T/E162T)-2A-EYFP (red) in an awake mouse. Inset, images of unmixed GCaMP3 and EYFP (top panels) and a pseudocolor merge (bottom panel; image sizes 25 × 65 µm). Somatic GCaMP3 appeared annular from nuclear exclusion, whereas EYFP was diffuse. (b) Simultaneous optical stimulation and imaging of activity in a targeted neuron (indicated in top panel). Bottom, GCaMP3 fluorescence images during one stimulation and imaging time series (frame interval of 0.125 s, target is shown in red during a 10 Hz × 0.05-s stimulation pulse-train). 1,064-nm stimulation evoked a GCaMP3 transient in the targeted cell that was detected using 920-nm imaging. (c) Somatic ∆F/F traces (GCaMP3, green) recorded during photostimulation using two-channel fluorescence detection and linear unmixing (5-trial average, 10 × 0.05-s pulses at 20 and 10 Hz during underlined periods). Evoked GCaMP3 transients were separable from optical stimulation artifacts (EYFP fluorescence, red traces), allowing continuous imaging during stimulation. (d) Estimate of activity induced by imaging opsin-expressing neurons. Rates of spontaneous activity versus imaging laser power for several neuron populations with increasing C1V1 expression (estimated by EYFP/GCaMP3 intensity and depicted by soma cartoons). Low-power imaging (≈40 mW) produced minimal changes in spontaneous activity in coexpressing neurons compared with neurons with little or no detectable C1V1-EYFP expression (error bars indicate mean ± s.d.; mean ± s.d. of lowest-expressing group at 40 mW is shown in shaded area).

©20
14 N
atu
re A
mer
ica,
Inc.
All
rig
hts
res
erve
d.
nature neurOSCIenCe VOLUME 17 | NUMBER 12 | DECEMBER 2014 1819
t e C h n I C a l r e p O r t S
at designated times in the behavior while simultaneously recording evoked and task-driven dynamics in the local neuron population (Online Methods).
Using this approach, it was possible to impose spatially defined activity that matched the overall width and amplitude of natural place field activity by stimulating single place cells or silent cells as mice tra-versed a designated part of the VR environment (Fig. 4). Illuminating a place cell with stimulation pulses in one region of the track (75–125 cm on a 400-cm-long track) that preceded the cell’s natural firing field (centered around 225 cm) robustly produced place field-like activ-ity in that region of the track (similar responses were observed in three other experiments in two mice; Fig. 4a). Notably, stimulation trials that produced ‘imposed field’ activity in this example also suppressed activity in the natural place field of that cell (traversed 1.4 ± 0.2 s later). These results indicate that simultaneous imaging and photostimulation can be used to impose patterns of activity in single cells that mimic natural patterns of activity observed during the same task.
Although stimulation of this type typically did not evoke activity in closely neighboring cells, a small number of other, anatomically distributed place cells showed significantly elevated or suppressed activity during stimulation trials (range = 1–4 other neurons in 4 experiments, using bootstrap resampling and a threshold of P = 0.05; Fig. 4c and Online Methods). To quantify the effects of this perturba-tion on the local microcircuit, we analyzed the activity of the place-cell population, excluding the target cell, as a neural circuit trajectory through a state space describing all traversals. In one example (Fig. 4), a population activity vector consisting of trial-to-trial activity in 41 place cells was identified (using factor analysis to reduce the relevant state space to three dimensions) that described the circuit trajectory during both stimulation and control (no stimulation) traversals. At each point in VR space, the Euclidean distance between the mean trajectory in control trials and stimulation trials was computed to identify periods in stimulation trials in which population activ-ity deviated substantially from control trials. Because this analysis excluded the target cell, the trajectory reported secondary (indirect)
effects of stimulation on the network. Stimulation trials that evoked activity in this place cell produced a significant change in the task-modulated activity of other cells, both during the stimulation epoch and later in the trial (just beyond the target cell’s natural place field, P = 0.004; Fig. 4d).
Low-power optical stimulationBeyond artificially controlling the activity of individual neurons, we reasoned that illuminating single cells with low-power stimulation pulses could function as a strategy to bias and detect subthreshold activity. In this application, a neuron or a group of neurons is illu-minated with a very low-intensity pulse train throughout a behavior trial. The goal is to generate a train of small depolarizing pulses in the target cell(s), which act to amplify existing membrane potential depolarizations or excitatory inputs and make them visible as fluores-cence transients, allowing all-optical probing of otherwise concealed properties of active neural circuits.
For example (Fig. 5a), an optical bias should drive a neuron above AP threshold during periods of natural membrane potential elevation (for example, during increased excitatory input), producing fluores-cence transients in that cell that can be detected optically. Averaged across trials, a cell’s activity profile during optical bias stimulation should differ from the receptive field profile (as seen in imaging-only trials) in that it should reflect the membrane potential profile. We tested this approach by attempting to form an all-optical esti-mate of membrane potential in place cells, illuminating these cells with targeted, low-power trains during full traversals of the track. In three of four different cells tested, the optical bias of a single place cell (8–10 Hz × 0.01–0.05-s duration, <50 mW) produced an asym-metric increase in fluorescence leading up to the natural firing field compared with imaging-only runs (shift in field center of mass, 9.2 ± 5.8 cm, P = 0.007; Fig. 5b). The emergence of this asymmetric ramp in fluorescence is consistent with CA1 place cell membrane potential recordings under similar behavior conditions, which have reported that an asymmetric depolarization (a ramp) leading up to a typi-cally symmetric firing field is a subthreshold signature of place cells
25%∆F/F
100%∆F/F
1 s
1 s
Target-cell responses
Cel
l num
ber
(imag
ing
RO
I)
Target number (stim ROI)
1 5 10 151
5
10
15
ba
c
15 µm
15 µm
15 µm
SPETPE
On target
Off target
1
23
4
5
6
7
8
9
10
11
12
1314
15
16
17
15 µm
SPE
TPE
Cell-to-cell center separation (µm)
Evo
ked
resp
onse
am
plitu
de(n
orm
aliz
ed; A
.U.)
1.0
0.6
0.8
00 10 20 30 40 50 60 70 80
0.2
0.4
LateralAxial
15 µm
15 µm
Figure 3 Cellular-resolution photostimulation in awake mice. (a) Specificity of cell-targeted photostimulation using focused single-photon excitation (SPE) versus TPE. Left, images of an isolated coexpressing CA1 neuron with the 1,064- or 473-nm target positions overlaid. Right, GCaMP3 ∆F/F traces measured during stimulation targeting those locations using TPE or SPE (all traces are averages of >3 trials). TPE and SPE both evoked responses when the cell was targeted, whereas only SPE evoked responses when it was not. (b) Spatial resolution of TPE and SPE photostimulation. Evoked response amplitudes for different displacements between target cells and neighboring cells laterally (as in a; solid lines) or axially (dashed lines; error bars indicate mean ± s.d.). Lateral resolution measurements (solid lines) include trials based on cellular fluorescence changes in nearby cells in densely labeled tissue (five cells, SPE; 101 cells, TPE). Inset, representative responses from one cell (centered in images) included in this measurement. Images represent post-stimulation minus pre-stimulation GCaMP3 fluorescence in each case (three-trial average). TPE and SPE evoked similar responses in targeted neurons, but responses were better confined to the target cell using TPE. (c) Matrix of TPE-stimulated responses from 17 cellular targets (indicated at top right), with significant responses shown in red (Online Methods). Each entry shows activity in one cell (given by row number) during stimulation targeting one cell (column number). Most responsive cells could be stimulated independently (two exceptions here are indicated in the image). Bottom right, TPE stimulation–triggered response profile (analogous to a point-spread function in imaging), shown as an image (normalized post-minus pre-stimulation GCaMP3 fluorescence, averaged across stimulation trials targeting 101 different cells).

©20
14 N
atu
re A
mer
ica,
Inc.
All
rig
hts
res
erve
d.
1820 VOLUME 17 | NUMBER 12 | DECEMBER 2014 nature neurOSCIenCe
t e C h n I C a l r e p O r t S
during linear track navigation30. This illustrates that calcium imag-ing, combined with low-power optical stimulation, can be used to estimate membrane potential dynamics in neurons during an ongoing behavior.
Similarly, other recent reports using intracellular techniques have observed that injecting small somatic depolarizing currents can cause a step-like emergence of spatially tuned fields in CA1 neurons31. Here, optical bias stimulation of silent cells similarly yielded spatially modu-lated activity fields (N = 2 cells; Fig. 5c). This illustrates that low-power stimulation may also reveal subthreshold dynamics in neurons, possibly by gating or amplifying distal inputs through perisomatic depolarization31. Notably, optically biasing place cells or silent cells (either individually or in groups, 1–12 neurons per experiment) led to an increased probability of in-field activity on a run-by-run basis compared with imaging-only trials (Fig. 5d). This suggests that one source of the trial-to-trial variability in CA1 firing patterns during stereotyped running trajectories, a phenomenon reported previously with extracellular electrode recordings (excess variance)32, is vari-ability in the degree of subthreshold membrane depolarization during
specific behavior epochs, rather than the complete absence of spatially modulated inputs.
To our surprise, optically biasing single place cells also led to sub-stantial changes in the activity of other, anatomically distributed cells (Fig. 5e–g). These secondary responses, which included cells with either elevation or suppression of in-field activity, occurred primarily in cells with place fields correlated with the place field of the targeted neuron (for example, correlation coefficient of 0.40–0.89 versus 0.19–0.30 for all other neurons, in imaging-only trials; Fig. 5e). Secondary responses occurred in neurons distributed over large distances (Fig. 5e,f) compared with the spatial resolution of this method (≈10 µm; Fig. 3), whereas affected firing fields of these cells were narrowly distributed (Fig. 5f,g). This suggests that these responses were not a result of collateral stimulation (such as afferent or efferent axons, or dendrites), which might be expected to cause more diffuse effects. Using mul-tiple-cell biasing to drive increased in-field activity in three place cells (Fig. 5g), we found that deviations of the population from the normal sequence of activity (excluding targeted neurons) approximately followed the largest perturbations in targeted neurons.
ba
dcTC
1
Single track traversals
2
TC
1
2
3
4
5
13
TC
5
4
2
Stim
Ctrl
10
0
20
Ses
sion
tim
e (m
in)
Photostim.
VR linear track position (cm)0 400 0 400
Position (cm)
Start
TeleportReward
StimCtrl
Natural placefield (ctrl)
Imposed placefield (stim)
25% ∆F/F
25% ∆F/F
Tria
l num
ber
Stim
Ctrl
246
. .
.
135
. .
.
15 µm
Ctrl
Stim
Diff
0.25
0
∆F/F
0.25
0
∆F/F
+0.2
–0.2
∆F/F
1
421
421
42
Cel
l num
ber
0 400
25% ∆F/F
−10
12 −0.5
00.5
11.5−1
–0.50
0.51
1.52
2.5
X1
X3
X2
On
Off
Ctrl (no TC)Stim (no TC)
Position (cm)
On Off
Euc
lidea
n di
stan
ce (
A.U
.)
0
4000
Ctrl (no TC)
Stim (no TC)
Cel
l ID
Position (cm)
0 400Position (cm)
Figure 4 Optical perturbation of a place cell during virtual navigation. (a) Schematic and experimental examples of place cell perturbation. A trained mouse ran along a 400-cm VR track (upper left). A neuron with a place field in this environment (gray shaded region) was stimulated while the mouse ran through a different part of the track (red shaded region). Single-trial examples of place-cell activity (∆F/F traces) are shown below for imaging-only and stimulation traversals. Right, activity in the targeted place cell throughout the behavior session (alternating control (ctrl) and stimulation (stim) traversals are shown in black and red, respectively). Position in the environment (gray) and periods of significant transients (colored dots) are shown below, with session averages above (bold lines). Place-specific stimulation mimicked the activity observed in the place field. (b) Intensity maps of spatially modulated activity in neurons from the recorded population (shown in c). Red arrowheads indicate the targeted cell. (c) Secondary effects of stimulation. Left, image of the neurons recorded in this session (target cell, TC). Right, spatial activity profile in the TC, two other cells that showed significantly increased in-field activity during stimulation trials (cells 1 and 2, P = 0.015 and P = 0.028) and three other cells (no difference). Stimulating one place cell increased activity in other neurons with nearby place fields. Concatenated single-trial ∆F/F traces for three cells are shown below. (d) Neuronal circuit trajectories. Left, mean state-space trajectories of population activity during stimulation and control trials (41 cells, TC excluded), visualized using the first three common factors (Online Methods). Right, Euclidean distance between control and stimulation trial trajectories. Stimulating this place cell perturbed activity in other place cells during navigation.

©20
14 N
atu
re A
mer
ica,
Inc.
All
rig
hts
res
erve
d.
nature neurOSCIenCe VOLUME 17 | NUMBER 12 | DECEMBER 2014 1821
t e C h n I C a l r e p O r t S
Across six experiments (four biasing and two directly stimulating cells in a location in the environment), secondary responses were observed in an average of five non-targeted place cells for each directly targeted place cell (range = 2–8 cells per targeted cell; 43 cells in total, ≈750 visualized neurons).
DISCUSSIONOur results demonstrate that mammalian neuronal activity can be characterized and then perturbed during a behavior at cellular reso-lution. Our approach combines genetic expression of an optogenetic probe and a calcium sensor; to the best of our knowledge, this is the first use of combined probe-sensor expression in intact mammalian tissue. GCaMP3 and C1V1-2A-EYFP may be separably detected and near-independently excited in a densely dual-labeled neuron popula-tion using spatially patterned and spectrally separated near-infrared
sources providing TPE. The success of this approach corroborates and builds on an existing framework15 in which the high two-photon absorption cross-section15 and long integration time constant of many opsin-based ion channels (approximately tens of millisec-onds) are conducive to single-neuron stimulation using fast15,18,19 or patterned16,17 illumination of the soma in this interval. Because the opsin photocycle time constant is very long (on the millisecond scale) compared with the excited-state lifetime of a fluorophore (nanosec-onds), the combined use of these different types of molecular probes in a single preparation represents a fundamental advance over existing approaches that require either omission or estimation of stimulation artifacts8–13. Our approach instead allows continuous optical record-ing of activity during arbitrary patterns of photostimulation.
As in previous functional imaging studies of CA13,33–35, we inferred changes in neural activity from changes in somatic calcium-dependent
TC1 3
2
15 µm
TC3
TC1TC2
1
4
5
3
6 2
15 µm
Low-power photostim.(optical bias)
a b c
d
1TC
2
3StimCtrl
Cel
l ID
11
2
3
4
5
6
1
3
2
12
3456
2
3
TC
TCTC
TC
2°
25%∆F/F
Cel
l ID
Position (cm)0 400
Position (cm)0 400
5
6
01
20123
00.51.01.52.02.5
X1
X3
X2
Ctrl (no TCs)Stim (no TCs)
Position (cm)
Euc
lidea
n di
st. (
A.U
.)
0
Stim (no TCs)
Ctrl (no TCs)
25%∆F/F
TC3
3
4
040
0040
0 040
0 040
0
TC2
Position (cm)
TC1
1
2Single track traversals
e f g
1.0
0.5
0Num
ber
of in
-fie
ld a
ctiv
eru
ns/n
umbe
r of
run
s
StimCtrl
Silent cellStim
Ctrl
Stim
Ctrl
0 Position (cm) 400
10
Tim
e (m
in)
15%∆F/F
Placecell 2
Placecell 3 Silent cell 2
0 cm
VR linear track
400 cm 0Position (cm)
400
4000
25%∆F/F
25%∆F/F
20
0
Tim
e (m
in)
0Position (cm)
400
25%∆F/F
25%∆F/F
Place cell
Optical bias period (full track)
Position (cm)
0
Stim
Ctrl
0Position (cm)
400
Vthr
∆F/F
Underlying Vm
StimCtrl
Figure 5 Low-power biasing to measure underlying dynamics in neurons and networks. (a) Schematic. Low-power stimulation biases a neuron, producing ∆F/F transients preferentially when Vm is near Vthr. (b) Biasing place cells. Left, place cell activity (field shaded gray) during imaging versus low-power biasing traversals (black and red). Averaged across trials (above), biasing increased activity asymmetrically, leading up to the place field. Top right, activity overlaid across all trials (gray dots, lines are averages). Bottom right, two additional examples of place cells biased by low-power stimulation. (c) Biasing silent cells. Data are presented as in b, but show activity arising from biasing two silent cells (no spatial field during imaging trials). Biasing was able to reveal spatial receptive fields (here, centered around 140 and 190 cm). (d) Fraction of receptive field traversals with in-field activity (30 cells) in imaging versus biasing traversals (field locations for silent cells determined using stimulation trials). Thick lines are the group average. (e) Secondary responses to biasing. Left, FOV from one place-cell biasing experiment (target cell and three others are indicated). Right, ∆F/F traces of neurons with significantly different activity in bias versus control trials (arrows indicate sign of the change). Difference maps (below) represent stimulation minus control for all affected cells in the population. A separate example (including all affected cells) is presented in the second column. Biasing one place cell affected activity in others with nearby fields. (f) Data are presented as in e, but low-power stimulation was applied to three cells at once (TC1–3). Average traces (below) are selected from 24 non-targeted cells differing significantly in bias versus control trials. (g) Neuronal circuit trajectories. Data are presented as in Figure 4d, but comparing imaging-only versus bias traversals (54 cells analyzed, 3 target cells excluded). Biasing three place cells perturbed population activity around the firing fields of those cells.

©20
14 N
atu
re A
mer
ica,
Inc.
All
rig
hts
res
erve
d.
1822 VOLUME 17 | NUMBER 12 | DECEMBER 2014 nature neurOSCIenCe
t e C h n I C a l r e p O r t S
fluorescence. These changes were reported using GCaMP3, a cal-cium sensor that has been applied widely, but which also has a relatively high detection threshold in vivo8,22. Naturally, this limited our ability to identify, at any instant in a time-series recording, very small changes in neural activity (such as subthreshold membrane depolarization or isolated APs) because such changes are unlikely to produce instantaneous increases in GCaMP3 fluorescence intensity. We anticipate that other, improved sensors reporting calcium36 or membrane potential37 will be compatible with this method and should be explored as additional molecular strategies are developed to achieve functional and stable coexpression with optogenetic probes.
Physiological effects of the imaging beamThe imaging laser could bias the membrane potential of coexpress-ing neurons; in an intracellular recording, this might appear as small depolarizing pulses from frame-to-frame. Although GCaMP3 does not report subthreshold membrane potential changes, we reasoned that such a depolarizing bias might be estimated and then reduced to acceptable levels by recording changes in the time-averaged rates of spontaneous neuronal activity induced at different imaging laser powers. Increasing the imaging laser power monotonically increased detectable baseline activity of neurons expressing both GCaMP3 and C1V1 as compared with GCaMP3-only neurons (which should not be affected by the imaging beam; Fig. 2d). At low imaging power, these changes became very small (<1 additional spontaneous event in total for every 3 min of imaging 50 coexpressing neurons).
Because GCaMP3 does not typically report single APs8,22, we can-not rule out the possibility that a depolarizing bias from the imag-ing laser increases the rate of spontaneous isolated APs more rapidly than detectable multiple-AP events; this idea could be tested using improved calcium sensors36. However, given that CA1 pyramidal neurons have low average firing rates and, when active, often fire APs in temporally correlated groups (for example, high-frequency theta bursts)30, it is possible that this analysis, even in the absence of single AP detection, captures most of the changes in neuronal activity caused by a bias from the imaging laser. It has also been shown that CA1 pyramidal neurons respond to subthreshold current injections (that is, a depolarizing bias) with monotonically increasing rates of spontaneous AP bursts38. This effect may explain the small increase in the rate of spontaneous events at high laser power (Fig. 2d). On the basis of the reported relationship between membrane potential depolarization and spontaneous bursting rate38 (≈0.025 additional complex spikes mV−1 s−1), we estimate that high-power imaging (60–70 mW; Fig. 2d) may have depolarized some high-opsin expression neurons by as much as 3 mV, whereas the low-power imaging (<40 mW) used in our subsequent proof-of-principle applications would have produced, on average, <1 mV of depolarization.
Spatial resolution in densely labeled tissueTPE allows single CA1 pyramidal neuron somas to be stimulated at cellular resolution in awake mice (Fig. 3). We demonstrated this under conditions commonly used for large-scale, cellular-resolution optical recordings in awake, behaving rodents: namely, where brain motion, variable background activity, neuromodulatory state and the orientation of principal cell major dendrites (along the micro-scope axis) are qualitatively different from preparations in culture15 or physiological slices16–19,39,40. The favorable performance of this approach in a region of very densely packed somas is promising for applications in other brain regions (such as neocortex) where somas are generally separated by larger distances.
We used trains of closely spaced light pulses designed to stimulate trains of closely spaced APs that could be detected using GCaMP3. Consistent with this idea, ∆F/F amplitude scaled with the number of pulses in short stimulus trains (Supplementary Fig. 3a). Given that GCaMP3 does not report all APs reliably, it is possible that some stimulation experiments also produced smaller changes (such as sin-gle APs) in nearby neurons. For studies seeking to manipulate activity on the single-AP scale, such potential effects could be characterized using improved calcium indicators with higher sensitivity41. However, we anticipate that, because saturating conditions (such as higher power or increased AP number) tend to degrade rather than improve the spatial resolution of stimulation15, experiments to stimulate even lower numbers of APs (for example, using only one or two illumina-tion pulses) will achieve similarly well-resolved stimulation.
Behavior-based stimulation experimentsPerturbation of hippocampal CA1 place cell activity (Figs. 4 and 5) provides experimental proof-of-concept that activity in single neu-rons associated with an ongoing behavior can be optically measured and manipulated. In these experiments, we used two stimulation procedures: direct stimulation and low-power optical bias stimulation. Direct stimulation can be used to mimic neural activity (for example, spatial receptive fields), imposing new patterns of activity as pertur-bations to the natural patterns exhibited during a behavior. In these experiments, to mimic place-cell activity during navigation, we repeat-edly activated single neurons in association with a place in the VR environment. In principle, these experiments might be extended to test models of potentiation (for example, through Hebbian plasticity) by pairing stimulation with periods in a behavior. Although no lasting changes were observed in the natural firing fields of neurons stimu-lated repeatedly in our experiments (>25 times in a session, 3 cells), other conditions (such as synchronizing stimulation epochs with measurements of the theta cycle) could be explored.
Although the GCaMP3 signal alone may not provide the exact number of APs induced in these experiments, it is possible to esti-mate the range of AP firing changes by reference to independent elec-trical recordings of APs from the same cell population, during the same behavior (CA1 place cells during VR linear track navigation30). For example, around an imposed place field (Fig. 4), optogenetic stimulation drove spatially defined activity similar in overall width and amplitude to the cell’s natural place field activity (width of 60 cm versus 45 cm; trial-averaged peak ∆F/F = 0.37 versus 0.42), and in the range reported using the same calcium sensor for typical CA1 place cells on a VR linear track (width 50 ± 19 cm; mean peak ∆F/F = 0.35 ± 0.29)3. Thus, these responses are typical of full place field responses, which, for mice running on a VR linear track, cor-respond to average firing rates of 7.3 ± 1.4 Hz30. If a 50-cm field is traversed at a typical running speed of ≈30 cm s−1 in 1.7 s, this should correspond to an average activity of 7.3 × 1.7 = 12 spikes per traversal (range of 10–15 spikes). We therefore estimate the optogenetic-induced spikes shown in Figure 4 to be in this range (10–15 spikes). In the same experiment, stimulation trials also reduced activity in the target cell’s natural place field. For the low number of APs expected in the brief interval of each field traversal (around ten APs in 1–2 s), the peak ∆F/F amplitude of GCaMP3 transients should increase roughly linearly with AP number22 (Supplementary Fig. 3a). As such, for this cell’s natural place field (45-cm width or around 9–13 spikes per traversal; Fig. 4), the observed reduction in peak ∆F/F value (0.45 times the value in control trials) should correspond to an altered AP number of around 4–6 spikes per traversal. This approach could also provide the range of induced (or suppressed) APs per traversal in

©20
14 N
atu
re A
mer
ica,
Inc.
All
rig
hts
res
erve
d.
nature neurOSCIenCe VOLUME 17 | NUMBER 12 | DECEMBER 2014 1823
t e C h n I C a l r e p O r t S
other experiments (Fig. 5), although future studies with improved calcium sensors may be able to visualize these AP changes directly.
We also found that the second type of manipulation (low-power optical bias) could be used to detect subthreshold activity in single neurons, consistent with results obtained with intracellular electrode recordings or manipulations (such as asymmetric membrane poten-tial ramps30 or masked firing fields31). Although optical biasing does not provide the high temporal bandwidth of intracellular electrical recordings, it does confer certain advantages, such as advance knowl-edge of anatomical location and functional cell type and the ability to repeat measurements in a specific cell across multiple days or to perform recordings from multiple cells simultaneously (Fig. 5f,g). Future experiments might use this approach to further examine the anatomical distribution of spatial information in these cells3 or to map both firing fields and subthreshold inputs31 that may contribute to long-term changes33 in receptive fields.
Secondary-cell responsesCA1 is classically viewed as a region of low auto-associative computation42. It was therefore surprising that both direct stimulation and biasing, when used to perturb single place cell activity during a behavior, also perturbed the spatial firing fields of other place cells. Our interpre-tation of these effects as functional properties of this brain region, as opposed to optical artifacts (for example, from spatially diffuse stimulation), was based on the following observations. First, although spatially diffuse optogenetic stimulation could depolarize afferent inputs28 or processes18,19 of non-targeted neurons, stimulating one targeted neuron sometimes suppressed activity in other neurons (an effect that was visible around those neurons’ normal receptive fields). This sign flip is inconsistent with diffuse stimulation and it is also unlikely to be a result of photoactivation of inhibitory interneurons, as Camk2a-driven expression of the optogenetic probe should be limited to excitatory neurons. Second, biasing single target neurons drove population activity changes that were largest when biasing also drove the largest changes in the target neurons themselves. Even if these secondary effects had been purely excitatory (for example, through diffuse stimulation), it is likely that they would have been distributed across cells with different place fields, rather than concentrated in the places where the target neurons had fields.
For each stimulated place cell, the firing fields of two to eight other place cells were affected (five on average). In these experiments, which included recordings from around 100 neurons per field of view, this value represents approximately 5% of the local population of prin-cipal cells. Given that these experiments sampled only cells in a TPE optical section and reported only changes above the GCaMP3 detection threshold, it is possible that the fraction of local place cells affected by single-cell stimulation estimated here (5%) represents a lower bound on the actual effects. Based on excitatory connectivity alone, the fraction of CA1 principal cells that might be expected to be affected by additional drive to a single place cell is much lower (1 in 100)43 than the fraction observed here (at least 5 in 100). This discrepancy, and the observation of suppressed in-field activity, suggest that place cell–to–place cell interactions in CA1 during a behavior involve more than one synapse. For example, stimulating a single CA1 pyramidal neuron could potentially drive fast or asyn-chronous changes in firing patterns of one or more interneurons44–46, which in turn might either suppress47 or elevate46 activity in other place cells. It should be possible to test such ideas by augmenting our methods with targeted expression of probes or sensors in different genetically defined populations35. Secondary effects of single-cell
stimulation may be even more prevalent in brain regions with higher recurrent connectivity48.
Broadly, our proof-of-principle results with stimulation of place cells adds to the growing evidence that local circuit interactions not only affect properties of a place cell’s firing around its field (such as the precise spike timing49), but may also define the place fields them-selves, determining which cells show firing fields and where they are located. Further applications of this approach to probe interactions among single cells while the brain is in its normal operating regime (that is, during a behavior) could contribute to a more complete description of functional connectivity than is currently possible. For example, single-cell stimulation could be combined with methods to identify structural correlates50 between individual cells to reveal multi-synaptic interactions among groups of functionally related neurons.
METhODSMethods and any associated references are available in the online version of the paper.
Note: Any Supplementary Information and Source Data files are available in the online version of the paper.
AcknowledgmentSWe thank D. Kim and C. Guo (Genetically Encoded Neuronal Indicator and Effector Project, Janelia Research Campus) for transgenic mice, D. Aronov for VR software, B. Scott for discussions, and C. Domnisoru, A. Miri, F. Collman and S. Wang for comments on the manuscript. This work was supported by the US National Institutes of Health (R01-MH083686; P50-GM071508) and a National Science Foundation Graduate Research Fellowship to J.P.R.
AUtHoR contRIBUtIonSJ.P.R. and D.W.T. designed the study. K.D. contributed reagents. J.P.R. and D.W.T. performed the experiments. J.P.R. analyzed data with strategy and methods contributions from D.W.T. J.P.R. and D.W.T. wrote the paper with comments from K.D.
comPetIng FInAncIAl InteReStSThe authors declare no competing financial interests.
Reprints and permissions information is available online at http://www.nature.com/reprints/index.html.
1. Denk, W., Strickler, J.H. & Webb, W.W. Two-photon laser scanning fluorescence microscopy. Science 248, 73–76 (1990).
2. Greenberg, D.S., Houweling, A.R. & Kerr, J.N. Population imaging of ongoing neuronal activity in the visual cortex of awake rats. Nat. Neurosci. 11, 749–751 (2008).
3. Dombeck, D.A., Harvey, C.D., Tian, L., Looger, L.L. & Tank, D.W. Functional imaging of hippocampal place cells at cellular resolution during virtual navigation. Nat. Neurosci. 13, 1433–1440 (2010).
4. Petreanu, L. et al. Activity in motor-sensory projections reveals distributed coding in somatosensation. Nature 489, 299–303 (2012).
5. Adamantidis, A.R., Zhang, F., Aravanis, A.M., Deisseroth, K. & de Lecea, L. Neural substrates of awakening probed with optogenetic control of hypocretin neurons. Nature 450, 420–424 (2007).
6. Tye, K.M. et al. Amygdala circuitry mediating reversible and bidirectional control of anxiety. Nature 471, 358–362 (2011).
7. Carter, M.E. et al. Tuning arousal with optogenetic modulation of locus coeruleus neurons. Nat. Neurosci. 13, 1526–1533 (2010).
8. Akerboom, J. et al. Genetically encoded calcium indicators for multi-color neural activity imaging and combination with optogenetics. Front. Mol. Neurosci. 6, 2 (2013).
9. Chang, Y.F., Arai, Y. & Nagai, T. Optogenetic activation during detector “dead time” enables compatible real-time fluorescence imaging. Neurosci. Res. 73, 341–347 (2012).
10. Husson, S.J. et al. Optogenetic analysis of a nociceptor neuron and network reveals ion channels acting downstream of primary sensors. Curr. Biol. 22, 743–752 (2012).
11. Lin, J.Y., Lin, M.Z., Steinbach, P. & Tsien, R.Y. Characterization of engineered channelrhodopsin variants with improved properties and kinetics. Biophys. J. 96, 1803–1814 (2009).

©20
14 N
atu
re A
mer
ica,
Inc.
All
rig
hts
res
erve
d.
1824 VOLUME 17 | NUMBER 12 | DECEMBER 2014 nature neurOSCIenCe
t e C h n I C a l r e p O r t S
12. Wilson, N.R., Runyan, C.A., Wang, F.L. & Sur, M. Division and subtraction by distinct cortical inhibitory networks in vivo. Nature 488, 343–348 (2012).
13. Zhang, F. et al. Multimodal fast optical interrogation of neural circuitry. Nature 446, 633–639 (2007).
14. Guo, Z.V., Hart, A.C. & Ramanathan, S. Optical interrogation of neural circuits in Caenorhabditis elegans. Nat. Methods 6, 891–896 (2009).
15. Rickgauer, J.P. & Tank, D.W. Two-photon excitation of channelrhodopsin-2 at saturation. Proc. Natl. Acad. Sci. USA 106, 15025–15030 (2009).
16. Andrasfalvy, B.K., Zemelman, B.V., Tang, J. & Vaziri, A. Two-photon single-cell optogenetic control of neuronal activity by sculpted light. Proc. Natl. Acad. Sci. USA 107, 11981–11986 (2010).
17. Papagiakoumou, E. et al. Scanless two-photon excitation of channelrhodopsin-2. Nat. Methods 7, 848–854 (2010).
18. Prakash, R. et al. Two-photon optogenetic toolbox for fast inhibition, excitation and bistable modulation. Nat. Methods 9, 1171–1179 (2012).
19. Packer, A.M. et al. Two-photon optogenetics of dendritic spines and neural circuits. Nat. Methods 9, 1202–1205 (2012).
20. Yaroslavsky, A.N. et al. Optical properties of selected native and coagulated human brain tissues in vitro in the visible and near infrared spectral range. Phys. Med. Biol. 47, 2059–2073 (2002).
21. Oheim, M., Beaurepaire, E., Chaigneau, E., Mertz, J. & Charpak, S. Two-photon microscopy in brain tissue: parameters influencing the imaging depth. J. Neurosci. Methods 111, 29–37 (2001).
22. Tian, L. et al. Imaging neural activity in worms, flies and mice with improved GCaMP calcium indicators. Nat. Methods 6, 875–881 (2009).
23. Yizhar, O. et al. Neocortical excitation/inhibition balance in information processing and social dysfunction. Nature 477, 171–178 (2011).
24. Oron, D., Tal, E. & Silberberg, Y. Scanningless depth-resolved microscopy. Opt. Express 13, 1468–1476 (2005).
25. Zhu, G., van Howe, J., Durst, M., Zipfel, W. & Xu, C. Simultaneous spatial and temporal focusing of femtosecond pulses. Opt. Express 13, 2153–2159 (2005).
26. Zimmermann, T., Rietdorf, J. & Pepperkok, R. Spectral imaging and its applications in live cell microscopy. FEBS Lett. 546, 87–92 (2003).
27. Mattis, J. et al. Principles for applying optogenetic tools derived from direct comparative analysis of microbial opsins. Nat. Methods 9, 159–172 (2012).
28. Petreanu, L., Huber, D., Sobczyk, A. & Svoboda, K. Channelrhodopsin-2–assisted circuit mapping of long-range callosal projections. Nat. Neurosci. 10, 663–668 (2007).
29. Aronov, D. & Tank, D.W. Engagement of the neural circuits underlying 2D spatial navigation in a rodent virtual reality system. Neuron 84, 442–456 (2014).
30. Harvey, C.D., Collman, F., Dombeck, D.A. & Tank, D.W. Intracellular dynamics of hippocampal place cells during virtual navigation. Nature 461, 941–946 (2009).
31. Lee, D., Lin, B.J. & Lee, A.K. Hippocampal place fields emerge upon single- cell manipulation of excitability during behavior. Science 337, 849–853 (2012).
32. Fenton, A.A. & Muller, R.U. Place cell discharge is extremely variable during individual passes of the rat through the firing field. Proc. Natl. Acad. Sci. USA 95, 3182–3187 (1998).
33. Ziv, Y. et al. Long-term dynamics of CA1 hippocampal place codes. Nat. Neurosci. 16, 264–266 (2013).
34. Kaifosh, P., Lovett-Barron, M., Turi, G.F., Reardon, T.R. & Losonczy, A. Septo-hippocampal GABAergic signaling across multiple modalities in awake mice. Nat. Neurosci. 16, 1182–1184 (2013).
35. Lovett-Barron, M. et al. Dendritic inhibition in the hippocampus supports fear learning. Science 343, 857–863 (2014).
36. Chen, T.W. et al. Ultrasensitive fluorescent proteins for imaging neuronal activity. Nature 499, 295–300 (2013).
37. St-Pierre, F. et al. High-fidelity optical reporting of neuronal electrical activity with an ultrafast fluorescent voltage sensor. Nat. Neurosci. 17, 884–889 (2014).
38. Grienberger, C., Chen, X. & Konnerth, A. NMDA receptor-dependent multidendrite Ca2+ spikes required for hippocampal burst firing in vivo. Neuron 81, 1274–1281 (2014).
39. Papagiakoumou, E. et al. Functional patterned multiphoton excitation deep inside scattering tissue. Nat. Photonics 7, 274–278 (2013).
40. Losonczy, A., Zemelman, B.V., Vaziri, A. & Magee, J.C. Network mechanisms of theta related neuronal activity in hippocampal CA1 pyramidal neurons. Nat. Neurosci. 13, 967–972 (2010).
41. Dana, H. et al. Thy1-GCaMP6 transgenic mice for neuronal population imaging in vivo. PLoS ONE 9, e108697 (2014).
42. Amaral, D.G. & Witter, M.P. The three-dimensional organization of the hippocampal formation: a review of anatomical data. Neuroscience 31, 571–591 (1989).
43. Deuchars, J. & Thomson, A.M. CA1 pyramid-pyramid connections in rat hippocampus in vitro: dual intracellular recordings with biocytin filling. Neuroscience 74, 1009–1018 (1996).
44. Marshall, L. et al. Hippocampal pyramidal cell-interneuron spike transmission is frequency dependent and responsible for place modulation of interneuron discharge. J. Neurosci. 22, RC197 (2002).
45. Galarreta, M. & Hestrin, S. Spike transmission and synchrony detection in networks of GABAergic interneurons. Science 292, 2295–2299 (2001).
46. Jonas, P., Bischofberger, J., Fricker, D. & Miles, R. Interneuron diversity series: fast in, fast out–temporal and spatial signal processing in hippocampal interneurons. Trends Neurosci. 27, 30–40 (2004).
47. Freund, T.F. & Buzsaki, G. Interneurons of the hippocampus. Hippocampus 6, 347–470 (1996).
48. Ko, H. et al. Functional specificity of local synaptic connections in neocortical networks. Nature 473, 87–91 (2011).
49. Royer, S. et al. Control of timing, rate and bursts of hippocampal place cells by dendritic and somatic inhibition. Nat. Neurosci. 15, 769–775 (2012).
50. Briggman, K.L., Helmstaedter, M. & Denk, W. Wiring specificity in the direction-selectivity circuit of the retina. Nature 471, 183–188 (2011).

©20
14 N
atu
re A
mer
ica,
Inc.
All
rig
hts
res
erve
d.
nature neurOSCIenCedoi:10.1038/nn.3866
ONLINE METhODSmicroscope design. Two separate ultrashort-pulsed sources were used for two-photon imaging (Coherent Chameleon Ultra II, 920 ± 6 nm, <200-fs output pulse duration) and for photostimulation (FemtoPower 5W, Fianium; 1,064 ± 6 nm, <300 fs). In experiments with visible-wavelength single-photon stimulation, a diode-pumped solid-state source was used (λ = 473 nm, 100-mW unit, OEM Laser Systems). The 920-nm and 1,064-nm paths were combined using a long-pass dichroic mirror (950dcxrxt, Chroma) and reflected to the microscope focus-ing objective (LUMPLFLN 40XW, Olympus) using a short-pass dichroic mirror (700dcspxr, Chroma) with good transmission of 473-nm light (for SPE stimula-tion; Supplementary Fig. 2) and excited fluorescence (for imaging). Following an infrared light-blocking filter (FF01-680/SP-25, Semrock), excited fluorescence was separated for two-channel detection using a dichroic mirror (FF518-Di01, Semrock), two emission filters (FF01-494/41 and FF01-578/105, Semrock), two photomultiplier tubes (H10770P-40SEL, Hamamatsu), and a high optical density long-pass edge filter (LP02-473RU, Semrock) to block 473-nm light from the detector assembly. Spectral properties of molecules, laser sources and optics used in this design are shown together in Supplementary Figure 1.
A blazed ruled diffraction grating (#3-4114, UTF-CW series, 1,200 lines per mm, Optometrics) oriented around the Littrow configuration (close to ret-rodiffraction) was used to shape the spatial profile of pulses from the 1,064-nm source by temporal focusing16,24,25,51. Following a 1:1 afocal telescope (focal length f = 300 mm, Thorlabs #AC508-300-C), an aperture (Fig. 1) in a plane optically conjugate to the grating was used to reduce the outer diameter of the temporally focused spot. An achromatic doublet (Thorlabs #AC300-100-B) transformed the spot to a spectral line focus in the Fourier plane, which was positioned at the center of a pair of XY galvanometer-driven scanning mirrors (3-mm aperture, 6210 series; Cambridge Technology). Two additional afocal telescopes (f = 63 mm, #4401-387-000-21, Qioptiq; f = 164 mm, NT58-395, Edmund Optics; f = 160 mm, #G322310525, Qioptiq; f = 200 mm, #58-520, Edmund Optics) were used to map the plane of optical rotation to the entrance pupil of the microscope objective with minimal insertion loss, producing a temporally focused TPE spot profile with appropriate demagnification that could be scanned in the sample plane. The TPE spot profile in the sample plane (Fig. 1) was measured near the center of the field of view using a thin fluorescent sample (100 µM Alexa 594 in 3% bovine serum albumin, 1 µl spread on coverglass and then air-dried) and an inverted microscope design52 consisting of a 60× air objective (LUMPLFLN 60XW, Olympus), a long-pass dichroic, infrared blocking and bandpass filters (BG39 glass, Schott; 607/70, Semrock), and a CCD camera (Coolsnap CF, RoperScientific). 1,064-nm power at the sample plane was controlled using a Pockels cell (#350-80 modulator with 302RM driver; Conoptics). For imaging (920 nm), laser power was controlled using an attenuator based on a Berek compensator (W. Denk, US patent 6,249,379 B1 (June 19, 2001)) in a double-pass configuration, and scanning used galva-nometer-driven mirrors (6210 series mirrors and 677 Micromax series drivers; Cambridge Technology). Power was monitored throughout experiments using pickoff photodiodes calibrated against through-objective power measurements obtained with a thermal detector (Fieldmaster, Coherent).
The system included four optical paths: imaging (920 nm), primary TPE stim-ulation (1,064 nm, temporal focusing), secondary TPE stimulation (1,064 nm, spatial focusing) and SPE stimulation (473 nm). Registration of the TPE paths was achieved by adjusting offset voltage to the scanning mirrors (920-nm and 1,064-nm TF path), optical input angle to the scanning mirrors (1,064-nm SF path), and scanning mirror voltage range to minimize the differences between acquired images of a thin air-dried fluorescent sample on a fiducial grid (Thorlabs #R1L3S3P). Beam divergence of the 920-nm path was adjusted to achieve parfocality with the 1,064-nm paths, using a variable-focus electric liquid lens (EL-10-30, Optotune; 250 mA driver, Thorlabs #LD1255R) with a compound offset lens53 (f = −100 mm; Thorlabs #LC1120-B) positioned in an optical plane approximately conjugate to the scanning-mirror plane in the imaging system (Fig. 1). The SPE source was focused in the common TPE scanning plane by alternately bleaching (SPE) and imaging (TPE) the thin fluorescent sample, adjusting lateral and axial position of the SPE focus with an alignment mirror and telescope lenses leading to the entrance port in the microscope head (Supplementary Fig. 2).
To eliminate registration errors arising from movement of optics in the micro-scope (for example, during refocusing) all optics in the system were held in fixed positions, whereas movement and refocusing instead used a custom-built stage to translate the sample itself. The stage consisted of a two-axis linear translation table
(XYR-8080, Dover-Danaher) and two mechanically coupled vertical translation stages (MVN80, Newport; Flex-E-Belt system, W.M. Berg) supporting a platform on which a styrofoam treadmill and headplate holders were mounted. Motorized movements of the sample platform in all three dimensions (x, y and z) were actu-ated using a modified MP285 microcontroller (v. DT3.3, Sutter Instruments).
Instrument control and data acquisition. The instrument was controlled using custom virtual instrument panels written in LabView (National Instruments). Signal acquisition and generation for two analog input channels and six analog output channels (two pairs of XY scanning mirrors, plus Pockels cell control and an auxillary output) used three acquisition boards (PCI-6110E, PCI-6221 and PCIe-6321; National Instruments) synchronized using the Real Time System Integration bus (National Instruments). In some experiments, stimulation periods were gated using analog outputs generated by a Digidata 1440A and Clampex v.10 (Molecular Devices), using the shutter sync signal from the laser shutter driver (#VMM-D1 with LS6ZM2 shutter, Vincent Associates) to trigger waveform generation. In some experiments, ScanImage software54 was used for image acquisitions.
Measurements to characterize the response properties of illuminated neu-rons (Figs. 2 and 3) were obtained in awake, mobile mice that were not in a VR environment. In all of these experiments, an interval of at least 60 s was enforced between repeat trials to stimulate any one cell. Protocols varying one stimula-tion parameter (for example, laser power or target location) were performed in blocks consisting of interleaved trials of most or all types and including at least one reference trial. For example, a measurement of in-plane spatial resolution (as in Fig. 3a) consisting of an on-target trial (T) and four trials at different positions offset from the cell (±X and ±Y) would be arranged as: (T, +X, −Y, +Y, −X, T, −Y, +X, +Y, −X,…). Cells were selected on the basis of visibility and expected responsiveness to stimulation (cytoplasmic GCaMP fluorescence, and high EYFP brightness defining the nucleus). In experiments where multiple cells were selected for stimulation from a single field of view during awake imaging sessions, neurons were selected based on visibility of the in-plane soma (typically, a donut-like GCaMP3 fluorescence) and volume-filling EYFP fluorescence (indi-cating C1V1 expression), without considering distance between targets. As such, targeted neurons were distributed around the field of view, including some that were very close and others that were more widely separated (see Fig. 3c).
To obtain a stimulation and imaging time series, an acquired image was viewed online and used to select the center locations of one or more targets (cell somas) manually (LabView Image Acquisition Toolbox). The (x,y) scanner offset voltage values were computed from the (x,y) pixel coordinates of each target. Then, an image acquisition was initiated and several frames into the acquisition (typically 4–8 or 0.25–0.5 s at ~16-Hz acquisition rate), a photostimulation protocol was initiated. Fluorescence images were acquired continuously during the stimulation epoch (typical duration ≤ 1 s) and ended 1–5 s later. During a stimulation and imaging time series, 1,064-nm photostimulation exposure timing was controlled using a Pockels cell modulated between ‘off ’ (extinction ratio > 400:1) and ‘on’ (the power setpoint) at high bandwidth (≈10 kHz) by analog command steps gated by a MOSFET switch, using start triggers generated by the instrument control software (LabView). Visible-wavelength stimulation exposures (Fig. 3a,b) were controlled using TTL pulses to modulate laser output power at the sup-ply. Stimulation trials used 1,064-nm TPE that was either temporally focused (TF; Fig. 1) or conventionally focused (spatial focusing, SF). In single-cell SF experi-ments, a low-NA focus (≈0.3NA) generated by underfilling the objective was rapidly scanned over the target (typical dimensions ≈12–15 µm, scan period of 8–16 ms, sinusoidal raster-pattern). In single-cell TF experiments, the spot occupied a fixed position centered on the target. In multiple-cell experiments of either type, the illumination profile was repositioned to target a sequence of locations.
Spatial resolution measurements using TPE and SPE (Fig. 3) were obtained by acquiring a stimulation and imaging time series where the target was centered on a cell of interest, and then translating the stage to a different position (x, y or z) and acquiring another time series. When the z value was changed (along optical axis), the imaging system was refocused at the original plane of the target cell using a liquid lens. Additional spatial resolution measurements using only TPE were obtained from groups of targeted cells; these time series were acquired sequentially, repositioning the illumination profile (rather than the sample) to target each neuron, and allowing at least 2 s between stimulation epochs targeting different cells (60 s between epochs targeting the same cells).

©20
14 N
atu
re A
mer
ica,
Inc.
All
rig
hts
res
erve
d.
nature neurOSCIenCe doi:10.1038/nn.3866
For experiments in behaving mice (during VR environment interaction), stim-ulation and imaging time series were synchronized with behavior by recording the imaging path shutter sync signals (as file markers) and scanning mirror com-mand signals (acquisition end markers) along with current VR environment position, traversal number, running speed, reward timing and the gate signal used to modulate stimulation exposure epochs in ViRMEn software (see below). In experiments using ScanImage for image acquisition, an analog voltage signal encoding position in the VR environment was recorded on the third channel in the imaging time series. Photostimulation trials targeting single cells during VR navigation used 10-Hz pulses (50-ms duration), and were performed in an alternating sequence with imaging-only trials (trials were traversals of the envi-ronment; reward delivery toggled between trial-types) during periods when the mouse was running in the environment (instantaneous ball velocity >0.5 cm s−1). In VR location–specific stimulation trials (Fig. 4), ViRMEn software was used to enable the pulse train controlling stimulation exposures only when the mouse’s position in the VR environment was in the designated region (Fig. 4). For optical bias stimulation (Fig. 5), the stimulation pulse train was enabled at all locations in the environment.
mouse surgical procedures and behavior training. All experiments were per-formed in compliance with the Guide for the Care and Use of Laboratory Animals, and protocols approved by the Princeton University Institutional Animal Care and Use Committee. Heterozygous male Thy1-GCaMP3-WPRE transgenic mice (strain GP2.11; provided by D.S. Kim, Genetically Encoded Neuronal Indicator and Effector Project, Janelia Research Campus) were used in all experiments unless otherwise noted. Surgical procedures for virus injection and chronic implantation of a headplate and optical imaging window used methods described previously3, but were modified in the following ways: the viral vector used for injections was rAAV5 carrying the Camk2aøC1V1(t/t)-TS-P2A-EYFP expression cassette (1.6 × 10¹³ GC ml−1; Gene Therapy Center, University of North Carolina at Chapel Hill), 500–650 nl of virus solution was injected over a period of 10–15 min, and headplate implantation occurred in the same surgical procedure as injection. Mice were 8–10 weeks old at the time of surgery and were housed in groups (3–4 mice per cage) in a vivarium on a reverse light-dark cycle.
Mice were trained during the day to run on a linear track in a visual VR environ-ment using a VR projection system and behavior training procedures (including water scheduling) described previously3,30,55, but modified in the following ways. First, animal handling, acclimation to the treadmill and water scheduling (1 ml/day) began >3–4 d after the optical window implantation surgery and VR training began around 7 d after surgery. Second, mice were trained to run along a unidirectional 400-cm-long virtual linear track as described55, but using an air-supported styrofoam treadmill constrained to rotate about one axis (pitch) and an optical mouse to detect movements56. Mice adapted quickly to this approach, running for many rewards (>100 per h) within 1–2 weeks of initiating train-ing. Third, VR-based behavior experiments were designed and executed using a general-purpose software system (Virtual Reality Matlab Engine, or ViRMEn29). Using ViRMEn, properties of ongoing behavior (such as environment position or reward number) were used to compute custom gate signals, which were written as high or low voltages to a NI-DAQ analog output channel with each environ-ment update cycle (~30–35 ms) and used to synchronize stimulation with specific epochs in the behavior. Finally, environment projection used a blue bandpass filter (455/110, Chroma) and a toroidal projection surface as described3,30, but which was machined from expanded polystyrene (1.5 eps; Global Manufacturing Solutions) and coated with reflective paint to increase environment brightness. The screen was also constructed of 3 90-degree segments joined by hinges to allow experimental access to the stage without moving the microscope.
data analysis. Data were analyzed using toolboxes and custom scripts written in Matlab (R2012a; Mathworks). For all experiments, two-channel imaging time series acquisitions were first separated into estimated GCaMP and YFP time series using linear unmixing adapted from a method that has been described57. In two-channel linear unmixing, two detectors with different spectral bandpass filters are used to measure the combined fluorescence from two types of fluorophore with overlapping emission spectra, using the unique ratio of detector signals for each fluorophore alone (its spectral signature) to estimate the ratio of fluorophore con-centrations26. Here, the spectral signatures of GCaMP and EYFP were measured using the same imaging preparation (hippocampal window) in wild-type C57/BL6
mice (Jackson Laboratories) with virally mediated expression of either GCaMP6 (ref. 36) (AAV1-SynøGCaMP6s-WPRE-SV40, 3 × 10¹³ GC ml−1, 100-nl injection volume; University of Pennsylvania Vector Core) or C1V1(t/t)-2A-EYFP. These detector signal ratios (0.33:1 and 1:150, with this filter set) were then used to unmix time series acquisitions by file (that is, as a time-independent block of pixels) after subtracting the measured PMT pre-amplifier offset for each channel. This yielded two time series, GCaMP and YFP, for each acquisition. In principle, differences in background between the reference measurement and data sets could cause errors in unmixing, but in practice, cells in the unmixed GCaMP data sets appeared nuclearly excluded and showed normal calcium-dependent fluorescence transients (Supplementary Fig. 3), whereas cells in the unmixed YFP data sets appeared volume-filled and did not show fluorescence transients (Fig. 2). The same offset and detector ratios were used for all data sets.
GCaMP and YFP time series were motion-corrected together, using one set of full-frame centroid-shifts computed by cross-correlation58 of the GCaMP time series. Slow changes in full-frame fluorescence over long recordings were com-pensated by computing the distribution of all pixel intensities in 15-s blocks and subtracting the eighth percentile value from those frames. Regions of interest (ROIs) in motion-corrected GCaMP data sets were identified manually56 or by using an automated approach59 (µ = 0.5–1)3, and ∆F/F traces were computed for each ROI. In a few cases where specific cells of interest were not identified by the automated algorithm, ∆F/F traces were computed from manually selected ROIs and appended to the population data set. For experiments using SPE stimulation, where blue-light pulses were synchronized with periods of transient detector saturation (bright groups of lines in the image), lines in stimulation frames that exceeded the median line-by-line fluorescence across all epochs (at the time in the stimulation epoch) by >1% of the s.d. were excluded from calculation of ∆F/F values. Significant transients were identified in baseline-corrected traces as periods where ∆F/F values increased to cross a threshold value of 3 σs above the median value and remained continuously above a value of 0.5 σs for at least 0.5 s. Here, σs is the median of all s.d. computed for the full ∆F/F trace in 1–2-s bins; this approach gave reasonable estimates of baseline fluorescence even under conditions of large and/or frequent transients. In significant transient-only traces, the significant transients were unmodified, and the values at time points between significant transients were set to zero3,56,60. ∆F/F traces were used for further analysis in experiments, except where indicated.
YFP traces marking 1,064-nm stimulation epochs (as in Fig. 2c) were com-puted using YFP data sets that were analyzed as a time series of pixels in the order that they were acquired (rather than as frames) during stimulation trials. These traces represent whole field–detected YFP fluorescence in time, smoothed using a first-order Savitsky-Golay filter (16-ms window) and averaged across three or more stimulation trials. YFP/GCaMP fluorescence ratios (as in Fig. 2d) represent the ratio of unmixed YFP fluorescence in each cell to unmixed resting GCaMP fluorescence in all cells in that field of view. For each cell in a given field of view, the YFP/GCaMP fluorescence ratio was computed as the mean YFP fluorescence across all pixels in the ROI for that cell and all frames in the acquisition (after excluding frames where the cell had significant GCaMP transients) divided by the GCaMP fluorescence in all cells (full-field median) from the same frames, at the same input laser power. A spontaneous event (as in Fig. 2d) was defined as a significant transient detected in a neuron-ROI during 920-nm imaging with the 1,064-nm laser blocked. Rates of spontaneous events were calculated for each ROI by summing the number of significant transients observed across all recordings at each laser power, and then dividing that number by the total recording time (in seconds) at that laser power. Spontaneous event rates for all ROIs were then averaged across groups of cells binned by YFP/GCaMP ratios.
In single-cell stimulation spatial resolution measurements (as in Fig. 3a–c), ∆F/F traces were calculated for all cells in each field of view that were selected as targets for stimulation. Those cells were considered responsive to stimulation if a significant transient occurred in a 1-s interval around stimulation onset, using a value of 4 σs for the threshold change at onset to classify transient changes as significant, the peak transient amplitude in that interval was >25% ∆F/F, and sig-nificant transients occurred at least twice across all trial intervals (trials were typi-cally repeated 5–10 times). To determine the fraction of experiments in which any neuron other than the targeted neuron responded to stimulation, additional ROIs were defined (947 in total, across 16 FOVs) and the analysis above was repeated to compute additional ∆F/F traces and then identify stimulation-triggered responses in all ROIs (in addition to stimulation-targeted cells). Two additional steps were

©20
14 N
atu
re A
mer
ica,
Inc.
All
rig
hts
res
erve
d.
nature neurOSCIenCedoi:10.1038/nn.3866
taken to reduce false positive detection resulting from spillover (fluorescence transients originating in somas in adjacent, partially overlapping ROIs). First, ROIs that were not targeted, but which responded to stimulation (accord-ing to the three criteria described above), were identified as candidate off-target responders. If any single trial produced a response in the candidate ROI without also producing a response in the target ROI, the candidate ROI was automatically designated as an off-target responding neuron. If responses in the candidate ROI only occurred in trials where the target neuron also responded, then the time series was inspected manually to determine whether the ∆F/F signal detected in the candidate ROI originated in that neuron or the targeted neuron.
For recordings during VR behavior, periods in which the mouse was station-ary (ball velocity < 0.5 cm s−1) were excluded from analysis. Cells with task-modulated activity were classified using an adaptation of an approach described previously3. First, traversals of the environment were divided into two trial-types: off trials (no photostimulation; imaging only) or on trials (all biasing stimulation trials, or direct stimulation trials where place-specific stimulation produced a transient in that cell). For each category and each cell, ∆F/F values were calculated as a function of VR spatial location by averaging over 7.5-cm spatial bins in each traversal. The mean spatially binned ∆F/F across all traversals in that category was then computed. If the peak ∆F/F value in this trace was located in a region of contiguous activity (>0.25 times the peak for ≥30 cm), this region was considered a candidate place field. If the mean in-field ∆F/F contained one value of at least 0.1 and significant transients were present at least 20% of the time spent running in that field in individual traversals, the cell was classified as having a place field in that trial type. Cells with place fields in off trials were classified as place cells.
Factor analysis (ten factors) was performed using a Matlab toolbox and custom scripts. Variables for factor analysis consisted of place cells (ROIs from imaging time series), and observations consisted of spatially binned ∆F/F traces from early (15–25 cm) in traversals up to the water reward (360 cm). For all cells, activity traces across single traversals were concatenated across off trials and then across an equal number of on trials. Each column in the matrix (observations for one cell) was then smoothed using a window of three spatial bins (22.5 cm) and divided by the maximum value in the column. Factor analysis was performed once using all place cells (including the cell or cells targeted for stimulation) and then repeated after removing the target cell(s) from the matrix. Trajectories were plotted using the first three common factors. The distance between trajec-tories represents the Euclidean distance in the factor space at each VR spatial bin center.
No calculation was performed to determine sample size a priori; sample sizes were chosen to be similar to previous studies characterizing optical stimula-tion (tens of stimulated cells) and analyzing in vivo fluorescence recordings
(hundreds). Bootstrap resampling was used to evaluate statistical significance of differences in spatially modulated activity (∆F/F traces from single cells) between on or off trial types. For each cell, equal numbers of single-traversal ∆F/F traces from each trial-type were shuffled and sampled (with replacement) and used to compute two mean ∆F/F traces. Then, the absolute value of the difference between the summed fluorescence for each mean trace (area under each curve) was computed. This process was repeated at least 100,000 times to produce a distribution of this quantity. This distribution was then used to assign a P value for the same quantity computed using the original (unshuffled) traces. To estimate false discovery rate using this approach, the procedure was repeated after shuf-fling and sampling (with replacement) trial-type labels (on or off). The distribu-tion of P values computed in this way (repeated to obtain at least 200 P values) in data sets where this test was applied was approximately uniform between 0 and 1 (that is, with 4–5% of P values below 0.05; two data sets). The same approach was used to evaluate significance of Euclidean distances between mean state-space trajectories (single-trial trajectories computed using factor analysis; see above). Correlation coefficients between place fields in different cells were computed using the first half of the matrix used for factor analysis (off trials only), and Matlab’s corrcoef function.
A Supplementary methods checklist is available.
51. Vaziri, A. & Emiliani, V. Reshaping the optical dimension in optogenetics. Curr. Opin. Neurobiol. 22, 128–137 (2012).
52. Dana, H. & Shoham, S. Numerical evaluation of temporal focusing characteristics in transparent and scattering media. Opt. Express 19, 4937–4948 (2011).
53. Grewe, B.F., Voigt, F.F., van‘t Hoff, M. & Helmchen, F. Fast two-layer two-photon imaging of neuronal cell populations using an electrically tunable lens. Biomed. Opt. Express 2, 2035–2046 (2011).
54. Pologruto, T.A., Sabatini, B.L. & Svoboda, K. ScanImage: flexible software for operating laser scanning microscopes. Biomed. Eng. Online 2, 13 (2003).
55. Domnisoru, C., Kinkhabwala, A.A. & Tank, D.W. Membrane potential dynamics of grid cells. Nature 495, 199–204 (2013).
56. Harvey, C.D., Coen, P. & Tank, D.W. Choice-specific sequences in parietal cortex during a virtual-navigation decision task. Nature 484, 62–68 (2012).
57. Zimmermann, T., Rietdorf, J., Girod, A., Georget, V. & Pepperkok, R. Spectral imaging and linear un-mixing enables improved FRET efficiency with a novel GFP2-YFP FRET pair. FEBS Lett. 531, 245–249 (2002).
58. Miri, A., Daie, K., Burdine, R.D., Aksay, E. & Tank, D.W. Regression-based identification of behavior-encoding neurons during large-scale optical imaging of neural activity at cellular resolution. J. Neurophysiol. 105, 964–980 (2011).
59. Mukamel, E.A., Nimmerjahn, A. & Schnitzer, M.J. Automated analysis of cellular signals from large-scale calcium imaging data. Neuron 63, 747–760 (2009).
60. Dombeck, D.A., Graziano, M.S. & Tank, D.W. Functional clustering of neurons in motor cortex determined by cellular resolution imaging in awake behaving mice. J. Neurosci. 29, 13751–13760 (2009).