Embed Size (px)
Citation preview
Michelle Yan, Scott T. Clarke, Bhaskar S. Mandavilli, Shih-Jung Huang, Upinder Singh, Michael S. Janes, and Nicholas J. DolmanMolecular Probes® Labeling and Detection Technologies – Life Technologies, 29851 Willow Creek Road, Eugene, Oregon 97402 , USA
ABSTRACT
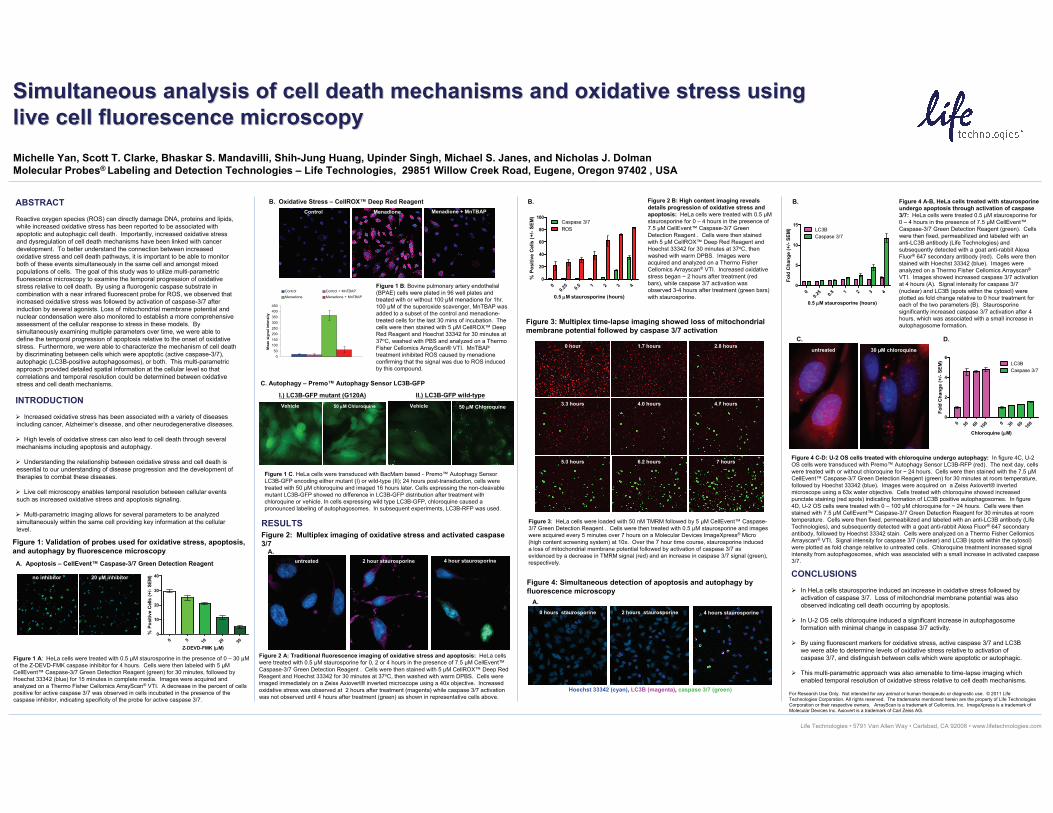
Reactive oxygen species (ROS) can directly damage DNA, proteins and lipids, while increased oxidative stress has been reported to be associated with apoptotic and autophagic cell death. Importantly, increased oxidative stress and dysregulation of cell death mechanisms have been linked with cancer development. To better understand the connection between increased oxidative stress and cell death pathways, it is important to be able to monitor both of these events simultaneously in the same cell and amongst mixed populations of cells. The goal of this study was to utilize multi-parametric fluorescence microscopy to examine the temporal progression of oxidative stress relative to cell death. By using a fluorogenic caspase substrate in combination with a near infrared fluorescent probe for ROS, we observed that increased oxidative stress was followed by activation of caspase-3/7 after induction by several agonists. Loss of mitochondrial membrane potential and nuclear condensation were also monitored to establish a more comprehensive assessment of the cellular response to stress in these models. By simultaneously examining multiple parameters over time, we were able to define the temporal progression of apoptosis relative to the onset of oxidative stress. Furthermore, we were able to characterize the mechanism of cell death by discriminating between cells which were apoptotic (active caspase-3/7), autophagic (LC3B-positive autophagosomes), or both. This multi-parametric approach provided detailed spatial information at the cellular level so that correlations and temporal resolution could be determined between oxidative stress and cell death mechanisms.
INTRODUCTION
Increased oxidative stress has been associated with a variety of diseases including cancer, Alzheimer’s disease, and other neurodegenerative diseases.
High levels of oxidative stress can also lead to cell death through several mechanisms including apoptosis and autophagy.
Understanding the relationship between oxidative stress and cell death is essential to our understanding of disease progression and the development of therapies to combat these diseases.
Live cell microscopy enables temporal resolution between cellular events such as increased oxidative stress and apoptosis signaling.
Multi-parametric imaging allows for several parameters to be analyzed simultaneously within the same cell providing key information at the cellular level.
CONCLUSIONS
In HeLa cells staurosporine induced an increase in oxidative stress followed by activation of caspase 3/7. Loss of mitochondrial membrane potential was also observed indicating cell death occurring by apoptosis.
In U-2 OS cells chloroquine induced a significant increase in autophagosomeformation with minimal change in caspase 3/7 activity.
By using fluorescent markers for oxidative stress, active caspase 3/7 and LC3B we were able to determine levels of oxidative stress relative to activation of caspase 3/7, and distinguish between cells which were apoptotic or autophagic.
This multi-parametric approach was also amenable to time-lapse imaging which enabled temporal resolution of oxidative stress relative to cell death mechanisms.
Simultaneous analysis of cell death mechanisms and oxidative strSimultaneous analysis of cell death mechanisms and oxidative stress using ess using live cell fluorescence microscopylive cell fluorescence microscopy
Life Technologies • 5791 Van Allen Way • Carlsbad, CA 92008 • www.lifetechnologies.com
RESULTS
Figure 3: Multiplex time-lapse imaging showed loss of mitochondrial membrane potential followed by caspase 3/7 activation
Figure 1: Validation of probes used for oxidative stress, apoptosis, and autophagy by fluorescence microscopyA. Apoptosis – CellEvent™ Caspase-3/7 Green Detection Reagent
Figure 1 C. HeLa cells were transduced with BacMam based - Premo™ Autophagy Sensor LC3B-GFP encoding either mutant (I) or wild-type (II); 24 hours post-transduction, cells were treated with 50 µM chloroquine and imaged 16 hours later. Cells expressing the non-cleavable mutant LC3B-GFP showed no difference in LC3B-GFP distribution after treatment with chloroquine or vehicle. In cells expressing wild type LC3B-GFP, chloroquine caused a pronounced labeling of autophagosomes. In subsequent experiments, LC3B-RFP was used.
C. Autophagy – Premo™ Autophagy Sensor LC3B-GFP
Vehicle 50 μM Chloroquine
B. Oxidative Stress – CellROX™ Deep Red ReagentControl Menadione Menadione + MnTBAP
050
100150200250300350400450
Mea
n si
gnal
inte
nsity
Control Control + MnTBAPMenadione Menadione + MnTBAP
Figure 2: Multiplex imaging of oxidative stress and activated caspase3/7
A.
Figure 3: HeLa cells were loaded with 50 nM TMRM followed by 5 µM CellEvent™ Caspase-3/7 Green Detection Reagent . Cells were then treated with 0.5 µM staurosporine and images were acquired every 5 minutes over 7 hours on a Molecular Devices ImageXpress® Micro (high content screening system) at 10x. Over the 7 hour time course, staurosporine induced a loss of mitochondrial membrane potential followed by activation of caspase 3/7 as evidenced by a decrease in TMRM signal (red) and an increase in caspase 3/7 signal (green), respectively.
Figure 4: Simultaneous detection of apoptosis and autophagy by fluorescence microscopy
Figure 1 A: HeLa cells were treated with 0.5 µM staurosporine in the presence of 0 – 30 µM of the Z-DEVD-FMK caspase inhibitor for 4 hours. Cells were then labeled with 5 µM CellEvent™ Caspase-3/7 Green Detection Reagent (green) for 30 minutes, followed by Hoechst 33342 (blue) for 15 minutes in complete media. Images were acquired and analyzed on a Thermo Fisher Cellomics ArrayScan® VTI. A decrease in the percent of cells positive for active caspase 3/7 was observed in cells incubated in the presence of the caspase inhibitor, indicating specificity of the probe for active caspase 3/7.
Vehicle 50 μM Chloroquine
Figure 1 B: Bovine pulmonary artery endothelial (BPAE) cells were plated in 96 well plates and treated with or without 100 µM menadione for 1hr. 100 µM of the superoxide scavenger, MnTBAP was added to a subset of the control and menadione-treated cells for the last 30 mins of incubation. The cells were then stained with 5 µM CellROX™ Deep Red Reagent and Hoechst 33342 for 30 minutes at 37oC, washed with PBS and analyzed on a Thermo Fisher Cellomics ArrayScan® VTI. MnTBAPtreatment inhibited ROS caused by menadioneconfirming that the signal was due to ROS induced by this compound.
B. Figure 2 B: High content imaging reveals details progression of oxidative stress and apoptosis: HeLa cells were treated with 0.5 µM staurosporine for 0 – 4 hours in the presence of 7.5 µM CellEvent™ Caspase-3/7 Green Detection Reagent . Cells were then stained with 5 µM CellROX™ Deep Red Reagent and Hoechst 33342 for 30 minutes at 37oC, then washed with warm DPBS. Images were acquired and analyzed on a Thermo Fisher Cellomics Arrayscan® VTI. Increased oxidative stress began ~ 2 hours after treatment (red bars), while caspase 3/7 activation was observed 3-4 hours after treatment (green bars) with staurosporine.
Figure 2 A: Traditional fluorescence imaging of oxidative stress and apoptosis: HeLa cells were treated with 0.5 µM staurosporine for 0, 2 or 4 hours in the presence of 7.5 µM CellEvent™Caspase-3/7 Green Detection Reagent . Cells were then stained with 5 µM CellROX™ Deep Red Reagent and Hoechst 33342 for 30 minutes at 37oC, then washed with warm DPBS. Cells were imaged immediately on a Zeiss Axiovert® inverted microscope using a 40x objective. Increased oxidative stress was observed at 2 hours after treatment (magenta) while caspase 3/7 activation was not observed until 4 hours after treatment (green) as shown in representative cells above.
A.
B. Figure 4 A-B, HeLa cells treated with staurosporine undergo apoptosis through activation of caspase3/7: HeLa cells were treated 0.5 µM staurosporine for 0 – 4 hours in the presence of 7.5 µM CellEvent™Caspase-3/7 Green Detection Reagent (green). Cells were then fixed, permeabilized and labeled with an anti-LC3B antibody (Life Technologies) and subsequently detected with a goat anti-rabbit AlexaFluor® 647 secondary antibody (red). Cells were then stained with Hoechst 33342 (blue). Images were analyzed on a Thermo Fisher Cellomics Arrayscan®
VTI. Images showed increased caspase 3/7 activation at 4 hours (A). Signal intensity for caspase 3/7 (nuclear) and LC3B (spots within the cytosol) were plotted as fold change relative to 0 hour treatment for each of the two parameters (B). Staurosporine significantly increased caspase 3/7 activation after 4 hours, which was associated with a small increase in autophagosome formation.
untreated 30 µM chloroquine
C.
0 30 60 100 0 30 60 100
0
2
4
6LC3BCaspase 3/7
Chloroquine (μM)
Fold
Cha
nge
(+/-
SEM
)
D.
Figure 4 C-D: U-2 OS cells treated with chloroquine undergo autophagy: In figure 4C, U-2 OS cells were transduced with Premo™ Autophagy Sensor LC3B-RFP (red). The next day, cells were treated with or without chloroquine for ~ 24 hours. Cells were then stained with the 7.5 µM CellEvent™ Caspase-3/7 Green Detection Reagent (green) for 30 minutes at room temperature, followed by Hoechst 33342 (blue). Images were acquired on a Zeiss Axiovert® inverted microscope using a 63x water objective. Cells treated with chloroquine showed increased punctate staining (red spots) indicating formation of LC3B positive autophagosomes. In figure 4D, U-2 OS cells were treated with 0 – 100 µM chloroquine for ~ 24 hours. Cells were then stained with 7.5 µM CellEvent™ Caspase-3/7 Green Detection Reagent for 30 minutes at room temperature. Cells were then fixed, permeabilized and labeled with an anti-LC3B antibody (Life Technologies), and subsequently detected with a goat anti-rabbit Alexa Fluor® 647 secondary antibody, followed by Hoechst 33342 stain. Cells were analyzed on a Thermo Fisher CellomicsArrayscan® VTI. Signal intensity for caspase 3/7 (nuclear) and LC3B (spots within the cytosol) were plotted as fold change relative to untreated cells. Chloroquine treatment increased signal intensity from autophagosomes, which was associated with a small increase in activated caspase3/7.
I.) LC3B-GFP mutant (G120A) II.) LC3B-GFP wild-type
0
0.25 0.5 1 2 3 4
0
5
10
15LC3BCaspase 3/7
0.5 μM staurosporine (hours)
Fold
Cha
nge
(+/-
SEM
)
0 hour 1.7 hours 2.8 hours
3.3 hours 4.0 hours 4.7 hours
5.3 hours 6.2 hours 7 hours
0
0.25 0.5 1 2 3 4
0
20
40
60
80
100
ROSCaspase 3/7
0.5 μM staurosporine (hours)
% P
ositi
ve C
ells
(+/-
SEM
)
Hoechst 33342 (cyan), LC3B (magenta), caspase 3/7 (green)For Research Use Only. Not intended for any animal or human therapeutic or diagnostic use. © 2011 Life Technologies Corporation. All rights reserved. The trademarks mentioned herein are the property of Life Technologies Corporation or their respective owners. ArrayScan is a trademark of Cellomics, Inc. ImageXpress is a trademark of Molecular Devices Inc. Axiovert is a trademark of Carl Zeiss AG.
0 5 10 20 30
0
10
20
30
40
Z-DEVD-FMK (μM)
% P
ositi
ve C
ells
(+/-
SEM
)no inhibitor 20 µM inhibitor
untreated 2 hour staurosporine 4 hour staurosporine
0 hours staurosporine 2 hours staurosporine 4 hours staurosporine