Embed Size (px)
Citation preview
Master Thesis
Simulator of Pulsed InterferenceEnvironment of an Airborne GNSS Receiver
Yin, Ting
Munich, January 2007
Examiner :Prof. Mats Viberg
Supervisor:Dipl.-Ing. Christian Weber
Master Thesis inDepartment of Signals and SystemsChalmers University of Technology (CTH), Goteborg, Sweden
Titel : Simulator of Pulsed Interference Environment of an Airborne GNSS Re-ceiverAutor : Yin, Ting
Yin, TingE-mail: [email protected]

Abstract
The US Global Positioning System (GPS) and the future European Galileo system aresatellite-based navigation systems which commonly named as Global Navigation SatelliteSystem (GNSS). GPS system broadcasts civil L5 signal within the 960-1215 MHz fre-quency band already used worldwide for Aeronautical Radio Navigation Services (ARNS)such as Distance Measuring Equipment (DME) and Tactical Air Navigation (TACAN).Galileo system will broadcast two civil signals E5a and E5b. E5a will be broadcast in thesame ARNS band as GPS L5, and E5b will be broadcast in another ARNS band. The civilaviation community is looking forward to GPS L5 and Galileo E5a/E5b signals, for theyare expected to improve accuracy, integrity, continuity and availability of the future GNSS.
Interfering environment of the 960-1215 MHz ARNS band is very heavy and will affectGalileo E5 and GPS L5 signals. One of the main threats comes from DME/TACAN sys-tem, which is one of the main Radio Frequency Interference (RFI) contributors within theGalileo E5 and GPS L5 bands. This pulsed interference caused by DME/TACAN groundbased beacon signals is powerful, especially at high altitude. The main objective of thisthesis is to simulate the pulsed DME/TACAN interference environment of an airborneGNSS receiver and assess the interference impact on the performance of GNSS receiver.
GNSS receiver performance functions, such as signal acquisition and tracking, dependon the signal to noise density ratio at the correlator output. Hence, on one hand we es-timate the carrier to noise density ratio (C/N0) degradation at the correlator output dueto DME/TACAN only at a maximal en-route flight altitude of 40,000 feet. A worst caseapproach is chosen in the simulation. It implies the useful GNSS signals are assumed re-ceived at their minimum powers while interference are deemed received at their maximumlevels. On the other hand, we determined the C/N0 thresholds of acquisition and trackingof GNSS receiver by simulating DME/TACAN interference environment at different dutycycles.
The C/N0 degradations at the correlator output for Galileo E5 and GPS L5 signals wereestimated using the algorithm represented in [11]. Pulse blanker is considered in the GNSSreceiver structure as a way to cope with strong pulsed interference. We will show thatthe blanker duty cycle and the degradation caused by DME/TACAN beacon signals arelarger at a higher flight height. And DME/TACAN signals with large duty cycle wouldcause GNSS receiver losing track and acquisition failure.
KEYWORDS: Galileo E5a/E5b, GPS L5, GNSS receiver, DME/TACAN, C/N0,eff degra-dation, pulse blanker, acquisition threshold, tracking threshold

Acknowledgement
I would like to express my sincere gratitude to my supervisor Mr. Christian Weber forhis time, efforts and great patience during my thesis work. I would also like to thankProf. Mats Viberg for his support and help.
Then I would like to thank all the colleagues at DLR for having been always ready tohelp me, my friends and family for supporting me throughout the work.
Contents
1 Introduction 11.1 Motivation . . . . . . . . . . . . . . . . . . . . . . . . . . . . . . . . . . . . 11.2 Background . . . . . . . . . . . . . . . . . . . . . . . . . . . . . . . . . . . . 11.3 Organization . . . . . . . . . . . . . . . . . . . . . . . . . . . . . . . . . . . 2
2 Future GNSS Signal and Receiver Structure 32.1 Future GNSS signals . . . . . . . . . . . . . . . . . . . . . . . . . . . . . . . 3
2.1.1 GPS L5 Signal . . . . . . . . . . . . . . . . . . . . . . . . . . . . . . 32.1.2 Galileo Signals . . . . . . . . . . . . . . . . . . . . . . . . . . . . . . 4
2.2 GNSS Receiver Structure . . . . . . . . . . . . . . . . . . . . . . . . . . . . 62.2.1 Antenna . . . . . . . . . . . . . . . . . . . . . . . . . . . . . . . . . . 72.2.2 Preamplifier . . . . . . . . . . . . . . . . . . . . . . . . . . . . . . . . 72.2.3 Front-end . . . . . . . . . . . . . . . . . . . . . . . . . . . . . . . . . 72.2.4 ADC/AGC . . . . . . . . . . . . . . . . . . . . . . . . . . . . . . . . 72.2.5 Hardware and Software Signal Processing . . . . . . . . . . . . . . . 72.2.6 Navigation Processing . . . . . . . . . . . . . . . . . . . . . . . . . . 8
3 DME/TACAN Interference Environment for An Airborne Galileo E5a/E5b Re-ceiver 93.1 Interference in Galileo E5 and GPS L5 Band . . . . . . . . . . . . . . . . . 93.2 DME/TACAN System . . . . . . . . . . . . . . . . . . . . . . . . . . . . . . 10
3.2.1 DME/TACAN System Introduction . . . . . . . . . . . . . . . . . . 103.2.2 DME/TACAN Interrogator . . . . . . . . . . . . . . . . . . . . . . . 113.2.3 DME/TACAN Beacon . . . . . . . . . . . . . . . . . . . . . . . . . . 113.2.4 DME/TACAN signals . . . . . . . . . . . . . . . . . . . . . . . . . . 12
3.3 DME/TACAN Signal Contribution to Noise Floor . . . . . . . . . . . . . . 153.3.1 Effective Carrier-to-noise Density Calculation due to RFI . . . . . . 153.3.2 Effective Carrier-to-noise Density Calculation due to DME/TACAN
signals . . . . . . . . . . . . . . . . . . . . . . . . . . . . . . . . . . . 16
4 DME/TACAN Pulsed Interference Environments Simulation 224.1 ”Hot-spot” Mode . . . . . . . . . . . . . . . . . . . . . . . . . . . . . . . . . 22
4.1.1 Simulation Assumptions for ”Hot-spot” Mode . . . . . . . . . . . . . 234.1.2 Simulation Result of ”Hot-spot” Mode . . . . . . . . . . . . . . . . . 25
4.2 ”Duty Cycle” Mode . . . . . . . . . . . . . . . . . . . . . . . . . . . . . . . 294.2.1 Simulation Assumptions for ”Duty Cycle” Mode . . . . . . . . . . . 30
i

Contents
4.2.2 Simulation Result of ”Duty Cycle” Simulation Mode . . . . . . . . . 32
5 GNSS Software Receiver Performance Testing Under DME/TACAN Pulsed In-terference Environment 355.1 Pulse Blanker Influence on the GNSS Software Receiver Under DME/TACAN
Interference Environment . . . . . . . . . . . . . . . . . . . . . . . . . . . . 355.2 DME/TACAN Signal Power Level Influence on GNSS Software Receiver
Performance . . . . . . . . . . . . . . . . . . . . . . . . . . . . . . . . . . . . 38
6 Discussion of the Simulation Results 406.1 Comparison Between the MATLAB Simulation Results and the Theoretical
Calculations . . . . . . . . . . . . . . . . . . . . . . . . . . . . . . . . . . . . 406.2 Comparison Between the MATLAB Simulation Results and [1] . . . . . . . 41
7 Summary 43
A MATLAB Program 46A.1 ”Hot-spot” Mode Simulation Steps . . . . . . . . . . . . . . . . . . . . . . . 46A.2 ”Duty cycle” Mode Simulation Steps . . . . . . . . . . . . . . . . . . . . . . 46A.3 Functions Instructions . . . . . . . . . . . . . . . . . . . . . . . . . . . . . . 47
B Agilent E8267D PSG Signal Generator 51
Bibliography 53
ii

List of Figures
2.1 Galileo Frequency . . . . . . . . . . . . . . . . . . . . . . . . . . . . . . . . . 52.2 Classical GNSS signal-frequency receiver block diagram . . . . . . . . . . . 6
3.1 Standard DME/TACAN Channel Plan . . . . . . . . . . . . . . . . . . . . . 113.2 Normalized DME/TACAN pulse pair . . . . . . . . . . . . . . . . . . . . . . 133.3 Typical DME/TACAN signal and its power spectrum . . . . . . . . . . . . 143.4 Typical DME/TACAN (left) and GNSS receiver (right) normalized antenna
gain vs elevation angle . . . . . . . . . . . . . . . . . . . . . . . . . . . . . . 153.5 Example of composite DME/TACAN signals environment . . . . . . . . . . 18
4.1 ”Hot-spot” Simulation Mode System Structure . . . . . . . . . . . . . . . . 234.2 Simulated front-end filter of E5a/L5 (left) and E5b (right) receivers . . . . 254.3 E5a/L5 C/N0 degradation due to DME/TACAN beacons over the Europe
Hot-spot at 10 kft (left) and 40 kft (right) . . . . . . . . . . . . . . . . . . . 264.4 E5a/L5 C/N0,eff degradation due to DME/TACAN beacons over the Eu-
rope Hot-spot at 10 kft (left) and 40 kft (right) when applying the simulatedfront-end filter . . . . . . . . . . . . . . . . . . . . . . . . . . . . . . . . . . 27
4.5 E5b C/N0,eff degradations due to DME/TACAN beacons over the EuropeHot-spot at 10 kft (left) and 40 kft (right) . . . . . . . . . . . . . . . . . . . 27
4.6 E5b C/N0,eff degradation due to DME/TACAN beacons over Europe Hot-spot at 10 kft (left) and 40 kft (right) when applying simulated front-endfilter . . . . . . . . . . . . . . . . . . . . . . . . . . . . . . . . . . . . . . . . 29
4.7 ”Duty Cycle” Simulation Mode System Structure . . . . . . . . . . . . . . . 304.8 DME/TACAN signal individual duty cycle assignment algorithm . . . . . . 324.9 E5a C/N0 degradation caused by DME/TACAN signal only when given
DME/TACAN duty cycles are 15% (left) and 25% (right), when input powerlevel is [-120 100] dBW. . . . . . . . . . . . . . . . . . . . . . . . . . . . . . 33
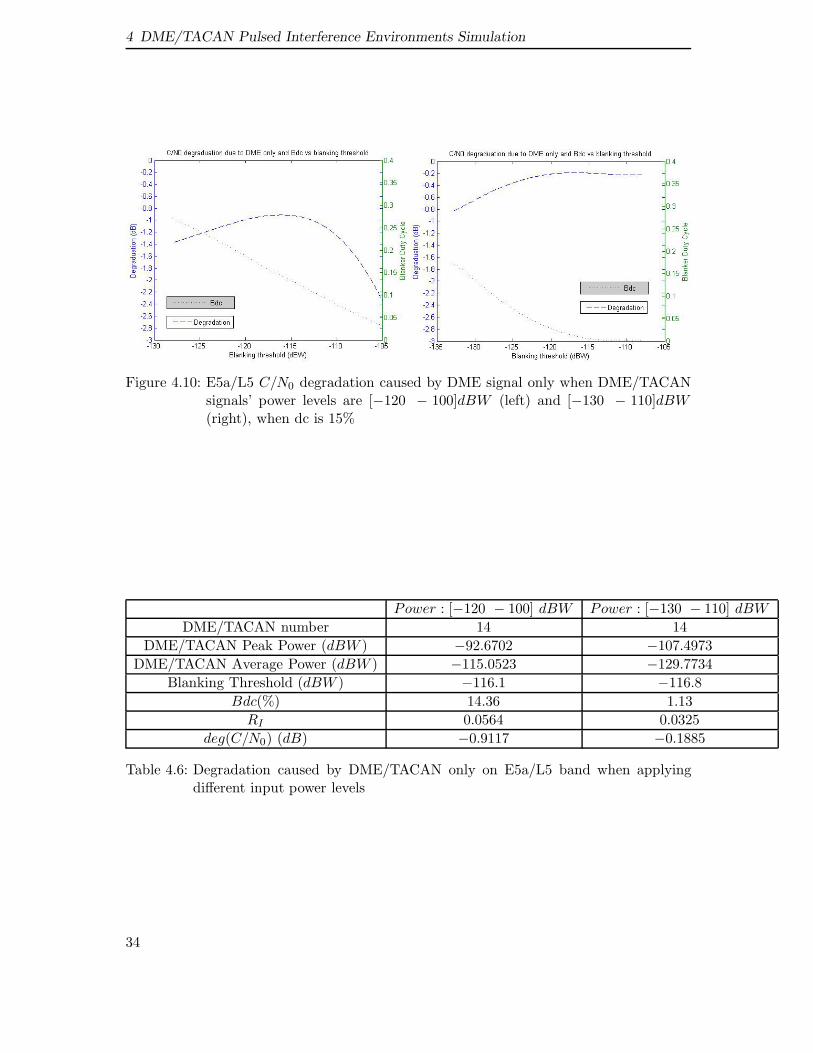
4.10 E5a/L5 C/N0 degradation caused by DME signal only when DME/TACANsignals’ power levels are [−120 − 100]dBW (left) and [−130 − 110]dBW(right), when dc is 15% . . . . . . . . . . . . . . . . . . . . . . . . . . . . . 34
5.1 Acquisition threshold testing, when the receiver is with and without pulseblanker (DME/TACAN power level is [70 90] dBHz) . . . . . . . . . . . . . 37
5.2 Tracking threshold testing, when the receiver is with and without pulseblanker (DME/TACAN power level is [70 90] dBHz) . . . . . . . . . . . . . 37
5.3 DME/TACAN power levels’ influence on software receiver performance(dc=3%) . . . . . . . . . . . . . . . . . . . . . . . . . . . . . . . . . . . . . . 38
iii

List of Figures
A.1 ”Hot-spot” mode program structure . . . . . . . . . . . . . . . . . . . . . . 47A.2 ”Duty cycle” mode program structure . . . . . . . . . . . . . . . . . . . . . 48
B.1 Baseband DME/TACAN pulses generated by signal generator Agilent E8267D 51B.2 Modulated DME/TACAN pulse pair generated by signal generator Agi-
lent E8267D . . . . . . . . . . . . . . . . . . . . . . . . . . . . . . . . . . . . 52B.3 Hardware simulation system structure . . . . . . . . . . . . . . . . . . . . . 52
iv

List of Tables
3.1 DME/TACAN pulse RFI parameters and the C/N0,eff degradation calcu-lation at 50◦N 9◦E . . . . . . . . . . . . . . . . . . . . . . . . . . . . . . . . 21
3.2 Duty cycle and peak power level influence on the DME/TACAN pulse RFIparameters and the C/N0,eff degradation calculation . . . . . . . . . . . . . 21
4.1 E5a band simulation result due to DME/TACAN beacons over the EuropeHot-spot . . . . . . . . . . . . . . . . . . . . . . . . . . . . . . . . . . . . . . 26
4.2 E5a/L5 band simulation result due to DME/TACAN beacons over the Eu-rope Hot-spot when applying the simulated front-end filter . . . . . . . . . 26
4.3 E5b band simulation result due to DME/TACAN beacons over the EuropeHot-spot . . . . . . . . . . . . . . . . . . . . . . . . . . . . . . . . . . . . . . 28
4.4 E5b band simulation result due to DME/TACAN beacons over the EuropeHot-spot when applying the simulated front-end filter . . . . . . . . . . . . 29
4.5 Degradation caused by DME/TACAN only when applying different inputduty cycles . . . . . . . . . . . . . . . . . . . . . . . . . . . . . . . . . . . . 33
4.6 Degradation caused by DME/TACAN only on E5a/L5 band when applyingdifferent input power levels . . . . . . . . . . . . . . . . . . . . . . . . . . . 34
5.1 Software Receiver Configurations . . . . . . . . . . . . . . . . . . . . . . . . 365.2 Pulse blanker influence on acquisition and tracking thresholds (DME/TACAN
power level is [70 90] dBHz) . . . . . . . . . . . . . . . . . . . . . . . . . . . 38
6.1 Comparison between the MATLAB simulation results and the theoreticalcalculations in E5a/L5 band . . . . . . . . . . . . . . . . . . . . . . . . . . . 40
6.2 Comparison between values of [1] and MATLAB simulation results, E5a/L5band . . . . . . . . . . . . . . . . . . . . . . . . . . . . . . . . . . . . . . . . 41
v


1 Introduction
1.1 Motivation
Positioning and timing services provided by Global Navigation Satellite System (GNSS)have already given rise for various applications almost in all fields of our daily life. Safety-of-life GNSS applications with extremely high accuracy and reliability requirements arethe significant performance improvements which are planed to be achieved by the comingEuropean GNSS Galileo and the future modernized GPS.
One of the GNSS safety-of-life applications is the aircraft navigation during all flightphases including precise landing approaches. In order to provide spectrum protection ofthe GNSS signals used for safety-of-life applications, these signals are allocated within thefrequency band of Aeronautical Radio Navigation Service (ARNS), 960-1215 MHz. Thisfrequency band is also explored by Distance Measuring Equipment (DME) and TacticalAir Navigation (TACAN) systems, which are pulsed ranging systems being used currentlyas one of the primary means for aircraft navigation. Therefore, the safety-of-life GNSSaviation receiver has to cope with strong pulsed in-band radio interference caused by an air-borne and a number of ground DME/TACAN beacons. This pulsed interference becomesstronger with the flight height of the airplane since more signals of ground DME/TACANbeacons can be observed simultaneously.
The objective of this master thesis is to develop a software DME/TACAN signal sim-ulator that can be used for testing the GNSS receiver performance under realistic pulsedDME/TACAN interference conditions.
1.2 Background
A great many of studies have been carried out on the impact of DME/TACAN pulses onthe performance of the future GNSS receiver both in Europe and the U.S.. The U.S. RTCAdevelops minimum standards that form the basis for the Federal Aviation Administration(FAA) approval of equipment for using GPS as a primary means of civil aircraft naviga-tion. The European Organization for Civil Aviation Equipment (EUROCAE) which is incharge of Galileo standardization for civil aviation in Europe, is studying the degradationsand computing results over Europe where the DME/TACAN ground beacons density isvery high at certain locations.
Radio Frequency Interference (RFI) sources in Galileo E5 and GPS L5 bands are listedin detail in [11]. Also [11] represents a theoretical algorithm for calculating the effective
1

1 Introduction
carrier to noise degradation due to RFI and pulse blanking. The algorithm for the degra-dation calculation caused by DME/TACAN only used in this master thesis is derived from[11].(Chap. 3.3.2)
In [1], it estimates the DME/TACAN impact on the future GNSS receivers by both simu-lation tool PULSAR and theoretical calculation. The derived degradations are comparedwith our simulation results at the end of this thesis.
Information of the DME/TACAN ground based beacons inside Europe is shown in [8].Longitude, latitude, transmitting channel and height of the DME/TACAN beacons arelisted in detail. And channel frequencies for DME/TACAN system are shown in [4].
1.3 Organization
The assessment of the impact of DME/TACAN signal on the future Galileo E5a/E5b andGPS L5 receivers constitutes the heart of this thesis. The structure of this thesis is asfollows.
First of all, the future GNSS signals (Galileo E5 and GPS L5) are introduced in Chap. 2as well as the receiver structure without going into details.
Chap. 3 presents the structure of DME/TACAN system and the impact of DME/TACANinterference signal on Galileo E5a/GPS L5 and E5b signals. The impact is assessed throughthe computation of the signal to noise density ratio at the correlator output. The algo-rithm for the degradation calculation is presented at the end of this chapter.
DME/TACAN pulsed interference environment of an airborne GNSS receiver at high al-titude is simulated by MATLAB for both Galileo E5a/GPS L5 and E5b in Chap. 4. Twokinds of simulation modes are assumed in the simulation. One is ”hot-spot” mode, whichmodels the interference environment at the GNSS antenna port of an aircraft flying at highaltitude over European hot-spot. Two kinds of front-end filters are used in the simulationand the simulation results are presented in Chap. 4.1.2.1 and Chap. 4.1.2.2. The othermode is ”Duty Cycle Mode”, which models the interference environment with differentDME/TACAN duty cycles, regardless of DME/TACAN beacon information. SimulatedC/N0 degradations of this mode are shown in Chap. 4.2.2.1.
The next chapter, Chapter 5, we test the performance of the GNSS software receiverunder the DME/TACAN pulsed interference environment. We determine the acquisitionand tracking thresholds by changing DME/TACAN signal’s duty cycle. In this chapter,we also show the influences of pulse blanker and DME/TACAN power level on the softwarereceiver’s performance.
Simulation results are analyzed in Chapter 6 and a summary is given in Chapter 7. Someimproving suggestions are listed for future works.
2

2 Future GNSS Signal and ReceiverStructure
The future GNSS signals (GPS L5 and Galileo E5a/E5b) are proposed for use as civilianSafety-of-Life (SoL) signals. They will be available worldwide to civil users and transmit-ted in the ARNS band. They will provide open service, commercial service, safety-of-lifeservice, public regulated service and support to search-and-rescue service. An introductionof the future GNSS signals is given at the beginning of this chapter. In our simulation, weassume that the receiver structure of Galileo E5 is the same as GPS L5, which is presentedat the end of this chapter.
2.1 Future GNSS signals
Both Galileo and GPS systems are satellite based navigation systems. The operating prin-ciple is simple: the satellites in the constellation are fitted with an atomic clock measuringtime very accurately.The satellites emit personalized signals indicating the precise timethat the signal leaves the satellite.The ground receiver, incorporated for example into amobile phone, has in its memory the precise details of the orbits of all the satellites inthe constellation. By reading the incoming signal, it can thus recognize the particularsatellite, determine the time taken by the signal to arrive and calculate the distance fromthe satellite. Once the ground receiver receives the signals from at least four satellitessimultaneously, it can calculate the exact position.
2.1.1 GPS L5 Signal
The GPS L5 signal is part and parcel of the GPS modernization program consisting tothe introduction of two new civil signals (L5 and L2) after the original GPS L1 signal.As far as the civil aviation community is concerned, the main requirements for this signalare to provide a completely redundant signal to the L1 signal to improve signal diversityand, as a consequence, robustness in case of interference. Moreover, the capability forthe users to perform dual frequency measurements and so apply a precise ionosphericdelay correction is a key request so as to improve accuracy and availability of operationssuch as precision approaches. The use of a C/A code, as employed on GPS L1, wouldsatisfy those requirements however the promoters of the GPS L5 signal have felt newcharacteristics should be proposed to improve global performance and level of service.Among the new features are an increased code rate (ten times faster than C/A code,10.23 Mcps) to improve, for instance, resistance to multipaths and accuracy in noise. Thetransmitted signal is a QPSK modulation where there is a data-free carrier componentcalled the Pilot component that allows carrier phase tracking at lower signal-to-noise
3
2 Future GNSS Signal and Receiver Structure
ratio. The GPS L5 signal consists of QPSK modulation, although it is still based on theCDMA principle to distinguish the transmitting satellite vehicles. The transmitted signalis right-hand circularly polarized and each carrier is modulated by a specific bit train.The inphase train is generated by the modulo-2 addition of a pseudo-random noise (PRN)ranging code, a synchronization sequence, called the Neuman-Hoffman (NH) code and thenavigation data message. The Quadraphase (or Pilot) train does not carry any navigationdata and so is simply the modulo-2 sum of a different PRN code and a different NHsynchronization sequence. The role of the NH synchronization sequence is first to improvethe bit synchronization performance that is one of the weaker functions in the signalacquisition process and then to improve robustness to interference.
2.1.2 Galileo Signals
Galileo will provide 10 navigation signals in the frequency ranges 1164-1215MHz (E5aand E5b), 1260-1300MHz (E6) and 1559-1592 MHz (E2-L1-E1). E2-L1-E1 and E5a arecommon to GPS frequency bands for interoperability. All the Galileo satellites will sharethe same nominal frequency, making use of Code Division Multiple Access (CDMA) com-patible with the GPS approach. Fig. 2.1 indicates the type of modulation, the chip rateand the data rate for each signal. [7]
From Fig. 2.1, we can see that Galileo offers four types of data (service), which are carriedby the different radionavigation signals:
1. Open Services (OS): Mass-Market applications not requiring any guarantee. It is asaccurate as conventional differential GPS but without requiring additional groundinfrastructure.
2. Commercial Services (CS): it provides professional use and guaranteed service inreturn of a fee as well as system capabilities introduced to foster application withcommercial interest.
3. Safety-of-life Services (SoL): it provides guaranteed service for Safety-of-life applica-tions and integrity alerts.
4. Public Regulated Service (PRS): it would be used by police, coast guards, customs,strategic civil infrastructure and so on. It also provides high continuity of service.Signals are more robust to interference. It provides access to the service to govern-ment authorized-users only.
5. Search and Rescue Service (SAR): Relay of distress alarms to improve existing reliefand rescue services. It is compatible with COSPAS-SARSAT.
The Galileo E5a frequency is exactly the same as GPS L5 (1176.45 MHz) and Galileo E5bfrequency is 1207.14 MHz. Each signal has to carry two different spreading codes in phasequadrature with each other. In total four different ranging signals have to be transmittedin two separate frequency bands. Two proposed schemes were:
4

2.1 Future GNSS signals
• Two BPSK signals generated coherently and transmitted on two separate channels:E5a and E5b. In this case, each signal is generated at the baseband, amplifiedseparately and combined at RF before transmission by the satellite antenna. Thedisadvantage of that approach is that phase coherency may be difficult to keep inthe RF circuitry.
• A single-carrier wideband signal following a modified Binary Offset Carrier (BOC)modulation with a subcarrier frequency of 15.345 MHz and a code rate of 10.23 Mcps.The central frequency of this signal is equally spaced between E5a and E5b and soequates 1191.8 MHz. The modified structure enables transmission of a signal havinga constant envelope so as to avoid non-linear behavior of amplifiers on the satelliteside. Because of a wider bandwidth, this signal is expected to increase positioningaccuracy and resistance to multipaths. However one possible drawback is that moreinterfering signals will be allowed to enter to receiver since its bandwidth will belarger if the whole wideband signal is intended to be processed. Because there are alarge number of DME/TACAN ground beacons transmitting in this band, especially
Figure 2.1: Galileo Frequency
5

2 Future GNSS Signal and Receiver Structure
for an aircraft flying at high altitude. However separated processing of either GalileoE5a or Galileo E5b will reduce the interference impact, but care must be taken inthe receiver design so that the phase coherency of the generated signal is not lost inRF section of the receiver.
2.2 GNSS Receiver Structure
The received GNSS signal is woefully ill-suited for computer processing. First, the signalpower must be increased by approximately ten orders of magnitude in power. Second,natural noise and man-made RFI must be removed to the possible extent. Third, the re-ceived carrier frequency is 1.5 billion cycles per second and most computers would have adifficult time coping with such a rapid variation. Finally, we must convert from an analogsignal to a digital signal. Processing above is called signal conditioning.[10]
After conditioning, we must estimate the arrival time, τ , and the the Doppler shift, fD.If we desire the ultimate in precision, the carrier phase, θ, must also be tracked. Theestimation of our key triplet, τ, fD, θ, proceeds in two stages. The first stage is a globalsearch for approximate values of τ, fD. This process is known as signal acquisition. Thesecond stage is a local search for accurate estimate of τ, fD that may include estimationof the carrier phase, θ. This process is called signal tracking because it is continuous andthe estimates are updated as the receiver and satellites move. The signal acquisition andtracking processes suffer from interference if strong competing signals are present or thesatellite signals are blocked. DME/TACAN signal falls in the GPS L5 and Galileo E5 ra-dio spectrum, if DME/TACAN signal is much stronger, then the GNSS signal acquisitionand tracking situation can quickly become bleak.
Assume the receiver for Galileo E5 signal has the same architecture with GPS L5 sig-nal. The receiver scheme is shown in Fig. 2.2.[2]
Figure 2.2: Classical GNSS signal-frequency receiver block diagram
6
2.2 GNSS Receiver Structure
2.2.1 Antenna
The gain pattern of receiver antenna should be a high and relatively constant gain forsatellites above a given elevation. The gain at negative elevations should be low to reducethe impact of multipath of interference.
2.2.2 Preamplifier
Preamplifier provides burnout protection and unwanted interference filtering. It also com-posed of a LNA whose characteristics are set to achieve a desired system-level noise figure.
2.2.3 Front-end
Incoming signal down conversion from RF to IF is achieved by mixing the incoming ampli-fied signal with local oscillator (LO). The filtering requirements of the applied successivefilters are more stringent while limiting insertion loss. A mixer is followed by a bandpassfilter to suppress the unwanted sideband, LO feed-through and harmonics.
2.2.4 ADC/AGC
AGC and a digital blanker are implemented within the ADC. The AGC is a variable gainamplifier which would adapt its gain to reduce quantization losses. Given the front-endfilter bandwidth and the number of bits, there is an optimal gain. Depending on ADCbins distribution, AGC system can be analog or digital.
In our simulation, the AGC/ADC processes are not considered.
2.2.4.1 Digital Pulse Blanker
Pulse blanking is a technique that suppresses pulsed interference by having the ADC out-put zeros when a pulse is detected. For the received Galileo signals are buried below thethermal noise, detection of DME/TACAN strong pulses would be relatively simple.
Digital blanker can reduce the influence of DME/TACAN pulsed signals. Each individualquantized sample whose power is above the blanking threshold is zeroed. The blankingthreshold is chosen as a compromise between the ability to detect pulses and SNR degra-dation in the absence of pulses. The blanker is also characterized by blanking duty cyclewhich is the percentage of time where the blanker is active so when the signal is set tozero. Blanking threshold and blanking duty cycle are important for final degradation ofpost-correlation carrier-to-noise density ratio(C/N0,eff ).
2.2.5 Hardware and Software Signal Processing
The output signal from ADC is split into I and Q channels after mixing with two localcarriers generated by carrier NCO. Then each channel is mixed with the Prompt, Early andLate local code replica of the Data (XI) and Pilot (XQ) components. The resulting signalsare integrated over 1 ms and then dumped.The Neuman-Hoffman codes are removed by
7

2 Future GNSS Signal and Receiver Structure
multiplying the 1 ms-Data and 1 ms-Pilot samples by the adequate NH code. Then theoutputs are used by the code and carrier tracking loops to form discriminator functionsthat are then filtered by the loop filter. The filtered signals finally constitute the controlvalues of the tracking processes.
2.2.6 Navigation Processing
The output data from Signal Processing unit will be computed and used for different ap-plications.
In our MATLAB simulation, we assume only antenna, equivalent RF/IF front-end filter,digital pulse blanker and correlator are implemented in the GNSS receiver, when access-ing the C/N0,eff degradations caused by the simulated DME/TACAN environments. ForGNSS receiver acquisition and tracking thresholds determination, we use the software GPSreceiver (available at DLR), which also includes ADC/AGC.
8

3 DME/TACAN Interference Environmentfor An Airborne Galileo E5a/E5b Receiver
The interfering environment of the 960-1215 MHz ARNS band is heavy and will affect thefuture Galileo E5 signals. The interference sources are more numerous and more powerful,especially at high altitude. Only the impact of the DME/TACAN ground beacon signal issimulated since it is one of the main RFI contributors at high altitude within the GalileoE5 and GPS L5 bands.
At the beginning of this chapter, interference in Galileo E5a and E5b bands is presented.Then it is followed by an introduction of the DME/TACAN system. At last, the impactof the DME/TACAN interference on GNSS receivers is evaluated through the theoreticalanalysis of the degradation of post-correlation carrier-to-noise density ratio C/N0,eff .
3.1 Interference in Galileo E5 and GPS L5 Band
For civil aviation community, the Galileo E5a, E5b signals and GPS L5 signal are of greatinterest. They will be broadcast in the ARNS band and are expected to increase accuracyand availability of service. The Galileo E5a frequency is exactly the same as GPS L5which is 1176.45 MHz, and Galileo E5b frequency is 1207.14 MHz. E5a and E5b signalsare in the frequency ranges of 1164-1215 MHz.
Radio frequency interference (RFI) refers to man-made signals other than GNSS thatexists in the GNSS portion of radio spectrum. The potential sources of RFI to the GalileoE5 and GPS L5 signals are vastly more complicated. Galileo E5 and GPS L5 signals mustcontend with RFI signals. If RFI is weak compared to the received natural noise, thenit can be neglected. If the received RFI is strong, then its impact depends on whetherit is pulsed or continuous in time. Pulsed interference is sometimes very well toleratedby properly designed GNSS receivers. This type of RFI is roughly categorized by thepulse duration and duty cycle. Pulse duration is the time width of an individual pulse ofRFI. Duty cycle is the percentage of time that the interfering pulses are on. Very strongpulsed signals can cause problems even during their ”off” state, since active componentsin GNSS receiver may require ”recovery” time after a pulse to resume normal operation.All electronic amplifiers saturate when the input signal reaches some level. In-band pulseswill typically saturate the last gain stage first. Interference sources at frequencies offsetfrom the center of the receiver passband require progressively larger amplitudes to sat-urate the receiver front-end as that frequency offset increases. Strong pulses will alsosaturate the analog-to-digital (A/D) converter (ADC) in GNSS receiver. When ADC isbeing saturated by a pulse, the desired signal is completely suppressed. Weaker pulses
9

3 DME/TACAN Interference Environment for An Airborne Galileo E5a/E5b Receiver
may be viewed as adding to the receiver’s noise floor[3].Continuous interference is gener-ally more troublesome than pulsed RFI. It includes wideband RFI, narrowband RFI, andtone interference.[10]
The report [11] lists in great details all the potential sources of RFI to the GPS L5signal and consequently to the Galileo E5a signals since they share the same frequencyband. The Galileo E5b signal is allocated to the same ARNS band, the associated RFIenvironment may be easily inferred.
DME/TACAN systems constitute one of the main threats for an aircraft flying at highaltitude. DME and TACAN systems are pulse-ranging navigation systems that operate inthe 960-1215 MHz ARNS frequency band. DME system provides distance measurementsfrom an aircraft to a ground beacon. TACAN is a military navigation system, providesboth azimuth and distance information. Interference due to DME/TACAN ground-basedsources increases with the altitude since more interfering signals are received. When thevictim aircraft flying over 50◦N 9◦E, 180 DME/TACAN ground beacons are in aircraftinsight region at flight height of 40 kft, compared to 48 beacons at 10 kft. According tothe database [8], in E5a-band with a bandwidth of 20 MHz, there are 23 DME/TACANground beacons in-range of an aircraft flying at 40 kft and at a lower flight altitude of10 kft, there are only 7 DME ground beacons.
3.2 DME/TACAN System
3.2.1 DME/TACAN System Introduction
The Distance Measuring Equipment system is a pulsed ranging system which providesrange measurements from an aircraft to a ground beacon. This system is internationallystandardized and operates in the 960-1215MHz ARNS frequency band. The Tactical AirNavigation (TACAN) system was designed primarily as a military system providing bothrange measurement and azimuth measurements. The ranging function of this system isidentical to that of DME and the azimuth information is retrieved thanks to a rotatingantenna at 900 revolutions per minute. Both two systems are composed of an aircraftinterrogator and a ground beacon. The DME/TACAN interrogator obtains a distancemeasurement by transmitting pulse pairs and waiting for reply pulse pairs from the bea-con.
The aircraft interrogator transmits a signal composed of pulse pairs from an omnidirec-tional antenna. The beacon replies after a predetermined delay from the time of receipt ofthe interrogation. After the interrogator received replies from the beacon, it automaticallycompares the elapsed time between transmission and reception. Based on the propaga-tion delay, the aircraft interrogator equipment calculates the distance from the beacontransponder to its current location.
DME/TACAN operates on four modes (X,Y,W and Z), and only the X-mode repliesin the 1151-1213 MHz frequency band that overlaps the GNSS E5a/L5 and E5b bands
10

3.2 DME/TACAN System
(1164-1215 MHz). The standard DME/TACAN channel plan is shown in Fig. 3.1. [11]
Figure 3.1: Standard DME/TACAN Channel Plan
3.2.2 DME/TACAN Interrogator
The DME/TACAN aircraft interrogator transmits pulse pairs on one of the 126 frequen-cies, each is spaced 1 MHz in the 1025 to 1150 MHz band. The pulse-repetition rate ofthe interrogators is deliberately made somehow unstable, and the interrogator is designedto recognize only those replies whose pulse-repetition rate and phase are exactly the sameas their own. The transmitted pulse pairs follow a unique pattern thanks to random vari-ations of the time interval between pairs. This phenomenon is called jitter and enablesthe aircraft to identify replies to its own answer. The round trip time is usually muchless than the interval between transmitted pulse pairs; hence the interrogator will receivea response before it sends out the next pulse pair.
In the search mode, the DME/TACAN interrogator usually conducted at the highestpermissible pulse repetition rate (40-150 pulse-pairs per second) in order to save time.Once locating the time slot in which the desired beacon replies are actually occurring,the track mode commences and it conducts at a much lower pulse-repetition rate, usuallybetween 10 and 30 pulse-pairs per second. In the track mode, the gate is usually arrangedto have some memory so that it does not immediately go into search upon loss of signal.
3.2.3 DME/TACAN Beacon
A DME/TACAN ground beacon serves all aircraft within a designated radius of coverage(typically between 100 and 300 nautical miles). It transmits a pulse pair reply to every
11

3 DME/TACAN Interference Environment for An Airborne Galileo E5a/E5b Receiver
received pulse pair from aircraft within range after a fixed delay of 50 μs (mode X) or 56μs (mode Y).The frequency of transmission is 63 MHz above or below the interrogationfrequency. The duty cycle of the ground transmitter is much larger than that of the in-terrogator, and the average power consumption is also greater. The peak power of DMEbeacon is in the range of 1 to 20 kw. Ground receiver AGC is continuously adjusted tomaintain the pulse pair reply transmission rate constant, at approximately 700 to 2700pulse pairs per second. DME/TACAN ground beacon must always transmit a minimumnumber of pulses otherwise aircraft interrogators would never send and interrogate evenwhen in the beacon range. If there are enough aircrafts interrogating the beacon, thenthere is no issue since the beacon would transmit enough pulse pairs further detected byan airborne DME/TACAN interrogator entering the radius of coverage. In the case whereno interrogations are received, the ground beacon is designed to transmit pulsed pairscalled squitter to distinguish them from replies. Thus a ground beacon is specified totransmit at least 700 pulse pairs per second apportioned between distance replies as wellas squitter. Military TACAN sites transmit an additional 900 pulse pairs per second asreference marks for their rotating antennas, and often employ high power (up to 10 kWfor ground-based beacon transmitters). Usually TACANs are set at their maximum stan-dardized 3600 ppps rate. In our study, the DME ground beacon is considered to transmit2700 ppps, and 3600 ppps for TACAN, which correspond to a worst pulsed interferenceenvironment over the Europe.
Some reflected or echo interrogations may arrive to the DME/TACAN ground beacona short time after the direct interrogation depending on the terrain configuration. Thebeacon must be prevented from triggering the transmitter after reception of such a signalto avoid the aircraft receiver tracking an echo. The way employed to guarantee this pro-tection is to suppress the receiver function of the ground beacon for a dead-time period ofup to 60 μs [1]. DME and TACAN systems are not passive systems, they have an inherentcapacity limitation. The value generally quoted is 110 aircrafts per beacon. The numberof aircraft that a beacon can handle is usually based on the assumption that 95% of theaircrafts will be in the track mode at not over 25 interrogations per second; 5% are in thesearch mode, at not over 150 interrogations per second. For 100 aircrafts, this means 3125pulse-pairs per second [9].
3.2.4 DME/TACAN signals
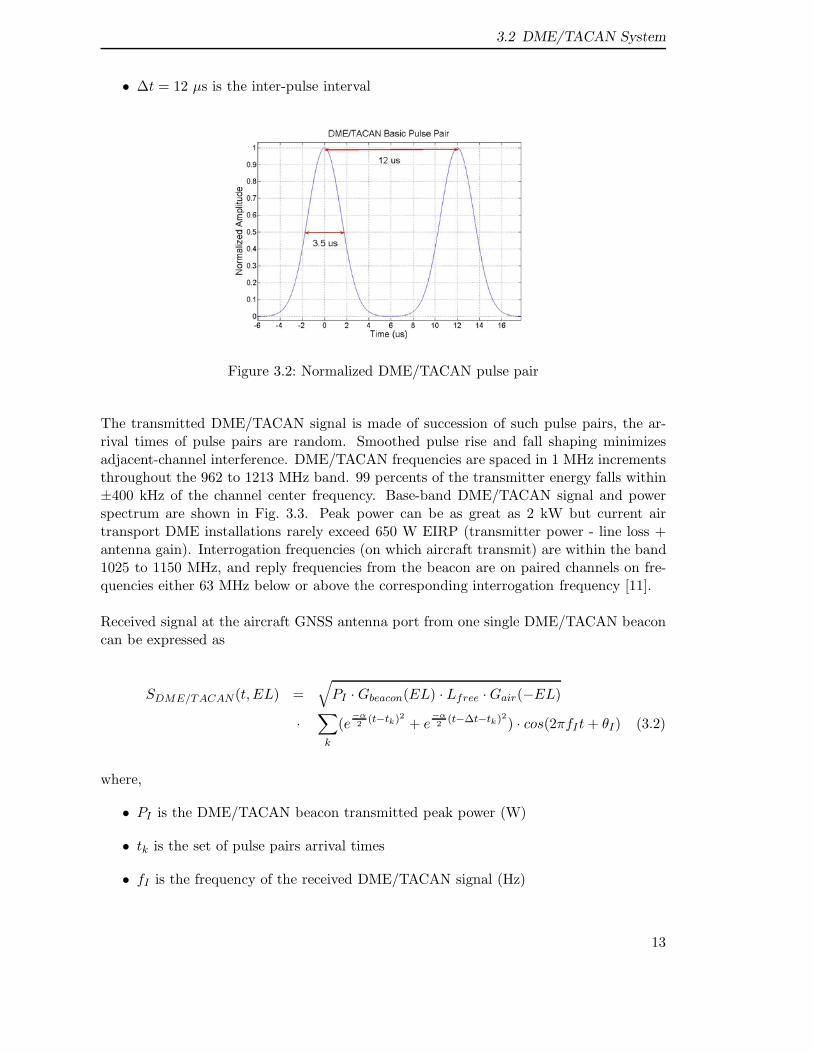
The basic DME/TACAN pulse pair is assumed as having a Gaussian-shape with a half-amplitude duration of 3.5 μs, the two pulses in the pair are separated by either 12 μs(X mode) or 36 μs (Y mode). In our study, only DME/TACAN signal in X mode is ofinterest, which has the following expression.
Spulsepair(t) = e−α2
t2 + e−α2
(t−Δt)2 (3.1)
where,
• α = 4.5 × 10¹¹s−2
12
3.2 DME/TACAN System
• Δt = 12 μs is the inter-pulse interval
Figure 3.2: Normalized DME/TACAN pulse pair
The transmitted DME/TACAN signal is made of succession of such pulse pairs, the ar-rival times of pulse pairs are random. Smoothed pulse rise and fall shaping minimizesadjacent-channel interference. DME/TACAN frequencies are spaced in 1 MHz incrementsthroughout the 962 to 1213 MHz band. 99 percents of the transmitter energy falls within±400 kHz of the channel center frequency. Base-band DME/TACAN signal and powerspectrum are shown in Fig. 3.3. Peak power can be as great as 2 kW but current airtransport DME installations rarely exceed 650 W EIRP (transmitter power - line loss +antenna gain). Interrogation frequencies (on which aircraft transmit) are within the band1025 to 1150 MHz, and reply frequencies from the beacon are on paired channels on fre-quencies either 63 MHz below or above the corresponding interrogation frequency [11].
Received signal at the aircraft GNSS antenna port from one single DME/TACAN beaconcan be expressed as
SDME/TACAN(t, EL) =√
PI · Gbeacon(EL) · Lfree · Gair(−EL)
·∑
k
(e−α2
(t−tk)2 + e−α2
(t−Δt−tk)2) · cos(2πfIt + θI) (3.2)
where,
• PI is the DME/TACAN beacon transmitted peak power (W)
• tk is the set of pulse pairs arrival times
• fI is the frequency of the received DME/TACAN signal (Hz)
13

3 DME/TACAN Interference Environment for An Airborne Galileo E5a/E5b Receiver
Figure 3.3: Typical DME/TACAN signal and its power spectrum
• θI is the DME/TACAN signal carrier phase at the GNSS receiver. antenna port. Itwas chosen as uniformly distributed over [0,2π]
• Lfree is the classical free-space propagation losses from ground beacon to the aircraft
• Gbeacon(EL) is the normalized DME/TACAN beacon antenna gain at the elevationangle EL
• Gair(−EL) is the normalized aircraft antenna gain at elevation angle -EL
The loss Lfree is inversely proportional to the square of the radio-electric range betweenthe ground beacon d and the frequency used.
Lfree = (c
4πdf)2 (3.3)
where,
• c is the velocity of light,3 × 105 km/s
• f is the signal frequency (Hz)
• d is the propagation distance (km)
Typical DME/TACAN beacon transmitter antenna and GNSS receiver antenna gain pat-terns are presented in Fig. 3.4.
A database of European DME/TACAN beacons is obtained from [8], which containsbeacon locations, transmitted powers(EIRP) and transmitting frequency. Single-beaconDME/TACAN signals are then independently added to form the composite received signalat the GNSS receiver antenna port.
14

3.3 DME/TACAN Signal Contribution to Noise Floor
Figure 3.4: Typical DME/TACAN (left) and GNSS receiver (right) normalized antennagain vs elevation angle
3.3 DME/TACAN Signal Contribution to Noise Floor
3.3.1 Effective Carrier-to-noise Density Calculation due to RFI
One algorithm for the effective carrier-to-noise density ratio calculation caused by RFI ispresented in [11], which is described as follows. The algorithm estimates an effective noise+ interference density ratio at the output of the signal correlator due to the pulse blanker[11]. (In [11], blanker duty cycle is denoted as ”PDCB”, while, in this thesis, it is denotedas ”Bdc”)
C/N0,EFF =C · (1 − Bdc)2
(N0 + I0,WB) · (1 − Bdc) + (1−BdcBW ) · ∑N
i=1 Pi · dci
(3.4)
Where,
• C is the post-collelator recovered satellite carrier power (W)
• Bdc (blanker duty cycle) is the total duty cycle of all DME pulses exceeding theblanking threshold
• N0 is the GNSS receiver system thremal noise power spectral density, which is−200 dBW/Hz
• I0,WB is the power spectral density of constinnuous broadband RFI
• BW is the pre-correlator IF bandwidth
• Pi is the received peak power of ith RFI (referred to antenna output) with peak levelbelow the blanking threshold
• dci is the ith below-blanker RFI duty cycle
15
3 DME/TACAN Interference Environment for An Airborne Galileo E5a/E5b Receiver
Implemented only the antenna, equivalent RF/IF front-end filter Digital pulse blanker andcorrelator in GNSS receiver, the impact of DME/TACAN pulsed interfering signal can beevaluated from the degradation of post correlator effective carrier-to-noise density ratio.The blanker ”zeros” the signal and noise into the correlator during the time duration ofstrong pulses, whose power levels are above the blanker threshold. So strong pulses deter-mine the blanker duty cycle (Bdc).
The degradation of useful signal power deg(signal) at correlator output, due to the pres-ence of interference and blanker, is
deg(signal) = (1 − Bdc)2 (3.5)
The degradation of thermal noise power deg(thermal noise) at correlator output, due tothe presence of interference and the blanker, is [6]
deg(thermal noise) = (1 − Bdc) (3.6)
The blanker effect on the below-blanker RFI, deg(RFI), is
deg(RFI) = (1 − Bdc) (3.7)
3.3.2 Effective Carrier-to-noise Density Calculation due to DME/TACANsignals
When I0,WB = 0, we derive the degradation of post correlator effective carrier to noisedensity ratio (C/N0,eff ) caused by DME/TACAN signal only. Dividing out the common(1 − Bdc) term, we simplifies (3.4) to be
C/N0,EFF =C
N0· (1 − Bdc)
1 + ( 1N0·BW ) · ∑N
i=1(Pi · dci)(3.8)
Define
RI = (1
N0 · BW) ·
N∑i=1
(Pi · dci) (3.9)
RI represents the power density ratio of the below blanker DME/TACAN pulses to thereceiver thermal noise. Then we further simplify (3.8), and the result is
C/N0,EFF =C
N0· (1 − Bdc)
1 + RI(3.10)
The effective noise density ratio then is shown in (3.11)
N0,EFF = N0 · (1 + RI)(1 − Bdc)
(3.11)
16

3.3 DME/TACAN Signal Contribution to Noise Floor
which, in logarithmic form is
N0,EFF (dB) = N0(dB) − 10 log (1 − Bdc) + 10 log (1 + RI) (3.12)
Then the noise floor consists of suppressed thermal noise by the blanker and weak DME/TACANpulses that are not blanked.
The degradation of C/N0,eff , deg(C/N0,eff ), due to the DME/TACAN interference pulsesand blanker is
deg(C/N0,eff ) =(1 − Bdc)(1 + RI)
(3.13)
or in logarithmic form is
deg(C/N0)(dB) = 10 log (1 − Bdc) − 10 log (1 + RI) (3.14)
Following situations should be considered in degradation calculation. First, strong DME/TACANpulses whose peak powers are above the blanking threshold, not only determine the blankerduty cycle (Bdc), but also contribute to the noise power increase because of the resid-ual part of Gaussian DME/TACAN pulse and the carrier amplitude variations. WeakDME/TACAN (below-blanker) pulses are assumed not to affect the Bdc computation,they only contribute to the noise floor increase. Second, overlapping of DME/TACANpulses is common especially at high altitude, because more DME/TACAN signals arereceived by the victim GNSS receiver (overlapped pulses are shown in Fig. 3.5). Someprevious studies didn’t consider the case of strong pulses collision. For example, whenderiving Bdc, they determined the number of the DME and TACAN signals whose powerare received above the blanking threshold at a fixed location of the victim GNSS receiverand then multiply the number of DME and TACAN by their respective average PRF, andthe resulting total average arrival rate then multiplied 3.5 × 2 μs to obtain Bdc. Thiswould overestimate the DME/TACAN impact on C/N0,eff .
3.3.2.1 RI Calculation
Strong DME/TACAN pulses also contribute to the noise floor. Calculation of belowblanker pulse power density ratio to the receiver thermal noise RI should include thepower of both weak DME/TACAN pulses and the residual portion of strong DME/TACANpulses. In [11] and [1], rectangular equivalent pulse width is used to model the equivalentDME/TACAN pulse width, when calculating the duty cycle. For weak DME/TACANpulses whose received power is below the blanking threshold, DME/TACAN pulse pairequivalent width is 2×2.64 μs. Duty cycle for a weak DME signal then can be expressed as
17

3 DME/TACAN Interference Environment for An Airborne Galileo E5a/E5b Receiver
Figure 3.5: Example of composite DME/TACAN signals environment
dcweak,i = PWweak,i · PRFweak,i
= 2 × 2.64 · PRFweak,i (3.15)
where,
• dcweak,i is the equivalent pulse width of the ith weak DME/TACAN signal
• PRFweak,i is the pulse pair repetition frequency of the ith weak DME/TACAN signal
For strong DME/TACAN pulses, the time period that the instantaneous received powerexceeds the blanking threshold decides the blanker duty cycle (Bdc). The blanked widthof the strong pulse pair is,
PWblanked = 2 × 2
√ln (Pstrong/th)
α(3.16)
where,
• Pstrong is the received peak power of DME/TACAN pulse pair;
• th is the blanking threshold power.
• α = 4.5 × 10¹¹ s−2, one of the DME/TACAN basic pulse pair Gaussian shape pa-rameter.
18

3.3 DME/TACAN Signal Contribution to Noise Floor
The residual portion of strong DME/TACAN pulse could be modeled as a rectangle withpeak power of the original peak power of the strong DME/TACAN pulse. The post-blanking residual rectangular equivalent pulse pair width is,
PWresidual = 2√
π/α · erfc(√
ln (Pstrong/th)) (3.17)
Then the duty cycle for the residual portion of a strong DME/TACAN signal caused bythe pulse blanker is,
dcresidual,i = PWresidual,i · PRFstrong,i (3.18)
where,
• PRFstrong,i is the pulse pair repetition frequency of the ith strong DME/TACANsignal.
Considering the residual portion of Gaussian DME/TACAN pulse after the pulse blanking,RI is all below-blanker DME/TACAN power density ratio to the receiver thermal noise.Both weak DME/TACAN pulses and the residual portion of the strong DME/TACANpulses contribute to RI . (3.9) for calculating the parameter RI can be rewritten as,
RI = (1
N0 · BW) · (
M∑i=1
(Pweak,i · dcweak,i) +N∑
j=1
(Pstrong,j · dcresidual,j)) (3.19)
where,
• Pweak,i is the received peak power of the ith weak DME/TACAN signal whose re-ceived peak power is below the blanking threshold
• Pstrong,j is the received peak power of the jth strong DME/TACAN signal whosereceived peak power is above the blanking threshold
3.3.2.2 Bdc Calculation
Following model is used when taking overlapping of the strong DME/TACAN pulses intoaccount. DME/TACAN pulse pair arrival times may be assumed independent and of con-stant behavior over time for each DME/TACAN beacon. The general model for this isPoisson process. The signal transmitted by a single beacon is not a pure Poisson process,since there is a dead-time of 60 μs between pulse pairs. However, signals received at thevictim GNSS receiver is made of multiple signals transmitted by different and independentDME ground beacons. Thus the composite signal pulse pair arrival times also follow aPoisson distribution, whose parameter λ is the sum of each individual parameter λi, whereλi equates the beacon PRF. The Poisson probability density function (pdf) p, is defined
19

3 DME/TACAN Interference Environment for An Airborne Galileo E5a/E5b Receiver
as the probability that k arrivals will occur within some arbitrary time interval [t0, t0 + t].
p = Prob{k arrivals occur within [t0, t0 + t]} =(λt)ke−λt
k!(3.20)
The expected value of number of arrivals in the time interval is given as λt, and with avariance of σ2 = λt. The process is memoryless, the probability of finding no arrival inthe interval is,
Prob{no arrival occur within [0, t]} = e−λt (3.21)
Then the probability of finding at least one arrival in the interval is,
Prob{one or more arrival occur within [0, t]} = 1 − e−λt (3.22)
Each pulse pair arrival in the interval has some finite duration, which is decided by thepulse peak power and the blanking threshold (3.16), taken as a random variable with somearbitrary distribution with an expected value of w. Considering the pulse overlapping, then
Prob{one or more arrival in interval w} = 1 − e−λw (3.23)
Bdc considering the strong pulses overlapping can be expressed as ,
Bdc = 1 − e−λw = 1 − e−λ·E[PWblanked] (3.24)
Therefore, deg(C/N0) can be obtained from the DME/TACAN pulse RFI parameters byinserting (3.19) and (3.24) into (3.14).
3.3.2.3 Theoretical C/N0,eff Degradation Caused by DME/TACAN Pulses
The minimum received power of E5a/L5 and E5b signals at the victim GNSS receiver is-160 dBW . The filter bandwidth of E5a/L5 is 20 MHz, for E5b,the bandwidth is 14 MHz.The thermal noise power spectral density for GNSS receiver system is -200 dBW/Hz.When the victim aircraft is at a location of 50◦N 9◦E with flying height of 10 kft and40 kft, there exist optimal blanking thresholds that minimize the degradations. Thenthe impact on C/N0,eff caused by DME/TACAN signals and blanker operating at theoptimal threshold (optimal thresholds for different cases are obtained from the MATLABsimulation result) is shown in Table 3.1.
From Table 3.1, clearly we can see Bdc and RI at high altitude are larger than at the low al-titude for both E5a and E5b bands. In other words, the interference due to DME/TACANbeacon sources increases with the altitude. And the impact of the DME/TACAN pulseson E5a band is more severe than E5b.
20

3.3 DME/TACAN Signal Contribution to Noise Floor
E5a/L5 E5bVictim GNSS Receiver Hight FL100 FL400 FL100 FL400
OptimalBlankerThreshold(dBW ) −116.1 −115.5 −117.7 −117.1Bdc(%) 19.48 30.92 18.56 28.04
RI 0.0414 0.2307 0.0283 0.2224deg(C/N0,eff ) (dB) −1.1171 −2.5421 −1.0128 −2.3014
Table 3.1: DME/TACAN pulse RFI parameters and the C/N0,eff degradation calculationat 50◦N 9◦E
Table 3.2 shows that when the DME/TACAN frequency components peak powers areuniformly distributed in same power level, larger duty cycle interference signal causeslarger Bdc and RI, which leads to a larger C/N0,eff degradation. DME/TACAN signalswith the same duty cycle, larger power level will result in a larger C/N0,eff degradation.While, the value of optimal blanking thresholds do not change much.
dc=25% dc=15% dc=15%DME/TACAN Power Level (dBW) [-120 -100] [-120 -100] [-130 -110]OptimalBlankerThreshold(dBW ) −115.1 −116.1 −116.8
Bdc(%) 30.44 20.73 2.62RI 0.1539 0.0676 0.0514
deg(C/N0,eff ) (dB) −2.1980 −1.2930 −0.3329
Table 3.2: Duty cycle and peak power level influence on the DME/TACAN pulse RFIparameters and the C/N0,eff degradation calculation
21

4 DME/TACAN Pulsed InterferenceEnvironments Simulation
The impact of the DME/TACAN interference on the effective post-correlation C/N0,eff inGNSS receivers has already been analyzed in Chap.3. In this chapter, the DME/TACANpulsed interference environments of an airborne GNSS receiver at high altitude are sim-ulated for both E5a/L5 and E5b. For each simulation, we generate a DME/TACANinterference IF signal at the output of GNSS receiver mixer with a length of 0.1 secondeach time.
Two kinds of simulation modes are simulated for different purposes. One of the DME/TACANpulsed interference environments which would be of great interest is the interference atGNSS antenna port of an aircraft flying at high altitude over the European hot-spot. Inthis case, we develop a mode called ”Hot-spot” mode which simulates the real situationof European hot-spot based on the information of DME/TACAN beacons located in Eu-rope. And the impact of this interference environment on GNSS receiver is presentedfor both Galileo E5a/GPS L5 and E5b with flight heights of 10 kft and 40 kft. In theother mode ”Duty cycle” mode, we generate DME/TACAN pulses at the given duty cy-cle, then test the impacts on C/N0,eff degradation caused by these pulses when changinginput DME/TACAN duty cycle and power distribution. This mode can be used to findout the influence of DME/TACAN duty cycle on the C/N0,eff degradation, and can beused to test the GNSS receiver performance under large duty cycle DME/TACAN pulsedenvironments.
4.1 ”Hot-spot” Mode
”Hot-spot” mode is used to simulate the DME/TACAN pulsed interference environmentat the victim aircraft flying over the European hot spot with a certain flight height. Signalsfrom each DME/TACAN ground beacon are aggregated to form the pulsed interferenceenvironment. Received signal from single DME/TACAN ground beacon is generated fromthe expression (3.2), which is,
SDME/TACAN(t, EL) =√
PI · Gbeacon(EL) · Lfree · Gair(−EL)
·∑
k
(e−α2
(t−tk)2 + e−α2
(t−Δt−tk)2) · cos(2πfI t + θI) (4.1)
tk can be derived from PRF, elevation angle EL and Lfree can be obtained from DME/TACANbeacon location (latitude/longitude/altitude), PI , fI , PRF, and DME/TACAN beacon lo-cation are given by the DME/TACAN database. Then DME/TACAN pulsed interference
22

4.1 ”Hot-spot” Mode
can be expressed as,
S =∑
i
SDME/TACAN,i (4.2)
Figure 4.1: ”Hot-spot” Simulation Mode System Structure
As shown in Fig. 4.1, testing band and aircraft position are as input parameters. The simu-lated pulsed interference environment is made from each received signal from DME/TACANbeacon. Peak power of the received DME/TACAN pulses from a single DME/TACANbeacon is determined by DME/TACAN beacon transmitting peak power, antenna gains,and free-space loss. Program details for the simulation can be found in Appendix A.
4.1.1 Simulation Assumptions for ”Hot-spot” Mode
4.1.1.1 Aircraft Flight
The aircraft is assumed to fly at a high altitude of 40 kft, which is a typical maximumlevel of flight for an en-route operation. The degradation of effective carrier to noise ratiodue to the DME/TACAN pulses is maximal at this altitude. 10 kft is also simulated toshow the influence of altitude on the degradations caused by the DME/TACAN pulses.
23
4 DME/TACAN Pulsed Interference Environments Simulation
4.1.1.2 Testing Band
Simulations are carried on Galileo E5a/GPS L5 and E5b bands. We assume for bothE5a/L5 and E5b signals, the IF frequency is 20 MHz. DME/TACAN pulses are alsogenerated at IF bands. For E5a/L5, the bandwidth used is 20 MHz (the passband is [1030] MHz), and 14 MHz for E5b (the passband is [10 24] MHz), which corresponds to RFbands 1176.45 ± 10 MHz for E5a/L5 and [1997.14 1211.14] MHz for E5b.
4.1.1.3 DME/TACAN Beacon Selection
Given the aircraft position, DME/TACAN beacons located inside the aircraft insightregion of the earth are chosen. European DME/TACAN beacon database containingbeacon locations (longitude/latitude/height), transmitting frequencies and transmittingpeak powers can be found in [8].
4.1.1.4 DME/TACAN Beacon Pulse Pair Repetition Frequency
We assume DME ground beacons transmitting pulse pairs at 2700 ppps, and 3600 pppsfor TACAN. It corresponds to a worst pulsed interference environment.
4.1.1.5 Antenna Gain
Antenna gain patterns of GNSS receiver and DME/TACAN beacon are shown in Fig. 3.4.Since the elevation angles are almost within 20◦, so we assume the normalized antennagain patterns for DME and TACAN beacons are the same.
4.1.1.6 DME/TACAN Beacon Transmitting Frequency
The IF DME/TACAN signals are generated in the simulation instead of the RF signals.The simulated transmitting frequency of the single DME/TACAN signal can be expressedas,
fDME/TACAN = freal transmitting − fcentral + fIF (4.3)
where,
• fDME/TACAN is simulated IF DME/TACAN transmitting frequency
• freal transmitting is real RF transmitting frequency of DME/TACAN beacon
• fcentral is testing band central frequency, for E5a/L5 is 1175.45 MHz and 1207.14 MHzfor E5b
• fIF is IF frequency, which is 20 MHz in our simulation
4.1.1.7 Front-end Filter
Two kinds of front-end filters are used in ”Hot-spot” mode simulation. One is the ideal fil-ter with rectangular frequency response which blocks all frequencies outside the passband.Signals whose frequencies are inside the passband pass the filter without attenuation. Theother kind of front-end filters for E5a/L5 and E5b bands are shown in Fig. 4.2.
24

4.1 ”Hot-spot” Mode
Figure 4.2: Simulated front-end filter of E5a/L5 (left) and E5b (right) receivers
4.1.1.8 Channel Characteristics
The channel between the single DME/TACAN beacon and aircraft only attenuates theamplitude of DME/TACAN signal (as shown in (3.2)).
4.1.2 Simulation Result of ”Hot-spot” Mode
In [1], a worst location is in coordinates 50◦ North and 9◦ East. In order to compare oursimulation results with the results presented in [1], we assume the same coordinates in oursimulation. Following simulation results are obtained when the victim aircraft is at thisworst location with a flight height of 10 kft and 40 kft.
4.1.2.1 Impact of DME/TACAN Pulsed Environment on Galileo E5a/GPS L5Receiver
For Galileo E5a/GPS L5 signal, applied ideal front-end filter, the degradation and blankerduty cycle caused by DME/TACAN signal only are plotted on Fig. 4.3. Dashed lines rep-resent C/N0,eff degradations vs blanking thresholds, dotted lines represent blanker dutycycles vs blanking thresholds.
Clearly on E5a/L5, the degradation is minimized for a blanking threshold of -116.1 dBWfor 10 kft and -115.5 dBW for 40 kft. Degradation and duty cycle at the flight heightof 40 kft (-1.4625 dB/19.08%) are larger than 10 kft (-0.8537 dB/14.56%). While, theoptimal blanking threshold of 10 kft is 0.6 dB larger than of 40 kft. The maximum degra-dations and the associated blanker duty cycles as well as other simulation results for E5aband are summarized in Table 4.1.
Applied front-end filters shown in Fig. 4.2, more DME/TACAN beacon signals pass thefilter with attenuation, and then contribute to the interference environment, and the degra-dations become larger, as shown in Fig. 4.4 (Dashed lines represent C/N0,eff degradationsvs blanking thresholds, dotted lines represent blanker duty cycles vs blanking thresholds).
25

4 DME/TACAN Pulsed Interference Environments Simulation
Figure 4.3: E5a/L5 C/N0 degradation due to DME/TACAN beacons over the EuropeHot-spot at 10 kft (left) and 40 kft (right)
E5a 10 kft E5a 40 kft
DME/TACAN number 7 23Received DME/TACAN signal Peak Power (dBW ) −86.9278 −95.7952
Average Power of Received DME/TACAN signal (dBW ) −109.1989 −115.6266Optimal Blanking Threshold (dBW ) −116.1 −115.5
Bdc(%) 14.56 19.08RI 0.0400 0.1333
deg(C/N0,eff ) (dB) −0.8537 −1.4625
Table 4.1: E5a band simulation result due to DME/TACAN beacons over the EuropeHot-spot
E5a/L5 10 kft E5a/L5 40 kft
DME/TACAN number 26 87Received DME/TACAN signal Peak Power (dBW ) −82.7790 −88.5739
Average Power of Received DME/TACAN signal (dBW ) −105.2021 −109.4320Optimal Blanking Threshold (dBW ) −114.4 −113.4
Bdc(%) 35.31 41.71RI 0.1636 0.3444
deg(C/N0,eff )(dB) −2.5496 −3.6290
Table 4.2: E5a/L5 band simulation result due to DME/TACAN beacons over the EuropeHot-spot when applying the simulated front-end filter
With the simulated front-end filter, the simulation results of DME/TACAN interference
26

4.1 ”Hot-spot” Mode
Figure 4.4: E5a/L5 C/N0,eff degradation due to DME/TACAN beacons over the EuropeHot-spot at 10 kft (left) and 40 kft (right) when applying the simulated front-end filter
impact on the E5a/L5 receiver are presented in Table 4.2.
4.1.2.2 Impact of DME/TACAN Pulsed Environment on Galileo E5b Receiver
For the simulation carried on the Galileo E5b band, we obtain a similar result as E5a/L5.Applying the ideal front-end filter, degradations and blanker duty cycles in presence of theDME/TACAN signal only for E5b band are plotted on Fig. 4.5 (Dashed lines representC/N0,eff degradations vs blanking thresholds, dotted lines represent blanker duty cyclesvs blanking thresholds).
Figure 4.5: E5b C/N0,eff degradations due to DME/TACAN beacons over the EuropeHot-spot at 10 kft (left) and 40 kft (right)
Table 4.3 shows the maximum degradations and the associated blanker duty cycles as well
27

4 DME/TACAN Pulsed Interference Environments Simulation
as other simulation results for E5b band.
E5b 10 kft E5b 40 kft
DME/TACAN number 5 20Received DME/TACAN signal Peak Power (dBW ) −88.2929 −92.5883
Average Power of Received DME/TACAN signal (dBW ) −111.5312 −115.0172Optimal Blanking Threshold (dBW ) −117.7 −117.1
Bdc(%) 14.39 18.41RI 0.0285 0.1246
deg(C/N0,eff ) (dB) −0.7969 −1.3938
Table 4.3: E5b band simulation result due to DME/TACAN beacons over the EuropeHot-spot
From the Fig. 4.5, we can see that there is clearly an optimal blanking threshold thatachieves the minimum degradations, and the threshold for 10 kft is 0.6 dB larger thanfor 40 kft, which is the same as the result for E5a/L5 band (Fig. 4.3). If the blankingthreshold is too high, more interference is allowed to enter the receiver so the blanker dutycycle is low and the degradations are high. If the blanking threshold is too low, the usefulGalileo signal is highly degraded so the overall degradation and the blanker duty cyclebecome large. So in between we could find an optimal threshold. The blanking thresholdin E5b is smaller than in E5a/L5. The degradations caused by the DME/TACAN pulsedinterference in presence of the pulse blanker are larger at a higher flight (40 kft) for bothE5a/L5 and E5b bands.
When applying the simulated front-end filter, degradations and blanker duty cycles inpresence of DME/TACAN signal only are plotted on Fig. 4.6 (Dashed lines representC/N0,eff degradations vs blanking thresholds, dotted lines represent blanker duty cyclesvs blanking thresholds). More DME/TACAN interference passes the simulated front-endfilter than the ideal one.
With the simulated front-end filter, the simulation results of DME/TACAN interferenceimpact on GNSS receiver on E5b band are presented in Table 4.4.
Clearly, the degradations are larger when applying the simulated filter, for more DME/TACANinterference power passes the front-end filter.
From the ”Hot-spot” mode simulations above, we can see that degradations are largerat higher flight height. At the same flight height, degradations on the E5a/L5 band arelarger than E5b. What is more, different types of front-end filter would affect C/N0,eff
degradations because of the difference of the filtered DME/TACAN interference signals.
28

4.2 ”Duty Cycle” Mode
Figure 4.6: E5b C/N0,eff degradation due to DME/TACAN beacons over Europe Hot-spot at 10 kft (left) and 40 kft (right) when applying simulated front-end filter
E5b 10 kft E5b 40 kft
DME/TACAN number 26 87Received DME/TACAN signal Peak Power (dBW ) −85.9103 −91.8198
Average Power of Received DME/TACAN signal (dBW ) −106.8343 −112.0749Optimal Blanking Threshold (dBW ) −116.6 −115.9
Bdc(%) 30.08 32.82RI 0.0931 0.2364
deg(C/N0,eff ) (dB) −1.9402 −2.6493
Table 4.4: E5b band simulation result due to DME/TACAN beacons over the EuropeHot-spot when applying the simulated front-end filter
4.2 ”Duty Cycle” Mode
”Duty Cycle” mode generates DME/TACAN interfering pulses according to the givenduty cycle. At GNSS receiver, the only interested parameters are DME/TACAN signal’sduty cycle and received peak power. DME/TACAN beacon’s location and aircraft positionare not under consideration in this mode. In this mode, we can observe the influence ofDME/TACAN duty cycle and peak power level on GNSS receiver C/N0,eff degradations.
The number of the DME/TACAN signals, duty cycle and peak power distribution of theseDME/TACAN interfering signal at the GNSS receiver antenna port as well as testing bandare input parameters. Generated interference signal is the composite DME/TACAN pulseswhose duty cycle equals to the input duty cycle. The generated pulsed interference signalcan be used as the input signal to the GNSS software receiver (details can be found inChap. 5) to test the GNSS receiver’s performance (tracking threshold and acquisitionthreshold).
29
4 DME/TACAN Pulsed Interference Environments Simulation
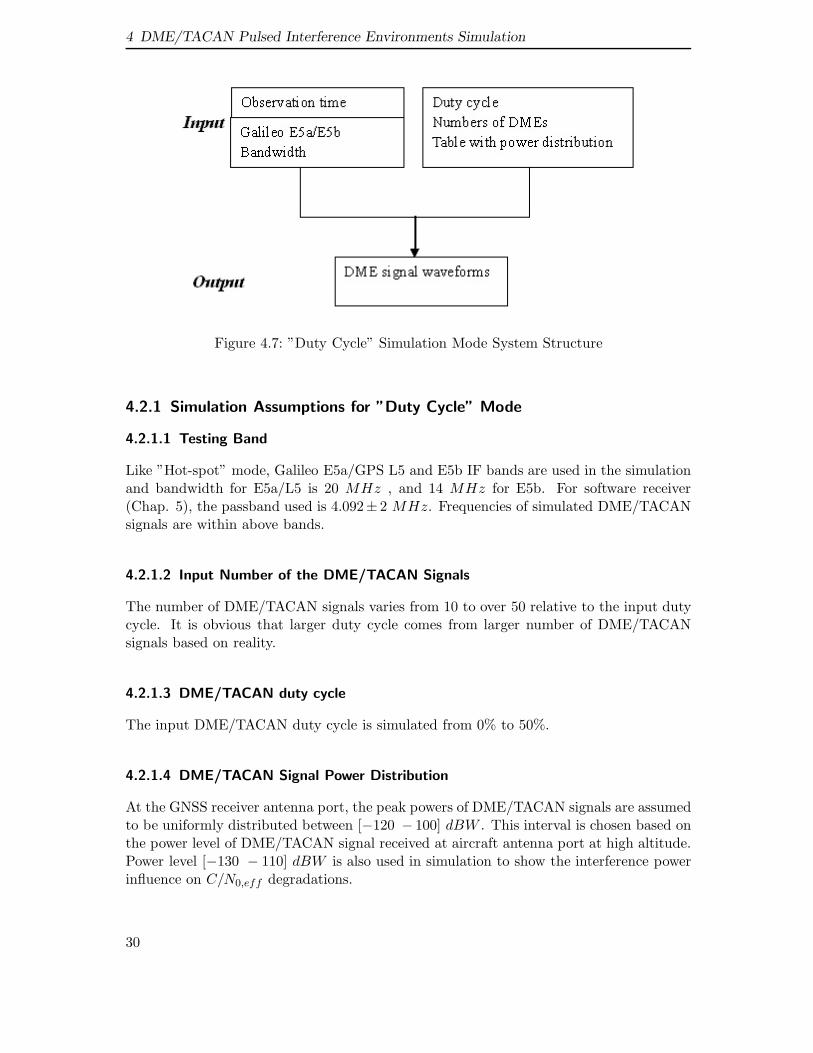
Figure 4.7: ”Duty Cycle” Simulation Mode System Structure
4.2.1 Simulation Assumptions for ”Duty Cycle” Mode
4.2.1.1 Testing Band
Like ”Hot-spot” mode, Galileo E5a/GPS L5 and E5b IF bands are used in the simulationand bandwidth for E5a/L5 is 20 MHz , and 14 MHz for E5b. For software receiver(Chap. 5), the passband used is 4.092± 2 MHz. Frequencies of simulated DME/TACANsignals are within above bands.
4.2.1.2 Input Number of the DME/TACAN Signals
The number of DME/TACAN signals varies from 10 to over 50 relative to the input dutycycle. It is obvious that larger duty cycle comes from larger number of DME/TACANsignals based on reality.
4.2.1.3 DME/TACAN duty cycle
The input DME/TACAN duty cycle is simulated from 0% to 50%.
4.2.1.4 DME/TACAN Signal Power Distribution
At the GNSS receiver antenna port, the peak powers of DME/TACAN signals are assumedto be uniformly distributed between [−120 − 100] dBW . This interval is chosen based onthe power level of DME/TACAN signal received at aircraft antenna port at high altitude.Power level [−130 − 110] dBW is also used in simulation to show the interference powerinfluence on C/N0,eff degradations.
30
4.2 ”Duty Cycle” Mode
4.2.1.5 DME/TACAN Beacon Transmitting Frequency
The DME/TACAN signal frequencies at GNSS receiver are uniformly distributed in thetesting band. Ideal front-end filter is used in the ”Duty cycle” mode.
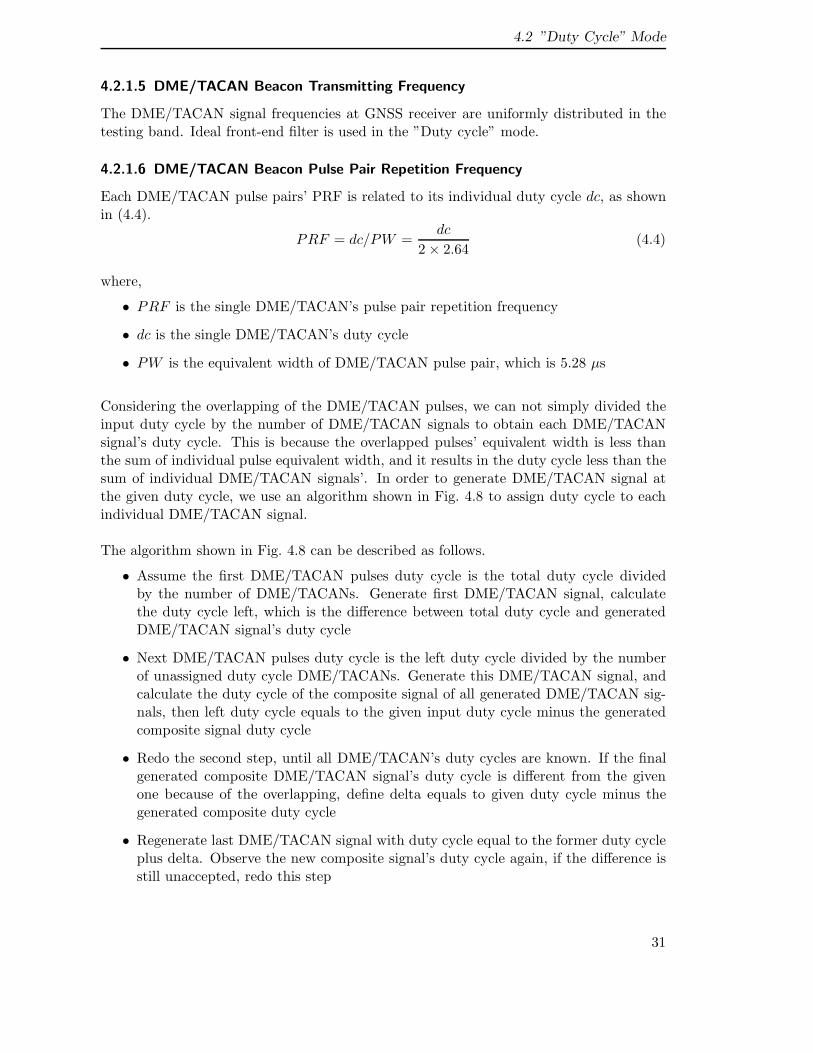
4.2.1.6 DME/TACAN Beacon Pulse Pair Repetition Frequency
Each DME/TACAN pulse pairs’ PRF is related to its individual duty cycle dc, as shownin (4.4).
PRF = dc/PW =dc
2 × 2.64(4.4)
where,
• PRF is the single DME/TACAN’s pulse pair repetition frequency
• dc is the single DME/TACAN’s duty cycle
• PW is the equivalent width of DME/TACAN pulse pair, which is 5.28 μs
Considering the overlapping of the DME/TACAN pulses, we can not simply divided theinput duty cycle by the number of DME/TACAN signals to obtain each DME/TACANsignal’s duty cycle. This is because the overlapped pulses’ equivalent width is less thanthe sum of individual pulse equivalent width, and it results in the duty cycle less than thesum of individual DME/TACAN signals’. In order to generate DME/TACAN signal atthe given duty cycle, we use an algorithm shown in Fig. 4.8 to assign duty cycle to eachindividual DME/TACAN signal.
The algorithm shown in Fig. 4.8 can be described as follows.
• Assume the first DME/TACAN pulses duty cycle is the total duty cycle dividedby the number of DME/TACANs. Generate first DME/TACAN signal, calculatethe duty cycle left, which is the difference between total duty cycle and generatedDME/TACAN signal’s duty cycle
• Next DME/TACAN pulses duty cycle is the left duty cycle divided by the numberof unassigned duty cycle DME/TACANs. Generate this DME/TACAN signal, andcalculate the duty cycle of the composite signal of all generated DME/TACAN sig-nals, then left duty cycle equals to the given input duty cycle minus the generatedcomposite signal duty cycle
• Redo the second step, until all DME/TACAN’s duty cycles are known. If the finalgenerated composite DME/TACAN signal’s duty cycle is different from the givenone because of the overlapping, define delta equals to given duty cycle minus thegenerated composite duty cycle
• Regenerate last DME/TACAN signal with duty cycle equal to the former duty cycleplus delta. Observe the new composite signal’s duty cycle again, if the difference isstill unaccepted, redo this step
31

4 DME/TACAN Pulsed Interference Environments Simulation
Figure 4.8: DME/TACAN signal individual duty cycle assignment algorithm
4.2.2 Simulation Result of ”Duty Cycle” Simulation Mode
4.2.2.1 DME/TACAN duty cycle Influence on GNSS Receiver
Fig. 4.9 is plotted when the input power levels are [−120 − 100] dBW (Dashed lines rep-resent C/N0,eff degradations vs blanking thresholds, dotted lines represent blanker dutycycles vs blanking thresholds). Clearly larger input duty cycle leads to larger degradation.Table 4.5 shows the maximum degradations and the associated blanker duty cycle as wellas other results simulated at the duty cycle of 15% and 25%.
32

4.2 ”Duty Cycle” Mode
Figure 4.9: E5a C/N0 degradation caused by DME/TACAN signal only when givenDME/TACAN duty cycles are 15% (left) and 25% (right), when input powerlevel is [-120 100] dBW.
E5a dc = 15% E5a dc = 25%DME/TACAN number 14 23
DME/TACAN signal Peak Power (dBW ) −92.6702 −90.7675Average Power of DME/TACAN signal (dBW ) −115.0523 −113.5544
Optimal Blanking Threshold (dBW ) −116.1 −115.5Bdc(%) 14.36 21.74
RI 0.0564 0.1049deg(C/N0) (dB) −0.9117 −1.4980
Table 4.5: Degradation caused by DME/TACAN only when applying different input dutycycles
4.2.2.2 DME/TACAN Signal Power Level Influence on GNSS Receiver
Fig. 4.10 shows that C/N0,eff degradation decreases as the reduction of the input DMEsignal power level when input duty cycle is 15%.
Table 4.6 shows the maximum degradations and the associated blanker duty cycle as well asother results simulated at different input DME/TACAN signal power levels. DME/TACANsignal with larger power level results in a larger Bdc and RI, which leads to a largerC/N0,eff degradatoin.
Results obtained from ”Duty cycle” mode simulations show that increasing duty cyclewould cause larger C/N0,eff degradation. Decreasing the average power of DME/TACANinterfering signal would lead to a smaller C/N0,eff degradation.
33
4 DME/TACAN Pulsed Interference Environments Simulation
Figure 4.10: E5a/L5 C/N0 degradation caused by DME signal only when DME/TACANsignals’ power levels are [−120 − 100]dBW (left) and [−130 − 110]dBW(right), when dc is 15%
Power : [−120 − 100] dBW Power : [−130 − 110] dBW
DME/TACAN number 14 14DME/TACAN Peak Power (dBW ) −92.6702 −107.4973
DME/TACAN Average Power (dBW ) −115.0523 −129.7734Blanking Threshold (dBW ) −116.1 −116.8
Bdc(%) 14.36 1.13RI 0.0564 0.0325
deg(C/N0) (dB) −0.9117 −0.1885
Table 4.6: Degradation caused by DME/TACAN only on E5a/L5 band when applyingdifferent input power levels
34

5 GNSS Software Receiver PerformanceTesting Under DME/TACAN PulsedInterference Environment
In this chapter, we combine the generated DME/TACAN signal with GPS signal in theGNSS software receiver available in Deutsches Zentrum fur Luft- und Raumfahrt e.V.(DLR), and then we test the acquisition and tracking thresholds by changing the dutycycle of the DME/TACAN pulsed interference environment, both with and without im-plementing the pulse blanker into the software receiver. By doing this, we find that pulseblanker would help the GNSS software receiver to cope with more severe DME/TACANinterference environment with larger duty cycle. Finally, in order to find out influence ofthe interference power on the acquisition and tracking thresholds of the software receiver,we test the receiver performance by changing the power level of the DME/TACAN signal.
In our testing, all simulation results obtained are from one trial. Note that the GPSsignal generator we used is not perfect, as some spectrum aliasing occurs during the signalgeneration.
5.1 Pulse Blanker Influence on the GNSS Software ReceiverUnder DME/TACAN Interference Environment
Assuming that DME/TACAN signal components have a uniform peak power distributionin the given power level. In Chap. 4.2.2.1, we have shown that, with the pulse blanker,the C/N0,eff degradation of GNSS receiver is larger at higher duty cycle. In other words,C/N0,eff at the GNSS receiver correlator output decreases as the increasing of the dutycycle of the DME/TACAN pulses. This is verified by the following software receiverperformance testing under strong pulsed DME/TACAN interference environment. TheRF front-end filter of the software receiver is assumed as the ideal bandpass filter withNyquist bandwidth. Since pulse blanking is a simple and near optimal technique to copewith strong pulsed interference, so we test the receiver performance by both inserting andnot inserting a pulse blanker into the software receiver. Configuration of the softwarereceiver is shown in Table 5.1. The pulse blanker works on the unquantized samples inour simulation.
When a pulse blanker is implemented in the software receiver, the blanking threshold tonoise ratio is set to be around 76 to 77 dBHz. This blanking threshold is the optimal valueobtained from the MATLAB simulation when analyzing C/N0,eff degradations caused by
35

5 GNSS Software Receiver Performance Testing Under DME/TACAN Pulsed Interference Environment
DME/TACAN signal only. And the MATLAB simulation shows that DME/TACAN sig-nal’s duty cycle and power level don’t affect the value of this optimal blanking thresholdvery much.
Process T ime (s) 2ADC/AGC bits 4RF Front − end Filter Bandwidth (MHz) 8.1838IF (MHz) 4.1304Sampling Frequency (MHz) 16.3676Interference free C/N0 (dBHz) 45Loss of Tracking Doppler std Threshold (Hz) 10Loss of Tracking C/N0 Threshold (dBHz) 40.5
Table 5.1: Software Receiver Configurations
Two cases would happen when the software receiver is under DME/TACAN interferenceenvironment. The first one is, the receiver suffers this pulsed interference all the time.In this case, larger duty cycle DME/TACAN signals would cause the receiver acquisitionfailure. Meantime, the software receiver sends a message of ”acquisition unsuccessful”.Combining GPS data with certain duty cycle DME/TACAN signal, Acquisition thresholdis defined to be the receiver tracking mode C/N0,eff , below this certain DME/TACANduty cycle, the receiver can acquire data in presence of interference. When combinedDME/TACAN signal’s duty cycle is larger than this certain duty cycle, then the receiverdoesn’t acquire data any more, and will send the message of ”acquisition unsuccessful”.The second case is, the DME/TACAN signal appears when the receiver has already trackeda pure GPS signal. Then the tracking threshold is the receiver tracking mode C/N0,eff atcertain DME/TACAN duty cycle, above which the receiver begins to lose tracking after theappearance of this DME/TACAN interference signal. The software receiver has a presettracking threshold, C/N0,eff = 40.5 dBHz, which is the European minimum operationalvalue for Galileo receiver [5]. The receiver will lose track when the instantaneous C/N0,eff
is below 40.5 dBHz. So the tested tracking threshold should be above this value. In ourtesting, we generate DME/TACAN signals with different duty cycles, and combine themwith GPS signal to find these two thresholds. The peak power to noise density ratio (p/N)of generated DME/TACAN signal’s components are assumed to be uniformly distributedwithin [70 90] dBHz.
Fig. 5.1 shows the testing results of the software receiver acquisition threshold deter-mination. When the pulse blanker is not implemented into the software receiver, theacquisition threshold is 42.6440 dB/9%. The software receiver can not acquire data whenDME/TACAN’s duty cycle is larger than 9%. When implementing the pulse blanker, thesoftware receiver can keep on acquiring data at a lower C/N0,eff when the DME/TACAN’sduty cycle is up to 15%. And the acquisition threshold is 40.6509 dBHz/15%.
Fig. 5.2 shows the tracking threshold determination with and without the pulse blanker.
36

5.1 Pulse Blanker Influence on the GNSS Software Receiver Under DME/TACAN Interference Environment
0 2 4 6 8 10 12 14 16 18 2039
40
41
42
43
44
45
Duty Cycle (%)
C/N
(dB
)
Software Receiver Acquisition Threshold Testing (with and without blanker)
Without blanker
With blanker
Acquisition Unsuccessful Region (without blanker)
Acquisition UnsuccessfulRegion (with blanker)
Figure 5.1: Acquisition threshold testing, when the receiver is with and without pulseblanker (DME/TACAN power level is [70 90] dBHz)
0 2 4 6 8 10 12 14 16 18 2039
40
41
42
43
44
45
C/N
(dB
)
Duty Cycle (%)
Software Receiver Tracking Threshold Testing (with and without blanker)
Without blanker
With blanker
Loss of Track Region (without blanker)
Loss of Track Region(with blanker)
Figure 5.2: Tracking threshold testing, when the receiver is with and without pulse blanker(DME/TACAN power level is [70 90] dBHz)
The tracking threshold and C/N0,eff without the pulse blanker is 42.3812 dBHz/10%, and41.1617 dBHz/15% when applying the pulse blanker. Although there is a preset trackingthreshold of 40.5 dBHz in the software receiver, our testing results are different when withand without blanker, and both results are larger than 40.5 dBHz. The reason is, whenthe receiver enters tracking mode, the variation of C/N0,eff is around 0.4 dB (withoutblanker) and 0.1 dB (with blanker). So it is easier to get instantaneous C/N0,eff below
37

5 GNSS Software Receiver Performance Testing Under DME/TACAN Pulsed Interference Environment
40.5 dBHz without blanker, even though the mean C/N0,eff value is above 40.5 dBHz. Itshows that the pulse blanker can decrease the variation of C/N0,eff to insure the softwarereceiver working under lower C/N0,eff .
The thresholds are summarized in Table 5.2. Clearly, when pulse blanker is implemented,both acquisition and tracking thresholds are smaller, and the DME/TACAN duty cy-cles are larger. The software receiver performance under DME/TACAN pulsed inter-ference environment is improved when applying the pulsed blanker, and can cope withDME/TACAN pulsed environment with a duty cycle up to 15%. While, pulse blanker doesnot show much influence on the value of C/N0,eff in presence of strong DME/TACANpulses.
Acquisition threshold (dBHz) Tracking threshold (dBHz)/DME/TACAN duty cycle (%) /DME/TACAN duty cycle (%)
Without blanker 42.6440/9% 42.3812/10%With blanker 40.6509/15% 41.1617/15%
Table 5.2: Pulse blanker influence on acquisition and tracking thresholds (DME/TACANpower level is [70 90] dBHz)
5.2 DME/TACAN Signal Power Level Influence on GNSSSoftware Receiver Performance
Figure 5.3: DME/TACAN power levels’ influence on software receiver performance(dc=3%)
38
5.2 DME/TACAN Signal Power Level Influence on GNSS Software Receiver Performance
When the pulse blanker is not implemented into the software receiver, the software re-ceiver will lose the ability to acquire data in presence of DME/TACAN pulses with largerpeak power level, even though the duty cycle is small. As shown in Fig. 5.3 (blue curve),even at same duty cycle (3%), the software receiver can not acquire data when the powerlevel of the DME/TACAN pulses is above 100 dBHz. In other words, DME/TACANpower level affects the acquisition threshold of software receiver when pulse blanker isnot implemented. When we add the pulse blanker into the software receiver, power levelwill not affect software receiver’s C/N0,eff that much (red curve in Fig. 5.3). In otherwords, DME/TACAN signal power level will not affect the software receiver’s acquisitionthreshold in presence of the pulse blanker.
Power level does not show much influence on the receiver C/N0,eff in the case thatDME/TACAN pulses appear when the receiver is in tracking mode, no matter the pulseblanker is implemented or not (as shown in Fig. 5.3, the case without blanker is shown ingreen curve, and blank curve represents the case with blanker). So DME/TACAN’s powerlevel will not affect tracking threshold of the software receiver.
39

6 Discussion of the Simulation Results
In this chapter, results obtained by the MATLAB simulation are compared with the valuesin [1] and the theoretical calculations. The MATLAB simulated degradations are smallerthan both theoretical calculations and the values in [1]. Analysis of the results’ differenceis given in Chap. 6.1 and Chap. 6.2.
6.1 Comparison Between the MATLAB Simulation Results andthe Theoretical Calculations
The MATLAB simulation results and the theoretical calculations of the DME/TACANpulsed interference impact on E5a/L5 band for ”Hot-spot” mode are listed in the followingtable (Table 6.1).
E5a/L5 10 kft E5a/L5 40 kftTheory Simulation Theory Simulation
Bdc(%) 19.48 14.56 39.19 19.08RI 0.0414 0.0400 0.2307 0.1333
deg(C/N0,eff ) (dB) −1.1171 −0.8537 −3.0619 −1.4625
Table 6.1: Comparison between the MATLAB simulation results and the theoretical cal-culations in E5a/L5 band
In the MATLAB simulation, following situations are considered when obtain RI and Bdc:
• Strong DME/TACAN pulse (above blanker pulses) overlaps
• Residual portion of Gaussian DME/TACAN pulse after the pulse blanking
• Erasure of weak DME/TACAN pulses by strong pulse blanking
• Erasure of residual portion of strong pulses by strong pulse blanking
• Weak DME/TACAN pulse and Residual portion of strong DME/TACAN pulse over-laps
• Carrier variation
In theoretical approach, when calculating the effective carrier to noise C/N0,eff degrada-tion at the output of the GNSS receiver correlator, only the first two cases are considered,
40
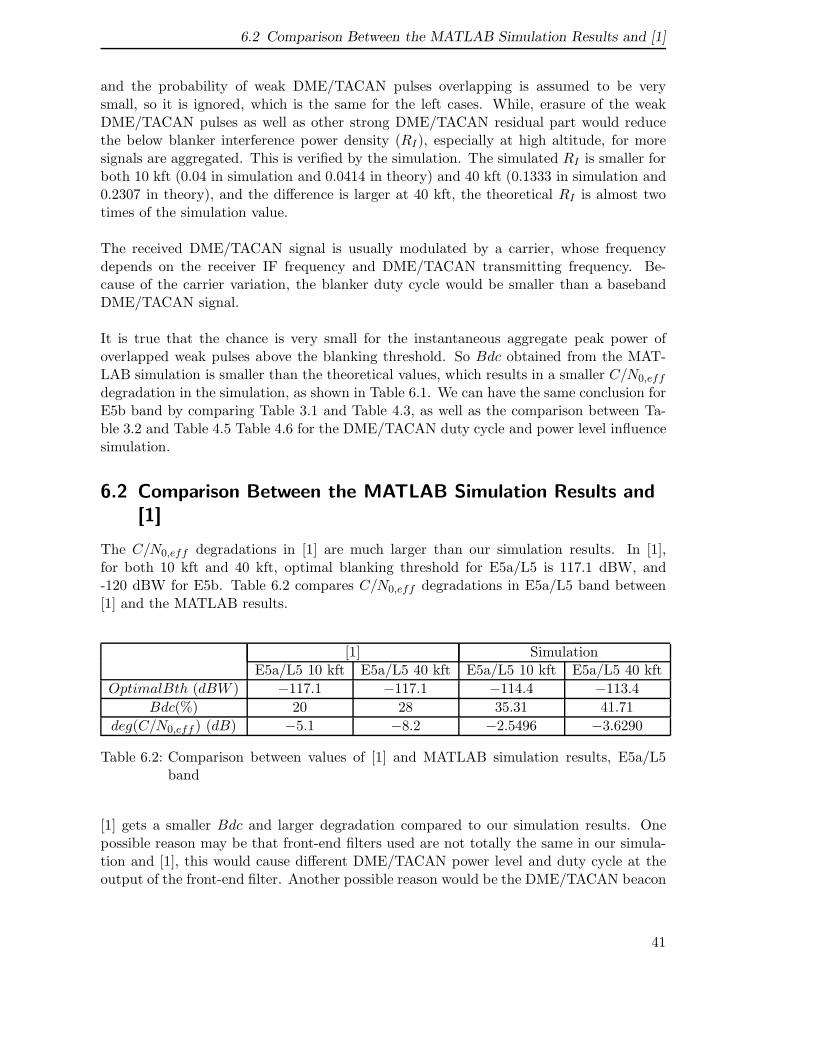
6.2 Comparison Between the MATLAB Simulation Results and [1]
and the probability of weak DME/TACAN pulses overlapping is assumed to be verysmall, so it is ignored, which is the same for the left cases. While, erasure of the weakDME/TACAN pulses as well as other strong DME/TACAN residual part would reducethe below blanker interference power density (RI), especially at high altitude, for moresignals are aggregated. This is verified by the simulation. The simulated RI is smaller forboth 10 kft (0.04 in simulation and 0.0414 in theory) and 40 kft (0.1333 in simulation and0.2307 in theory), and the difference is larger at 40 kft, the theoretical RI is almost twotimes of the simulation value.
The received DME/TACAN signal is usually modulated by a carrier, whose frequencydepends on the receiver IF frequency and DME/TACAN transmitting frequency. Be-cause of the carrier variation, the blanker duty cycle would be smaller than a basebandDME/TACAN signal.
It is true that the chance is very small for the instantaneous aggregate peak power ofoverlapped weak pulses above the blanking threshold. So Bdc obtained from the MAT-LAB simulation is smaller than the theoretical values, which results in a smaller C/N0,eff
degradation in the simulation, as shown in Table 6.1. We can have the same conclusion forE5b band by comparing Table 3.1 and Table 4.3, as well as the comparison between Ta-ble 3.2 and Table 4.5 Table 4.6 for the DME/TACAN duty cycle and power level influencesimulation.
6.2 Comparison Between the MATLAB Simulation Results and[1]
The C/N0,eff degradations in [1] are much larger than our simulation results. In [1],for both 10 kft and 40 kft, optimal blanking threshold for E5a/L5 is 117.1 dBW, and-120 dBW for E5b. Table 6.2 compares C/N0,eff degradations in E5a/L5 band between[1] and the MATLAB results.
[1] SimulationE5a/L5 10 kft E5a/L5 40 kft E5a/L5 10 kft E5a/L5 40 kft
OptimalBth (dBW ) −117.1 −117.1 −114.4 −113.4Bdc(%) 20 28 35.31 41.71
deg(C/N0,eff ) (dB) −5.1 −8.2 −2.5496 −3.6290
Table 6.2: Comparison between values of [1] and MATLAB simulation results, E5a/L5band
[1] gets a smaller Bdc and larger degradation compared to our simulation results. Onepossible reason may be that front-end filters used are not totally the same in our simula-tion and [1], this would cause different DME/TACAN power level and duty cycle at theoutput of the front-end filter. Another possible reason would be the DME/TACAN beacon
41
6 Discussion of the Simulation Results
database used. More than 120 DME/TACAN beacons are observed simultaneously whenthe victim aircraft flying at 40 kft, while in our simulation, only 87 beacons are in theaircraft’s insight region.
42

7 Summary
Results obtained from the MATLAB simulation (Chap. 4.1.2.1 and Chap. 4.1.2.2) showthat DME/TACAN pulsed interference has stronger impact on GNSS receiver when theaircraft flying at a higher altitude on both E5a/L5 and E5b bands, because more in-bandDME/TACAN beacons transmit interference signals within the aircraft insight region. Sothat blanker duty cycle is larger and more below blanker power is left at the output ofpulse blanker. Increasing both RFI parameters Bdc and RI at high altitude result inlarger C/N0,eff degradations at 40 kft than 10 kft. What is more, front-end filter also af-fects simulation result. Transition band of the front-end filter allows more DME/TACANsignals enter into GNSS receiver, although these out-band DME/TACAN signals are at-tenuated.
In ”Duty cycle” mode (Chap. 4.2), when simulating the DME/TACAN pulsed signals withthe same peak power levels, higher C/N0,eff degradation is caused by the DME/TACANsignal with higher duty cycle. The DME/TACAN signals’ peak power level also af-fect C/N0,eff degradations. Simulation results show that higher peak power level ofDME/TACAN signal causes larger value of Bdc and RI , which leads to higher C/N0,eff
degradations.
The software receiver’s acquisition and tracking thresholds are summarized in Table 5.2.Under strong pulsed DME/TACAN interference environment, the software receiver’s per-formance is improved when applying a pulse blanker, and can cope with interferencesignals with duty cycle up to 15%. Acquisition and tracking can be proceeded at a smallerC/N0,eff and a larger DME/TACAN duty cycle. What is more, pulse blanker helps soft-ware receiver to cope with DME/TACAN environment with very high power level whenacquiring data. DME/TACAN pulses’ power level only influences the acquisition of thesoftware receiver without pulse blanker. And there is little influence on the tracking ofthe software receiver, no matter pulse blanker is implemented or not.
Improvement suggestions
Front-end filters used in our simulation are assumed to be ideal or to fulfill the minimumrequirement of GNSS receiver (simulated front-end filter). The DME/TACAN impact onGNSS receiver may be assessed with more practical front-end filters.
Normalized antenna patterns for DME and TACAN transmitter are assumed to be thesame. This is because the differences between the two are quite small at low elevationangles. For simplicity, we use the same antenna pattern. To obtain more accurate simu-lation results, two separate antenna patterns could be used.
43
7 Summary
The database of DME/TACAN ground beacons in our simulation does not contain PRFof each beacon. So we assume it is 2700 ppps for DME and 3600 ppps for TACAN. Morerealistic database is needed to simulate the DME/TACAN pulsed interference environ-ment at the European hot spot with high flight height.
Influence of other GNSS receiver components is not considered in this thesis, such asADC/AGC. ADC with different bit resolutions affects the output DME/TACAN quan-tized samples. Adaptive ADC/AGCs with different response time are also not considered.What is more, mitigation and detection techniques also affect C/N0,eff at the correlatoroutput, while, they are not under consideration in this thesis.
44

APPENDIX
45

A MATLAB Program
A.1 ”Hot-spot” Mode Simulation Steps
• Define simulation parameters in test.m, run test.m to generate desired DME/TACANsignal.
• Call function blanker to obtain the effective C/N0 degradation analysis
• Read the value of ”AV Power” returned in the MATLAB command window (dBm).It is the average power of the simulated DME/TACAN signal, which would be usedas the value of the ”Amplitude” on ”Agilent E8267D” platform.
• Call function IQ to change the format of MATLAB generated DME/TACAN signalto IQ data, which would be used by ”Agilent E8267D”. Then call hardware connectionto load DME/TACAN IQ data into hardware signal generator ”Agilent E8267D”,and activate ”Agilent E8267D” to generating DME/TACAN signals;
One more simulation is taken on E5a/L5 and E5b. Simulated front-end filters are used inour simulation. The generated DME/TACAN signal in step 1 is then convolved with thefilter taps to obtain the filtered DME/TACAN signal received by the GNSS receiver.
A.2 ”Duty cycle” Mode Simulation Steps
• Define simulation parameters in test2.m, run test2.m to generate desired DME/TACANsignal.
• Call function blanker to obtain the effective C/N0 degradation analysis
• Read the value of ”AV power” returned in the MATLAB command window (dBm).It is the average power of the simulated DME/TACAN signal, which would be usedas the value of the ”Amplitude” on ”Agilent E8267D” platform.
• Call function IQ to change the format of MATLAB generated DME/TACAN signalto IQ data, which would be used by ”Agilent E8267D”. Then call hardware connectionto load DME/TACAN IQ data into hardware signal generator ”Agilent E8267D”,and activate ”Agilent E8267D” to generating DME/TACAN signals;
46

A.3 Functions Instructions
Figure A.1: ”Hot-spot” mode program structure
A.3 Functions Instructions
test.mVictim aircraft position (longitude, latitude, height), IF frequency, observed time intervaland testing band is defined in test.m. Basic DME/TACAN pulse pair parameters arealso defined in test.m. After running test.m, desired DME/TACAN signal is generatedand saved in ”Hotspot.mat” as well as optimal blanker duty cycle and DME/TACAN av-erage power, and a series of simulation results are returned in MATLAB command window.
receive.mGenerating received DME/TACAN composite signal based on input DME beacon databaseand testing band name. It returns the bandwidth of testing band, GNSS signal carrierpower, and received DME/TACAN signals as well as a matrix of received peak powers andPRF of DME/TACAN ground beacons. Received DME/TACAN signal is stored in outputvariable S receive. Each role of S receive represents received composite DME/TACANsignal at one aircraft position. The number of roles equals to the number of aircraft posi-tions.
47

A MATLAB Program
Figure A.2: ”Duty cycle” mode program structure
DME.matGround DME/TACAN beacon database is stored in DME.mat. It includes DME/TACANbeacons transmitting in X-mode. The beacon information format is
Longitude Latitude Altitude (km) TransmittingFrequency (Hz) EIRP (W ) PRF (ppps)
48

A.3 Functions Instructions
band.mBandwidth, frequency interval and carrier power are defined in band.m. It acts as a rect-angular frequency response front-end. Signals in the passband (bandwidth) are passedwithout attenuation, signals outside the passband are blocked.
S pulse.mNormalized single DME/TACAN baseband signal is generated in S pulse.m. PRF andDME/TACAN transmitting frequency are input parameters of S pulse.m. The outputvariable is one row vector with maximum value of ”1”.
DME pulse.mBasic DME/TACAN pulse pair is generated in DME pulse.m.
GNSS gain.mVictim aircraft GNSS receiver antenna gain pattern is defined in GNSS gain.m.
DME gain.mDME/TACAN ground beacon normalized antenna gain pattern is defined in DME gain.m.
test2.mBasic DME/TACAN pulse pair parameters, observed time interval, IF frequency, DME/TACANpower distribution, DME/TACAN beacon transmitting frequency distribution and dutycycle are defined in test2.m. After running test2.m, desired DME/TACAN signal is gener-ated and saved in ”dutycycle.mat” as well as optimal blanker duty cycle and DME/TACANaverage power, and a series of simulation results are returned in MATLAB command win-dow.
DME mode2.mReceived DME/TACAN signal in Mode 2 with given duty cycle is generated in DME mode2.m.Received DME/TACAN signals’ peak power distribution, transmitting frequency andduty cycle are as input parameters. Received DME/TACAN signal, carrier power andbandwidth of testing band as well as a matrix of received peak powers and PRF ofDME/TACAN ground beacons are as output variables.
wave2duty.mThis function is used to calculate single DME/TACAN signal’s duty cycle. Input pa-rameters are single DME/TACAN signal and threshold for deciding this DME/TACANsignal’s duty cycle. Output waveform sets samples of input DME/TACAN signals withamplitude above threshold to be ”1”, else to be ”0”. Output waveform has the samelength of DME/TACAN signal.
blanker.mEffective carrier to noise ratio degradation is evaluated in blanker.m. And it returns theoptimal threshold and DME/TACAN signal average power (dBm).
49

A MATLAB Program
hardware connection.mhardware connection.m is used to connect PC with hardware signal generator ”AgilentE8267D” and load input signal into signal generator.
IQ.mIQ.m is used to change the input data’s format adapt to the hardware signal generator”Agilent E8267D”.
theory.mTheoretical effective carrier to noise ratio degradation for both ”Hot-spot” and ”Dutycycle” modes. is calculated in theory.m.
50

B Agilent E8267D PSG Signal Generator
The steps for generating DME/TACAN interference signal by Agilent E8267D PSG signalgenerator are as follows.
• Generating DME/TACAN signal by using ”Hotspot” mode or ”Duty cycle” modeMATLAB files.
• Use IQ.m to change the DME/TACAN data to IQ data and quantized IQ data with16 bits.
• Use hardware connection.m to load the quantized IQ data to volatile memory ofsignal generator from user PC.
• Adjust the ”Amplitude” and ”Frequency” on the control panel of Agilent E8267DPSG signal generator. The value of ”Amplitude” is the average power of generatingDME/TACAN signal. The value of ”Frequency” is the IF or RF frequency, forGalileo E5a is 1176.45 MHz, 1207.14 MHz for E5b, (or 20 MHz for IF analysis),4.092 MHz for L1 band used for software receiver.
Connecting Agilent E8267D PSG signal generator to oscilloscope or spectrum analyzer,DME/TACAN signals generated by software (MATLAB) is then as the input of signalgenerator Agilent E8267D. When observed from oscilloscope, baseband DME/TACANinterference signal and the modulated DME/TACAN pulse pair shape generated by signalgenerator are shown in following figures.
Figure B.1: Baseband DME/TACAN pulses generated by signal generator Agilent E8267D
51

B Agilent E8267D PSG Signal Generator
Figure B.2: Modulated DME/TACAN pulse pair generated by signal generator Agi-lent E8267D
System structure described in Fig. B.3 can be used to test the C/N0 degradation causedby DME/TACAN only as well as the GNSS receiver performance. Agilent E8267D is usedto generating DME/TACAN interference signals exactly same as the software (MATLAB)simulated signals. Then the generated pulsed DME/TACAN signal together with theGNSS signal will be put into the hardware simulator which gives the feed back of theGNSS receiver performance.
Figure B.3: Hardware simulation system structure
52

Bibliography
[1] Frederic Bastide. Analysis of the Feasibility and Interests of Galileo E5a/E5b and GPSL5 Signals for Use with Civil Aviation. PhD thesis, DOCTEUR DE L’INSTITUTNATIONAL POLYTECHNIQUE DE TOULOUSE, 2004.
[2] Michael S. Braasch and A. J. Van Dierendonck. GPS Receiver Architectures andMeasurements. Proceedings of the IEEE, 87(1):48–64, January 1999.
[3] Dan Bobyn Michael Tran-Taehwan Kim Christopher Hegarty, A.J. Van Dierendonckand Joe Grabowski. Suppression of Pulsed Interference through Blanking.
[4] Department of Transportation, Federal Aviation Administration. U.S. National Avi-ation Standard for the VOR/DME/TACAN systems.
[5] EUROCAE WG42. Interim Minimum Operational Performance Specification forGalileo Satellite Positioning Receiver, Version 0.21.
[6] Christophe Macabiau Frederic Bastide, Eric Chatre and Benoit Roturier. GPSL5 And GALILEO E5a/E5b Signal-to-Noise Density Ratio Degradation Due toDME/TACAN Signals: Simulations and Theoretical Derivation. ION NTM, 2004,January 2004.
[7] Jean-Luc Issler Jean-Christophe Martin Philippe Erhard Rafael Lucas-RodriguezGuenter W. Hein, Jeremie Godet and Tony Pratt. Status of Galileo Frequency andSignal Design. In Galileo Signal Task Force of the European Commission, Brussels,2002.
[8] ICAO. TABLE COM-3,INTERNATIONAL AND NATIONAL FREQUENCY AS-SIGNMENTS IN THE BANDS 08-118, 960-1215 AND 5031-5091 MHz, EURO-PEAN AREA, July 2005.
[9] Myron Kayton and Walter R.Fried. Avionics Navigation Systems, second edition.John Wiley @ Sons, INC.
[10] Pratap Misra and Per Enge. Global Positioning System: Singles, Measurements, andPerformance, Second Edition. Ganga-Januma Press, 2006.
[11] RTCA/DO-292. Assessment of Radio Frequency Interference Relevant to the GNSSL5/E5A Frequency Band.
53
Glossary
A/D the analog-to-digitalADC analog-to-digital converterAGC automatic gain controllerARNS Aeronautical Radio Navigation ServicesBdc blanker duty cycleBOC binary offset carrierBPSK binary phase shift keyingCDMA code division multiple accessdB decibeldBW decibel WattsDME Distance Measuring EquipmentEUROCAE European Organization for Civil Aviation EquipmentFAA Federal Aviation AdministrationGHz GigahertzGNSS Global Navigation Satellite SystemGPS Global Positioning SystemHz HertzIF Intermediate FrequencykW kilowattLO local oscillatorLPF low-pass filterMcps mega chips per secondMHz MegaHertzms millisecondsNH Neuman-Hoffmanppps pulse pair per secondPRN pseudo-random noisePRF pulse repetition frequencyQPSK quadrature phase shift keyingRF radio frequencyRFI radio frequency interferenceSoL safety-of-lifeSNR signal-to-noise ratioTACAN Tactical Air NavigationVOR VHF Ominidirectional Range
54