Embed Size (px)
Citation preview

Simulation on Aggregate InterferenceSimulation on Aggregate Interferencefrom Wireless Access Systemsfrom Wireless Access Systems
including RLANs into Earthincluding RLANs into EarthExploration-Satellite Service in theExploration-Satellite Service in the
5250-5350 MHz Band5250-5350 MHz Band
Spectrum Engineering BranchSpectrum Engineering Branch
Industry CanadaIndustry Canada
March, 2002March, 2002
IEEE S802.16.2a-02/112002-03-08

22
BACKGROUNDBACKGROUND
33
Current Canada/United States/CEPT provisions forCurrent Canada/United States/CEPT provisions forRLAN applicationsRLAN applications
57255150 5250 54605350 56505470 5570 5850 MHz
LE-LANs permitted through
Footnote C39A
LE-LANs permitted through
Footnote C39A
UNII devices permitted
under Part 15 rules
UNII devices permitted
underPart 15
CEPT MOBILE SERVICE:RLAN devices
MOBILE SERVICE:RLAN devices

44
Current ITU AllocationCurrent ITU Allocation
FSS(E-s)
EESS
MARITIME RADIONAV
5725 MHz5150 5250 54605350 56505470
ARNS ARNS
RADIOLOCRadiolocationRADIOLOC
Amateur
SRS Srs(deep space)
RADIONAV
5570
Note: ALL CAPS=PRIMARY ALLOCATION

55
WRC-03 considerationWRC-03 consideration
MS/ms – RLANs MS/ms – RLANs
FS/fs – FWA (R3)
EESS
FSS(E-s)
EESS
MARITIME RADIONAV
5725 MHz5150 5250 54605350 56505470
ARNS ARNS
RADIOLOCRadiolocationRADIOLOC
Amateur
SRS Srs(deep space)
RADIONAV
5570
SRS
RADIOLOCATION

66
5850 MHz
CEPT
5725 MHz
MS/ms – RLANs MS/ms – RLANsFS/fs – FWA
(R3)
EESS
FSS(E-s)
EESS
MARITIME RADIONAV
5150 5250 54605350 56505470
ARNS ARNS
RADIOLOCRADIOLOC
Amateur
SRSSrs
(deep space)
RADIONAV
5570
SRS
RADIOLOCATION
LE-LAN: Footnote C39A LE-LANs Footnote C39A
UNII : Part 15 rules UNII: Part 15
MS MS
Overall Comparison of Allocations and provisions for RLANsOverall Comparison of Allocations and provisions for RLANsand other services in the 5GHz rangeand other services in the 5GHz range

77
Current Canada/United States/CEPT technical rules forCurrent Canada/United States/CEPT technical rules forRLAN applicationsRLAN applications
57255150 5250 54605350 56505470 5570 5850 MHz
CEPT Indoor OnlyEIRP = 200 mW
ATPC, DFS
Indoor/OutdoorEIRP = 1WATPC, DFS
Indoor Only
EIRP = 200 mW
Indoor/OutdoorTx Power=1W
EIRP=4W
Indoor/OutdoorTx Power =250 mW
EIRP = 1W
Indoor OnlyEIRP =200 mW
Indoor/OutdoorTx Power= 1W
EIRP= 4W
Indoor/OutdoorTx Power= 250 mW
EIRP = 1W

88
Characteristics of EESSCharacteristics of EESS

99
Characteristics of EESS in the 5GHz rangeCharacteristics of EESS in the 5GHz range
�� Radar Radar scatterometersscatterometers�� useful for determining the roughness of largeuseful for determining the roughness of large
objects such as ocean wavesobjects such as ocean waves
�� Radio altimetersRadio altimeters�� used to determine the height of the Earth's landused to determine the height of the Earth's land
and ocean surfacesand ocean surfaces
�� Imaging radars (synthetic aperture radars)Imaging radars (synthetic aperture radars)�� used to produce high resolution images of land andused to produce high resolution images of land and
ocean surfaces.ocean surfaces.
�� In this analysis only one of the imaging radarsIn this analysis only one of the imaging radars(SAR 4-most sensitive) and altimeters were(SAR 4-most sensitive) and altimeters wereexaminedexamined
MS/ms – RLANs
FS/fs – FWA (R3)
EES
5250 5350 MHz
RADIOLOC
SRS

1010
Characteristics of Characteristics of SARsSARs in the 5 GHz range in the 5 GHz range
-128.73 dBW-119.84 dBW-119.84 dBWInterference Threshold
-122.73 dBW-113.84 dBW-113.84 dBWNoise Power
46 MHz356.5 MHz356.5 MHzReceiver Bandwidth
76.5 km2225.3 km2164.3 km2Footprint
4.62 dB4.62 dB4.62 dBReceiver Noise Figure
20-55 deg fromnadir
20-55 deg fromnadir
20-38 deg from nadirAntenna Orientation
40 MHz310 MHz310 MHzPulse Bandwidth
1700 W1700 W4800 WPeak Radiated Power
5300 MHz5405 MHz5405 MHzFrequency
57 degrees57 degrees57 degreesOrbital inclination
400 km(circular)
400 km (circular)600 km (circular)Orbital Altitude
SAR 4SAR 3SAR 2Parameter
Source: ITU-R Doc 8A-9B/98

1111
Characteristics of outdoorCharacteristics of outdoorWAS/RLANsWAS/RLANs

1212
Outdoor WAS in the 5250-5350 MHz RangeOutdoor WAS in the 5250-5350 MHz Range
100%Active Ratio
17 dBScattering Coefficient
250 mWTransmitter Power
1.5 kmCell radius
0 degreesAntenna tilt
Implicit within proposed EIRP maskto be shown later
Antenna Gain pattern — elevationplane
Omnidirectional(for simulation purposes)
Antenna Gain Pattern — azimuth plane
20 MHzBandwidth
5.3 GHzFrequency
ValueParameter

1313
EIRP mask used in simulationEIRP mask used in simulation
-14 -14 dBWdBW/MHz /MHz for 0for 0°° ≤≤ θθ < 5 < 5 °°-14 -0.711 (-14 -0.711 (θθ -5) -5) dBWdBW/MHz/MHz for 5for 5°° ≤≤ θθ < 40 < 40 °°-38.9 -1.222(-38.9 -1.222(θθ-40) -40) dBWdBW/MHz/MHz for 40for 40°° ≤≤ θθ < 45 < 45 °°-45 -45 dBWdBW/MHz/MHz for for θθ > 45 > 45 °°
θθ=elevation angle above the local horizon=elevation angle above the local horizonFor For θθ <0, EIRP= -13 <0, EIRP= -13 dBWdBW/MHz/MHz
WAS EIRP mask above local horizon
-48-46
-44
-42-40
-38-36
-34-32
-30
-28-26
-24-22
-20
-18-16
-14-12
-10-8
-6
-4-2
0
0 5 10 15 20 25 30 35 40 45 50 55 60 65 70 75 80 85 90
elevation above local horizon (degrees)
EIR
P (d
BW
/MH
z)

1414
Characteristics of indoorCharacteristics of indoorWAS/RLANsWAS/RLANs

1515
Characteristics of Indoor WAS systemsCharacteristics of Indoor WAS systems
100%100%Active Ratio
18 dB18 dBBuilding loss
200 mW250 mWTransmitterpower
0 dBi0 dBiAntenna gain
Isotropic (for simulationpurposes)
Isotropic (for simulationpurposes)
Antenna
20 MHz20 MHzBandwidth
5.3 GHz5.3 GHzFrequency
ValueValueParameter
Indoor Type 2Indoor Type 1

1616
Distribution ofDistribution ofWAS/RLANsWAS/RLANs

1717
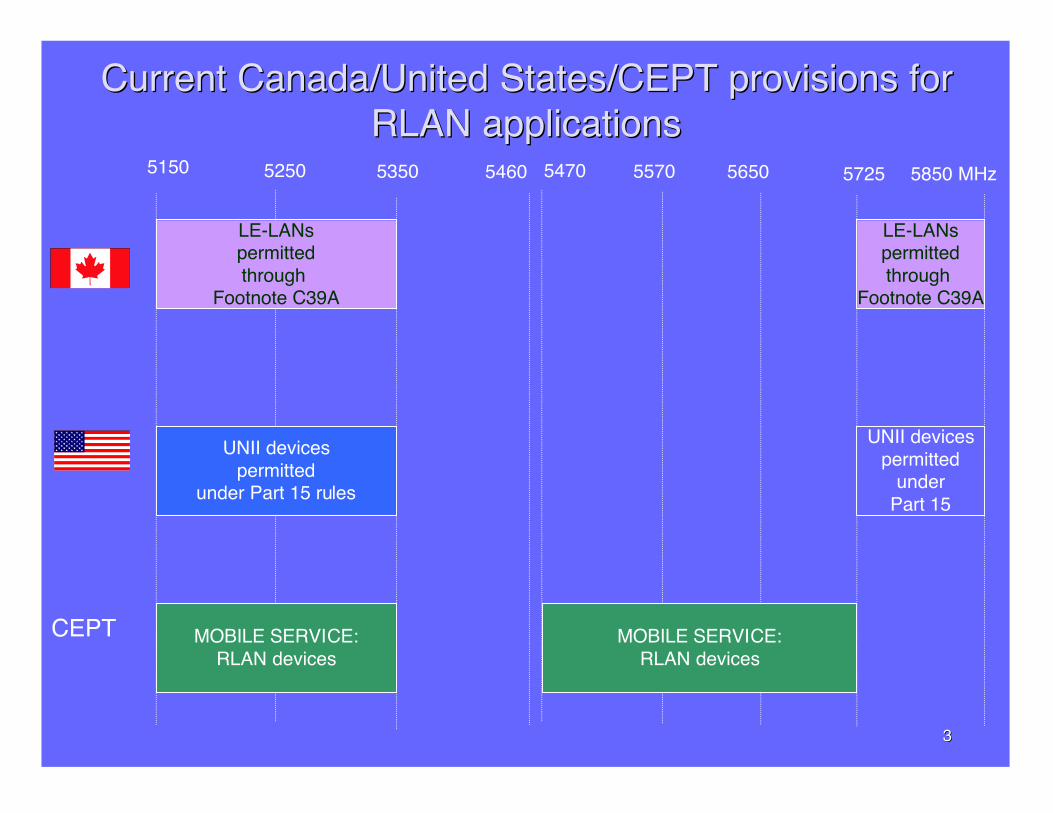
Distribution of WAS/RLANsDistribution of WAS/RLANs
�� Based on population data from the UN, cell radius ofBased on population data from the UN, cell radius ofWAS/RLANs and perceived deployment rate.WAS/RLANs and perceived deployment rate.Deployment factor of 30% was used. See ITU-R Doc.Deployment factor of 30% was used. See ITU-R Doc.8A-9B/838A-9B/83
�� City A (extremely large city)City A (extremely large city)�� Population = 17.6 millionPopulation = 17.6 million�� Include effects of stations operating in sub-urban areasInclude effects of stations operating in sub-urban areas
surrounding the city as well as to simulate effects of aggregatesurrounding the city as well as to simulate effects of aggregateinterference from stations operating in near-by cities, the radiusinterference from stations operating in near-by cities, the radiuswas extended from 54 km to approximately 81 km.was extended from 54 km to approximately 81 km.
�� City B (medium size city)City B (medium size city)�� Population = 3.7 millionPopulation = 3.7 million�� Radius of this city = approximately 12 km. An actual radius of 18Radius of this city = approximately 12 km. An actual radius of 18
km was used to account for effects from stations operating inkm was used to account for effects from stations operating insub-urban areas as well as effects from near-by cities.sub-urban areas as well as effects from near-by cities.
1818
Distribution of WAS/RLANsDistribution of WAS/RLANs
0.0660.0660.066Density (number of activesystems/km2)
6481312213122Deployment Area (km2)
43870870Number of active systems
Medium cityCity B
Large cityCity A
Large cityCity A
Outdoor
5.755.755.75Density (number of activesystems/km2)
76.576.576.5Deployment Area (km2)
440440440Number of active systems
Indoor Type 1Indoor Type 2Indoor Type 1Indoor
Case 3Case 2Case 1

1919
MethodologyMethodology
�� Within each cell:Within each cell:�� one station transmitting at all timesone station transmitting at all times
�� One-third of all transmitters has an additional scattering coefficientOne-third of all transmitters has an additional scattering coefficientof 17 dBof 17 dB
�� 3dB polarization loss for outdoor systems3dB polarization loss for outdoor systems�� 0dB polarization loss for indoor systems0dB polarization loss for indoor systems�� no atmospheric attenuation is assumedno atmospheric attenuation is assumed�� The satellite was simulated to run for a period of 30 days, the periodThe satellite was simulated to run for a period of 30 days, the period
of time in which the EESS would receive maximum interference wasof time in which the EESS would receive maximum interference wasthen revisited with time steps of 200 milliseconds. The resultsthen revisited with time steps of 200 milliseconds. The resultsshown here represent a period of time in which the EESS would beshown here represent a period of time in which the EESS would bevisible by the WAS systems in a single orbit in which EESS wouldvisible by the WAS systems in a single orbit in which EESS wouldexperience the maximum possible interference from the aggregateexperience the maximum possible interference from the aggregateinterference of WAS.interference of WAS.
�� Free space propagationFree space propagation�� Building loss = 18 dBBuilding loss = 18 dB

2020
SimulationSimulation

2121
Results of simulationResults of simulation

2222
Aggregate interference from indoor and outdoorAggregate interference from indoor and outdoorWAS into SAR 4 at 20 degrees from nadirWAS into SAR 4 at 20 degrees from nadir
Aggregate interference from WAS into SAR 4 at 20degree from nadir
-200
-190
-180
-170
-160
-150
-140
-130
-120
-110
-100
0 60000 120000 180000 240000 300000 360000 420000 480000 540000 600000 660000 720000
milliseconds
I d
BW
/MH
z I Criteria
Case 1
Case 2
Case 3
Case 1 = -142.9 dBW/MHzCase 2 = -143.8 dBW/MHzCase 3 = -143.9 dBW/MHz
Case 1: Iaggregate exceeds Icriteria for approximately 1.6 secondsCase 2: I aggregate exceeds I criteria for approximately 1.4 secondsCase 3: I aggregate exceeds I criteria for approximately 1 second
Case 1
Case 2
Case 3

2323
Aggregate interference from indoor and outdoorAggregate interference from indoor and outdoorWAS into SAR 4 at 55 degrees from nadirWAS into SAR 4 at 55 degrees from nadir
Aggregate Interference from WAS into SAR4 operating at 55 degrees from nadir
-200
-190
-180
-170
-160
-150
-140
-130
-120
-110
-100
0 60000 120000 180000 240000 300000 360000 420000 480000 540000 600000
millisecond
I dB
W/M
Hz
criteria Case 1
Case 2 Case 3
Case 1: Imax = -138.3 dBW/MHzCase 2: Imax = -139.1 dBW/MHzCase 3: Imax =-138.7 dBW/MHz
Case 1 and Case 2: Iaggregate exceeds Icriteria for approximately 3.2 secondsCase 3: Icriteria is exceeded for approximately 2.8 seconds
Icriteria
Case 2
Case 1
Case 3
2424
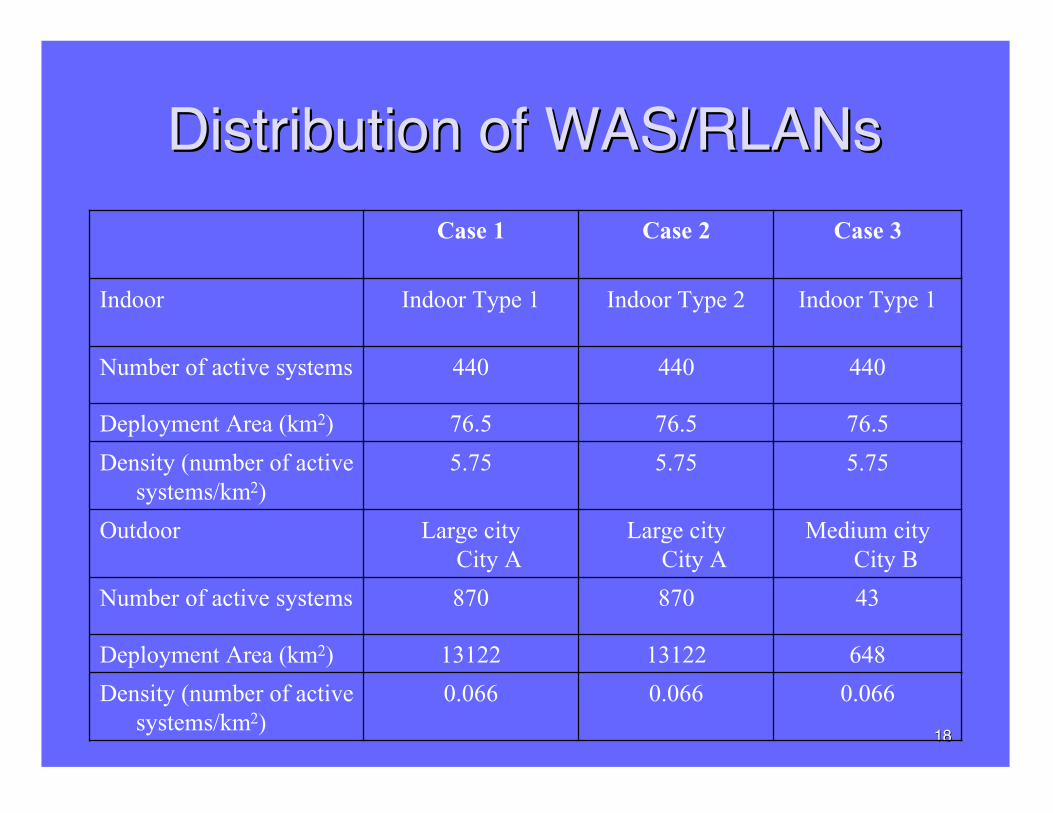
Aggregate interference from indoor andAggregate interference from indoor andoutdoor WAS into an altimeteroutdoor WAS into an altimeter
Aggregate interference from WAS into altimeter
-200
-190
-180
-170
-160
-150
-140
-130
-120
0 600000 1200000 1800000 2400000 3000000
milliseconds
I (d
BW
/MH
z)
I criteria
Case 1

2525
Summary of ResultSummary of Result
02.8 sec3.2 sec3.2 sec1 sec1.4 sec1.6 secDuration of time inwhich Interference> Interferencecriterion
---138.7-139.1-138.3-143.9-143.8-142.9Maximum interference(dBW/MHz)
-143.05-145.36-145.36-145.36-145.36-145.36-145.36Interference criterion(dBW/MHz)
(100% of the time)
Case 1Case 3Case 2Case 1Case 3Case 2Case 1WAS(see Table 7)
AltimeterSAR 4 @ 55deg from nadirSAR 4 @ 20deg from nadirEESS

2626
ObservationsObservations
��Actual deployment of WAS indoor andActual deployment of WAS indoor andoutdoor is expected to be less than whatoutdoor is expected to be less than whatis assumed in this analysis.is assumed in this analysis.
��The result represents worst caseThe result represents worst caseinterference for the EESSinterference for the EESS�� interference is expected to be less at anyinterference is expected to be less at any
other time.other time.

2727
EIRP maskEIRP mask
�� Based on comparison of results between City A and City B, the EIRPBased on comparison of results between City A and City B, the EIRPmask for outdoor WAS can be increased by at least 3 dB and themask for outdoor WAS can be increased by at least 3 dB and theinterference criterion for the SAR should still be met for the vastinterference criterion for the SAR should still be met for the vastmajority of cities in the world. Hence, the EIRP mask can bemajority of cities in the world. Hence, the EIRP mask can bemodified as follows:modified as follows:-11 -11 dBWdBW/MHz/MHz 00°° ≤≤ θθ <5 <5°°-11 - 0.711(-11 - 0.711(θθ –5) –5) dBWdBW/MHz /MHz 55°° ≤≤ θθ < 40 < 40°°-35.9 - 1.222 (-35.9 - 1.222 (θθ - 40) - 40) dBWdBW/MHz/MHz 4040°° ≤θ≤θ < 45 < 45°°-42 -42 dBWdBW/MHz /MHz θθ ≥≥ 45 45°°where where θθ is the elevation angle above local horizon in degrees. is the elevation angle above local horizon in degrees.
�� However, since a maximum EIRP of 1W (-13 However, since a maximum EIRP of 1W (-13 dBWdBW/MHz) is allowed,/MHz) is allowed,the proposed EIRP mask then becomes…the proposed EIRP mask then becomes…

2828
Proposed EIRP mask for outdoorProposed EIRP mask for outdoorWAS/RLANsWAS/RLANs
-13 -13 dBWdBW/MHz/MHz 00°° ≤≤ θθ <5 <5°°
-13 - 0.711(-13 - 0.711(θθ –5) –5) dBWdBW/MHz /MHz 55°° ≤≤ θθ < 40 < 40°°
-35.9 - 1.222 (-35.9 - 1.222 (θθ - 40) - 40) dBWdBW/MHz/MHz 4040°° ≤θ≤θ < 45 < 45°°
-42 -42 dBWdBW/MHz /MHz θθ ≥≥ 45 45°°
where where θθ is the elevation angle above local horizon is the elevation angle above local horizonin degrees.in degrees.

2929
Further SimulationFurther Simulation

3030
Further simulationFurther simulation�� Regulatory concerns on how to enforce theRegulatory concerns on how to enforce the
proposed outdoor EIRP maskproposed outdoor EIRP mask
�� Simulation performed for SAR 4 operating atSimulation performed for SAR 4 operating at55 degrees from nadir55 degrees from nadir
�� Assumed ALL of the WAS/RLANs wereAssumed ALL of the WAS/RLANs werepointing upward, although still using the EIRPpointing upward, although still using the EIRPmask as proposed.mask as proposed.
�� Pointing angles assumed: 0 to 10 and 0 to 20Pointing angles assumed: 0 to 10 and 0 to 20degreesdegrees

3131
Further simulationFurther simulation
Figure 2: Interference from indoor & outdoor WAS (including the effect of scattering) into SAR 4 (55 deg from nadir)
-200
-195
-190
-185
-180
-175
-170
-165
-160
-155
-150
-145
-140
-135
-130
-125
-120
-115
-110
-105
-100
0 100 200 300 400 500 600
seconds
I dB
W/M
Hz
0 deg
0 to 10 deg
0 to 20 deg
I criterion
23 sec
29 sec

3232
ConclusionConclusion

3333
ConclusionConclusion
�� With respect to sharing between EESS and WAS/RLANsWith respect to sharing between EESS and WAS/RLANsin the 5250-5350 MHzin the 5250-5350 MHz�� Sharing appears to be feasible given that indoor systems have aSharing appears to be feasible given that indoor systems have a
maximum EIRP of 250 maximum EIRP of 250 mWmW and that outdoor systems employ and that outdoor systems employcertain technical constraints such as the EIRP mask ascertain technical constraints such as the EIRP mask asproposedproposed
�� With respect to sharing between EESS and WAS/RLANsWith respect to sharing between EESS and WAS/RLANsin the 5470-5570 MHz rangein the 5470-5570 MHz range�� Further studies are required to examine the impact on widebandFurther studies are required to examine the impact on wideband
SARsSARs (SAR 2 and SAR 3) (SAR 2 and SAR 3)
�� Not covered in this presentation – sharing betweenNot covered in this presentation – sharing betweenWAS/RLANs and Radiolocation in the 5GHz rangeWAS/RLANs and Radiolocation in the 5GHz range