Embed Size (px)
Citation preview
PEER-REVIEWED ARTICLE bioresources.com
Zhang et al. (2020). “Syngas via pyrolysis-oil gasif.,” BioResources 15(1), 729-745. 729
Simulation of Syngas Production via Pyrolysis-oil Gasification – Impacts of Operating Conditions on Syngas Properties
Zhihai Zhang,a Patrice Mangin,a,* Sylvain Larose,a and Benoit Delcroix b
A model for syngas production from pyrolysis oil gasification was developed, validated, and used in this work to predict the effect of operating conditions on syngas properties. The model consists of a process line that includes units for pyrolysis-oil drying, decomposition, combustion, and gasification processes. The model was validated using experimental data from the literature, showing a good agreement between the results and the reference method. Syngas potential applications were assumed, e.g., for direct use in fuel cells and fuel production. Sensitivity analysis was carried out to evaluate the impacts of gasifying agent, temperature, and the oil moisture content on syngas composition, lower heating value (LHV), and H2:CO molar ratio. For fuel cells applications, gasifying with O2 and air lead to a substantial decrease in syngas LHV. The syngas should be produced at a high temperature. The moisture content in pyrolysis-oil also should be minimized. For fuel production applications, partial O2 can be used to adjust the H2:CO molar ratio. The syngas should be produced at an appropriate temperature around 1000°C. The moisture content in pyrolysis oil should also be selected at 40%.
Keywords: Renewable resources; Syngas composition; H2:CO molar ratio; Lower heating value;
Aspen Plus model;
Contact information: a: Institut d'innovations en Écomatériaux, Écoproduits et Écoénergies à base de
biomasse, Université du Québec à Trois-Rivières, Trois-Rivières, Québec, G9A 5H7, Canada; b: Hydro-
Québec Research Institute, Laboratoire des Technologies de l’Énergie, Shawinigan, QC, Canada;
* Corresponding author: [email protected]
INTRODUCTION
The annual global energy consumption is approximately 14000 Mtoe (million tons
of oil equivalent), 80% to 85% of which is supplied by fossil fuels (Mirandola and
Lorenzini 2016). The steady increase in global energy consumption has led to an alarming
rise in greenhouse gases (GHG) emissions such as CO2, NOx, and SOx pollutants into the
environment. The GHG emissions from fossil fuels have a dominant influence on
increasing atmospheric CO2 concentration that translates into rising global temperatures
and sea levels. Considering the rapidly increasing global energy demand and the growing
concerns about the environmental challenges, renewable and sustainable energy (e.g.,
solar, wind, and biomass) is a key solution to the energy crisis. Biofuels are promising
alternatives to fossil fuels. As the biofuels are derived from renewable energy sources, the
CO2 emissions caused by their combustion are reabsorbed by newly grown biomass
(McKendry 2002).
Pyrolysis-oil, also called bio-oil, is a complex blend of numerous oxygenated
hydrocarbons produced from lignocellulosic biomass by fast pyrolysis process in the

PEER-REVIEWED ARTICLE bioresources.com
Zhang et al. (2020). “Syngas via pyrolysis-oil gasif.,” BioResources 15(1), 729-745. 730
temperature range from 400 °C to 600 °C in the absence of oxygen (Alvarez et al. 2014).
This liquid contains carboxylic acids, alcohols, aldehydes, ketones, esters, furans, and
aromatics (Stas et al. 2014). The water content of the pyrolysis-oil generally ranges from
15 wt% to 25 wt% (Bridgwater and Cottam 1992; Radlein 1999). Up to 70 wt% of the
original dry biomass can be converted into pyrolysis oil (Chang et al. 2013). The
composition of pyrolysis-oil depends on such factors as the type of biomass feedstock,
alkali content, reactor type, pyrolysis temperature, residence time, efficiency of char
removal, etc. (Brown et al. 2001; Huber et al. 2006; Demirbas 2007).
Pyrolysis-oil offers several advantages over primary biomass sources, which
means that there is potential to expand the scope of biomass feedstock applications. The
volumetric energy density is increased about five times over that of “bulk” biomass,
making transportation economically more attractive, especially over long distances (Van
Rossum 2009). When large-scale remote biomass collection is considered, pyrolysis-oil
can first be produced locally and then transported to a central processing area to synthesize
liquid hydrocarbons (Van Rossum 2007). Secondly, the pyrolysis-oil being a liquid makes
its storage, transportation, processing, and pressurization easier. During storage, the
pyrolysis oil becomes more viscous due to chemical and physical changes: many
polymerization reactions occur, and volatiles are emitted with aging. Thus, the pyrolysis-
oil can also be stored in tanks at low temperature that have good resistance against
degradation and cannot be ignited at ambient temperature (Oasmaa and Meier 2005).
Finally, pyrolysis-oil contains only a small amount of sulfur, nitrogen, and ash. Therefore,
its combustion produces less harmful gas emissions such as nitrogen oxides (NOx) and
sulfur dioxide (SO2), compared to conventional fossil fuels (Van Rossum 2009).
Furthermore, as the pyrolysis-oil is produced through a low-temperature process, minerals
and metals remain in the solid char residue.
Pyrolysis-oil can be upgraded to liquid fuels and is considered as an energy carrier.
However, the drawbacks of the oil are numerous and limit its applications. The use of
pyrolysis-oil offers some challenges due to its properties, such as the low lower heating
value (LHV), high oxygen content, volatility, high viscosity, acidity, chemical instability,
and incompatibility with respect to standard petroleum fuels (Oasmas and Czernik 1999).
Therefore, research is being conducted to upgrade pyrolysis-oil and enlarge its scope of
applications. For example, Elliott et al. (2009) investigated catalytic hydrocarbons as a way
to convert pyrolysis oil into hydrocarbons, alkanes, and aromatics. Pyrolysis oil was being
used to produce syngas through gasification (Rossum et al. 2009; Postma et al. 2016).
Bleeker et al. (2007) suggested using pyrolysis-oil to produce pure hydrogen. The research
showed that hydrogen can be produced through the oxidation of pyrolysis-oil with a yield
of 0.84 Nm3/kg dry pyrolysis oil (LHV H2/LHV oil = 0.4).
During gasification process, several thermochemical reactions take place at
various temperature ranges: Drying (>150 °C), decomposition (250 °C to 700 °C),
combustion (700 °C to 1500 °C), and gasification (800 °C to 1000 °C). During drying
stage, the moisture content is reduced from pyrolysis-oil. The decomposition stage is
initiated at about 250 °C when the labile bonds between the aromatic clusters are cleaved,
generating light molecular weight fragments. This stage generates gaseous molecules such
as H2, CO, and CH4, as well as light char and tar type compounds. After decomposition,
the pyrolysis-oil undergoes combustion, which practically provides all the thermal energy
required to sustain the endothermic reactions. A series of endothermic reactions, including
water gas, Boudouard, water gas shift, and steam methane-reforming reactions occur at this
stage (Doherty et al. 2009). Useful combustible gases, such as H2 and CO, are produced at

PEER-REVIEWED ARTICLE bioresources.com
Zhang et al. (2020). “Syngas via pyrolysis-oil gasif.,” BioResources 15(1), 729-745. 731
the gasification stage. At the end, the whole gasification process generates a syngas
composed mainly of CO, CO2, H2, and CH4. The production of CO, CO2, CH4, H2, and
steam in the whole process can be explained by the reactions given in Eqs. 1 to 8, which
occur at various stages (Moghadam et al. 2014).
C + 1/2 O2 → CO - 111 MJ/kmol Combustion reaction (1)
C + O2 → CO2 - 283 MJ/kmol Combustion reaction (2)
H2 + 1/2 O2→ H2O - 286 MJ/kmol Combustion reaction (3)
C + CO2 ↔ 2CO + 172 MJ/kmol Boudouard reaction (4)
C + 2H2 ↔ CH4 - 75 MJ/kmol Methanation reaction (5)
C + H2O ↔ CO + H2 + 131 MJ/kmol Water gas reaction (6)
CO + H2O ↔ CO2 + H2 - 41 MJ/kmol Water gas shift reaction (7)
CH4 + H2O ↔ CO + 3H2 + 206 MJ/kmol Steam methane reforming reaction (8)
Clean ash-free syngas is an important intermediate product for many processes,
such as those aimed at producing ammonia, hydrogen, methanol, and Fischer-Tropsch
fuels. The syngas can also be used directly into fuel cells to generate heat and power
(Tomasi et al. 2006). Pröll et al. (2007) investigated the use of syngas produced from
gasification and successfully fed into a combined heat and electrical power (CHP) unit
rated at 8 MWth. The results demonstrated that CHP-concepts based on biomass steam
gasification can reach high electric efficiencies and high fuel utilization rates (Pröll et al.
2007).
In this study, a model simulating syngas production via pyrolysis-oil gasification
was developed, validated, and used to predict the effect of varying operating conditions on
syngas properties. First, the modeling methodology is discussed, i.e., the assumptions, the
description, and the validation of the model. Thereafter, syngas potential applications in
fuel cells and fuel productions are discussed. Lastly, the results are presented and
discussed, highlighting the impacts of various operating conditions on syngas properties
such as syngas composition, LHV, and H2:CO molar ratio.
EXPERIMENTAL
The main purpose was to design a comprehensive process model for pyrolysis oil
gasification, so that the model could be used as a predictive tool for the optimization of the
gasifier performance. Operating parameters such as gasifying agent type (steam, oxygen,
and air), temperature, and the oil moisture content were varied over wide ranges. The
resulting syngas composition, LHV, and H2:CO molar ratio were investigated. Although
the gasifying pressure is also an important parameter that affects syngas composition, it
was set to atmospheric pressure in this study for the purpose of avoiding costly equipment
that would be required for higher pressures.
PEER-REVIEWED ARTICLE bioresources.com
Zhang et al. (2020). “Syngas via pyrolysis-oil gasif.,” BioResources 15(1), 729-745. 732
Assumptions The whole model is based on the following assumptions:
(1) Gasification is assumed to occur at steady state under isothermal and thermodynamic
equilibrium conditions (Ramzan et al. 2011).
(2) Pyrolysis-oil gasification occurs instantaneously, and the volatile products formed
mainly consist of H2, CO, CO2, CH4, H2S, NH3, and H2O molecules.
(3) All gases are ideal gases and are uniformly distributed in the gas phase.
Model Description Based on the recommendation of the Aspen Plus user guide version 10.2 (Elan
1998), the Peng-Robinson equation of state with Boston-Mathias alpha function (PR-BM)
was chosen to estimate the physical properties of the conventional components. The
parameter alpha in PR-BM in the property package is a temperature-dependent variable
(Elan 1998). The Peng-Robinson property method is suitable for non-polar and weakly
polar mixtures, applicable to all temperature and pressure ranges. Therefore, this method
was recommended for gas processing, refineries, and petrochemical applications. The
enthalpy and density model selected for both pyrolysis-oils, are non-conventional
components, HCOALGEN and DCOALIGT (Ramzan et al. 2011).
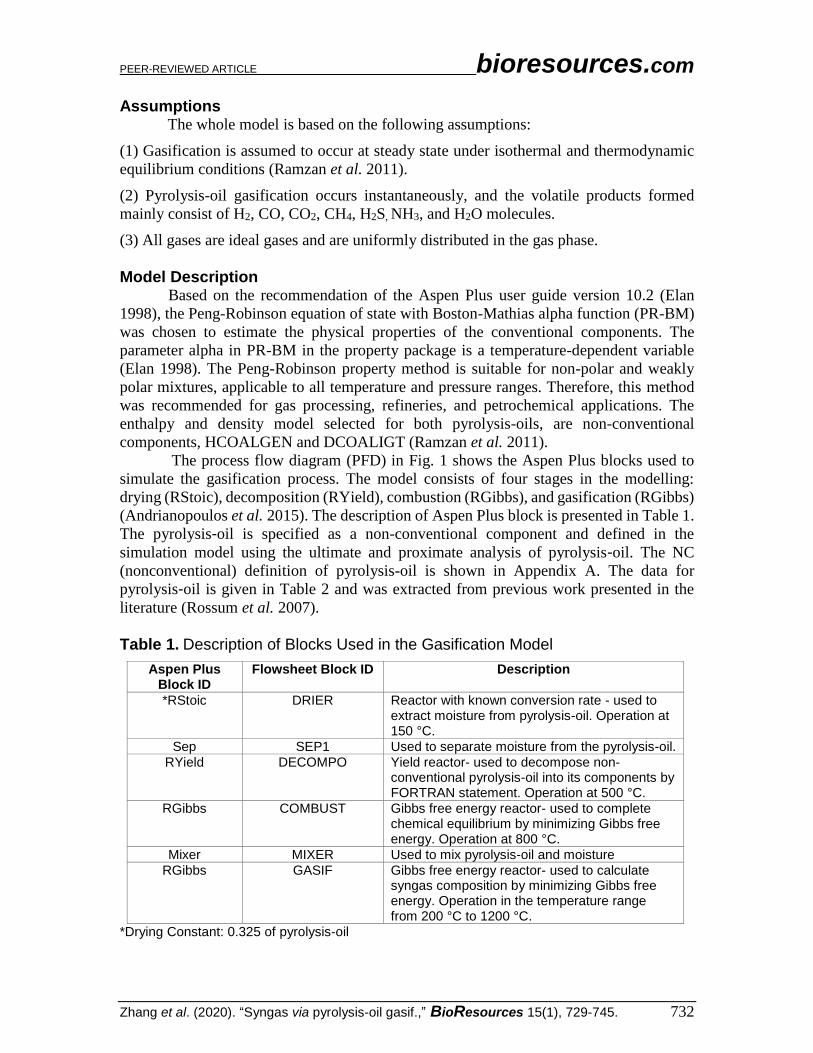
The process flow diagram (PFD) in Fig. 1 shows the Aspen Plus blocks used to
simulate the gasification process. The model consists of four stages in the modelling:
drying (RStoic), decomposition (RYield), combustion (RGibbs), and gasification (RGibbs)
(Andrianopoulos et al. 2015). The description of Aspen Plus block is presented in Table 1.
The pyrolysis-oil is specified as a non-conventional component and defined in the
simulation model using the ultimate and proximate analysis of pyrolysis-oil. The NC
(nonconventional) definition of pyrolysis-oil is shown in Appendix A. The data for
pyrolysis-oil is given in Table 2 and was extracted from previous work presented in the
literature (Rossum et al. 2007).
Table 1. Description of Blocks Used in the Gasification Model
Aspen Plus Block ID
Flowsheet Block ID Description
*RStoic DRIER Reactor with known conversion rate - used to extract moisture from pyrolysis-oil. Operation at 150 °C.
Sep SEP1 Used to separate moisture from the pyrolysis-oil.
RYield DECOMPO Yield reactor- used to decompose non-conventional pyrolysis-oil into its components by FORTRAN statement. Operation at 500 °C.
RGibbs COMBUST Gibbs free energy reactor- used to complete chemical equilibrium by minimizing Gibbs free energy. Operation at 800 °C.
Mixer MIXER Used to mix pyrolysis-oil and moisture
RGibbs GASIF Gibbs free energy reactor- used to calculate syngas composition by minimizing Gibbs free energy. Operation in the temperature range from 200 °C to 1200 °C.
*Drying Constant: 0.325 of pyrolysis-oil

PEER-REVIEWED ARTICLE bioresources.com
Zhang et al. (2020). “Syngas via pyrolysis-oil gasif.,” BioResources 15(1), 729-745. 733
Table 2. Pyrolysis-oil Composition Defined in Aspen Plus
Proximate analysis (wt%)
Moisture content 32.5 - 43.7 Ultimate analysis (wt%)
Carbon 30.4 - 37.7
Hydrogen 7.6 - 7.9 Nitrogen < 0.01-0.27
Oxygen 54.4 - 61.7
Sulfur < 0.01
Fig. 1. Aspen Plus simulation of pyrolysis-oil gasification process flow diagram
DRIERDECOMPO
COMBUST
GASIF
SEP1MIXER
PYRO-OIL
OIL-H2O
MOISTURE
IN-DECO
IN-COMB
IN-MIXER
AGENT
IN-GASIF
SYNGAS
Q-COMBU
CALCULATOR
MOIS-CON
CALCULATOR
ELEMENT

PEER-REVIEWED ARTICLE bioresources.com
Zhang et al. (2020). “Syngas via pyrolysis-oil gasif.,” BioResources 15(1), 729-745. 734
Drying
Decomposition Combustion Gasification
RStoic Sep RYield RGibbs RGibbs
Pyrolysis
-oil
Moisture
Calculator
Syngas
Element Calculator
Dry
pyrolysis-oil C,H,O,N,S element
Moisture
Agent (steam, O2, air)
Fuel cell
Fuel
Synthesis
LHV
H2:CO
Fig. 2. Aspen Plus simulation calculation method and syngas potential application

PEER-REVIEWED ARTICLE bioresources.com
Zhang et al. (2020). “Syngas via pyrolysis-oil gasif.,” BioResources 15(1), 729-745. 735
A kinetic free equilibrium model was developed in Aspen Plus to simulate the
gasification process through four stages. Aspen Plus simulation calculation method and
syngas potential application are presented in Fig. 2. Firstly, the moisture was extracted
from pyrolysis- oil, the pyrolysis-oil was fed into the RStoic block to model the drying
process controlled by the FORTRAN statement in the calculator block that calculated the
moisture content. In the next step, the dry oil was fed into a decomposition reactor where
pyrolysis-oil decomposes into its elemental components (C, H, O, N, S, etc.,), the
distribution of which was specified using a FORTRAN statement in a calculator block
according to the pyrolysis oil ultimate analysis. The RYield block is used to convert non-
conventional pyrolysis-oil into conventional components by using FORTRAN statements
in the calculator block. Then the combustion of pyrolysis oil is modeled by a Gibbs reactor.
The RGibbs block handles the complete chemical equilibrium by minimizing the Gibbs
free energy at an elevated temperature.
The decomposed pyrolysis-oil enters the RGibbs block where partial oxidation and
combustion reactions occur. After combustion, the produced syngas was mixed with steam
originating from pyrolysis-oil moisture in a MIXER block. The mixture was fed into the
gasification unit. Lastly, gasification is also modeled using a Gibbs reactor. The RGibbs
block handles the calculation of the syngas composition by minimizing Gibbs free energy
(Begum et al. 2014). Afterward, the produced syngas will be applied in fuel cell or fuel
production.
RESULTS AND DISCUSSION
The validated model is used alone with a sensitivity analysis to identify the effect
of various operating conditions on syngas properties. The key parameters investigated in
this analysis are the type of medium (gasifying agent), gasification temperature, and
moisture content in pyrolysis-oil. The key syngas properties affected by the operating
conditions and analyzed in this work are the syngas composition (given in mole fraction),
the LHV and the H2:CO molar ratio.
The LHV parameter represents the amount of heat released when a substance
undergoes complete combustion with oxygen under standard conditions prior to
condensation of water vapor produced. This parameter is meaningful when the generated
syngas is used for energy applications, e.g., as a feedstock for fuel cells to generate
electricity and heat (combined heat and power unit). The higher LHV value, the higher
electricity and heat produced from fuel cells. The LHV can be calculated as a function of
the molar fraction of molecules in the gaseous mixture as follows (Moghadam et al. 2014),
LHV (MJ/Nm3) = (CO × 126.36 + H2 × 107.98 + CH4 × 358.18 + C2H2 × 56)/1000 (1)
If fuel synthesis applications are targeted, the main concern is the syngas
composition (mole fraction of each element), with a particular focus on the H2:CO molar
ratio. For example, methanol synthesis and Fischer-Tropsch synthesis require a value of 2
for this ratio (Erena et al. 2005; Ma et al. 2015).
H2:CO molar ratio = n(H2): n(CO) ≈ 2 (2)

PEER-REVIEWED ARTICLE bioresources.com
Zhang et al. (2020). “Syngas via pyrolysis-oil gasif.,” BioResources 15(1), 729-745. 736
Validation of Results The flowsheet in Aspen Plus is presented in Appendix B. The simulation model
was validated by using experimental data from a study achieved by Van Rossum et al.
(2007) on the gasification of pyrolysis oil. A comparison between the experimental data
and the simulation results is presented in Table 3. In the reference study, the pyrolysis oil
was used to produce syngas through gasification in a fluidized bed with nickel-based
catalysts at 800 °C. The modeled syngas concentration was in good agreement with the
experimental results, except for the concentration of carbon monoxide (CO) and methane.
The most noticeable discrepancy is the high amount of methane (5.1 mol%) obtained in
the experiments, compared to the amount predicted by the model (0.3 mol%). This trend
of excess methane with respect to thermodynamics is well known. The methane reforming
reaction (Eq. 8) is limited by the reaction time. Therefore, it cannot reach the complete
equilibrium state (Zhang et al. 2009). For the same reason, the actual amount of CO found
in the gas phase is smaller than that simulated by the kinetic-free model (see Eq. 8). Nearly
90% carbon converted into syngas, the remaining carbon was converted into tar in Van
Rossum research. In this research, tar was not defined in Aspen Plus, carbon was 100%
converted into syngas. Table 4 also presented the energy consumption of pyrolysis oil
gasification based on a flow rate of 100 kg/hr. As we can see that during the combustion
stage, it releases 415.85 kW heat, which can be used for the gasification stage. The entire
gasification process requires a total of 324.70 kW.
Table 3. Comparison between Experimental and Simulated Results
Syngas Composition (mole %)
Experiment (Van Rossum et al.
2007)
Model Difference (Model - experiment)
H2 55.5 55.9 0.4
CO 19.3 24.0 4.7
CO2 19.0 19.8 0.8
CH4 5.4 0.3 -5.1
C2H6 1.0 Trace -
H2S - Trace -
NH3 - Trace -
Table 4. Energy Consumption for Each Stage
Case Drying
(150°C)
Decomposition
(500°C)
Combustion
(800°C)
Gasification
(800°C)
Total
Energy Consumption
(kW)
24.50 643.74 - 415.85 72.31 324.70
Effect of Operating Conditions Effect of gasifying agents
The equivalence ratio is defined as the stoichiometric air/fuel ratio required for
complete combustion. In this study, the equivalence ratio of agent (air, O2, and steam) to
pyrolysis-oil was set at 0.2. Runs were conducted with three gasifying agents, i.e., oxygen,
steam, and air. The specific syngas yield with gasifying agents is presented in Appendix C.
Figure 3 presents the syngas composition for each gasifying agent used in the process.
Figure 4 presents the LHV and H2:CO molar ratio for each gasifying agent. Syngas
produced with steam had the highest content in hydrogen (53.3 mol%) and CO (33.0

PEER-REVIEWED ARTICLE bioresources.com
Zhang et al. (2020). “Syngas via pyrolysis-oil gasif.,” BioResources 15(1), 729-745. 737
mol%). As a result, the syngas LHV is also highest (9.89 MJ/Nm3) in this configuration.
Gasifying with oxygen leads to a smaller LHV because oxygen reacts with H2 and CO
within the mixture. However, the H2:CO molar ratio was higher when gasifying with
oxygen (1.85) compared to gasifying with steam (1.61). The higher H2:CO molar ratio is
favorable for fuel synthesis. Finally, gasifying with air leads the lowest LHV (7.94
MJ/Nm3), because oxygen is diluted to 21% in this agent, the balance being mostly inert
nitrogen. This trend of LHV variation as a function of gasifying agent is in good agreement
with experimental results from Gil et al. (1999), where three types of gasifying agents were
used in biomass gasification and the syngas distribution were tested. The H2-content in the
syngas was highest when steam was used as gasifying agent. Gasifying with air led to the
lowest syngas LHV.
H2 CO CO2 CH4 N2
0
10
20
30
40
50
60
Sy
ng
as C
om
po
sit
ion
(m
ol %
)
H2O
O2
Air
Agent
Fig. 3. Effect of gasifying agent on syngas composition (at 800 °C)
H2O O2 Air
0
2
4
6
8
10
0
2
4
6
8
10
H2:C
O m
ola
r ra
tio
LH
V (
MJ/N
m3)
Agent
LHV (MJ/Nm3)
H2:CO molar ratio
Fig. 4. Effect of gasifying agent on syngas LHV and H2:CO molar ratio (at 800 °C)
PEER-REVIEWED ARTICLE bioresources.com
Zhang et al. (2020). “Syngas via pyrolysis-oil gasif.,” BioResources 15(1), 729-745. 738
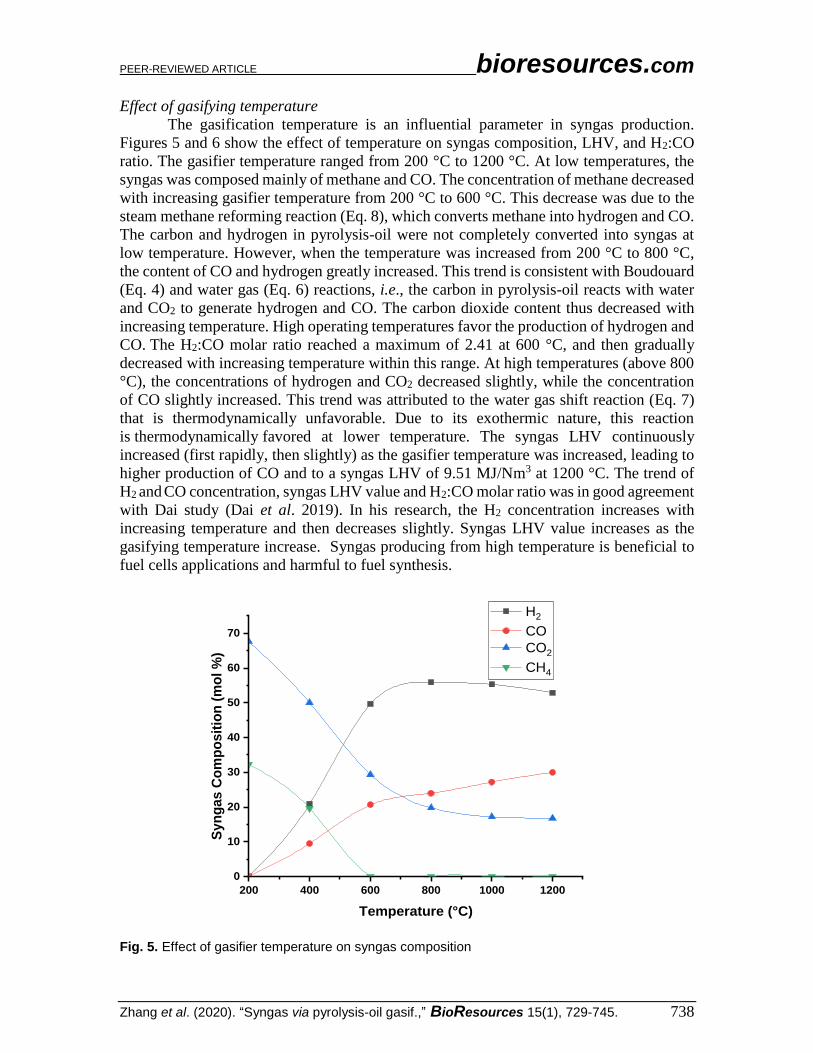
Effect of gasifying temperature
The gasification temperature is an influential parameter in syngas production.
Figures 5 and 6 show the effect of temperature on syngas composition, LHV, and H2:CO
ratio. The gasifier temperature ranged from 200 °C to 1200 °C. At low temperatures, the
syngas was composed mainly of methane and CO. The concentration of methane decreased
with increasing gasifier temperature from 200 °C to 600 °C. This decrease was due to the
steam methane reforming reaction (Eq. 8), which converts methane into hydrogen and CO.
The carbon and hydrogen in pyrolysis-oil were not completely converted into syngas at
low temperature. However, when the temperature was increased from 200 °C to 800 °C,
the content of CO and hydrogen greatly increased. This trend is consistent with Boudouard
(Eq. 4) and water gas (Eq. 6) reactions, i.e., the carbon in pyrolysis-oil reacts with water
and CO2 to generate hydrogen and CO. The carbon dioxide content thus decreased with
increasing temperature. High operating temperatures favor the production of hydrogen and
CO. The H2:CO molar ratio reached a maximum of 2.41 at 600 °C, and then gradually
decreased with increasing temperature within this range. At high temperatures (above 800
°C), the concentrations of hydrogen and CO2 decreased slightly, while the concentration
of CO slightly increased. This trend was attributed to the water gas shift reaction (Eq. 7)
that is thermodynamically unfavorable. Due to its exothermic nature, this reaction
is thermodynamically favored at lower temperature. The syngas LHV continuously
increased (first rapidly, then slightly) as the gasifier temperature was increased, leading to
higher production of CO and to a syngas LHV of 9.51 MJ/Nm3 at 1200 °C. The trend of
H2 and CO concentration, syngas LHV value and H2:CO molar ratio was in good agreement
with Dai study (Dai et al. 2019). In his research, the H2 concentration increases with
increasing temperature and then decreases slightly. Syngas LHV value increases as the
gasifying temperature increase. Syngas producing from high temperature is beneficial to
fuel cells applications and harmful to fuel synthesis.
200 400 600 800 1000 1200
0
10
20
30
40
50
60
70
Syn
gas C
om
po
sit
ion
(m
ol %
)
Temperature (°C)
H2
CO
CO2
CH4
Fig. 5. Effect of gasifier temperature on syngas composition

PEER-REVIEWED ARTICLE bioresources.com
Zhang et al. (2020). “Syngas via pyrolysis-oil gasif.,” BioResources 15(1), 729-745. 739
200 400 600 800 1000 1200
0
2
4
6
8
10
LHV
H2:CO
Temperature (°C)
LH
V (
MJ/N
m3)
0.0
0.5
1.0
1.5
2.0
2.5
H2:C
O m
ola
r ra
tio
Fig. 6. Effect of gasifier temperature on syngas LHV and H2:CO molar ratio
Effect of moisture content in pyrolysis oil
Figures 7 and 8 present the effects of pyrolysis-oil moisture content (from 10 wt%
to 50 wt%), H2:CO molar ratio, and LHV on syngas composition.
10 20 30 40 50
0
10
20
30
40
50
60
Sy
ng
as c
om
po
sit
ion
(m
ol %
)
Moisture content (wt%)
H2
CO
CO2
CH4
Fig. 7. Effect of pyrolysis oil moisture content on syngas composition (at 800 °C)
According to the water gas shift (Eq. 7) and water gas reactions (Eq. 6), an
increasing moisture content led to an increase in the mole fractions of H2 and CO, and a
decrease in the amount of carbon monoxide. As a result, the H2:CO molar ratio gradually
increased from a minimum of 1.5 to a maximum of 2.24 at 50 wt% moisture content.
Temperature (°C)

PEER-REVIEWED ARTICLE bioresources.com
Zhang et al. (2020). “Syngas via pyrolysis-oil gasif.,” BioResources 15(1), 729-745. 740
However, the LHV decreased from 10.1 to 9.2 MJ/Nm³ over the same range, due to the
decrease in CO content. Therefore, if energy applications are targeted (heat and power
generation), then the moisture content in pyrolysis-oil should be kept low. If fuel synthesis
(e.g., methanol or Fischer-Tropsch fuels) is targeted, then the moisture content can be
optimized at 40% to adjust the syngas composition, especially the H2:CO molar ratio.
10 20 30 40 50
5
6
7
8
9
10
11
LHV
H2:CO ratio
Moisture content (wt%)
LH
V (
MJ/N
m3)
1.0
1.2
1.4
1.6
1.8
2.0
2.2
2.4
H2:C
O m
ola
r ra
tio
Fig. 8. Effect of pyrolysis-oil moisture content on syngas LHV and H2:CO molar ratio (at 800 °C)
CONCLUSIONS 1. The objective of this study was to develop a model to simulate and predict the steady
state performance of the pyrolysis-oil gasification process. The results obtained from
simulation are in good agreement with experimental data from literature. Therefore, the
model can predict the gasification performance over a wide range of operating
conditions. The influence of various gasification agents was investigated by using a
fixed equivalence ratio at 800 °C. At these conditions, the syngas LHV was maximized
at 9.89 MJ/Nm3 by using steam as agent. High temperature favors to the production of
CO, which results in high syngas LHV (9.51 MJ/Nm3). High moisture content in
pyrolysis-oil leads to a syngas that is rich in hydrogen, but poor in CO content. As a
result, the syngas LHV decreased with increasing moisture content in pyrolysis-oil, but
the H2:CO molar ratio increased to 2.24 wt% at 50 wt% moisture content in pyrolysis
oil.
2. If the syngas is applied to fuel cells to generate heat and electricity, then the O2 and air
cannot be used as agent, which can reduce the LHV value of the syngas. Moisture
content in pyrolysis-oil should be minimized. The syngas should also be produced at a
high temperature for this application since it then has a higher enthalpy value that can
potentially generate more electricity and heat.
3. If the syngas is used for methanol synthesis or Fischer-Tropsch fuel production, then a
small amount of O2 can be used to adjust the H2:CO molar ratio. The syngas should be

PEER-REVIEWED ARTICLE bioresources.com
Zhang et al. (2020). “Syngas via pyrolysis-oil gasif.,” BioResources 15(1), 729-745. 741
produced at 1000°C where H2:CO molar ratio equal to 2. An appropriate amount of
moisture content in pyrolysis oil should be selected at 40%.
4. Syngas produced from pyrolysis oil contains less nitrogen oxides and sulfur dioxide,
making the syngas more suitable to fuel cells or fuel production processes. Therefore,
pyrolysis oil provides a sustainable energy pathway from forest resources to a biofuel
that can be used in the fuel cells, which can be deployed in the remote and off-grid
communities to provide heat and electricity. Besides that, the use of pyrolysis oil
generated from forest resources would help reducing our dependency on fossil fuels
and cutting down greenhouse -gases emissions.
ACKNOWLEDGMENTS
The authors are grateful for the support of the Natural Sciences and Engineering
Research Council of Canada (NSERC).
REFERENCES CITED Alvarez, J., Lopez, G., Amutio, M., Bilbao, J., and Olazar, M. (2014). “Bio-oil production
from rice husk fast pyrolysis in a conical spouted bed reactor,” Fuel 128, 162-169. DOI:
10.1016/j.fuel.2014.02.074
Andrianopoulos, E., Korre, A., and Durucan, S. (2015). “Chemical process modelling of
underground coal gasification and evaluation of produced gas quality for end use,”
Energy Procedia 76, 444-453. DOI: 10.1016/j.egypro.2015.07.870
Begum, S., Rasul, M., and Akbar, D. (2014). “A numerical investigation of municipal
solid waste gasification using aspen plus,” Procedia Engineering 90, 710-717. DOI:
10.1016/j.proeng.2014.11.800
Bleeker, M., Kersten, S. R., and Veringa, H. (2007). “Pure hydrogen from pyrolysis oil
using the steam-iron process,” Catalysis Today, 127(1-4), 278-290. DOI:
10.1016/j.cattod.2007.04.011
Bridgwater, A. and Cottam, M. (1992). “Opportunities for biomass pyrolysis liquids
production and upgrading,” Energy and Fuels 6(2), 113-120. DOI:
10.1021/ef00032a001
Brown, R. C., Radlein, D., and Piskorz, J. (2001). “Pretreatment processes to increase
pyrolytic yield of levoglucosan from herbaceous feedstocks,” in ACS Symposium
Series Washington DC; American Chemical Society; 1999. DOI: 10.1021/bk-2001-
0784.ch010
Chang, S., Zhao, Z. L., Zheng, A. Q., Li, X. M., Wang, X. B., Huang, Z., He, F., and Li,
H. B. (2013). “Effect of hydrothermal pretreatment on properties of bio-oil produced
from fast pyrolysis of eucalyptus wood in a fluidized bed reactor,” Bioresource
Technology 138, 321-328. DOI: 10.1016/j.biortech.2013.03.170
Dai, B., Zhu, W. W., Mu, L.W., Guo, X. J., Qian, H. L., Liang, X. D., and Kontogeorgis,
G. M. (2019). “Effect of the composition of biomass on the quality of syngas
produced from thermochemical conversion based on thermochemical data
prediction,” Energy & Fuels 33, 5253-5262. DOI: 10.1021/acs.energyfuels.9b00106
Demirbas, A. (2007). “The influence of temperature on the yields of compounds existing

PEER-REVIEWED ARTICLE bioresources.com
Zhang et al. (2020). “Syngas via pyrolysis-oil gasif.,” BioResources 15(1), 729-745. 742
in bio-oils obtained from biomass samples via pyrolysis,” Fuel Processing
Technology 88(6), 591-597. DOI: 10.1016/j.fuproc.2007.01.010
Doherty, W., Reynolds, A., and Kennedy, D. (2009). “The effect of air preheating in a
biomass CFB gasifier using ASPEN Plus simulation,” Biomass and Bioenergy 33(9),
1158-1167. DOI: 10.1016/j.biombioe.2009.05.004
Elan, G. (1998). “Aspen plus user guide version 10.2,” Aspen Process Manual – Aspen
Technology Inc. Cambridge, MA.
Elliott, D. C., Hart, T. R., Neuenschwander, G. G., Rotness, L. J., and Zacher, A. H.
(2009). “Catalytic hydroprocessing of biomass fast pyrolysis bio-oil to produce
hydrocarbon products,” Environmental Progress and Sustainable Energy – An
Official Publication of the American Institute of Chemical Engineers,” 28(3), 441-
449. DOI: 10.1002/ep.10384
Ereña, J., Garoña, R., Arandes, J. M., Aguayo, A. T., and Bilbao, J. (2005). “Direct
synthesis of dimethyl ether from (H2+ CO) and (H2+ CO2) feeds - Effect of feed
composition,” International Journal of Chemical Reactor Engineering 3(1). DOI:
10.2202/1542-6580.1295
Gil, J., Corella, J., Aznar, M. P., and Caballero, M. A. (1999). “Biomass gasification in
atmospheric and bubbling fluidized bed: Effect of the type of gasifying agent on the
product distribution,” Biomass and Bioenergy 17(5), 389-403. DOI: 10.1016/S0961-
9534(99)00055-0
Huber, G. W., Iborra, S., and Corma, A. (2006). “Synthesis of transportation fuels from
biomass: chemistry, catalysts, and engineering,” Chemical Reviews 106(9), 4044-
4098. DOI: 10.1021/cr068360d
Ma, T., Imai, H., Shige, T., Sugio, T., and Li, X. (2015). “Synthesis of hydrocarbons
from H2-deficient syngas in Fischer-Tropsch synthesis over Co-based catalyst
coupled with Fe-based catalyst as water-gas shift reaction,” Journal of Nanomaterials
2015, Article ID 268121. DOI: 10.1155/2015/268121
McKendry, P. (2002). “Energy production from biomass (Part 1): Overview of biomass.
Bioresource Technology 83(1), 37-46. DOI:10.1016/S0960-8524(01)00118-3
Mirandola, A., and Lorenzini, E. (2016). “Energy, environment and climate: From the
past to the future,” International Journal of Heat and Technology 34(2), 159-164.
DOI: 10.18280/ijht.340201
Moghadam, R. A., Yusup, S., Azlina, W., Nehzati, S., and Tavasoli, A. (2014).
“Investigation on syngas production via biomass conversion through the integration
of pyrolysis and air–steam gasification processes,” Energy Conversion and
Management 87, 670-675. DOI: 10.1016/j.enconman.2014.07.065
Oasmaa, A. and Czernik, S. (1999). “Fuel oil quality of biomass pyrolysis oils state of the
art for the end users,” Energy and Fuels 13(4), 914-921. DOI: 10.1021/ef980272b
Oasmaa, A., and Meier, D. (2005). “Norms and standards for fast pyrolysis liquids: 1.
Round robin test,” Journal of Analytical and Applied Pyrolysis 73(2), p. 323-334.
DOI: 10.1016/j.jaap.2005.03.003
Postma, R. S., Kersten, S. R., and van Rossum, G. (2016). “Potassium-salt-catalyzed tar
reduction during pyrolysis oil gasification,” Industrial and Engineering Chemistry
Research 55(26), 7226-7230. DOI: 10.1021/acs.iecr.6b01095
Pröll, T., Rauch, R., Aichernig, C., and Hofbauer, H. (2007). “Fluidized bed steam
gasification of solid biomass-performance characteristics of an 8 MWth combined
heat and power plant,” International Journal of Chemical Reactor Engineering 5(1).
DOI: 10.2202/1542-6580.1398

PEER-REVIEWED ARTICLE bioresources.com
Zhang et al. (2020). “Syngas via pyrolysis-oil gasif.,” BioResources 15(1), 729-745. 743
Radlein, D. (1999). The Production of Chemicals from Fast Pyrolysis Bio-oils, Vol. 1.
CPL Press, Newbury, UK.
Ramzan, N., Ashraf, A., Naveed, S., and Malik, A. (2011). “Simulation of hybrid
biomass gasification using Aspen plus: A comparative performance analysis for food,
municipal solid and poultry waste,” Biomass and Bioenergy 35(9), 3962-3969. DOI:
10.1016/j.biombioe.2011.06.005
Stas, M., Kubička, D., Chudoba, J., and Pospísil, M. (2014). “Overview of analytical
methods used for chemical characterization of pyrolysis bio-oil,” Energy & Fuels
28(1), 385-402. DOI: 10.1021/ef402047y
Tomasi, C., Baratieri, M., Bosio, B., Arato, E., and Baggio, P. (2006). “Process analysis
of a molten carbonate fuel cell power plant fed with a biomass syngas,” Journal of
Power Sources 157(2), 765-774. DOI: 10.1016/j.jpowsour.2005.12.038
Van Rossum, G., Kersten, S. R., and Van Swaaij, W. P. (2007). “Catalytic and
noncatalytic gasification of pyrolysis oil,” Industrial and Engineering Chemistry
Research 46(12), 3959-3967. DOI: 10.1021/ie061337y
Van Rossum, G., Kersten, S. R., and Van Swaaij, W. P. (2009). “Staged catalytic
gasification/steam reforming of pyrolysis oil,” Industrial and Engineering Chemistry
Research 48(12), 5857-5866. DOI: 10.1021/ie900194j
Van Rossum, G. (2009). Steam Reforming and Gasification of Pyrolysis Oil, Ph.D.
Dissertation, University of Twente, Enschede, Netherlands.
Zhang, Y., Xiao, J., and Shen, L. (2009). “Simulation of methanol production from
biomass gasification in interconnected fluidized beds,” Industrial and Engineering
Chemistry Research 48(11), 5351-5359. DOI: 10.1021/ie801983z
Article submitted: October 3, 2019; Peer review completed: November 9, 2019; Revised
version received: December 3, 2019; Accepted: December 5, 2019; Published: December
11, 2019.
DOI: 10.15376/biores.15.1.729-743

PEER-REVIEWED ARTICLE bioresources.com
Zhang et al. (2020). “Syngas via pyrolysis-oil gasif.,” BioResources 15(1), 729-745. 744
Appendix A Pyrolysis-oil NC definition
Attribute ID:
PROXANAL SULFANAL
MOISTURE 32.5 PYRITIC 0.001
FC SULFATE
VM ORGANIC
ASH
Appendix B Flowsheet in Aspen Plus
Component Mass flow (kg/hr)
Pyro-oil Oil-H2O IN-DECO MOISTURE IN-COMB IN-MIXER IN-GASIF SYNGAS
Pyrolysis oil
100
Oil 67.5 67.5
H2O 32.5 32.5 32.5
*H2 4.15
*O2 32.82
*C 30.40
*N2 0.27
*S 0.001
H2O trace trace 4.27
H2 4.09 4.09 6.42
CO 57.01 57.01 38.60
CO2 trace trace 50.04
CH4 0.29 0.29 0.28
C 5.97 5.97
H2S 0.001 0.001 trace
H3N 0.38 0.38 0.33
C2H6 trace trace trace
*Elemental distribution

PEER-REVIEWED ARTICLE bioresources.com
Zhang et al. (2020). “Syngas via pyrolysis-oil gasif.,” BioResources 15(1), 729-745. 745
Appendix C Effect of gasifying agents (800℃)
Component Mass flow (kg/hr)
Pyro-oil Oil-H2O
IN-DECO MOISTURE IN-COMB IN-MIXER
AGENT SYNGAS
Steam Air O2 Steam Air O2
Pyrolysis oil (20% moisture content)
84.4
Oil 67.5 67.5
H2O 16.9 16.9 13.5
H2 4.15
O2 32.82 2.8 13.5
C 30.40
N2 0.27 10.7
S 0.001
H2O trace 9.46 trace 2.08
H2 4.09 5.64 5.21 4.50
CO 57.01 49.46 43.07 34.3
CO2 trace 32.96 38.88 56.87
CH4 0.29 0.253 0.009 trace
C (Pure Solid) 5.957
H2S 0.001 trace trace trace
H3N 0.38 0.32 0.32 0.32
C2H6 trace trace trace trace
N2 10.7