Embed Size (px)
Citation preview

NUKLEONIKA 2018;63(2):2741doi: 10.2478/nuka-2018-0004 ORIGINAL PAPER
Introduction
Gaseous hydrogen can be released in large quanti-ties during inadequate core cooling of a light-water nuclear reactor (LWR). Overheating of the reactor accelerates the processes responsible for hydrogen emission, such as oxidation of zirconium claddings and metal support elements. In the case of a severe accident, hydrogen may be generated by reactions of the molten core with steam and concrete [1]. Even during normal operation of the LWR, hydro-gen is produced by corrosion of the metal support elements and radiolysis of water. In case of a severe accident, this light gas accumulates in the reactor containment, creating a highly fl ammable mixture with air. Accidental ignition of the hydrogen-air mixture in a confi ned space can cause defl agration or even detonation. Resulting mechanical and thermal shocks can damage the nuclear steam supply system (NSSS) equipment and piping, as well as other vital systems of the reactor, and breach the reactor con-tainment [2]. Various active and passive methods can be used to mitigate hydrogen hazard, such as mixing of the containment atmosphere by natural or forced convection, pre- or post-accident dilution
Simulation of start-up behaviour of a passive autocatalytic hydrogen recombiner
Antoni Rożeń
A. RożeńFaculty of Chemical and Process Engineering Warsaw University of Technology 1 Waryńskiego St., 00-645 Warsaw, PolandE-mail: [email protected]
Received: 8 March 2018 Accepted: 25 May 2018
Abstract. Heterogeneous catalytic recombination of hydrogen with oxygen is one of the methods used to remove hydrogen from the containment of a light-water nuclear reactor (LWR). Inside a passive autocatalytic recombiner (PAR), hydrogen and oxygen molecules are adsorbed at catalyst active spots and they recombine to yield water. Heat released in this exothermic reaction creates natural convection of gas in the spaces between the elements supporting a catalyst. Hot and humid gas fl ows upwards into the PAR chimney, while fresh, hydrogen-rich gas enters the PAR from below. Catalytic recombination should start spontaneously at room temperature and low hydrogen concentration. Computational fl uid dynamics (CFD) has been used to study the dynamic behaviour of a plate-type Areva FR-380 recombiner in a quiescent environment for several test scenarios, including different rates of increase in hydrogen concentration and temporary catalyst deactivation. A method for the determination of pressure boundary conditions at the PAR exits was proposed and implemented into a CFD code. In this way, transient operation of PAR could be simulated without the need to model gas circulation outside the device. It was found that fi rst a slow downward fl ow of gas is developed, which may persist until the temperature of the catalyst foils rises. As soon as the gas inside the PAR absorbs enough heat to become lighter than the gas outside the PAR, it starts to fl ow upwards. Criteria for determining the start-up time of PAR were proposed. Model predictions were also compared with experimental data obtained in tests conducted at the THAI facility.
Keywords: catalytic recombination • computational fl uid dynamics • hydrogen safety • natural convection
© 2018 Antoni Rożeń. This is an open access article distributed under the Creative Commons Attribution-NonCommercial-NoDerivatives 3.0 License (CC BY-NC-ND 3.0).
28 A. Rożeń
of hydrogen with neutral gas (e.g. nitrogen), con-tainment venting, controlled hydrogen ignition with spark or catalytic igniters and resistance heaters, as well as catalytic hydrogen recombination. Strategic combinations of hydrogen mitigation techniques are also applied in practice, e.g. controlled ignition with either catalytic recombination or forced mixing [1].
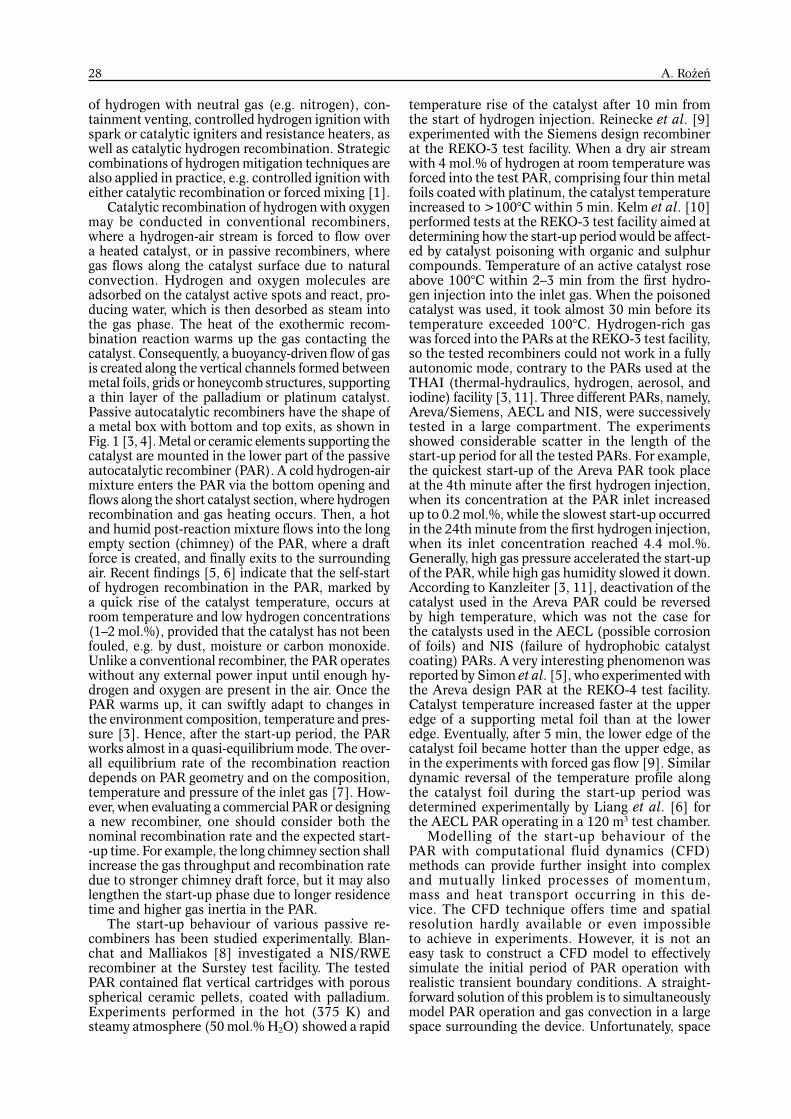
Catalytic recombination of hydrogen with oxygen may be conducted in conventional recombiners, where a hydrogen-air stream is forced to fl ow over a heated catalyst, or in passive recombiners, where gas fl ows along the catalyst surface due to natural convection. Hydrogen and oxygen molecules are adsorbed on the catalyst active spots and react, pro-ducing water, which is then desorbed as steam into the gas phase. The heat of the exothermic recom-bination reaction warms up the gas contacting the catalyst. Consequently, a buoyancy-driven fl ow of gas is created along the vertical channels formed between metal foils, grids or honeycomb structures, supporting a thin layer of the palladium or platinum catalyst. Passive autocatalytic recombiners have the shape of a metal box with bottom and top exits, as shown in Fig. 1 [3, 4]. Metal or ceramic elements supporting the catalyst are mounted in the lower part of the passive autocatalytic recombiner (PAR). A cold hydrogen-air mixture enters the PAR via the bottom opening and fl ows along the short catalyst section, where hydrogen recombination and gas heating occurs. Then, a hot and humid post-reaction mixture fl ows into the long empty section (chimney) of the PAR, where a draft force is created, and fi nally exits to the surrounding air. Recent fi ndings [5, 6] indicate that the self-start of hydrogen recombination in the PAR, marked by a quick rise of the catalyst temperature, occurs at room temperature and low hydrogen concentrations (1–2 mol.%), provided that the catalyst has not been fouled, e.g. by dust, moisture or carbon monoxide. Unlike a conventional recombiner, the PAR operates without any external power input until enough hy-drogen and oxygen are present in the air. Once the PAR warms up, it can swiftly adapt to changes in the environment composition, temperature and pres-sure [3]. Hence, after the start-up period, the PAR works almost in a quasi-equilibrium mode. The over-all equilibrium rate of the recombination reaction depends on PAR geometry and on the composition, temperature and pressure of the inlet gas [7]. How-ever, when evaluating a commercial PAR or designing a new recombiner, one should consider both the nominal recombination rate and the expected start--up time. For example, the long chimney section shall increase the gas throughput and recombination rate due to stronger chimney draft force, but it may also lengthen the start-up phase due to longer residence time and higher gas inertia in the PAR.
The start-up behaviour of various passive re-combiners has been studied experimentally. Blan-chat and Malliakos [8] investigated a NIS/RWE recombiner at the Surstey test facility. The tested PAR contained fl at vertical cartridges with porous spherical ceramic pellets, coated with palladium. Experiments performed in the hot (375 K) and steamy atmosphere (50 mol.% H2O) showed a rapid
temperature rise of the catalyst after 10 min from the start of hydrogen injection. Reinecke et al. [9] experimented with the Siemens design recombiner at the REKO-3 test facility. When a dry air stream with 4 mol.% of hydrogen at room temperature was forced into the test PAR, comprising four thin metal foils coated with platinum, the catalyst temperature increased to >100°C within 5 min. Kelm et al. [10] performed tests at the REKO-3 test facility aimed at determining how the start-up period would be affect-ed by catalyst poisoning with organic and sulphur compounds. Temperature of an active catalyst rose above 100°C within 2–3 min from the fi rst hydro-gen injection into the inlet gas. When the poisoned catalyst was used, it took almost 30 min before its temperature exceeded 100°C. Hydrogen-rich gas was forced into the PARs at the REKO-3 test facility, so the tested recombiners could not work in a fully autonomic mode, contrary to the PARs used at the THAI (thermal-hydraulics, hydrogen, aerosol, and iodine) facility [3, 11]. Three different PARs, namely, Areva/Siemens, AECL and NIS, were successively tested in a large compartment. The experiments showed considerable scatter in the length of the start-up period for all the tested PARs. For example, the quickest start-up of the Areva PAR took place at the 4th minute after the fi rst hydrogen injection, when its concentration at the PAR inlet increased up to 0.2 mol.%, while the slowest start-up occurred in the 24th minute from the fi rst hydrogen injection, when its inlet concentration reached 4.4 mol.%. Generally, high gas pressure accelerated the start-up of the PAR, while high gas humidity slowed it down. According to Kanzleiter [3, 11], deactivation of the catalyst used in the Areva PAR could be reversed by high temperature, which was not the case for the catalysts used in the AECL (possible corrosion of foils) and NIS (failure of hydrophobic catalyst coating) PARs. A very interesting phenomenon was reported by Simon et al. [5], who experimented with the Areva design PAR at the REKO-4 test facility. Catalyst temperature increased faster at the upper edge of a supporting metal foil than at the lower edge. Eventually, after 5 min, the lower edge of the catalyst foil became hotter than the upper edge, as in the experiments with forced gas fl ow [9]. Similar dynamic reversal of the temperature profi le along the catalyst foil during the start-up period was determined experimentally by Liang et al. [6] for the AECL PAR operating in a 120 m3 test chamber.
Modelling of the start-up behaviour of the PAR with computational fluid dynamics (CFD) methods can provide further insight into complex and mutually linked processes of momentum, mass and heat transport occurring in this de-vice. The CFD technique offers time and spatial resolution hardly available or even impossible to achieve in experiments. However, it is not an easy task to construct a CFD model to effectively simulate the initial period of PAR operation with realistic transient boundary conditions. A straight-forward solution of this problem is to simultaneously model PAR operation and gas convection in a large space surrounding the device. Unfortunately, space
29Simulation of start-up behaviour of a passive autocatalytic hydrogen recombiner
scales characterizing the transport processes occur-ring within the channels between the catalytic foils are a few millimetres in size, whereas rooms in the reactor containment, where the recombiners are installed, have dimensions of tens of metres. That is why parallel numerical modelling of both hydrogen recombination occurring inside multiple narrow channels and gas convection taking place in the big space domain requires large computer resources. Hence, this type of direct CFD modelling can be effi -ciently applied for recombiners comprising a limited number of catalytic foils in a two-dimensional (2D) compartment space [12]. In order to reduce compu-tational effort, a single-equation model [13, 14] or a 2D model [15, 16] of the catalytic section of the PAR can be combined with a 3D CFD model of gas convection and mixing. A typical hybrid approach assumes a quasi-stationary mode of PAR operation during each time integration step of the main CFD routine. However, when hydrogen concentration increases rapidly in the surrounding air, one should take into account all transient phenomena occurring inside the PAR. Consequently, a new approach is required to provide information on the transient behaviour of the passive catalytic recombiner.
The present study is aimed at formulating a CFD model effective in terms of central processing unit (CPU) and random access memory (RAM) usage and capable of predicting in detail the operation of a plate-type hydrogen PAR from cold start to fully developed gas fl ow. ANSYS Fluent software was used in this work to solve the momentum, enthalpy and mass transport differential equations describing transient PAR operation in quiescent air. Realistic pressure boundary conditions, inferred from the overall energy balance of the gas stream fl owing via the recombiner box, were applied at the PAR exits to simulate its fully autonomic performance. Surface recombination reactions, natural convection of heat and mass, chimney draft force, as well as molecular and thermal diffusion of gas components, along with heat conduction and heat transfer by ra-diation between the catalytic foils, were accounted for. The model was fi nally tested by comparing its predictions with the experimental results obtained in tests of the Areva FR-380 recombiner conducted at the THAI facility.
Modelling details
Transient performance of a commercial Areva FR-380 PAR [4] was modelled by means of the CFD software ANSYS Fluent 17.2. The catalyst section of this recombiner consists of 38 stainless steel foils that are 0.280 m wide and 0.140 m high (Fig. 1). The foils are placed at 0.01 m intervals and their side surfaces, framing the vertical channels, are covered with washcoat platinum. The entire PAR is 10 times higher than the catalyst section, and most of this height is attributed to the chimney. The internal cross-section of the PAR box is 0.41 m wide and 0.32 m deep. Three top gas outlets are located at the front and side walls of the PAR.
Computational domain
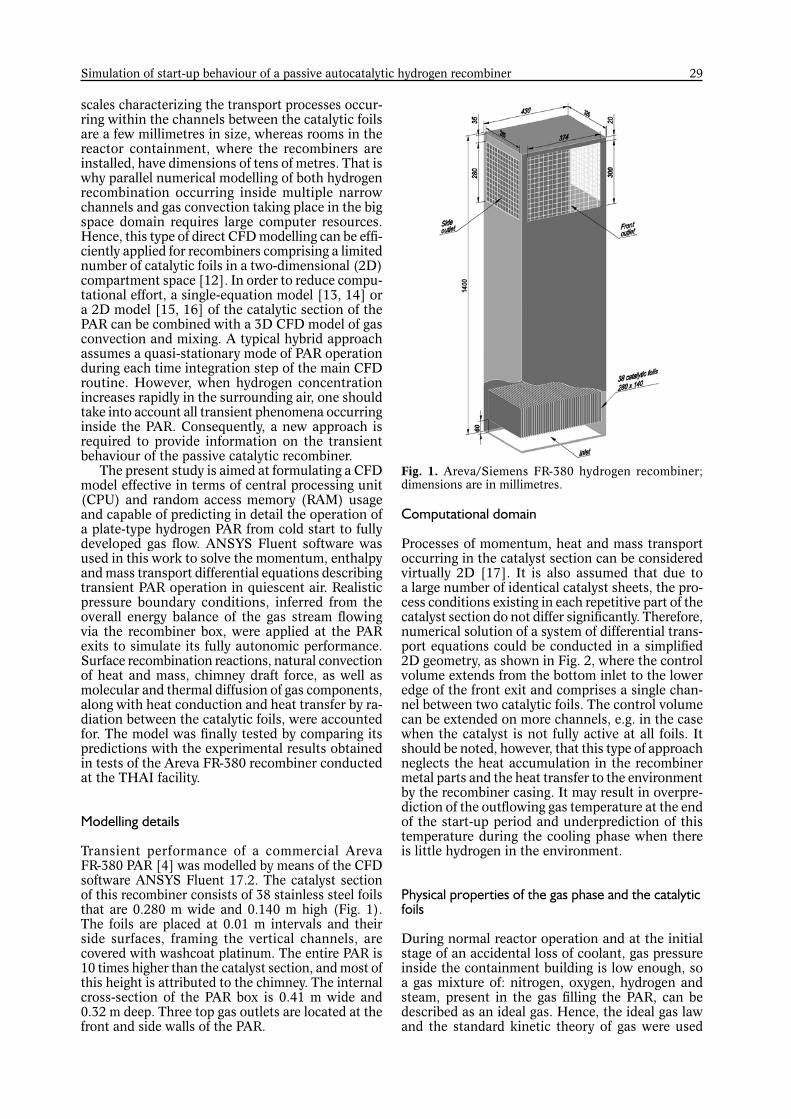
Processes of momentum, heat and mass transport occurring in the catalyst section can be considered virtually 2D [17]. It is also assumed that due to a large number of identical catalyst sheets, the pro-cess conditions existing in each repetitive part of the catalyst section do not differ signifi cantly. Therefore, numerical solution of a system of differential trans-port equations could be conducted in a simplifi ed 2D geometry, as shown in Fig. 2, where the control volume extends from the bottom inlet to the lower edge of the front exit and comprises a single chan-nel between two catalytic foils. The control volume can be extended on more channels, e.g. in the case when the catalyst is not fully active at all foils. It should be noted, however, that this type of approach neglects the heat accumulation in the recombiner metal parts and the heat transfer to the environment by the recombiner casing. It may result in overpre-diction of the outfl owing gas temperature at the end of the start-up period and underprediction of this temperature during the cooling phase when there is little hydrogen in the environment.
Physical properties of the gas phase and the catalytic foils
During normal reactor operation and at the initial stage of an accidental loss of coolant, gas pressure inside the containment building is low enough, so a gas mixture of: nitrogen, oxygen, hydrogen and steam, present in the gas fi lling the PAR, can be described as an ideal gas. Hence, the ideal gas law and the standard kinetic theory of gas were used
Fig. 1. Areva/Siemens FR-380 hydrogen recombiner; dimensions are in millimetres.

30 A. Rożeń
in the CFD model to calculate the gas density [kg/m3] and the dynamic viscosity [Pa·s], together with gas thermal conductivity kg [W/(m·K)] and the coeffi cients of molecular diffusivity Di [m2/s] and thermal diffusivity DT,i [m2/s] of the gas components. On the other hand, empirical correlations [18] were used to determine the specifi c heat of the gas com-ponents cp,i [J/(kg·K)], while the specifi c heat of the gas mixture cp [J/(kg·K)] was obtained as the mass average of the particular specifi c heats.
The metal sheets supporting the thin catalyst layer were assumed to have the typical properties of stainless steel [19]: density s 7700 kg/m3, thermal conductivity ks 25 W/(m·K) and specifi c heat cp,s 460 J/(kg·K). The emissivity coeffi cients k applied in calculations of radiative energy fl ux were as follows: catalyst surface 0.8 [20], stainless steel surface 0.25 [21] and the PAR inlet and outlet 1.0. The heat radia-tion absorption by the gas phase could be neglected in computations due to the low steam concentration [16]; maximum local steam concentration obtained in simulations was <10 vol.%.
Recombination kinetics
Heterogeneous recombination of hydrogen and oxygen is a complex process consisting of many elementary reactions proceeding at the catalyst surface [22]. The overall scheme of the catalytic recombination reaction reads as follows:
(1)
This reaction is fast enough to be controlled to a large extent by molecular diffusion of reactants towards the reaction zone, so one can use a simple one-equation kinetic model, as follows
(2)
without signifi cant loss of model accuracy. The pre-exponential factor B 14 m/s and the reaction activation energy E 16.1 kJ/mol were calculated from the experimental data reported by Schefer et al. [23, Fig. 13]. The symbol cH2 [kmol/m3] indicates the molar concentration of hydrogen in the gas adjacent to the catalyst surface. The recombination reaction of hydrogen with oxygen is highly exothermic and, in standard conditions, its enthalpy equals Hr 2.42 × 10⁵ kJ/kmol. The reaction heat is absorbed by the catalyst sheet and the gas adjacent to its sur-face. When the temperature of the catalytic foil is increased, some part of this heat is radiated mainly to the neighbouring catalytic foils.
Governing equations
The governing equations for the gas phase are as follows: – continuity
(3)
– momentum balance
(4)
– mass balance of gas components
(5)
– energy balance
(6)
– ideal gas law
(7)
The stress tensor for compressible and Newto-nian fl uids, present in Eqs. (4) and (6), is repre-sented as follows:
(8)
The diffusion fl ux in the fl uid of i-th component reads as follows:
(9)
The energy per unit fl uid mass is defi ned as follows:
(10)
Fig. 2. Two-dimensional geometry of the PAR – single--channel model; dimensions are in millimetres.
12 2 22H O H O
0vt
v vv p gt
i i iy vy Jt
g i ii
e e p k T h J vt
1/i i
i
pRT y M
23
Tv v v I
,i i i T iTJ D y D
T
2
2i ii
p ve y h
2 2 2 2H O H O H2 exp Er r r B cRT

31Simulation of start-up behaviour of a passive autocatalytic hydrogen recombiner
where the species enthalpy equals
(11)
When the simulated gas fl ow in the recombiner becomes turbulent, Favre’s mass averaging method is applied to the transport equations due to variable gas density. The solution variables are decomposed into the mean (v–k, p–, y–i, T
–, …) and fl uctuating com-ponents (vk, p, yi, T , …). The stress tensor in the averaged transport equations must be supplemented with the Reynolds stress:
(12)
The molecular diffusivity coeffi cient is replaced by the effective diffusivity:
(13)
The thermal conductivity coeffi cient is replaced by the effective thermal conductivity:
(14)
Unknown a priori components of the Reynolds stress (t,kl), turbulent diffusivity (Dt,i) and turbulent thermal conductivity (kt) have to be computed from a closure hypothesis.
Finally, the heat conduction equation in the metal foils reads as in Eq. (15):
(15)
where the enthalpy of steel is defi ned as
(16)
Initial conditions
The following initial conditions are applied: – gas at rest v
= 0 [m/s],
– gas static pressure p = p0 + gz [Pa], – uniform temperature of gas and the catalytic
foils T 298 K, – uniform molar fractions of gas components:
xH2 = 0.005, xO2 = 0.2084, xN2 = 0.7866, xH2O = 0.
Boundary conditions
Temperature of the gas in the surrounding air was set to 298 K, while its composition is subject to a ramp change for a specifi ed period of time (t) and, then, it is kept constant:
(17)
(18)
Two sets of pressure boundary conditions at the PAR bottom and top openings are formulated for the upward and downward gas fl ow: – downward fl ow (bottom exit)
(19)
– downward fl ow (top entrance)
(20)
– upward fl ow (bottom entrance)
(21)
– upward fl ow (top exit)
(22)
Pressure outside the PAR box at the level of its bottom edge p0 [Pa] was equal to 1013 kPa, but it can also change according to a given scenario, similar to the gas composition or temperature outside the PAR. Symbols h1, hc, and h2 [m] are the heights of the lower inlet, the catalyst section and the upper PAR outlet, respectively. Ai [m2], dh,i [m], v–i [m/s] and i [kg/m3] denote, respectively, the cross-sectional area, hydraulic diameter, average gas velocity and density in the lower inlet (i 1) and upper outlet (i 2) sections, while Ac [m2] is the cross-sectional area of the catalyst section exposed to gas fl ow. Pres-sure boundary conditions (Eqs. (19)–(22)) contain the correction terms for the dynamic pressure, fric-tion and local head losses in the lower inlet section as well as in the upper chimney section of the re-combiner. These corrections were necessary because the computational domain comprised only a single channel of the catalyst section (Fig. 2). The local head losses occur during the downward fl ow at the following points: the PAR top entrance 02 1.8, the top of the catalyst section 2c 0.16, the bottom of the catalyst section c1 0.048 and the PAR bottom exit 10 1. During the normal upward fl ow, the local
,
ref
T
i p iT
h c dT
,t kl k lv v
, ,eff i i t iD D D
, ,eff g g t gk k k
s sh k Tt
,
ref
T
s p sT
h c dT
2H
0.005 0.045 0
0.05
t t tx t
t t
2 2
2 2
2
O H
N H
H O
0.2095 1
0.7905 1
0
x x
x x
x
221 0 1 1 1
1 0 1 1 1,1
2 21 1 1
1
12 2
1 12
h
cc
h vp p vd
A vA
20 22 0 0 1 2 2 2
22 22 2 2 2 2 2
2 2,2
12
1 12 2
c
ch c
p p g h h h v
h v A vd A
220 1 1 1 1
1 0 1 1 1,1
2 22 1 1
1
12 2
1 12
h
cc
h vp p vd
A vA
22 02 0 0 1 2 2 2
22 22 2 2 2 2 2
2 2,2
12
1 1 12 2
c
ch c
p p g h h h v
h v A vd A
32 A. Rożeń
head losses appear at the following points: the PAR bottom entrance 01 0.5, the bottom of the catalyst section 1c 0.160, the top of the catalyst section c2 0.048 and the PAR top exit 20 3.5. The loss factors ij were taken from Idelchik [24]. The length of the inlet section and even the chimney section is too short to allow the development of a stable shape of a gas velocity profi le. Hence, the friction factors in these sections 1 and 2 were calculated as for hydrodynamically developing fl ow. If the fl ow was laminar, the correlation of Shah and London [25] was used; otherwise the formula proposed by Zhi--qing [26] was adopted.
The turbulence present in the inlet gas is charac-terized by three dimensionless indices: turbulence intensity (set to 5%), the ratio of turbulence to mo-lecular viscosity (equal to 10) and the intermittency coeffi cient (set to unity).
The following boundary conditions were applied at solid walls: – no slip condition
(23)
– heat fl ux at the catalyst surface
(24)
– heat fl ux at the lower and upper edges of the catalyst foils
(25)
– mass fl ux of the i-th gas component at the cata-lyst surface
(26)
– mass fl ux of the i-th gas component at the lower and upper edges of the catalyst foils
(27)
where /n denotes the normal gradient operator at the wall. Furthermore, zero momentum, heat and mass fl uxes were set at the left and right borders of the computational domain, running along the sym-metry planes of the catalytic foils.
The outgoing radiative energy fl ux qk,out [W/m2] from the k-th surface element, as present in the heat fl ux boundary conditions, is the sum of the emitted energy and the refl ected incident energy qk,in [W/m2], represented as follows:
(28)
Numerical methods
A system of governing equations for the gas phase (Eqs. (3)–(7)) and the metal foils (Eq. (15)) with ini-tial and boundary conditions was solved numerically along with the radiative energy balance by the ANSYS Fluent code. The solution in the space domain was
obtained by the fi nite volume method, and implicit time integration was applied to time-dependent equa-tions [27]. The ANSYS Fluent “surface-to-surface” algorithm was applied to resolve the radiative energy balance for the whole computational domain. This algorithm is based on the ray tracing method to determine the view factors for each surface element and fi nd a relation between the outgoing and incident energy fl uxes [27].
Different fl ow regimes may exist inside the pas-sive catalytic recombiner during the start-up phase. The fl ow character in the various sections of the PAR is dependent on the standard Reynolds number Re:
(29)
If air at standard conditions (298 K, 1013 kPa) enters the FR-380 recombiner with mean velocity <0.1 m/s, gas fl ow in the entire device is laminar (Re 2300). However, if the recombiner operates in the atmosphere containing 5 mol.% of hydrogen, then the average gas velocity at the inlet is close to 0.8 m/s. In this situation, fl ow is turbulent in the inlet section (Re 1.8 × 10⁴) and in the chimney section (Re 1.1 × 10⁴), while turbulence is attenuated in the narrow channels between the catalytic foils (Re 800). The Reynolds number based on the Taylor microscale T [m] and root-mean-square (RMS)-velocity v [m/s]
(30)
calculated in the same conditions equals 27 in the inlet section, then falls to approximately Re = 4 at the end of the catalyst section and rises to Re = 6 in the chimney section. According to Dimotakis [28], a transition from a weak to a fully developed turbulent fl ow, where characteristic –5/3 power-law regime appears in the turbulent energy spectrum, occurs at ReT 100. This condition was not met in the present study. Hence, the four-equation shear--stress transition model (SST intermittency model) is applied as a closure method for the solution of Reynolds averaged Navier-Stokes transport equa-tions (RANS). In earlier tests, the SST intermittency model proved to be well suited for weakly developed turbulent fl ows typical for PARs [17]. The turbulence model is activated as soon as the standard Reynolds number exceeds 2300 in the inlet gas stream.
Computational grids
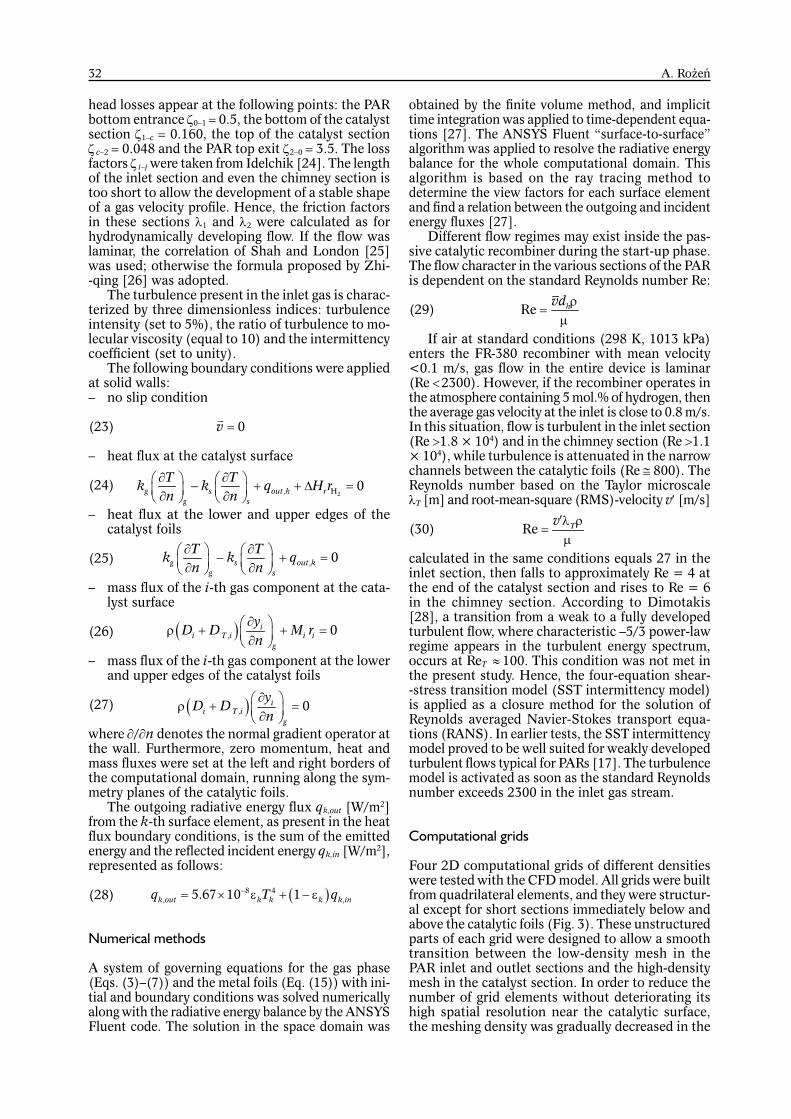
Four 2D computational grids of different densities were tested with the CFD model. All grids were built from quadrilateral elements, and they were structur-al except for short sections immediately below and above the catalytic foils (Fig. 3). These unstructured parts of each grid were designed to allow a smooth transition between the low-density mesh in the PAR inlet and outlet sections and the high-density mesh in the catalyst section. In order to reduce the number of grid elements without deteriorating its high spatial resolution near the catalytic surface, the meshing density was gradually decreased in the
0v
2, H 0g s out k rg s
T Tk k q H rn n
, 0g s out kg s
T Tk k qn n
, 0ii T i i i
g
yD D M r
n
, 0ii T i
g
yD D
n
8 4, ,5.67 10 1k out k k k k inq T q
Re Tv
Re hvd
33Simulation of start-up behaviour of a passive autocatalytic hydrogen recombiner
direction normal to the walls. The expansion ratio of subsequent grid elements ranged from 1.04 to 1.08 for all tested meshes. It should be pointed out that the low Reynolds number turbulence SST model requires a very dense computational mesh close to the wall in order to work well at short distances from the leading edge [27]. Then, the transport equation for the turbulent frequency can be integrated through the buffer and viscous sub-layers down to the channel wall. This condition is met when the dimensionless thickness y+ characterizing the fi rst layer of grid elements at the wall is lower than unity.
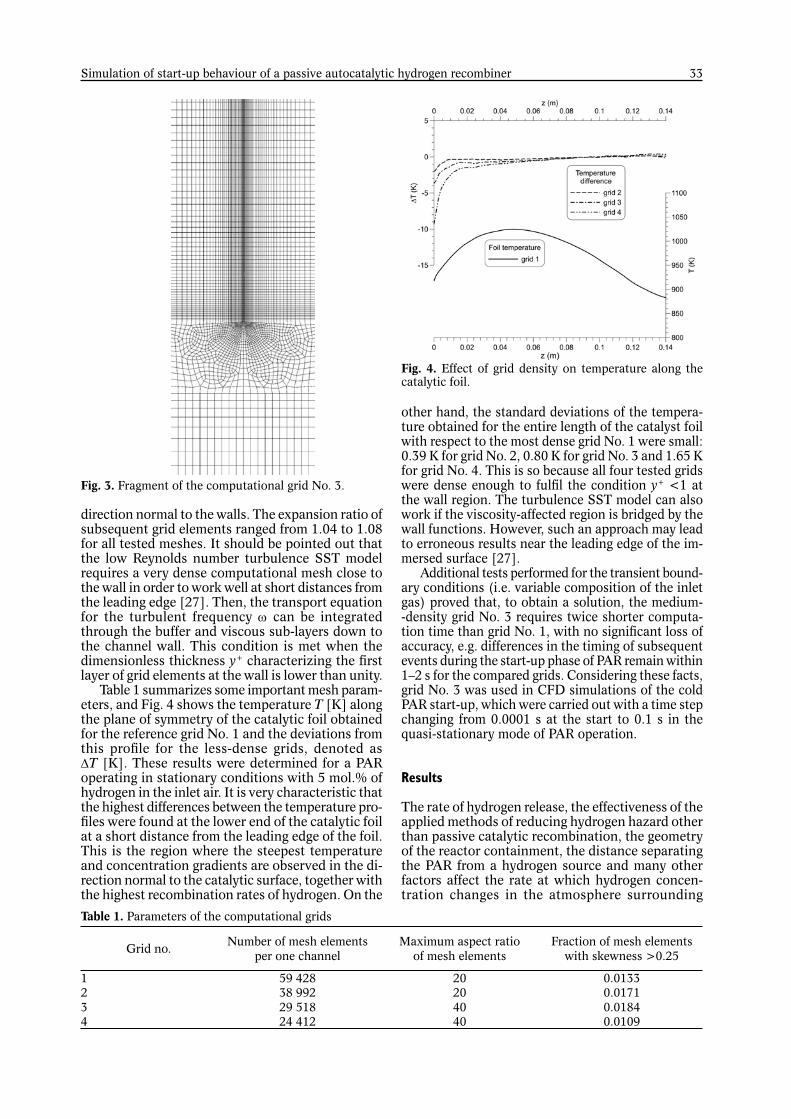
Table 1 summarizes some important mesh param-eters, and Fig. 4 shows the temperature T [K] along the plane of symmetry of the catalytic foil obtained for the reference grid No. 1 and the deviations from this profi le for the less-dense grids, denoted as T [K]. These results were determined for a PAR operating in stationary conditions with 5 mol.% of hydrogen in the inlet air. It is very characteristic that the highest differences between the temperature pro-fi les were found at the lower end of the catalytic foil at a short distance from the leading edge of the foil. This is the region where the steepest temperature and concentration gradients are observed in the di-rection normal to the catalytic surface, together with the highest recombination rates of hydrogen. On the
other hand, the standard deviations of the tempera-ture obtained for the entire length of the catalyst foil with respect to the most dense grid No. 1 were small: 0.39 K for grid No. 2, 0.80 K for grid No. 3 and 1.65 K for grid No. 4. This is so because all four tested grids were dense enough to fulfi l the condition y+ <1 at the wall region. The turbulence SST model can also work if the viscosity-affected region is bridged by the wall functions. However, such an approach may lead to erroneous results near the leading edge of the im-mersed surface [27].
Additional tests performed for the transient bound-ary conditions (i.e. variable composition of the inlet gas) proved that, to obtain a solution, the medium--density grid No. 3 requires twice shorter computa-tion time than grid No. 1, with no signifi cant loss of accuracy, e.g. differences in the timing of subsequent events during the start-up phase of PAR remain within 1–2 s for the compared grids. Considering these facts, grid No. 3 was used in CFD simulations of the cold PAR start-up, which were carried out with a time step changing from 0.0001 s at the start to 0.1 s in the quasi-stationary mode of PAR operation.
Results
The rate of hydrogen release, the effectiveness of the applied methods of reducing hydrogen hazard other than passive catalytic recombination, the geometry of the reactor containment, the distance separating the PAR from a hydrogen source and many other factors affect the rate at which hydrogen concen-tration changes in the atmosphere surrounding
Fig. 3. Fragment of the computational grid No. 3.
Table 1. Parameters of the computational grids
Grid no. Number of mesh elements per one channel
Maximum aspect ratio of mesh elements
Fraction of mesh elements with skewness >0.25
1 59 428 20 0.01332 38 992 20 0.01713 29 518 40 0.01844 24 412 40 0.0109
Fig. 4. Effect of grid density on temperature along the catalytic foil.

34 A. Rożeń
the PAR. Numerical simulations were conducted to investigate in detail the PAR operation during a linear increase of hydrogen concentration from 0.5 to 5 mol.%. The duration of the concentration ramp was changed from 30 to 600 s. When the maximum hydrogen concentration was reached, the CFD simu-lation was continued until the average gas velocity and the overall recombination rate became constant.
Figure 5 shows a plot of the average gas velocity at the bottom entrance of the PAR vs. time. Negative values of gas velocity during the initial phase of the recombiner operation indicate the presence of down-ward gas fl ow. The magnitude of this effect clearly depends on the duration of the concentration ramp. The faster the increase of hydrogen concentration, the lower is the local velocity minimum. The down-ward fl ow occurs because it takes some time before more hydrogen can get into the narrow channels between the catalytic foils and accelerate the exo-thermic recombination reaction. During that time, buoyancy force makes the heavy gas inside the PAR to fl ow down and the hydrogen-rich light gas from outside to fl ow into the PAR chimney. Furthermore, when water is produced, the average molecular mass of the gas inside the catalyst section increases. The gas temperature also increases, but not fast enough to compensate for the effect of higher average molecular mass. As a result, the gas density inside the catalytic section becomes even higher. The downward fl ow persists until hydrogen-rich gas fi lls the chimney and enters the catalytic section, as demonstrated in Fig. 6, where it can recombine and generate enough heat to considerably increase the gas temperature. Subsequently, the fl ow direction is reversed, and the gas rapidly accelerates inside the PAR so that fl ow becomes turbulent below and above the catalytic sec-tion. This dynamic increase of gas velocity is slightly reduced when cold and the low viscosity hydrogen--rich gas, which entered the PAR from above, is fi nally pushed out of the chimney section by the hot and more viscous hydrogen-depleted gas. Later on, the gas velocity stabilizes when the stationary mode of PAR operation is attained.
Figure 7 presents the average hydrogen concen-tration at the top opening of the PAR vs. time. Dur-ing the phase of downward fl ow, this concentration follows the hydrogen concentration in the environ-ment. After the fl ow direction reversal, a fall of the average hydrogen concentration, followed by a quick rise to a new lower level, is found. If the length of the hydrogen concentration ramp is smaller than 300 s, the fall of the hydrogen concentration is practically immediate and occurs after the maximum hydrogen concentration is reached in the PAR surrounding. It means that the recombiner was not able to warm up fast enough and complete the start-up phase. When the hydrogen concentration in the air adjacent to the PAR increases slowly enough, the average hy-drogen concentration at the PAR top exit falls before reaching the 5 mol.% limit. Returning to Fig. 6, one can see that during the initial period of the start--up phase, when the gas fl ow rate is low, hydrogen conversion in the gas passing the catalytic section is almost complete. When normal upward gas fl ow is established, this hydrogen-free gas is pushed up
Fig. 5. Average gas velocity at the PAR lower opening.Fig. 6. Hydrogen molar fraction in the PAR catalytic sec-tion (dashed lines); t 300 s.
Fig. 7. Average hydrogen molar fraction at the PAR top opening.

35Simulation of start-up behaviour of a passive autocatalytic hydrogen recombiner
through the chimney, leading to a temporary decrease of hydrogen concentration. In reality, such a drastic descent in hydrogen concentration lasting just a few seconds may not be observed due to the inertia of the measuring devices and because of some scatter in the residence times of the fl uid elements inside the chimney. A time delay in full activation of the catalyst may also reduce the dynamics of this phase of PAR start-up and prevent such a drastic fall in the outlet hydrogen concentration from happening.
The overall recombination rate of hydrogen is usu-ally determined by measuring the inlet gas velocity and composition, as well as the outlet gas composition [3]. This method gives accurate results, provided that the hydrogen accumulation rate within the PAR box is negligible when compared to its total recombination rate. The same problem with hydrogen accumulation can be met during CFD simulation, and to avoid it in the present study, the overall recombination rate was calculated by numerical integration of the local rate of the recombination reaction over the entire catalyst surface. Another problem often encountered during experiments is limited accuracy and sensitivity of a velocity or fl ow meter at low gas velocities. It can introduce errors into the hydrogen mass balance and delay the moment of detection of gas fl ow. Hence, it is very diffi cult to obtain reliable experimental data in the initial period of the PAR start-up phase, espe-cially when the recombiner operation is to be tested in quiescent air. Fortunately, this is not the case for the proposed CFD model because it allows to calcu-late the overall recombination rate under any fl ow conditions. Figure 8 shows how the total hydrogen recombination rate changes during the entire start--up period depending on the length of the hydrogen concentration ramp. A comparative analysis of Figs. 5, 6 and 8 indicates that the recombination rate may exhibit a local maximum during the period of downward gas fl ow, and then it falls to zero at the moment of fl ow direction change. Afterwards, it increases sharply, till the hydrogen-depleted gas fi lls the chimney section. Finally, in the fi nal stage of the start-up phase, the recombination rate tends to its equilibrium value for the actual inlet gas composi-
tion and temperature. The slower the rate of increase in hydrogen concentration in the environment, the more precisely the recombination rate refl ects this concentration change.
Unlike other fl ow-reversal symptoms, the sign change of the temperature difference at the lower and upper edges of the catalyst foils can be easily detected [5, 6]. The rate of heat conduction along the metal sheets supporting the catalyst is slower than the rate of the local heat release in the recom-bination reaction. Hence, the temperature of the upper edge of the catalyst plate, where hydrogen concentration is the highest, must be higher than the temperature of the lower edge, where not much hydrogen is left in the gas. Results of numerical simulations, presented in Fig. 9, confi rm it. The temperature of the upper edge of the catalyst foil increases, while the temperature of the lower edge remains practically unchanged until the moment of reversal of fl ow direction. Then, the temperature of the lower edge quickly rises, fi nally exceeding the temperature of the upper edge. Figure 10 shows in detail the dynamic changes of the temperature pro-fi le occurring along the catalyst foil. Initially, local
Fig. 8. Total hydrogen recombination rate.
Fig. 9. Temperature of the catalyst foil edges.
Fig. 10. Time evolution of catalyst temperature; t 300 s.
36 A. Rożeń
temperature variations of the catalyst are small. For longer times, when the upward gas fl ow stabilizes, the maximum catalyst temperature reaches almost 1025 K, while the lowest is close to 880 K. The high velocity and low temperature of the gas entering the catalyst section intensifi es heat convection from the thin metal sheets to the gas phase and cools the lower edge of the catalyst foil. In addition, radiative heat transfer, which becomes important at such high temperatures, is also responsible for the temperature fall at the lower end of the catalyst foil, where the energy can be easily radiated to the environment via the PAR’s bottom exit.
There is no universal and commonly accepted defi nition of PAR start-up time. Some defi ne it as the time elapsing from the moment of the fi rst hydrogen release to the fi rst measurable decrease of hydrogen concentration at the PAR top exit [3]. Others prefer to identify the start-up time as the time passing from the moment at which hydrogen appears at the PAR bottom exit to the fi rst rise of the catalyst tempera-ture by a given increment [5]. In this study, three different defi nitions are formulated and compared with one another. The start-up time is defi ned as the time elapsing from the initial state (0.5 mol.% H2, 298 K) to the moment when the following happen: – the direction of the gas fl ow at the PAR bottom
entrance is reversed (tv); – the local minimum of the average hydrogen con-
centration at the PAR top exit is observed (tx); – the temperature of the lower end of the catalytic
foil becomes higher than the temperature of the upper one (tT). All three defi nitions refer to different physical
parameters and can be implemented in real tests. Values of the start-up times as predicted by the CFD model for different lengths of the hydrogen concen-tration ramp are presented in Table 2. The following general rule can be inferred from these results:
(31)
First, the upward gas movement begins, then the hydrogen-rich gas is removed from the chimney and, fi nally, the lower end of the catalytic foil becomes hotter than the upper one.
It seems that the FR-380 recombiner is not able to start its normal operation before hydrogen con-centration in the surrounding air is increased to 5 mol.% when the concentration ramp lasts <300 s.
It has been assumed so far that the catalyst in the PAR is fully active and the overall hydrogen
recombination rate can be estimated by a simple multiplication of the recombination rate obtained for one channel of the catalyst section. However, it can happen that large parts of the catalyst surface become fouled by aerosol particles containing organ-ic and inorganic poisons. Reactivation of the catalyst is sometimes possible by increasing its temperature, but it can affect PAR operation during the start-up phase, because the recombination reaction starts at higher hydrogen concentrations.
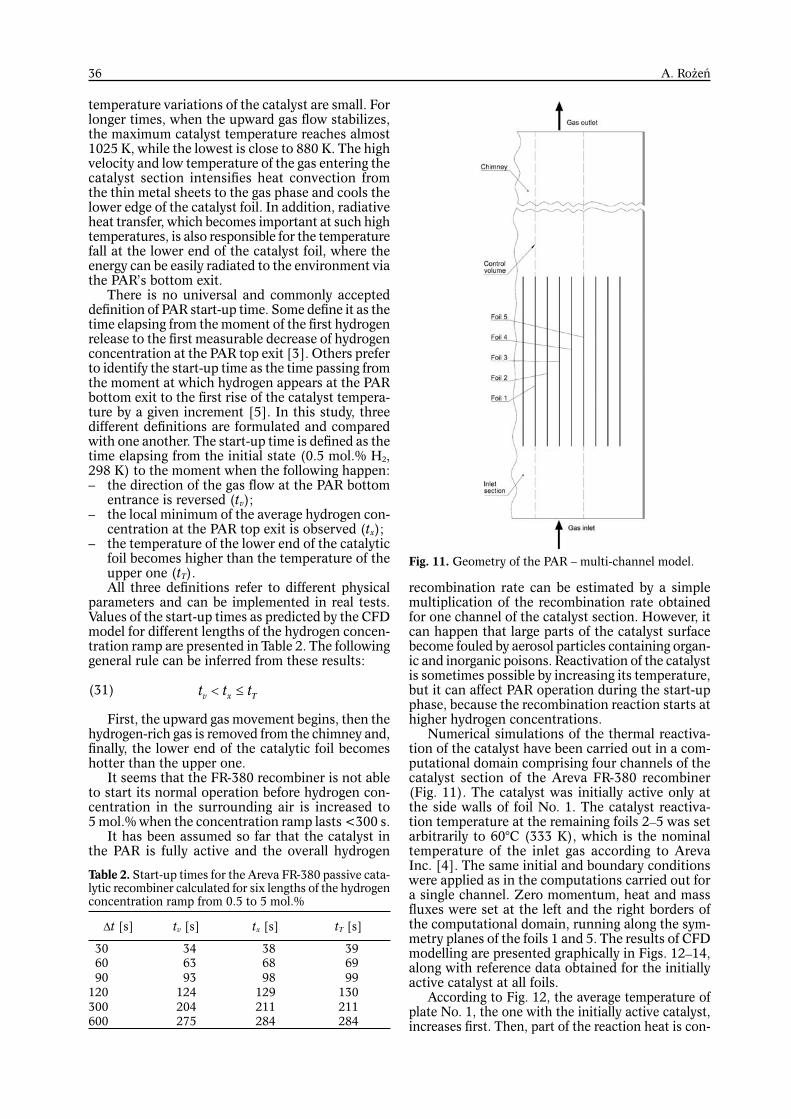
Numerical simulations of the thermal reactiva-tion of the catalyst have been carried out in a com-putational domain comprising four channels of the catalyst section of the Areva FR-380 recombiner (Fig. 11). The catalyst was initially active only at the side walls of foil No. 1. The catalyst reactiva-tion temperature at the remaining foils 2–5 was set arbitrarily to 60°C (333 K), which is the nominal temperature of the inlet gas according to Areva Inc. [4]. The same initial and boundary conditions were applied as in the computations carried out for a single channel. Zero momentum, heat and mass fl uxes were set at the left and the right borders of the computational domain, running along the sym-metry planes of the foils 1 and 5. The results of CFD modelling are presented graphically in Figs. 12–14, along with reference data obtained for the initially active catalyst at all foils.
According to Fig. 12, the average temperature of plate No. 1, the one with the initially active catalyst, increases fi rst. Then, part of the reaction heat is con-
v x Tt t t
Table 2. Start-up times for the Areva FR-380 passive cata-lytic recombiner calculated for six lengths of the hydrogen concentration ramp from 0.5 to 5 mol.%
t [s] tv [s] tx [s] tT [s]
30 34 38 39 60 63 68 69 90 93 98 99120 124 129 130300 204 211 211600 275 284 284
Fig. 11. Geometry of the PAR – multi-channel model.

37Simulation of start-up behaviour of a passive autocatalytic hydrogen recombiner
ducted, convected and radiated to the neighbouring plate No. 2. As soon as the local catalyst temperature exceeds the activation temperature, the recombination reaction starts and the foil temperature quickly rises. Successively, foils 3–5 warm up so that the recombina-tion can proceed at the catalyst surface. Finally, the average temperatures of all fi ve catalytic foils become equal. Hydrogen recombination starts at foil No. 2 after 2 min and 34 s; then, it takes only 47 s to start recombination at the remaining foils 3–5 (Fig. 13).
The small heat capacity of the very thin foils installed in the PAR box and the high emissivity of their side surfaces (k 0.8) considerably shorten the time required to complete the catalyst reactivation process. However, the speed of the domino effect, as illustrated in Figs. 12 and 13, can be reduced in real conditions by fouling the catalyst surface with dust or other deposits, which decreases the emissivity coeffi -cient of this surface. The rate of heat transfer between the catalytic foils can be also reduced by steam at high concentrations absorbing heat radiation.
The initial phase of the start-up period, when gas in the PAR fl ows downwards, is shorter than that in the reference case of the completely active catalyst at all foils (Fig. 14). This phenomenon can be attributed to the lack of symmetry of the velocity, temperature and concentration fi elds in the channels between the catalytic foils. It seems that differences in the catalyst activity, which disappear at elevated temperature, can accelerate the PAR start-up. Nev-ertheless, as soon as the normal upward fl ow of gas is attained, the increase of the inlet gas velocity is not as quick as in the reference case (Fig. 14).
The results of the CFD model have been com-pared with the results of two experimental tests HR-1 and HR-2 conducted at the THAI facility [3]. The PAR used in these experiments was the Areva FR-380 recombiner, with the width of its metal housing reduced by half and with 19 instead of 38 catalytic foils. The length of the PAR inlet section was increased from 0.06 to 0.36 m, and this extension had a rounded inlet to minimize head loss. The PAR was attached to the outer wall of a draft tube installed centrally in the lower part of a cylindrical vessel of 60 m3 volume. At the beginning of both tests, the vessel was fi lled with dry air at atmospheric pressure (0.1 MPa) and room temperature (300 K). Then, hydrogen was injected through a ring feed line in-stalled below the draft tube. Both tests consisted of two phases. During the fi rst 25 min in the HR-1 test and 20 min in the HR-2 test, hydrogen concentration was gradually increased from 0 to 6 mol.%. The PAR started to operate after 16 min in the HR-1 test and after 7 min in the HR-2 test from the fi rst hydrogen injection. When hydrogen content in the vessel was reduced to <0.3 mol.%, the second phase of each test began. Hydrogen injection was started again and continued until hydrogen ignition took place inside the PAR. The fi rst phase of the experiments was modelled in the present work. The following input data were used in the CFD calculations: – initial average temperature and composition of
the gas phase in the vessel, – initial average temperature of the catalytic foils,
– transient gas pressure in the vessel, and – transient temperature and composition of the inlet
gas stream. Zero initial gas velocity inside the PAR and qui-
escent air outside was accepted. Gas density outside
Fig. 12. Average temperature of the catalytic foils; t 300 s.
Fig. 13. Hydrogen recombination rate per plate; t 300 s.
Fig. 14. Average gas velocity at the bottom entrance; t 300 s.

38 A. Rożeń
the PAR was set equal to the density of the inlet gas stream. It was also assumed that the catalyst activ-ity is the same at all metal sheets supporting it. The control volume, shown in Fig. 2, and consequently the computational grid, were extended to fully com-prise the longer inlet section of the test recombiner. The results of CFD computations are presented in Figs. 15–17 (HR-1 test) and in Figs. 18–20 (HR-2 test).
When no delay in the onset of the recombina-tion reaction was assumed in simulations, the CFD model predicted the start of the upward gas fl ow 11 min earlier than it took place in the HR-1 test (Fig. 15). It might be explained by the low initial activity of the catalyst during this test. In order to adjust the model predictions to the experimental results, the onset of the recombination reaction was delayed to the moment when the hydrogen concen-tration reached 2.81% in the inlet stream. In these circumstances, a more rapid increase of the inlet gas velocity was calculated than that determined in the fi rst simulation. Later, the calculated inlet gas velocity became smaller than the measured one and the difference between the model and experimental results was reduced at long times.
The temperature of the catalytic foils is another process parameter directly correlated with the course of PAR start-up behaviour. Figure 16 presents a com-parison of the calculated and measured temperatures at the lower edge of the catalytic foil. It can be seen that the CFD model predicted temperature well in the initial period of operation. However, at longer times, when the hydrogen concentration in the inlet gas stream becomes reduced, the model predicted a faster fall in temperature than that recorded in the experiment. Probably, the catalytic foils were able to absorb heat accumulated earlier in the metal elements supporting them.
The CFD model overestimated the maximum hydrogen recombination rate at the initial phase of PAR operation (Fig. 17). This difference could be explained by the larger-than-simulated disper-sion of the gas elements in the long PAR chimney or by differences between the start-up times of the hydrogen recombination at particular catalytic foils. However, the moment of reaching the maximum rate of hydrogen removal was calculated accurately and the discrepancy between the calculated and measured recombination rates was quickly reduced after passing this maximum.
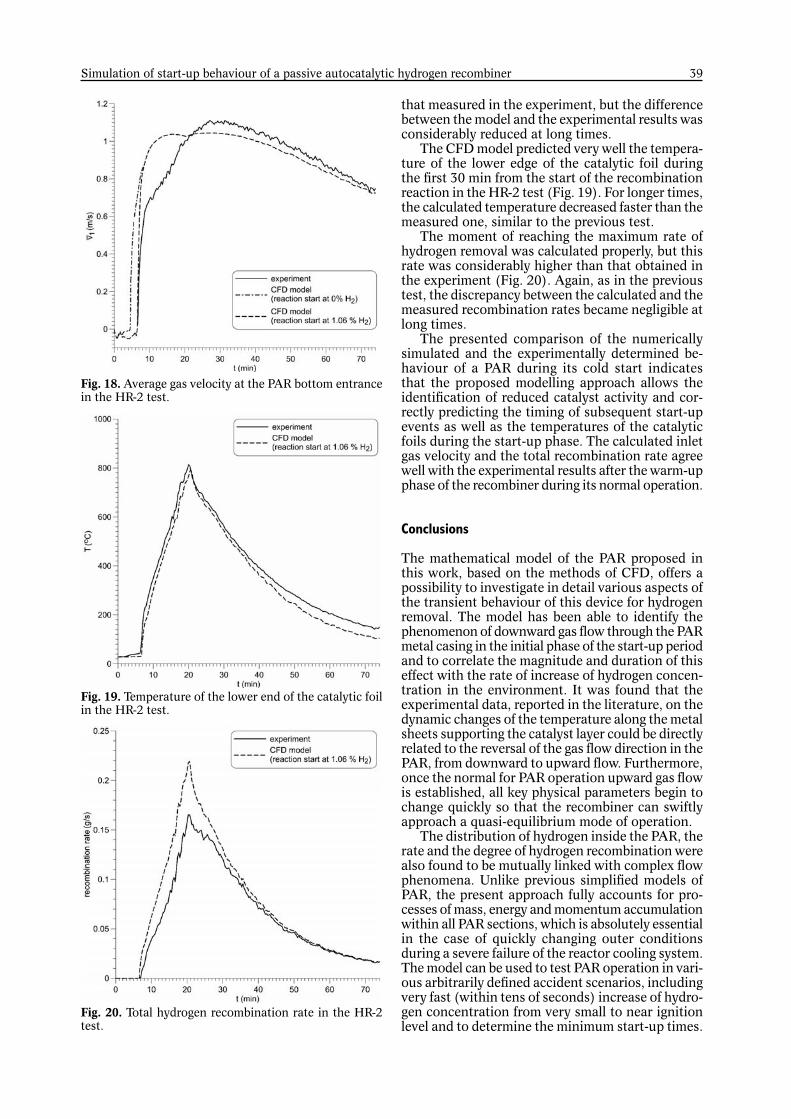
The HR-1 and HR-2 tests were conducted sub-sequently almost in the same conditions, but in the second test, the PAR began its normal operation 9 min earlier than in the fi rst test. Probably, the fi rst experiment must have increased the catalyst activity to a higher level. Therefore, when no delay in the onset of recombination reaction was assumed in simulations, the model predicted the start of the upward gas fl ow 2.5 min earlier than it took place in the HR-2 test (Fig. 18). In order to improve the model’s accuracy, the onset of the recombination reaction was set to the moment when the hydrogen concentration reached 1.06% in the inlet stream. Similarly, as in the previous test, a faster increase of the inlet gas velocity was calculated compared to
Fig. 15. Average gas velocity at the PAR bottom entrance in the HR-1 test.
Fig. 16. Temperature of the lower end of the catalytic foil in the HR-1 test.
Fig. 17. Total hydrogen recombination rate in the HR-1 test.
39Simulation of start-up behaviour of a passive autocatalytic hydrogen recombiner
that measured in the experiment, but the difference between the model and the experimental results was considerably reduced at long times.
The CFD model predicted very well the tempera-ture of the lower edge of the catalytic foil during the fi rst 30 min from the start of the recombination reaction in the HR-2 test (Fig. 19). For longer times, the calculated temperature decreased faster than the measured one, similar to the previous test.
The moment of reaching the maximum rate of hydrogen removal was calculated properly, but this rate was considerably higher than that obtained in the experiment (Fig. 20). Again, as in the previous test, the discrepancy between the calculated and the measured recombination rates became negligible at long times.
The presented comparison of the numerically simulated and the experimentally determined be-haviour of a PAR during its cold start indicates that the proposed modelling approach allows the identifi cation of reduced catalyst activity and cor-rectly predicting the timing of subsequent start-up events as well as the temperatures of the catalytic foils during the start-up phase. The calculated inlet gas velocity and the total recombination rate agree well with the experimental results after the warm-up phase of the recombiner during its normal operation.
Conclusions
The mathematical model of the PAR proposed in this work, based on the methods of CFD, offers a possibility to investigate in detail various aspects of the transient behaviour of this device for hydrogen removal. The model has been able to identify the phenomenon of downward gas fl ow through the PAR metal casing in the initial phase of the start-up period and to correlate the magnitude and duration of this effect with the rate of increase of hydrogen concen-tration in the environment. It was found that the experimental data, reported in the literature, on the dynamic changes of the temperature along the metal sheets supporting the catalyst layer could be directly related to the reversal of the gas fl ow direction in the PAR, from downward to upward fl ow. Furthermore, once the normal for PAR operation upward gas fl ow is established, all key physical parameters begin to change quickly so that the recombiner can swiftly approach a quasi-equilibrium mode of operation.
The distribution of hydrogen inside the PAR, the rate and the degree of hydrogen recombination were also found to be mutually linked with complex fl ow phenomena. Unlike previous simplifi ed models of PAR, the present approach fully accounts for pro-cesses of mass, energy and momentum accumulation within all PAR sections, which is absolutely essential in the case of quickly changing outer conditions during a severe failure of the reactor cooling system. The model can be used to test PAR operation in vari-ous arbitrarily defi ned accident scenarios, including very fast (within tens of seconds) increase of hydro-gen concentration from very small to near ignition level and to determine the minimum start-up times.
Fig. 18. Average gas velocity at the PAR bottom entrance in the HR-2 test.
Fig. 19. Temperature of the lower end of the catalytic foil in the HR-2 test.
Fig. 20. Total hydrogen recombination rate in the HR-2 test.
40 A. Rożeń
The infl uence of reduced catalyst activity, along with the thermal reactivation of the catalyst, dur-ing the course of hydrogen recombination could be another fi eld of CFD model application due its capa-bility to resolve transient PAR behaviour without the need to simulate gas convection in the environment.
The results of modelling presented in this work were obtained for the quiescent environment. How-ever, the pressure boundary conditions used in the model formulation to simulate a fully autonomic op-eration can be easily modifi ed to allow the modelling of PAR working in conditions of external co-current or counter-current gas fl ow.
Acknowledgment. The author would like to thank the Organisation for Economic Co-operation and Develop-ment (OECD) Nuclear Energy Agency for providing experimental data from the THAI project carried out in 2007–2009.
Nomenclature
A cross-sectional area [m2]D molecular diffusivity [m2/s]DT thermal diffusivity [m2/s]Dt turbulent diffusivity [m2/s]dh hydraulic diameter [m]e energy per unit mass [J/kg]g gravitational acceleration (9.81 m/s2)h species enthalpy [J/kg]I= unit tensor
J
diffusion fl ux [kg/(m2·s)]k thermal conductivity [W/(m·K)]kt turbulent thermal conductivity [W/(m·K)]M molar mass [kg/mol]p pressure [Pa]q radiative heat fl ux [W/m2]R universal gas constant (8.3143 J/(mol·K))r rate of surface reaction [(mol/(m2·s)]T temperature [K, °C]t time [s]v gas velocity [m/s]x mole fractiony mass fractiony+ dimensionless distance from wallz vertical coordinate [m]Greek symbolsHr enthalpy of recombination [J/mol]t duration of hydrogen concentration ramp [s] emissivity coeffi cient friction coeffi cient dynamic gas viscosity [Pa·s] density [kg·m–3]= stress tensor [Pa] minor loss coeffi cientOver-lines – mean valueSubscriptsg gasi i-th componentref reference values steel
References
1. International Atomic Energy Agency. (2011). Mitiga-tion of hydrogen hazards in severe accidents in nuclear power plants. Vienna: IAEA. (IAEA-TECDOC-1661).
2. Rigas, F., & Amyotte, P. (2013). Hydrogen safety. New York: CRC Press, Taylor & Francis Group.
3. Kanzleiter, T. (2009). OECD-NEA THAI Project. Quick look report. Hydrogen recombiner tests HR-1 to HR-5, HR-27 and HR-28. Eschborn, Germany: Becker Tech-nologies GmbH. (Report no. 150 1326-HR-QLR-1).
4. Areva Inc. (2011). Passive autocatalytic recombiner. Retrieved June 2017, from http://us.areva.com/EN/home-1495/passive-autocatalytic-recombiner-par.html.
5. Simon, B., Reinecke, E. -A., Kubelt, C., & Allelein, H. -J. (2014). Start-up behaviour of a passive auto-catalytic recombiner under counter fl ow conditions: Results of a fi rst orienting experimental study. Nucl. Eng. Des., 278, 317–322. DOI: 10.1016/j.nucengdes.2014.06.029.
6. Liang, Z., Gardner, L., Clouther, T., & Thomas, B. (2016). Experimental study of effect of ambient fl ow condition on the performance of a passive autocata-lytic recombiner. Nucl. Eng. Des., 301, 49–58. DOI: 10.1016/j.nucengdes.2016.03.005.
7. Bachellerie, E., Arnould, F., Auglaire, M., de Boeck, B., Braillard, O., Eckardt, B., Ferroni, F., & Moffet, R. (2003). Generic approach for designing and implement-ing a passive autocatalytic recombiner PAR-system in nuclear power plant containments. Nucl. Eng. Des., 221, 151–165.
8. Blanchat, T. K., & Malliakos, A. (1999). Analysis of hydrogen depletion using a scaled passive autocata-lytic recombiner. Nucl. Eng. Des., 187, 229–239.
9. Reinecke, E. -A., Tragsdorf, I. M., & Gierling, K. (2004). Studies on innovative hydrogen recombiners as safety devices in the containments of light water reactors. Nucl. Eng. Des., 230, 49–59. DOI: 10.1016/j.nuceng-des.2003.10.009.
10. Kelm, S., Schoppe, L., Dornseiffer, J., Hofmann, D., Reinecke, E. -A., Leistner, F., & Jühe, S. (2009). Ensur-ing the long-term functionality of passive auto-catalytic recombiners under operational containment atmos-phere conditions – An interdisciplinary investigation. Nucl. Eng. Des., 239, 274–280. DOI: 10.1016/j.nucengdes.2008.10.029.
11. Kanzleiter, T. (2009). OECD-NEA THAI Project. Quick look report. Hydrogen recombiner tests HR-14 to HR-16. Eschborn, Germany: Becker Technologies GmbH. (Report no. 150 1326-HR-QLR-4).
12. Orszulik, M., Fic, A., & Bury, T. (2015). CFD modeling of passive autocatalytic recombiners. Nukleonika, 60, 347–353. DOI: 10.1515/nuka-2015-0050.
13. Mimouni, S., Mechitoua, N., & Ouraou, M. (2011). CFD recombiner modelling and validation on the H2-PAR and Kali-H2 experiments. Sci. Technol. Nucl. In-stall., article ID 547514. DOI: 10.1155/2011/574514.
14. Hoyes, J. R., & Ivings, M. J. (2016). CFD modelling of hydrogen stratifi cation in enclosures: Model validation and application to PAR performance. Nucl. Eng. Des., 310, 142–153. DOI: 10.1016/j.nucengdes.2016.08.036.
15. Kelm, S., Jahn, W., Reinecke, E. -A., & Allelein, H. -J. (2012). Passive auto-catalytic recombiner operation – validation of a CFD approach against OECD-THAI HR2 test. In Proceedings of OECD/NEA & IAEA

41Simulation of start-up behaviour of a passive autocatalytic hydrogen recombiner
Workshop on Experiments and CFD Codes Applica-tion to Nuclear Reactor Safety, 9–13 September 2012. Deajon, South Korea.
16. Reinecke, E. -A., Kelm, S., Steffen, P. -M., Klauck, M., & Allelein, H. -J. (2016). Validation and application of the REKO-DIREKT code for the simulation of passive autocatalytic recombiners operational behaviour. Nucl. Technol., 196, 355–366. DOI: 10.13182/NT16-7.
17. Rożeń, A. (2015). Modelling of a passive autocatalytic hydrogen recombiner – a parametric study. Nukleonika, 60, 161–170. DOI: 10.1515/nuka-2015-0002.
18. Poling, B. E., Prausnitz, J. M., & O’Connell, J. P. (2001). The properties of gases and liquids. New York: McGraw-Hill.
19. The European Stainless Steel Development Asso-ciation. (2007). Stainless steel: Tables of technical properties. Materials and Application Series, 5. Luxemburg: Euro Inox.
20. Boehm, J. (2007). Modellierung der Prozesse in kata-lytischen Rekombinatoren. Schriften des Forschungsz-entrums Jülich, Reihe Energietechnik, Band 61.
21. Monarch Instrument. (2003). Table of emissivity. Re-trieved June 2017, from https://monarchinstrument.com/pages/library.
22. Warnatz, J., Allendorf, M. D., Kee, R. J., & Coltrin, M. E. (1994). A model of elementary chemistry and fl uid mechanics in the combustion of hydrogen on platinum surfaces. Combust. Flame, 96, 393–406.
23. Schefer, R. W., Cheng, R. K., Robben, F. A., & Brown, N. J. (1978). Catalyzed combustion of H2/air mixtures on a heated platinum plate. In The Western States Sec-tion/The Combustion Institute, Spring Meeting, 17–18 April 1978 (Paper No. 78–33). Boulder, CO, USA.
24. Idelchik, I. E. (2008). Handbook of hydraulic resist-ance. New York: Begell House, Inc.
25. Shah, R. K., & London, A. L. (1978). Laminar fl ow forced convection in ducts. In T. F. Irvine, J. P. Hartnett (Eds.), Advances in heat transfer. Suppl. 1. New York: Academic Press.
26. Zhi-qing, W. (1982). Study on correction coeffi cients of laminar and turbulence entrance region effect in round pipe. Appl. Math. Mech., 3, 433–446.
27. ANSYS, Inc. (2016). ANSYS Fluent Theory Guide. Release 17.2. Canonsburg: ANSYS, Inc. Retrieved June 2017, from https://pl.scribd.com/docu-ment/342817281/ANSYS-Fluent-Theory-Guide.
28. Dimotakis, P. E. (2000). The mixing transition in tur-bulent fl ows. J. Fluid Mech., 409, 69–98.


![Sant Antoni - Stella Maris - Orosol Hotel · [ ]7 1 2 Sant Antoni - Stella Maris Sant Antoni - Port des Torrent Sant Antoni - Sant Rafel - Eivissa [ ]13 4 5 6 Sant Antoni - Cala de](https://img.dokumen.tips/doc/110x75/5f3d90e6d6626a2ec83570af/sant-antoni-stella-maris-orosol-7-1-2-sant-antoni-stella-maris-sant-antoni.jpg)