Embed Size (px)
Citation preview

Simulation of neutron production at
a medical linear acceleratorDiploma thesis
Institute of Experimental PhysicsUniversity of Hamburg
andUniversity Medical Center Hamburg-Eppendorf
Center of OncologyDepartment of Radiotherapy and Radio-Oncology
presented by
Julian Becker
Hamburg6.7.2007

This thesis was supported by the German research foundation (DFG projectSCHM1070/26-1).
Referees of this diploma thesis are:
• Prof. Dr. Rainer Schmidt, Center of Oncology / Department of Radiotherapy andRadio-Oncology, University Medical Center Hamburg-Eppendorf, Germany
• Prof. Dr. Peter Schleper, Institute of Experimental Physics, University Hamburg,Germany

Contents
1 Introduction 11.1 Motivation . . . . . . . . . . . . . . . . . . . . . . . . . . . . . . . . . . . . 11.2 Neutrons in radiation therapy . . . . . . . . . . . . . . . . . . . . . . . . . 21.3 Unwanted neutrons in radiation therapy . . . . . . . . . . . . . . . . . . . 2
2 Ionizing radiation and its interaction with matter 32.1 Definition . . . . . . . . . . . . . . . . . . . . . . . . . . . . . . . . . . . . 3
2.1.1 Directly ionizing radiation . . . . . . . . . . . . . . . . . . . . . . . 32.1.2 Indirectly ionizing radiation . . . . . . . . . . . . . . . . . . . . . . 3
2.2 Sources . . . . . . . . . . . . . . . . . . . . . . . . . . . . . . . . . . . . . . 32.2.1 Isotopes as sources of radiation . . . . . . . . . . . . . . . . . . . . 32.2.2 Neutron sources . . . . . . . . . . . . . . . . . . . . . . . . . . . . . 42.2.3 Medical linear electron accelerators . . . . . . . . . . . . . . . . . . 5
2.3 Interaction of radiation with matter . . . . . . . . . . . . . . . . . . . . . . 72.3.1 Definitions . . . . . . . . . . . . . . . . . . . . . . . . . . . . . . . . 72.3.2 Charged particles . . . . . . . . . . . . . . . . . . . . . . . . . . . . 72.3.3 Photons . . . . . . . . . . . . . . . . . . . . . . . . . . . . . . . . . 102.3.4 Neutrons . . . . . . . . . . . . . . . . . . . . . . . . . . . . . . . . . 12
2.4 Clinical dosimetry . . . . . . . . . . . . . . . . . . . . . . . . . . . . . . . . 152.4.1 Dosimetric quantities . . . . . . . . . . . . . . . . . . . . . . . . . . 152.4.2 Ionization chambers . . . . . . . . . . . . . . . . . . . . . . . . . . 17
3 Monte Carlo simulations 193.1 The Monte Carlo method . . . . . . . . . . . . . . . . . . . . . . . . . . . 193.2 MCNPX . . . . . . . . . . . . . . . . . . . . . . . . . . . . . . . . . . . . . 20
3.2.1 The input . . . . . . . . . . . . . . . . . . . . . . . . . . . . . . . . 223.2.2 The output . . . . . . . . . . . . . . . . . . . . . . . . . . . . . . . 253.2.3 Variance reduction . . . . . . . . . . . . . . . . . . . . . . . . . . . 253.2.4 Tallies . . . . . . . . . . . . . . . . . . . . . . . . . . . . . . . . . . 27
3.3 The Siemens Primus medical linear accelerator . . . . . . . . . . . . . . . . 273.3.1 Components . . . . . . . . . . . . . . . . . . . . . . . . . . . . . . . 283.3.2 The medical accelerator as electron source . . . . . . . . . . . . . . 313.3.3 The medical accelerator as photon source . . . . . . . . . . . . . . . 333.3.4 The medical accelerator as neutron source . . . . . . . . . . . . . . 35
3.4 Neutron distribution inside a treatment room . . . . . . . . . . . . . . . . 38
iii

Contents
3.5 Alternative plastics for radiation protection . . . . . . . . . . . . . . . . . 42
4 Ionization chambers for neutron detection 454.1 Ionization chambers used for measurements . . . . . . . . . . . . . . . . . 45
4.1.1 Paired chamber system . . . . . . . . . . . . . . . . . . . . . . . . . 464.1.2 Twin chamber system . . . . . . . . . . . . . . . . . . . . . . . . . 474.1.3 Triple chamber system . . . . . . . . . . . . . . . . . . . . . . . . . 47
4.2 Monte Carlo studies of the used ionization chambers . . . . . . . . . . . . 484.2.1 Simulation of the boron decay . . . . . . . . . . . . . . . . . . . . . 49
4.3 Calibration of the ionization chambers . . . . . . . . . . . . . . . . . . . . 494.3.1 60Co calibration . . . . . . . . . . . . . . . . . . . . . . . . . . . . . 504.3.2 kQ determination for photon dosimetry . . . . . . . . . . . . . . . . 514.3.3 Response to neutron irradiation . . . . . . . . . . . . . . . . . . . . 51
4.4 Triple chamber system at the LFR . . . . . . . . . . . . . . . . . . . . . . 56
5 Experiments 595.1 Shielding with tungsten . . . . . . . . . . . . . . . . . . . . . . . . . . . . 60
5.1.1 Simulations . . . . . . . . . . . . . . . . . . . . . . . . . . . . . . . 605.1.2 Measurements . . . . . . . . . . . . . . . . . . . . . . . . . . . . . . 61
5.2 Neutrons in a solid water phantom . . . . . . . . . . . . . . . . . . . . . . 625.2.1 Simulations . . . . . . . . . . . . . . . . . . . . . . . . . . . . . . . 625.2.2 Measurements . . . . . . . . . . . . . . . . . . . . . . . . . . . . . . 65
5.3 Neutrons in a water phantom . . . . . . . . . . . . . . . . . . . . . . . . . 675.3.1 Simulations . . . . . . . . . . . . . . . . . . . . . . . . . . . . . . . 675.3.2 Measurements . . . . . . . . . . . . . . . . . . . . . . . . . . . . . . 70
6 Estimation of neutron contamination in clinical treatment situations 736.1 Conventional 3D conformal treatment . . . . . . . . . . . . . . . . . . . . . 73
6.1.1 Standard 4-field box for prostate treatment . . . . . . . . . . . . . . 746.1.2 Crossed 4-field box for prostate treatment . . . . . . . . . . . . . . 74
6.2 IMRT treatments with 15 MV photons . . . . . . . . . . . . . . . . . . . . 756.2.1 IMRT for the prostate . . . . . . . . . . . . . . . . . . . . . . . . . 756.2.2 IMRT in a hypothetical head & neck case . . . . . . . . . . . . . . 76
6.3 Summary of clinical results . . . . . . . . . . . . . . . . . . . . . . . . . . . 76
7 Summary 777.1 Monte Carlo simulations . . . . . . . . . . . . . . . . . . . . . . . . . . . . 77
7.1.1 Characterization of the linac . . . . . . . . . . . . . . . . . . . . . . 777.1.2 Neutron distribution inside the treatment room . . . . . . . . . . . 78
7.2 Ionization chambers for neutron detection . . . . . . . . . . . . . . . . . . 787.2.1 Ionization chamber simulations . . . . . . . . . . . . . . . . . . . . 787.2.2 Calibration of the ionization chambers . . . . . . . . . . . . . . . . 79
7.3 Experiments . . . . . . . . . . . . . . . . . . . . . . . . . . . . . . . . . . . 79
iv

Contents
7.3.1 Neutron and photon dose distributions . . . . . . . . . . . . . . . . 797.3.2 Shielding with tungsten . . . . . . . . . . . . . . . . . . . . . . . . 807.3.3 Neutrons in a solid water phantom . . . . . . . . . . . . . . . . . . 807.3.4 Neutrons in a water phantom . . . . . . . . . . . . . . . . . . . . . 80
7.4 Neutron contamination in clinical situations . . . . . . . . . . . . . . . . . 80
A Appendix 83A.1 Introduction and summary of this work in German language . . . . . . . . 83
A.1.1 Einleitung . . . . . . . . . . . . . . . . . . . . . . . . . . . . . . . . 83A.1.2 Zusammenfassung . . . . . . . . . . . . . . . . . . . . . . . . . . . . 84
A.2 Set-up and calibration of a triple ionization chamber system for dosimetryin mixed neutron/photon fields . . . . . . . . . . . . . . . . . . . . . . . . 88
A.3 Photoneutron production of a Siemens Primus linear accelerator studied byMonte Carlo methods and a paired magnesium and boron coated magnesiumionization chamber system . . . . . . . . . . . . . . . . . . . . . . . . . . . 102
Bibliography 119
v


List of Figures
2.1 Comparison of photo effect, compton effect and pair production . . . . . . 112.2 Photonuclear cross-sections for selected materials . . . . . . . . . . . . . . 132.3 Impulse height against chamber voltage . . . . . . . . . . . . . . . . . . . . 17
3.1 An example of an MCNP history . . . . . . . . . . . . . . . . . . . . . . . 203.2 Scheme of the treatment head . . . . . . . . . . . . . . . . . . . . . . . . . 273.3 MCNPX plot of the treatment head geometry . . . . . . . . . . . . . . . . 293.4 Gold and tungsten target . . . . . . . . . . . . . . . . . . . . . . . . . . . . 303.5 Percentage difference of measured depth dose curve and calculated depth
dose curve . . . . . . . . . . . . . . . . . . . . . . . . . . . . . . . . . . . . 313.6 Energy distribution of primary electrons impinging on the target . . . . . . 323.7 Normalized photon spectrum of the 15 MV mode at SSD 100 . . . . . . . . 333.8 Depth dose curve and beam profiles in a water phantom . . . . . . . . . . 343.9 Normalized neutron source spectrum . . . . . . . . . . . . . . . . . . . . . 363.10 Differential neutron spectrum at production and isocenter . . . . . . . . . 373.11 Relative neutron flux distribution along central axis (X=0 cm, Y=0 cm). . 383.12 Distribution of neutrons in the L3 treatment room for Z=110 cm . . . . . . 393.13 Distribution of neutrons in the L3 treatment room for Z=210 cm . . . . . . 403.14 Distribution of neutrons in the L3 treatment room for X=-80 cm . . . . . . 413.15 Thermal neutron flux reduction by implementing radiation protection plastic 423.16 Total neutron flux reduction by implementing radiation protection plastic . 43
4.1 MCNPX geometry used for the simulation of the ionization chambers . . . 484.2 Neutron spectrum of the PTB reference field . . . . . . . . . . . . . . . . . 534.3 Energy dependence of k values . . . . . . . . . . . . . . . . . . . . . . . . . 554.4 Response of MgB/Ar chamber to maxwellian distributed thermal neutrons. 56
5.1 MCNPX Geometry plots of set-up with 6 cm tungsten and EasyCube . . . 605.2 Comparison of measurement and calculation for the tungsten shielding ex-
periment . . . . . . . . . . . . . . . . . . . . . . . . . . . . . . . . . . . . . 615.3 Influence of the patient couch on simulation outcome . . . . . . . . . . . . 625.4 Calculated neutron dose along the central axis in different materials . . . . 635.5 Distributions in the central plane of the EasyCube . . . . . . . . . . . . . . 645.6 Comparison of measurement and calculation for the EasyCube . . . . . . . 655.7 Calibration of the paired chamber system to neutron dose in the EasyCube 665.8 Distributions in the central plane of the water phantom . . . . . . . . . . . 68
vii
List of Figures
5.9 Field size dependency in the water phantom . . . . . . . . . . . . . . . . . 695.10 Comparison of measurement and calculation for the water phantom . . . . 715.11 Calibration of the paired chamber system to neutron dose in the water phan-
tom . . . . . . . . . . . . . . . . . . . . . . . . . . . . . . . . . . . . . . . 72
6.1 Standard and crossed 4-field box plan for prostate treatment . . . . . . . . 746.2 Prostate and head & neck IMRT plan . . . . . . . . . . . . . . . . . . . . . 75
viii

List of Tables
3.1 Isotopic composition of elements used in simulations. . . . . . . . . . . . . 233.2 Elemental composition of materials used in simulations. . . . . . . . . . . . 243.3 Coefficients for fits used in figures 3.7 and 3.9 . . . . . . . . . . . . . . . . 343.4 Contribution of individual accelerator components to the overall neutron
production. . . . . . . . . . . . . . . . . . . . . . . . . . . . . . . . . . . . 35
4.1 krel values determined at two linacs . . . . . . . . . . . . . . . . . . . . . . 464.2 ND,W values determined by 60Co calibration . . . . . . . . . . . . . . . . . 514.3 kQ values derived at medical linear accelerators . . . . . . . . . . . . . . . 524.4 h values determined during calibration . . . . . . . . . . . . . . . . . . . . 524.5 Reduction ratios of the lithium cap determined with the MgB/Ar chamber. 544.6 k values reproduced from Waterman et al and Raaijmakers et al . . . . . . 554.7 i values determined directly or indirectly for the chambers . . . . . . . . . 574.8 Dose rate of individual dose components at the LFR . . . . . . . . . . . . 57
6.1 Results of measurements in clinical set-ups . . . . . . . . . . . . . . . . . . 76
ix


1 Introduction
1.1 Motivation
Radiation therapy is an established way of cancer treatment. This is somehow ironic asradiation is highly carcinogenic. Radiotherapy delivers high doses of radiation to a targetedvolume, which are highly toxic, even to tumor cells. This leads to the main challenge inradiotherapy, applying high doses to tumorous tissue, while simultaneously sparing healthytissue.
Several kinds of radiotherapy are established today, differing in the form of radiationdelivery. One way of irradiation uses a medical linear accelerator (linac). The linac studiedin this work is a Siemens Primus electron accelerator, which creates photon fields by thebremsstrahlung process. The maximum photon energy of the Siemens Primus machinestudied was 14.5 MeV. This exceeds the photonuclear threshold energy (≈ 7 MeV in heavymetals) and results in a neutron contamination of the photon beam.
Because of this neutron contamination there is an ongoing discussion whether high pre-cision radiation treatments like intensity modulated radiation therapy (IMRT) should bedelivered using high energy photon fields [1].
This work investigates photoneutron contamination in high energy photon fields. As thephotoneutron contamination of the studied linac is small, its detection requires adequatedetectors, which are not commonly employed in radiotherapy. Three different ionizationchambers, specially prepared for neutron measurements, were used for neutron detection.These chambers were investigated with Monte Carlo methods and calibrated experimen-tally for these measurements.
As it is important to distinguish between calculated data which is adapted to measure-ments and calculations which are verified by measurements, the accelerator was studiedwith Monte Carlo calculations in a two step process. In the first step the photon produc-tion of the accelerator was studied and the calculations were tuned until calculated dosedistributions agreed with dose distributions measured at the linac. In the second step neu-tron production of this linac was studied. These calculations were verified with ionizationchamber measurements and used to calibrate the chambers to neutron dose.
Having calibrated the ionization chambers, neutron contamination in clinical situations(using high energy photon fields) was studied as this topic is of major concern in medicalphysics.
This work presents results not in the chronological order of their achievement, but sortedby topic. Due to the time consuming nature of Monte Carlo simulations several tasks hadto be done simultaneously, producing results after work on a new topic had already begun.
1

1 Introduction
1.2 Neutrons in radiation therapy
Neutrons have been used in radiation therapy for a long time. At the University MedicalCenter Hamburg-Eppendorf (UKE) a neutron generator for therapeutical neutron irradia-tion was in use until 1996. Today treatment with photons is usually favored over treatmentwith neutrons. As neutrons scatter easily and activate other materials, special radiationprotection, not needed when irradiation is done with photons, has to be implemented.
However there are special types of cancer which are resistant to photon and electronradiation and alternative forms of treatment are needed. Neutrons can be used in thesecases either for direct irradiation or in boron neutron capture therapy (BNCT).
1.3 Unwanted neutrons in radiation therapy
Unwanted neutrons in radiation therapy are mostly created by photonuclear reactions.High energy photons created in the high energy photon mode of the linac interact with
nuclei of high Z materials inside the accelerator and liberate neutrons. These neutronsscatter throughout the treatment room and reach the patient. As neutrons have a highrelative biological effectiveness (RBE) even small neutron doses may be harmful to thepatient. In this case special radiation protection methods have to be implemented in orderto prevent the exposure of patient and medical staff.
Unwanted neutrons are usually considered negligible for radiotherapy patients, but ac-counted for when designing radiation protection for treatment rooms.
2

2 Ionizing radiation and its interactionwith matter
The contents of this chapter is mostly reproduced from four books [2, 3, 4, 5].
2.1 Definition
Ionizing radiation is either particle radiation or electromagnetic radiation in which anindividual particle carries enough energy to ionize an atom or molecule by completelyremoving an electron from its orbit. Ionizing radiation can be separated into two groups,directly ionizing radiation and indirectly ionizing radiation.
2.1.1 Directly ionizing radiation
Directly ionizing radiation is charged particle radiation. Examples of charged particlesinclude electrons, protons and α-particles. Due to the coulomb interaction charged particlescan ionize many atoms along their trajectory, as long as their energy is high enough.
2.1.2 Indirectly ionizing radiation
Indirectly ionizing radiation is radiation of particles without charge. Examples includeneutron and photon radiation. Interaction with the surrounding matter is rare comparedto charged particles, most of the ionizations are done by secondary charged particles.
2.2 Sources
Many different sources of radiation exist. In radiotherapy sources are divided into sourcesfor brachytherapy and external beam therapy. Sources for brachytherapy are mostly ra-dionuclides which are brought as close to the targeted volume as possible. Sources forexternal beam therapy are mostly accelerators, although sources using isotopes exist.
2.2.1 Isotopes as sources of radiation
Radionuclides used in radiotherapy are either pure β-sources or combined β-γ-sources.Pure beta-emitters are used in brachytherapy, as the typical range of beta radiation in
human tissue is between 0.5 and 1.5 mm.
3

2 Ionizing radiation and its interaction with matter
Typical beta sources include 90Sr/90Y used in cardiovasular brachytherapy and 106Ruused for treatment of eye tumors. The 90Sr/90Y isotope has a maximum electron energyEmax = 0.55/2.27 MeV and a half life time T1/2 = 27.7a/64h, 106Ru has Emax = 3.55 MeVand T1/2 = 373.6d.
The other type of radionuclide used is the combined β-γ-emitter. These Isotopes areprimarily beta emitters, whose decay products then produce gamma radiation and arecommonly called gamma emitters.
Common gamma emitters used for radiotherapy are 192Ir, 60Co and 137Cs. 192Ir is used forbrachytherapy and has a maximum electron energy Emax = 0.672 MeV , gamma energiesEγ = 296− 612 keV and a half life time of T1/2 = 73.8d.
60Co is used routinely for calibration purposes. Most commercially available ionizationchambers are calibrated to 60Co radiation (Eγ = 1.25 MeV , T1/2 = 5.27a).
137Cs (Eγ = 662 keV , T1/2 = 30.14a) and 60Co have been used for external beam therapy.Although use of these isotopes has been discontinued and medical electron accelerators areused instead.
2.2.2 Neutron sources
The therapeutic use of neutrons has several prerequisites. Neutrons have to penetrate farenough into tissue, in order to treat deep seated tumors, and neutron flux has to be high,in order to have adequate treatment times.
When irradiation is done with neutrons an additional photon contamination is created inabsorbers with a high hydrogen content (like a patient), as thermal neutrons are capturedby hydrogen atoms.
In BNCT the boron capture reaction is utilized to create a dose boost in certain areas.As 10B captures thermal neutrons and emits an α-particle and a lithium nucleus, whichhave a very short range in human tissue.
Free neutrons do not occur naturally, so they have to be created artificially. As neutralparticles with an average lifetime of 15 minutes they cannot be stored or accelerated likecharged particles. Therefore neutrons have to be created with energies higher or equal ofthe intended treatment energy.
Free neutrons can be created in the following 4 ways:
• In a nuclear reactor by neutron induced fission.
• In radioactive sources that undergo spontaneous fission.
• In reactions of type (α,n) at light target nuclei.
• In induced nuclear reactions at accelerators.
Nuclear reactors usually use 235U and 238U as fuel of the fission process. Depending onreactor design, the actual neutron spectrum and flux available for irradiation varies.
The most important radioactive neutron source is californium. 252Cf is an α-source witha half life of 2.645 years, which decays with 3.1% probability by spontaneous fission. The
4

2.2 Sources
mean neutron energy is between 2 and 2.5 MeV with 3.76 neutrons emitted per fission.α-particles and other fission products are usually shielded by a suitable encapsulation. Thefission products produce photon radiation with roughly the same intensity as the neutronradiation. Due to the low flux and mean energy californium is not suited for externalbeam therapy, but 252Cf sources are seldom used in brachytherapy and more often used forcalibration of neutron dosimeters.
(α,n) sources use an alpha source and a light nuclide as target. The most prominentexample is the Americium-Beryllium-source. The most probable energy is between 3-5 MeV with a maximum of about 11 MeV. No (α,n) source can produce a neutron fluxhigh enough for therapeutic use.
Two distinct types of neutron generators exist: fusion generators and cyclotron acceler-ators. The most common fusion generator (D-T-generator) accelerates deuterons and usesa tritium target. The therapeutically used neutrons from this generator are emitted under90◦ and have a kinetic energy of 14.1 MeV. A neutron generator of this type has been inuse at the UKE until 1996.
Cyclotron accelerators accelerate charged particles like protons or deuterons and use lightisotopes like beryllium or lithium as target. A cyclotron allows to choose the acceleratorenergy and therefore influence the depth dose behavior of the neutron radiation.
2.2.3 Medical linear electron accelerators
Several types of accelerators have been used for medical purposes. The most common typeof accelerator in use today is the electron linear accelerator that will be described here.
Modern medical linear accelerators can be used in two distinct operation modes: electronmode and photon mode. In electron mode primary electrons are used for treatment, inphoton mode photons are produced for treatment.
Delivery of radiation by a medical accelerator is monitored by a special ionization cham-ber system. These monitor chambers are calibrated in terms of monitor units (MU), where100 MU define 1 Gy under reference conditions (depth dose maximum in a water phantomirradiated with a 10 cm × 10 cm photon field).
As the neutron contamination in the photon mode is investigated in this work, theelectron mode is not explained here.
A detailed description of the treatment head components of the Siemens Primus accel-erator is given in the next chapter.
For production of therapeutical radiation following elements of the accelerator are needed:
• the high frequency source, usually a magnetron or a klystron,
• the electron source and acceleration unit,
• the bending magnet, which in inside of the treatment head
• and the treatment head.
5

2 Ionizing radiation and its interaction with matter
Electron source and acceleration unit
Commonly a hot cathode is used as electron source. A hot cathode liberates electrons arethermally from a tungsten wire coated with barium.
Electrons are extracted from the cathode with a Wehnelt cylinder. Cathode extractionand cylinder are summarily called electron gun.
The acceleration of the electrons is done in a cavity waveguide. Two different principlesof acceleration exist. The traveling wave principle and the standing wave principle, whichare not explained here.
Due to technical aspects of electric power supply and cooling mechanisms the acceleratordoes not work continuously but pulsed. A typical impulse sequence of macropulses isconstructed from 2× 10⁴ micropulses of 30 ps duration followed by a 300 ps delay (3 GHzfrequency) each micropulse contains about 104 electrons. The macropulse frequency istypically 200 Hz.
Bending magnet
Being accelerated horizontally, the electrons have to be redirected towards the patientbefore treatment. The Siemens Primus machine uses a 270◦ bending magnet for thispurpose. The magnet contains inhomogeneous magnetic fields that focus the electrons.Energy selection is achieved by selecting a narrow electron flight path. Electrons deviatingfrom this path are not used for treatment.
Treatment head of the Siemens Primus accelerator
The treatment head geometry is essential for the final dose distribution. In photon modeprimary electrons are directed onto a bremsstrahlung target. This target creates brems-strahlung with a thin tungsten disk of approximately 1 mm height.
Remaining primary electrons are absorbed in a graphite absorber inside the target. Anadditional aluminium absorber is used in high energy modes and is positioned underneaththe target inside the primary collimator.
Directly underneath the target the primary collimator is located. It is made from tung-sten and defines the maximum field size. Being of high density, the primary collimatorabsorbs photons that are scattered outside of the clinically used treatment field.
As the spectral distribution of bremsstrahlung has an angular dependence the dosedistribution would have a strong peak at the central axis. To create a flat dose profilea flattening filter is used. It is positioned at the lower end of the primary collimator.Flattening filters have 5 major influences on the photon field. They scatter photons, theyreduce the mean photon energy by pair production and compton scattering, they absorblow energy photons and therefore harden the beam, they reduce the overall intensity of thephoton beam and contaminate the photon field with charged (electrons) and uncharged(neutrons) secondary particles.
Depending on the thickness and atomic number of the flattening filter a different effectdominates. The flattening filter of the Siemens Primus is made from steel and optimized
6

2.3 Interaction of radiation with matter
for beam hardening.Afterwards the photon beam is collimated by focussing Y-jaws and a focussing multi-
leaf-collimator (MLC) to an individual field geometry. Both jaws and MLC are made oftungsten. The individual leaves of the MLC have a tongue and groove design to reduceinter leave transmission.
2.3 Interaction of radiation with matter
When particles collide with a target a variety of reactions can occur, depending on thetype of particle and its energy. Generally the distinction between scattering processes,in which the particle makes an elastic (particle energy unchanged) or inelastic (particleenergy changed) collision with the target, and absorption processes, in which the particledisappears, is made.
2.3.1 Definitions
For the quantitative characterization of particle reactions the cross-section is used. If J isa particle current, which is the number of particles crossing a 1 cm2 surface perpendicularto the beam direction per second, that hits a thin target, which contains N identical atomicnuclei per cm3, the number of events per second and cm3 is
Φ = JNσ. (2.1)
Assuming that the current penetrates the target without attenuation, the proportionalityconstant σ is called interaction cross-section. σ has the dimension cm2, but commonly theunit barn is used, where 1 barn = 10−24 cm2.
Scattering and absorption cross-sections are usually distinguished from another (σs, σa,respectively) and each cross-section is composed of partial cross-sections, such as elasticand inelastic scattering, radiative capture, etc. The sum of all cross sections is called totalcross-section σt.
σt =∑
i
σi (2.2)
2.3.2 Charged particles
When charged particles transverse matter they can undergo the following processes:
1. Elastic collisions with shell electrons.
2. Elastic collisions with nuclei or whole atoms, where a part of the kinetic energy istransferred to the recoiling atom or nucleus.
3. Inelastic collisions with shell electrons, where the released energy is used for ionizationor excitation of the matter.
7

2 Ionizing radiation and its interaction with matter
4. Inelastic collisions, where due to the deflection of the particle in the coulomb field ofnucleus or electrons energy is released in form of bremsstrahlung.
5. Collisions with nuclei that excite the nucleus or initiate nuclear reactions.
6. Emission of light when the passing particles velocity is larger that the speed of lightin this medium (Cerenkov-radiation).
The domination of certain processes is strongly dependent on the particle type and theparticle energy.
The following definitions are used when calculating energy losses of charged particles:the mean binding energy of an electron to its atom 〈E(e)
B 〉 = 13.5Z and ne = ZAρNA, the
electron density of the matter. With ρ being the mass density of the matter and NA theAvogadro number.
Energy loss of heavy charged particles
Energy loss of charged particles is governed by the Bethe-Bloch formula describing theenergy transfer to shell electrons of the matter.
−(dE
dx) =
z2e4ne
8πε20v
2me
{ln 2mev2
〈E(e)B 〉(1− β2)
− β2} (2.3)
Enough energy might be transferred to liberate a shell electron. The librated electron iscalled δ- or knock-on electron. The kinematics are those of an elastic collision, leading toan kinetic energy of the electron of
Ee =4mM
(m + M)2E cos2 φ, (2.4)
where m is the electron mass, M and E the charged particle mass and energy and φ is theangle between δ-electron and charged particle trajectory (0 ≤ φ ≤ π/2).
For low energies (β � 1) the energy loss (equation 2.3) decreases like 1/v2 with increasingenergy until reaching a minimum at about E = 2Mc2 to 3Mc2. For higher energies theenergy loss is rising again until reaching a saturation value at ultra-relativistic energies(β ≈ 1).
As a consequence of this behavior a heavy particle looses most of its energy at the endof its trajectory, causing the Bragg peak. This principle is used in proton and heavy iontherapy.
Energy loss of electrons
The total energy loss for electrons consists of two components, the energy loss due tocollisions and the energy loss due to radiation.
(dE
dx) = (
dE
dx)col + (
dE
dx)rad (2.5)
8

2.3 Interaction of radiation with matter
Collision (ionization) energy losses of electrons can be divided into non-relativistic (β < 0.5,(γ − 1) � 1) case
−(dE
dx)col =
e4ne
4πε20mev2
{ln mev2
2〈E(e)B 〉
} (2.6)
and ultra-relativistic (γ � 1) case
−(dE
dx)col =
e4ne
4πε20mec2
{lnEe√
γ√
2〈E(e)B 〉
+1√
γ}. (2.7)
Following the laws of electrodynamics every accelerated charged particle emits electro-magnetic radiation. The process of slowing down and changing direction leads to thecreation of bremsstrahlung. The corresponding energy loss is called radiative energy loss.For heavy nuclei (Z=10...100) the following equations are valid.
−(dE
dx)rad ∼ NV EeZ
2 ln Ee (2.8)
where NV is the number of atoms per m3. In the ultra-relativistic case a saturation valueis reached due to the shielding of the shell electrons.
−(dE
dx)rad = constEeZ
2 (2.9)
Range of charged particles in matter
The mean range 〈R〉 of heavy particles in matter can be calculated from ionization losses(equation 2.3).
〈R〉 =∫ 0
Epart
dE
−(dE/dx)(2.10)
For intermediate particle energies Epart, equation 2.10 can be simplified to:
〈R〉 =mpartv
4part
z2. (2.11)
These equations do not apply to electrons, because of their low mass. As the numberof electrons decreases continuously with depth (except near the surface), mean range R(number of electrons has dropped to 50 %) and maximum range Rmax (last electron hasdisappeared) have to be distinguished.
For electron energies in the therapeutical range (1-50 MeV) Rmax can be approximatedas one half of the energy.
Rmax/cm = 0.5× initial energy / MeV (2.12)
9

2 Ionizing radiation and its interaction with matter
2.3.3 Photons
Photon radiation is known by many names. Coming from an x-ray tube photons are calledx-rays, produced by slowing down of electrons photons are called bremsstrahlung, emittedfrom radioactive decay they are called gamma radiation, etc. The fundamental physicsis the same, as all of the mentioned types of radiation consist of photons. Photons areelectromagnetic waves with a wavelength of λ = hc/Eγ. The wave character of photonsis important for low energy photons, above Eγ > 10 keV the wavelength is smaller thedimension of an atom (5× 10⁻¹¹m), therefore the wave character can be neglected.
Photons can interact via the electromagnetic force with shell electrons, nuclei or otherelectromagnetic fields either elastically (preserving λ) or inelastically (changing λ).
Elastic reactions are dominant at very low photon energies and include the recoil freeabsorption and emission of photons in nuclei (Mossbauer effect), the resonant excitation ofshell electrons (Thomson scatter), coherent Rayleigh scatter and interference in solid statematerials (Bragg diffraction).
Inelastic scattering includes the compton effect (scattering at a free shell electron ornucleus), scattering at a nucleus with excitation, incoherent scattering at single nucleonsin the nucleus, etc.
Photons can also be absorbed by a shell electron (photo effect), the nucleus (photonucleareffect) or in a particle production process (electron-positron pairs or mesons).
For photon radiation one cannot define the concept of range. Instead of continuouslyloosing energy, the number of photons (flux) is decreasing continuously with the path xand the number of photons.
dΦ = −µΦdx (2.13)
Φ(x) = Φ0e−µx, (2.14)
where Φ0 is the initial flux and µ is the linear absorption coefficient. It is a product ofatomic concentration (NV ) and effective absorption cross-section (σa), with consists of thecross-sections for the photo effect, compton effect and pair production (the photonucleareffect is small compared to the other effects).
Photo effect
The photo effect liberates a shell electron from its atom. The resulting kinetic energy ofthe photoelectron is
Ee = Eγ − E(i)B , (2.15)
where Eγ is the photon energy and E(i)B is the binding energy of the electron on the (i)-th
shell. Energy and momentum conservation require the presence of a nucleus that absorbsa part of the momentum.
The photo effect cross-section shows characteristic peaks at Eγ = E(i)B and is decreasing
with increased energy. When electrons from inner shells are liberated characteristic x-raysare produced by the refilling of the vacant shells from the outer shells.
10

2.3 Interaction of radiation with matter
Figure 2.1: Comparison of photo effect, compton effect and pair production for differentmaterials [3].
There is an analytic expression for the cross-section of the photo effect at the K-shellper atom if Eγ > E
(K)B :
σ(K)photo/cm
2 = 4√
2α4σ0Z5
(Eγ/mec2)7/2∼ Z5
E7/2γ
(2.16)
and for energies Eγ � E(K)B :
σ(K)photo/cm
2 = 1.5α4σ0Z5
(Eγ/mec2)∼ Z5
Eγ
, (2.17)
where α is the fine-structure constant and σ0 = 8πe2
3mec2the Thomson cross-section of the
electron.
Compton effect
The compton effect is a scattering process that transfers a part of the photon energy tothe electron. Although the electron is bound to the atom it can be considered free and atrest (Eγ � E
(i)B ). The kinematics of the compton effect can be deducted from energy and
momentum conservation. The energy of the scattered photon (Eγ′) and electron (Ee) is
Eγ′ = Eγ1
1 + ε(1− cos θ)(2.18)
Ee = Eγ1− cos θ
1 + ε(1− cos θ), (2.19)
11

2 Ionizing radiation and its interaction with matter
where θ is the angle between the undisturbed photon direction and the scattered photondirection and ε = Eγ/mec
2.For ε � 1 the cross-section is
σc = πr2e
Z
ε(1
2+ ln 2ε) ∼ Z
Eγ
. (2.20)
Compton scattering at atomic nuclei can be neglected as its electromagnetic radius issmall compared to that of the electron.
Pair production
Pair production is the process of emission of positron and electron due to absorptionof a photon in the coulomb field of an atomic nucleus or electron. Pair production inthe coulomb field of a nucleus has a threshold energy of Eth = 2mec
2 = 1.02 MeV ,which is the combined rest mass of electron and positron. The cross-section for energies5mec
2 < Eγ < 50mec2 is
σP ∼ Z2 ln Eγ, (2.21)
rising slowly for higher energies until it reaches a nearly constant value for energies Eγ >103mec
2.σP
∼= 12αZ2r2e (2.22)
The average angle Θ between both particles is reduced with increasing energy.
Θ =mec
2
Eγ
(2.23)
Photonuclear effect
The photonuclear (γ,n) reaction is the interaction of a photon with the nucleus and is aneutron liberation process. The photon energy has to be greater than the binding energyof the last neutron in the nucleus, which is usually in the range of 5 MeV (13C) to 20 MeV(4He). Lower threshold energies exist in deuterium (2.23 MeV) and beryllium (1.67 MeV)and instable isotopes (e.g. 8Li 2.03 MeV and 16N 2.5 MeV).
The cross-section of the photonuclear effect is characterized as a giant dipole resonanceand most pronounced in materials with a high Z, as shown in figure 2.2. An exceptionto this rule is found in the (γ,n) cross-section of 13C. This cross-section increases almostlinearly from 0.01 mb at 5 MeV to 8 mb at 25 MeV.
When considering photon attenuation, the photonuclear effect is usually neglected, asphoto effect, compton scattering and pair production have higher cross-sections.
2.3.4 Neutrons
Neutrons are different to the aforementioned particles as they are massive but carry nocharge. This allows neutrons to travel relatively free in matter even at very low energies.
12

2.3 Interaction of radiation with matter
Figure 2.2: Photonuclear cross-sections for selected materials. Values were reproduced fromthe EXFOR database of the Nuclear Energy Agency [6]. The maximum photonenergy produced by the studied accelerator is shown for comparison.
The collision stopping power of neutrons is approximately 106 times smaller than that ofprotons, as neutrons mainly interact with atomic nuclei via the strong nuclear force.
Neutrons carry a magnetic moment and can be used to investigate magnetic materials.No magnetic effects were studied, so all magnetic properties were neglected.
Elastic scatter
Elastic scattering of neutrons is almost always direct elastic scattering, also identified aspotential scattering. The neutron does not form a compound nucleus but is interactingwith the nuclear potential, which is the average of all interactions with other nucleons.Compound elastic scattering, that is the absorption of the neutron into a compound nucleusand emission of a neutron of identical energy, exists in in the region where the cross-sectionshows resonance behavior.
In solid state materials Bragg diffraction can occur.
Inelastic scatter
All inelastic reactions absorb the neutron into the nucleus forming a compound nucleus.Excess energy excites this compound. Depending on the excitation energy one ore morethe following reactions may happen:
13

2 Ionizing radiation and its interaction with matter
1. Radiative capture: Energy is released in one ore more γ-rays. This reaction is alsocalled (n,γ) reaction. The resulting nucleus is frequently unstable against β-decay.
2. Particle production: At sufficiently high energies charged particles and neutrons maybe emitted [(n,α), (n,p), (n,np), (n,2n) etc. reactions] the residual nucleus mayremain in an excited state which subsequently decays by γ-ray emission.
3. Fission: Heavy nuclei may break up. The resulting fragments are usually exitedand can undergo more nuclear reactions. During the fission process neutrons maybe released. If more than one neutron is released the multiplication of neutrons cancause a nuclear chain reaction.
Radiative capture at hydrogen
At hydrogen the incoming neutron is bound to the proton, forming deuterium. The bindingenergy is released as a single photon of 2.23 MeV energy.
(n,p) reaction at nitrogen
Nitrogen captures thermal neutrons and releases a proton of 580 keV energy. This reactionis the major contribution to the kerma factor of thermal neutrons in tissue leaving a 14Cnucleus, which is a beta emitter with a half life of 5730 years.
Boron thermal neutron capture
10B (20% abundance in natural boron) has a high neutron capture cross-section. Thecompound nucleus is instable and decays instantly into an alpha particle and a lithiumnucleus. The following decay reaction occurs in 93.9% of the cases:
n +10 B → 7Li∗ + 4He Q = 2.314 MeV7Li∗ → 7Li + γ Eγ = 480 keV
(2.24)
The Q-value distributes to the kinetic energy of lithium and helium roughly 1/3 to 2/3(ELi = 0.84 MeV , Eα = 1.47 MeV ).
In the remaining 6.1% the photon is not emitted
n +10 B → 7Li + 4He Q = 2.796 MeV (2.25)
and kinetic energies are ELi = 1.01 MeV and Eα = 1.77 MeV .
This reaction releases high LET particles with a short range in human tissue and is usedin BNCT treatments to receive a dose boost in areas enriched with 10B.
14

2.4 Clinical dosimetry
2.4 Clinical dosimetry
The main purpose of clinical dosimetry is to measure the absorbed energy of a givenradiation per unit mass. This quantity is called absorbed dose. A common abbreviationomits ”absorbed”. The SI unit of dose is 1 Gy = 1 J/kg. The biological effect of ionizingradiation is mostly defined by the absorbed dose.
The spectral distribution of electron or photon radiation is of secondary importance forthe dose, but can have a large influence on the dosimeter. Dosimeters, such as ionizationchambers use calibration and correction factors to convert the ionic dose of the measure-ment to absorbed dose. These factors are usually dependent upon the spectrum of theradiation.
Often quadratic field sizes centered on the cental axis are used for reference dosimetry.Common field side lengths are 5 cm (5×5 field), 10 cm (10×10 field) and 20 cm (20×20field).
2.4.1 Dosimetric quantities
The fundamental dosimetric unit is the aforementioned unit of the absorbed dose. All dosevalues are dependent on the absorber material. In clinical photon dosimetry frequentlyabsorbed dose to water is used as a reference.
The absorbed dose D is the energy dEabs that is locally absorbed to an irradiated materialof density ρ divided by the mass dm of the irradiated volume dV by the primary radiationand all secondary particles.
Dmat =dEabs
dmmat
=dEabs
ρmat · dV(2.26)
Closely related to absorbed dose are dose rate and integral dose. Dose rate D is differ-ential in time and usually given as Gy/s, Gy/min or Gy/h.
D =dD
dt(2.27)
Integral dose Dint should be correctly called absorbed energy. It is the integral of ab-sorbed dose over irradiated volume.
Dint =∫
VdD · dm =
∫V
dE (2.28)
A value closely related to absorbed dose is kerma K and the derived energy dependentkerma factor K(E). Kerma is an abbreviation for ”kinetic energy released per unit mass”.Unit of the kerma is Gy and unit of kerma factor is Gym2. Kerma is defined as kinetic en-ergy transferred to secondary charged particles Etrans divided by the mass of the irradiatedvolume dm.
Kmat =dEtrans
dmmat
=dEtrans
ρmat · dV(2.29)
15

2 Ionizing radiation and its interaction with matter
The derived kerma factor K(E) is kinetic energy of charged secondary particles releasedper unit mass per unit fluence of monoenergetic particles.
Kmat(E) =dEtrans
dmmat · Φ=
dEtrans
ρmat · dV · Φ(2.30)
Kerma and kerma factors are not directly an estimation for the absorbed dose, as sec-ondary particles can deposit energy outside of the measuring volume. However, if a chargedparticle equilibrium exists and no losses due to bremsstrahlung occur, following equationwill be valid:
Dmat = Kmat =∫ ∞
0K(E)Φ(E) dE (2.31)
A value derived from ionization chamber measurements is ionic dose J. Ionic dose ischarge of one sign created by irradiating a volume of air, divided by its mass.
J =dQ
dmair
=dQ
ρair · dV(2.32)
For radiation protection an equivalent dose H is defined. Unit of equivalent dose isSievert (Sv). The equivalent dose is derived from absorbed dose but weighted with qual-ity factors for radiation type and organ specific factors. Quality factors for photon andelectron radiation are unity by definition. Quality factors for other types of radiation areclosely related to the relative biological effectiveness (RBE) of the radiation and usuallysignificantly higher than unity.
16

2.4 Clinical dosimetry
Figure 2.3: Impulse height against chamber voltage for two different photon energies (Iand II), not to scale. (1) recombination region, (2) saturation region, (3) pro-portional region, (4) transition region , (5) avalanche region (GM region), (6)continuous discharge [4].
2.4.2 Ionization chambers
In clinical dosimetry ionization chambers are commonly used. Ionization chambers are gasfilled detectors.
Ionizing radiation causes ionization in gases and this ionization is detected. Therefore anelectric field is applied to the gas cavity. Depending on the applied voltage the detector hasdifferent characteristics. Ionization chambers operate in the saturation region, proportionalcounters operate in the proportional region and Geiger-Muller-counters (GM-counters)operate in the avalanche region, as shown in figure 2.3.
Ionization chambers can be constructed in a large variety of forms using different gasesand pressures. In clinical dosimetry chambers are mostly of cylindrical design, often with around tip. Air is commonly used as chamber gas, as it is always available and inexpensive.
17


3 Monte Carlo simulations
The text from the first two paragraphs is reproduced in an abbreviated form from theMCNP and MCNPX Manual [7, 8].
3.1 The Monte Carlo method
Monte Carlo methods are very different from deterministic transport methods. Determin-istic methods solve the transport equation for the average particle behavior. By contrast,Monte Carlo obtains answers by simulating individual particles and recording some as-pects (tallies) of their average behavior. The average behavior of particles in the physicalsystem is then inferred (using the central limit theorem) from the average behavior of thesimulated particles.
Monte Carlo ”solves” a transport problem by simulating particle histories. A transportequation need not be written to solve a problem by Monte Carlo. Nonetheless, one canderive an equation that describes the probability density of particles in phase space; thisequation turns out to be the same as the integral transport equation.
Monte Carlo is well suited to solving complicated three-dimensional, time-dependentproblems. Because the Monte Carlo method does not use phase space boxes, there are noaveraging approximations required in space, energy, and time. This is especially importantin allowing detailed representation of all aspects of physical data.
Monte Carlo can be used to duplicate theoretically a statistical process (such as theinteraction of nuclear particles with materials) and is particularly useful for complex prob-lems that cannot be modeled by computer codes that use deterministic methods. Theindividual probabilistic events that comprise a process are simulated sequentially. Theprobability distributions governing these events are statistically sampled to describe thetotal phenomenon. The statistical sampling process is based on the selection of randomnumbers - analogous to throwing dice in a gambling casino - hence the name ”MonteCarlo”. In particle transport, the Monte Carlo technique is pre-eminently realistic (a nu-merical experiment). It consists of actually following each of many particles from a sourcethroughout its life to its death in some terminal category (absorption, escape, etc.). Prob-ability distributions are randomly sampled using transport data to determine the outcomeat each step of its life.
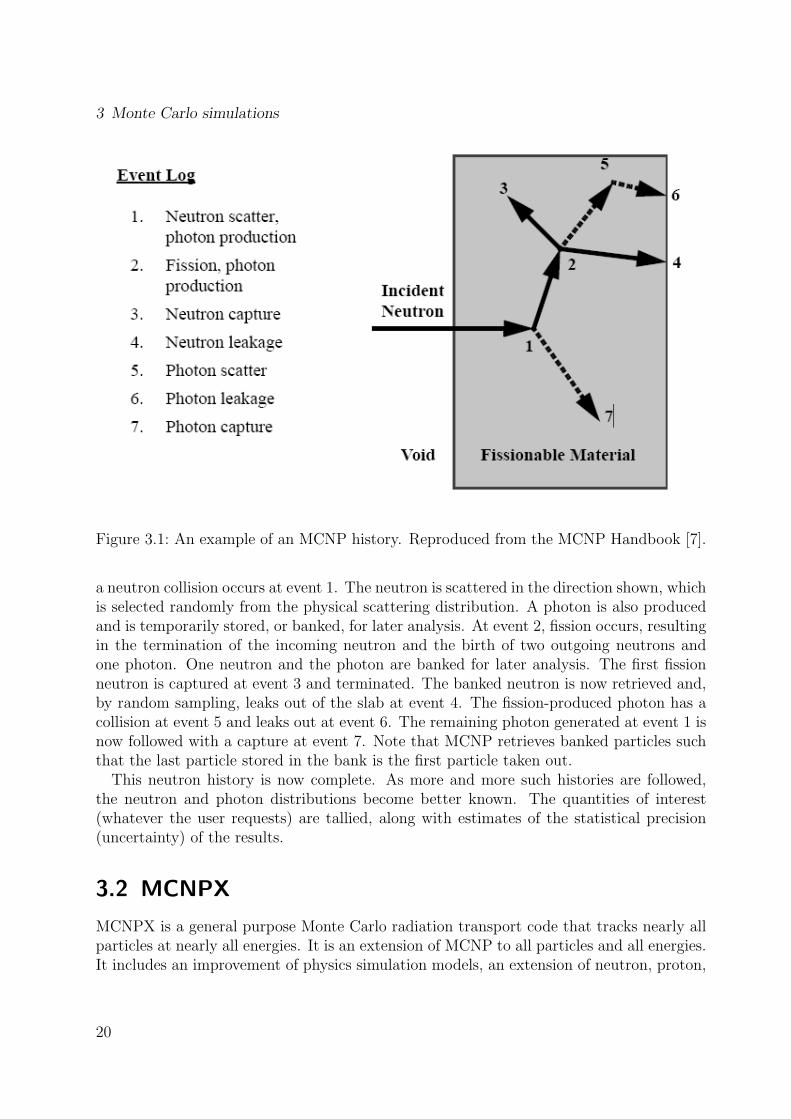
Figure 3.1 represents the random history of a neutron incident on a slab of material thatcan undergo fission. Numbers between 0 and 1 are selected randomly to determine what(if any) and where interaction takes place, based on the rules (physics) and probabilities(transport data) governing the processes and materials involved. In this particular example,
19
3 Monte Carlo simulations
Figure 3.1: An example of an MCNP history. Reproduced from the MCNP Handbook [7].
a neutron collision occurs at event 1. The neutron is scattered in the direction shown, whichis selected randomly from the physical scattering distribution. A photon is also producedand is temporarily stored, or banked, for later analysis. At event 2, fission occurs, resultingin the termination of the incoming neutron and the birth of two outgoing neutrons andone photon. One neutron and the photon are banked for later analysis. The first fissionneutron is captured at event 3 and terminated. The banked neutron is now retrieved and,by random sampling, leaks out of the slab at event 4. The fission-produced photon has acollision at event 5 and leaks out at event 6. The remaining photon generated at event 1 isnow followed with a capture at event 7. Note that MCNP retrieves banked particles suchthat the last particle stored in the bank is the first particle taken out.
This neutron history is now complete. As more and more such histories are followed,the neutron and photon distributions become better known. The quantities of interest(whatever the user requests) are tallied, along with estimates of the statistical precision(uncertainty) of the results.
3.2 MCNPX
MCNPX is a general purpose Monte Carlo radiation transport code that tracks nearly allparticles at nearly all energies. It is an extension of MCNP to all particles and all energies.It includes an improvement of physics simulation models, an extension of neutron, proton,
20

3.2 MCNPX
and photonuclear libraries to 150 MeV and the formulation of new variance-reduction anddata-analysis techniques.
Applications for the code among the beta-test team are quite broad and constantlydeveloping. Examples include the following:
• Design of accelerator spallation targets, particularly for neutron scattering facilities
• Investigations for accelerator isotope production and destruction programs, includingthe transmutation of nuclear waste
• Research into accelerator-driven energy sources
• Medical physics, especially proton and neutron therapy
• Investigations of cosmic-ray radiation backgrounds and shielding for high altitudeaircraft and spacecraft
• Accelerator-based imaging technology such as neutron and proton radiography
• Design of shielding in accelerator facilities
• Activation of accelerator components and surrounding groundwater and air
• Investigation of fully coupled neutron and charged-particle transport for lowerenergyapplications
• High-energy dosimetry and neutron detection
• Design of neutrino experiments
• Comparison of physics-based and table-based data
• Charged-particle tracking in plasmas
• Charged-particle propulsion concepts for spaceflight
• Single-event upset in semiconductors, from cosmic rays in spacecraft or from theneutron component on the earth’s surface
• Detection technology using charged particles (i.e. abandoned landmines)
• Nuclear safeguards
• Nuclear criticality safety
• Radiation protection and shielding
• Oil well logging
21

3 Monte Carlo simulations
3.2.1 The input
MCNPX divides the world into user specified cells, which are created by boolean combina-tions of surfaces. MCNPX knows several primitive surfaces (e.g. plane, sphere, cone etc.)and macrobodies (e.g. box, cylinder, etc.), which can be combined with boolean operators(union, intersection, etc.) to form complex cells. All cells together form the geometry of acalculation.
To define a problem in MCNPX an input file, providing the geometry and all necessarydata, is needed. The form of this file is defined in the manual [8] and will be reproducedonly very briefly.
Each input file has three sections. The first section specifies the geometrical cells usedin the calculation. The second section defines all surfaces and marcobodies used for celldefinition and the third section specifies all other data necessary.
MCNPX expects its input in form of cards. A card is a alphanumerical control sequencefollowed by the data required by the command. E.g. requesting the average electron fluxin cell 3 would be defined by the card: F4:E 3.
Geometry
The geometry of the accelerator and treatment room has been obtained from a file preparedby Alfredo C. Siochi from Siemens Medical Systems [9]. The file containes very detailedinformation of accelerator components needed for photon and electron simulations. Addi-tional information for modeling the treatment room and other accelerator components hasbeen gained by consulting architectural schemes and by using a measuring tape.
The actual geometric details of the accelerator components will be presented in theappropriate paragraph.
Materials
Materials have to be specified on M cards. Neutron interactions are nuclear in nature, sodifferent isotopes of an element have different cross-sections. Photon and electron inter-actions are atomic in nature, so all isotopes of an element use the same cross-section. Asneutron physics are important all used elements had to be separated into their individualisotopes. With the knowledge from table 3.1 and the elemental composition of the materialsused (table 3.2), M cards could be constructed. MCNPX identifies isotopes and elementsby a so called ZAID. Elements are identified with a ZAID of 1000 × Z (proton number),isotopes add their atomic weight A to this number. Elemental hydrogen is specified as1000, isotopically pure hydrogen as 1001, deuterium as 1002.
Cross-sections
Detailed Information on the cross-sections used can be found in the MCNPX user’s man-ual [8]. Whenever possible the most recently evaluated cross-sections were used.
22

3.2 MCNPX
Element Z A percentage ZAID Element Z A percentage ZAIDHydrogen1 1 1 99.985 1001 Titanium1 22 46 8.200 22046Hydrogen 1 2 0.015 1002 Titanium 22 47 7.400 22047Lithium1 3 6 7.500 3006 Titanium 22 48 73.800 22048Lithium1 3 7 92.500 3007 Titanium 22 49 5.400 22049
Boron1 5 10 20.000 5010 Titanium 22 50 5.200 22050Boron1 5 11 80.000 5011 Chromium 24 50 4.350 24050Carbon 6 12 98.900 6012 Chromium 24 52 83.790 24052Carbon 6 13 1.100 6013 Chromium 24 53 9.500 24053
Nitrogen1 7 14 99.630 7014 Chromium 24 54 2.360 24054Nitrogen1 7 15 0.370 7015 Manganese 25 55 100.000 25055
Oxygen 8 16 99.762 8016 Iron 26 54 5.800 26054Oxygen2 8 17 0.038 8017 Iron 26 56 91.700 26056Oxygen3 8 18 0.200 8018 Iron 26 57 2.200 26057
Fluor1 9 19 100.000 9019 Iron 26 58 0.300 26058Sodium 11 23 100.000 11023 Nickel 28 58 68.270 28058
Magnesium4 12 24 78.990 12024 Nickel 28 60 26.100 28060Magnesium4 12 25 10.000 12025 Nickel 28 61 1.130 28061Magnesium4 12 26 11.010 12026 Nickel 28 62 3.590 28062Aluminium 13 27 100.000 13027 Nickel1 28 64 0.910 28064
Silicon 14 28 92.230 14028 Copper 29 63 63.090 29063Silicon 14 29 4.670 14029 Copper 29 65 30.910 29065Silicon 14 30 3.100 14030 Barium1,5 56 138 100.000 56138
Phosphorus1 15 31 100.000 15031 Tungsten2 74 180 0.100 74180Sulfur 16 32 95.020 16032 Tungsten 74 182 26.300 74182
Sulfur1 16 33 0.750 16033 Tungsten 74 183 14.300 74183Sulfur2 16 34 4.210 16034 Tungsten 74 184 30.700 74184
Sulfur1,2 16 36 0.020 16036 Tungsten 74 186 28.600 74186Chlorine 17 35 75.770 17035 Gold1 79 197 100.000 79197Chlorine 17 37 24.230 17037 Lead1,2 82 204 0.600 82204Argon1 18 36 0.337 18036 Lead 82 206 24.100 82206Argon1 18 38 0.063 18038 Lead 82 207 22.100 82207Argon 18 40 99.600 18040 Lead 82 208 53.200 82208
Potassium4 19 39 93.270 19039Potassium4 19 41 6.730 19041
Calcium4 20 40 97.000 20040Calcium1,4 20 42 0.700 20042Calcium1,4 20 43 0.200 20043Calcium1,4 20 44 2.090 20044Calcium1,4 20 46 0.010 20046
1no photonuclear cross-section available; 2no photon production cross-section available;3no neutron cross-section available; 4neutron cross-section only available for naturalabundance of isotopes; 5only cross-section available for this element
Table 3.1: Isotopic composition of elements used in simulations.23

3 Monte Carlo simulations
Material ρ [g/cm3] Elemental composition (percentage by mass)Air, drya 1.2001 N(75.5) O(23.2) Ar(1.3)Air, 55% humidity 1.3001 H(0.08) N(75.45) O(23.18) Ar(1.29)Argon 1.6601 Ar(100)TE-Gasa 1.0601 H(10.2) C(45.6) N(3.5) O(40.7)A150 plastica 1.120 H(10.1) C(77.7) N(3.5) O(5.2) F(1.7) Ca(1.8)Braina 1.040 H(10.7) C(14.5) N(2.2) O(71.2) Na(0.2) P(0.4) S(0.2) Cl(0.3) K(0.3)Muscle (skeletal)a 1.050 H(10.2) C(14.3) N(3.4) O(71.0) Na(0.1) P(0.2) S(0.3) Cl(0.1) K(0.4)solid water (RW3)b 1.045 H(7.59) C(90.41) O(0.80) Ti(1.20)PMMAa 1.170 H(8.0) C(60.0) O(32.0)Polystyrenea 0.050 H(7.7) C(92.3)SS-303 Steelc 8.190 C(0.1) Mn(2.0) P(0.045) S(0.03) Si(1.0) Cr(18.0) Ni(9.0) Fe(69.825)Concrete 2.400 O(37.24) Al(3.07) Si(9.87) S(1.24) Ca(46.81) Fe(1.77)Shielding concreted 3.100 H(0.32) O(30.53) Si(4.67) S(11.21) Ca(2.8) Fe(3.74) Ba(46.73)Electronics 0.500 H(6.41) C(38.47) O(51.28) Fe(1.78) Cu(2.05)Water 1.000 H(11.11) O(88.89)Gold 19.320 Au(100)Graphite 2.250 C(100)Carbon fibre 1.800 C(100)Tungsten 19.6252 W(100)Aluminium 2.699 Al(100)Glass (SiO2)c 2.500 O(53.33) Si(46.67)Copper 8.960 Cu(100)Iron 7.860 Fe(100)Lead 11.344 Pb(100)Boron 2.460 B(100)Lithium 0.530 Li(100)10B loaded PEe 0.920 H(12.5) C(74.5) 10B(13.0)LiF loaded PEe 1.130 H(10.35) C(61.62) F(20.55) Li(7.48)
1 density given as g/l = kg/m3
2 tungsten inside the treatment head had a density of 18.0 g/cm3 [9]a composition reproduced from ICRU Report 44 [10]b composition studied by G. Christ [11]c composition reproduced from the electronic data file provided by A. Siochi [9]d composition reproduced from DIN 25 413 [12]e composition studied by NASA [13]
Table 3.2: Elemental composition of materials used in simulations.
24

3.2 MCNPX
S(α,β) cross-sections for thermal neutron treatment were used from ENDF6.3. Thisdata was processed from evaluations distributed by the National Nuclear Data Center atBrookhaven National Laboratory as part of ENDF/B-VI, Release 3.
Neutron cross-sections were used from ENDF/B-V or ENDF/B-VI, LLNL and LANL.ENDF/B are the Evaluated Nuclear Data Files, a US effort coordinated by the NationalNuclear Data Center at Brookhaven National Laboratory. This evaluations are updatedperiodically. LLNL-evaluated nuclear data libraries are compiled by the Nuclear DataGroup at Lawrence Livermore National Laboratory. LANL-evaluations are from the Nu-clear Physics Group T-16 at Los Alamos National Laboratory.
Photoatomic data from MCNPLIB04 was used. The cross-section, form-factor, andfluorescence data are all derived from the ENDF/B-VI.8 data library. Cross-section dataare given for incident photon energies from 1 keV to 1 GeV. Fluorescence data are derivedfrom the atomic relaxation data available in ENDF/B-VI.8
Photonuclear evaluations are a subset of the IAEA Coordinated Research Project (CRP)on photonuclear data. They are the ones that could be processed by NJOY and the onesthat could be converted for processing. The master source for these evaluations is [14].
Evaluations were provided by the Los Alamos National Laboratory (LANL), the KoreanAtomic Energy Institute (KAERI) and the Chinese Nuclear Data Center (CNDC).
3.2.2 The output
Upon completion or interruption of a calculation, MCNPX presents its results in form ofone or more output files. The standard output file (outp) is always produced, a specialfile containing tally results without descriptive texts is produced on request (mctal) and ifmesh tallies are used the mesh tally data is written to a special data file (mdata).
The standard output file contains a reproduction of the input file and all messages printedto the console. Upon successful completion or interruption of the calculation it is amendedwith various data tables, some on request only. It is always amended by an overview ofthe global statistics of the run and the tally data.
More information on the output files and their structure can be found in the MCNPXuser’s manual [8].
3.2.3 Variance reduction1
All results (tallies) of Monte Carlos calculations are calculated with an error, due to thestatistical nature of the Monte Carlo process. The estimated relative error R is proportionalto 1/
√N where N is the number of histories. For a given run, the computer time T
consumed is proportional to N. Thus R = C/√
T where C is a positive constant. Thereare two ways to reduce R: (1) increase T and/or (2) decrease C. The amount of computertime available often limits the utility of the first approach. For example, if it has taken 2hours to obtain R = 0.10, then 200 hours will be required to obtain R = 0.01. For this
1parts of this text are reproduced from the MCNP Handbook [7]
25

3 Monte Carlo simulations
reason MCNPX has special variance reduction techniques for decreasing C. (Variance isthe square of the standard deviation.) The constant C depends on the tally choice and/orthe sampling choices.
There are three classes of variance reduction techniques that range from the trivial tothe esoteric.
Truncation Methods are the simplest of variance reduction methods. They speed up cal-culations by truncating parts of phase space that do not contribute significantly to the so-lution. The simplest example is geometry truncation in which unimportant parts of the ge-ometry are simply not modeled. Specific truncation methods available in MCNP/MCNPXare the energy cutoff and time cutoff.
Population Control Methods use particle splitting and Russian roulette to control thenumber of samples taken in various regions of phase space. In important regions manysamples of low weight are tracked, while in unimportant regions few samples of high weightare tracked. A weight adjustment is made to ensure that the problem solution remainsunbiased. Specific population control methods available in MCNP/MCNPX are geometrysplitting and Russian roulette, energy splitting/roulette, time splitting/roulette, weightcutoff, and weight windows.
Modified Sampling Methods alter the statistical sampling of a problem to increase thenumber of tallies per particle. For any Monte Carlo event it is possible to sample from anyarbitrary distribution rather than the physical probability as long as the particle weightsare then adjusted to compensate. Thus, with modified sampling methods, sampling is donefrom distributions that send particles in desired directions or into other desired regions ofphase space such as time or energy, or change the location or type of collisions.
Modified sampling methods in MCNP/MCNPX include the exponential transform, im-plicit capture, forced collisions, source biasing, and particle production biasing.
The following MCNPX variance reduction options were used in calculations: cell impor-tance, biased bremsstrahlung production, biased photonuclear production, electron energycutoff of 200keV and particle weight cutoff.
Cell importance was chosen in such a way that photons and electrons which reach theshielding concrete or a lateral distance of 1 m or more from the beam axis are terminated.
Bremsstrahlung production was biased in graphite, tungsten and copper. The brems-strahlung process generates many low-energy photons, but the higherenergy photons are ofmore interest. The biasing creates a gradually increasing enhancement of the probabilitythat the sampled bremsstrahlung photon will carry an eminent fraction of the electronenergy.
Maximizing the amount of photoneutrons available for transport, biased photonuclearproduction was turned on. Biased production creates a photoneutron, with a weight corre-sponding to its production possibility, at every photon collision (photon weight is reducedcorrespondingly). A low neutron weight cutoff was chosen to transport these low weightneutrons.
As the range of electrons with an energy below 0.2 MeV in water is approximately0.02 cm (smaller than any tally structure) a global electron energy cutoff of 0.2 MeV waschosen.
26
3.3 The Siemens Primus medical linear accelerator
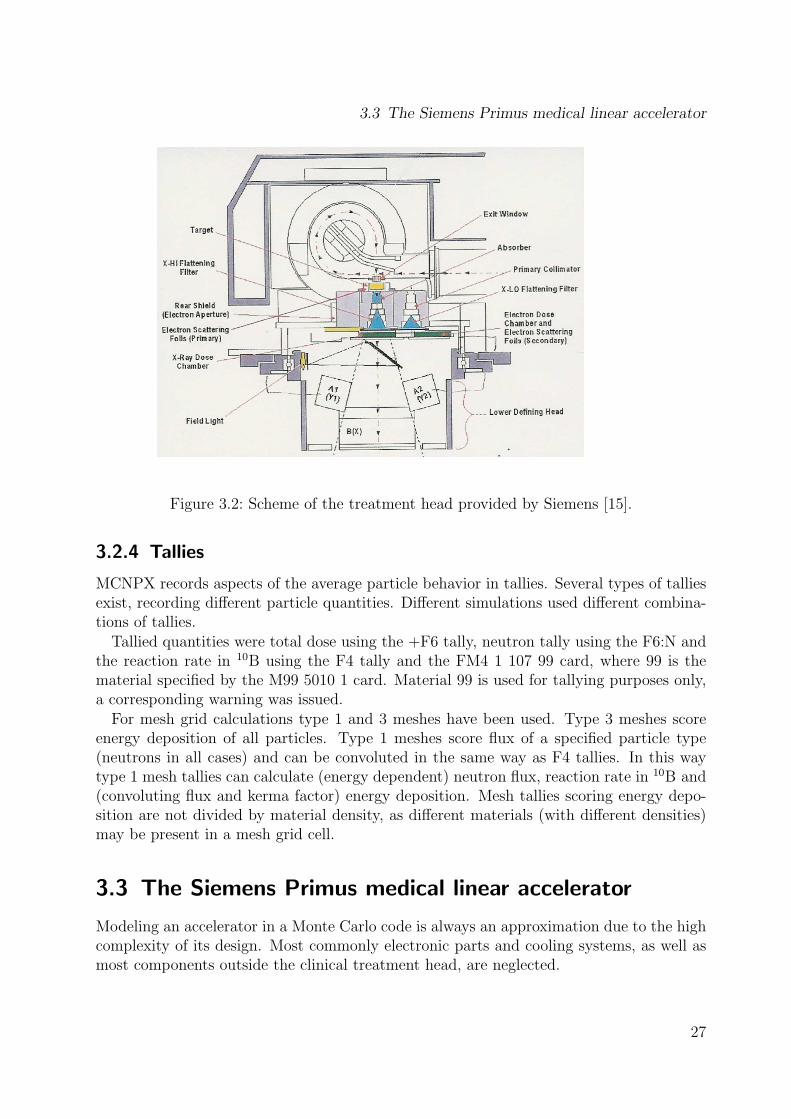
Figure 3.2: Scheme of the treatment head provided by Siemens [15].
3.2.4 Tallies
MCNPX records aspects of the average particle behavior in tallies. Several types of talliesexist, recording different particle quantities. Different simulations used different combina-tions of tallies.
Tallied quantities were total dose using the +F6 tally, neutron tally using the F6:N andthe reaction rate in 10B using the F4 tally and the FM4 1 107 99 card, where 99 is thematerial specified by the M99 5010 1 card. Material 99 is used for tallying purposes only,a corresponding warning was issued.
For mesh grid calculations type 1 and 3 meshes have been used. Type 3 meshes scoreenergy deposition of all particles. Type 1 meshes score flux of a specified particle type(neutrons in all cases) and can be convoluted in the same way as F4 tallies. In this waytype 1 mesh tallies can calculate (energy dependent) neutron flux, reaction rate in 10B and(convoluting flux and kerma factor) energy deposition. Mesh tallies scoring energy depo-sition are not divided by material density, as different materials (with different densities)may be present in a mesh grid cell.
3.3 The Siemens Primus medical linear accelerator
Modeling an accelerator in a Monte Carlo code is always an approximation due to the highcomplexity of its design. Most commonly electronic parts and cooling systems, as well asmost components outside the clinical treatment head, are neglected.
27

3 Monte Carlo simulations
A left handed coordinate system has been used for simulation. As the source (located atthe origin) is usually above the detector, the Z-coordinate in a right handed system woulddecrease with increasing distance to the detector. However, in a left handed system theZ-coordinate increases with increasing distance, when X and Y direction are unchanged.In this way the Z-coordinate of the detector corresponds to the source to detector distance,which is preferred over the coordinate transformation needed if a right handed system waschosen.
There is no influence on the calculation by choosing the left handed system, as no kaonsare produced or decayed and gravity is not included in the simulations.
3.3.1 Components
The treatment head of a Siemens Primus accelerator is a very complex structure. In canproduce two different photon energies and several electron energies. Most of its interior isnot in the beam path and can therefore be neglected or treated by simple approximationsfor Monte Carlo purposes.
Bending magnet
The bending magnet causes a 270◦ turn in the flight path of the primary electrons. Ad-ditionally it serves as an energy selector, as electrons with energies too low or too highdo not reach the exit window. The exit window is made of two thin titanium sheets withcooling water in between, but was not modeled.
The bending magnet is located directly above the target and approximately 40 cm ×25 cm × 25 cm in size and consists of steel and copper with an outer tungsten and leadshielding.
In figure 3.3 the bending magnet is shown by the cells 201-218.
Target
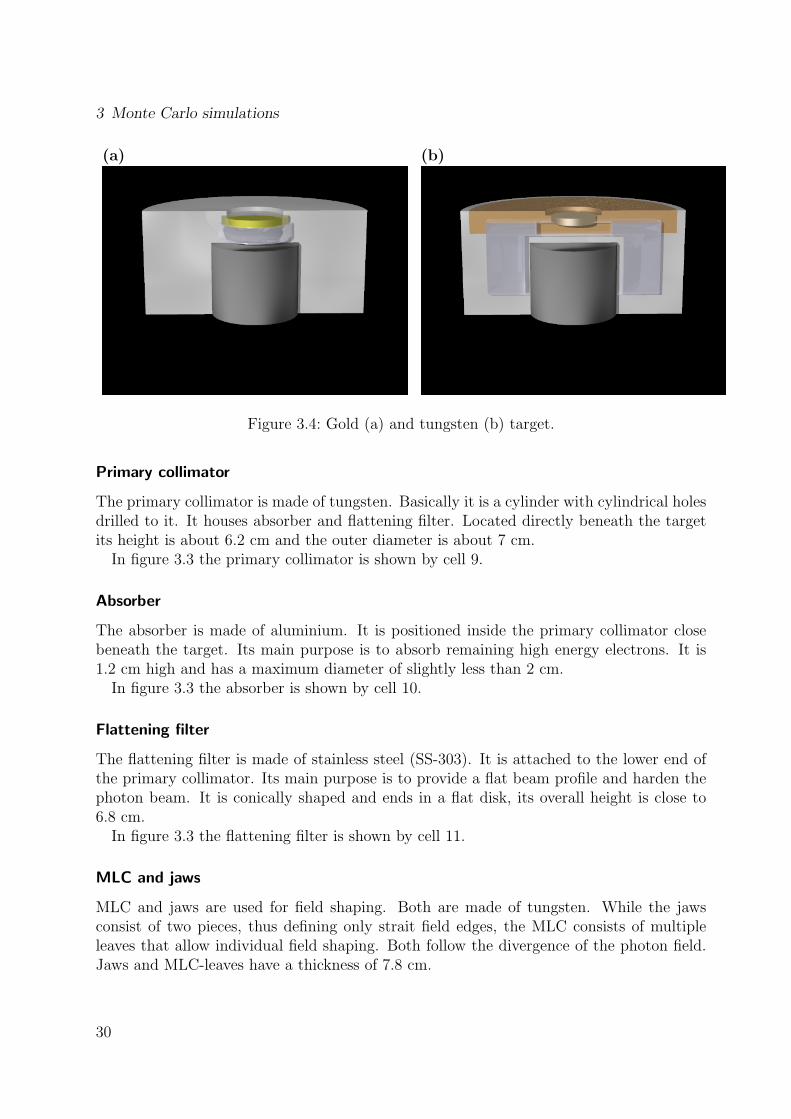
There are two kinds of targets for Siemens Primus machines. The older one is called goldtarget, as a thin gold foil is used for bremsstrahlung production. The gold foil is in directcontact with water used for cooling purposes, which is the reason why its use is no longerrecommended. The gold foil could tear, leading to a leak in the cooling system and waterinside the treatment head.
The target which is currently in use at the UKE is called tungsten target. Brems-strahlung production is done by a small disk of tungsten. Cooling is achieved by a specialcopper mounting which is in contact with the cooling water.
Both targets end in a cylinder of graphite which absorbs remaining primary electrons.The wall material of the target is a special stainless steel (SS-303).
The target is of cylindrical design with a height of about 1.5 cm and a diameter ofapproximately 3 cm. Gold foil and tungsten disk are of 1 mm thickness.
In figure 3.3 the target is shown by cell 6.
28

3.3 The Siemens Primus medical linear accelerator
Figure 3.3: MCNPX plot of the treatment head geometry. The material of dark greycolored cells is tungsten, the light grey material is steel. The MLC is includedin the simulation but not shown in this figure. The components are explainedby their numbers in the text.
29
3 Monte Carlo simulations
(a) (b)
Figure 3.4: Gold (a) and tungsten (b) target.
Primary collimator
The primary collimator is made of tungsten. Basically it is a cylinder with cylindrical holesdrilled to it. It houses absorber and flattening filter. Located directly beneath the targetits height is about 6.2 cm and the outer diameter is about 7 cm.
In figure 3.3 the primary collimator is shown by cell 9.
Absorber
The absorber is made of aluminium. It is positioned inside the primary collimator closebeneath the target. Its main purpose is to absorb remaining high energy electrons. It is1.2 cm high and has a maximum diameter of slightly less than 2 cm.
In figure 3.3 the absorber is shown by cell 10.
Flattening filter
The flattening filter is made of stainless steel (SS-303). It is attached to the lower end ofthe primary collimator. Its main purpose is to provide a flat beam profile and harden thephoton beam. It is conically shaped and ends in a flat disk, its overall height is close to6.8 cm.
In figure 3.3 the flattening filter is shown by cell 11.
MLC and jaws
MLC and jaws are used for field shaping. Both are made of tungsten. While the jawsconsist of two pieces, thus defining only strait field edges, the MLC consists of multipleleaves that allow individual field shaping. Both follow the divergence of the photon field.Jaws and MLC-leaves have a thickness of 7.8 cm.
30

3.3 The Siemens Primus medical linear accelerator
Figure 3.5: Percentage difference of measured depth dose curve and calculated depth dosecurve for 4 different nominal energies.
In figure 3.3 the jaws are shown by the cells 130 and 131, the MLC is not shown.
Additional components
Additional components have been modeled and their influence on the neutron productionwas studied. The number in parentheses is the cell number found in figure 3.3. Includedobjects are the target slide (22), the 6 MV primary collimator (23), steel componentsaround the primary collimators (24-25), electronics (26), lead and steel shielding (231), themirror, plastic cover (282) of the linac and the steel skeleton (280) to which the treatmenthead is mounted. The treatment room is shown by cell 1000, the treatment room walls bycell 1006, There are more components in the treatment head (e.g. monitor chambers) butthese components have not been modeled.
3.3.2 The medical accelerator as electron source
As the Siemens Primus is an electron accelerator, it is important to distinguish betweenprimary and secondary electrons. Primary electrons are electrons that are accelerated bythe machine, these electrons produce bremsstrahlung in the target. Secondary electronsare the electrons that are produced by the bremsstrahlung.
31

3 Monte Carlo simulations
Figure 3.6: Energy distribution of primary electrons impinging on the target. The distri-bution is based on a gaussian distribution but decreasing linearly to zero forprobabilities smaller than 0.3.
Primary electrons
The primary electrons are accelerated to energies of about 14.5 MeV. After leaving thewaveguide used for acceleration the electrons enter the bending magnet. Inside the magnetthe electron flight path is bend 270◦. Because of the small exit window of the bendingmagnet there is an energy selection of primary electrons.
After leaving the bending magnet the primary electrons hit the target. The electronsproduce bremsstrahlung in the thin tungsten disk and remaining primary electrons areabsorbed completely in the graphite and aluminium absorbers.
Figure 3.5 shows the difference of measured depth dose curve and calculated depthdose curve for 4 different nominal energies (13.8, 14.0, 14.55 and 15 MeV). The spatialdistribution for all studied energies was gaussian with a FWHM of 0.15 cm. The meandifference (not counting the difference of the buildup region) was -0.59 %, -0.30 %, 0.12 %and 1.33 % for 13.8, 14.0, 14.55 and 15 MeV, respectively.
Thus 14.55 MeV nominal energy (spectrum shown in figure 3.6) produce a photon depthdose curve that fits best to the measured photon depth dose curve provided at the UKE.This distribution was used for all following calculations in this work.
32

3.3 The Siemens Primus medical linear accelerator
Figure 3.7: Normalized photon spectrum of the 15 MV mode at SSD 100, calculated witha bin width of 50 keV, without phantom presence.
Secondary electrons
Secondary electrons are produced by the photon radiation. Various ways of electron pro-duction exist. Pair production creates electrons and positrons directly and compton recoil,photo-electric, photon auger and knock-on processes liberate shell electrons from theiratoms.
Main source of the electron contamination is the flattening filter. Other sources ofsecondary electron production include the edges of jaws and MLC-leaves.
Although the overall flux of secondary electrons is only 0.36 % of the photon flux it isessential for the behavior of the depth dose curve in the build up region [4].
3.3.3 The medical accelerator as photon source
As the majority of radiation treatments are done with photon fields, an accurate descriptionof the photon production is essential. Most of the photons are produced as bremsstrahlungin the target. These photons pass a flattening filter which hardens the beam and producesa flat dose profile.
The photon spectrum at SSD 100 cm has been calculated without phantom presenceand is shown in figure 3.7. The mean energy of the photons is 4.149 MeV. The fit functionin figure 3.7 is shown in equation 3.1, values for coefficients are found in table 3.3.
n(E) = c1Ec2exp(−c3E − c4
E) (3.1)
33
3 Monte Carlo simulations
(a) (b)
Figure 3.8: Results of dose calculations and measurements: (a) depth dose curve (b) beamprofiles at 3, 5 and 10 cm depth normalized to 10 cm depth.
constant value 2σc1 1.662 2.6%c2 -0.1755 22.7%c3 0.2151 4.3%c4 0.3488 7.6%
constant value 2σd1 3.243 2.3%d2 0.6434 2.2%d3 0.6627 1.3%
Table 3.3: Coefficients for fits used in figures 3.7 and 3.9
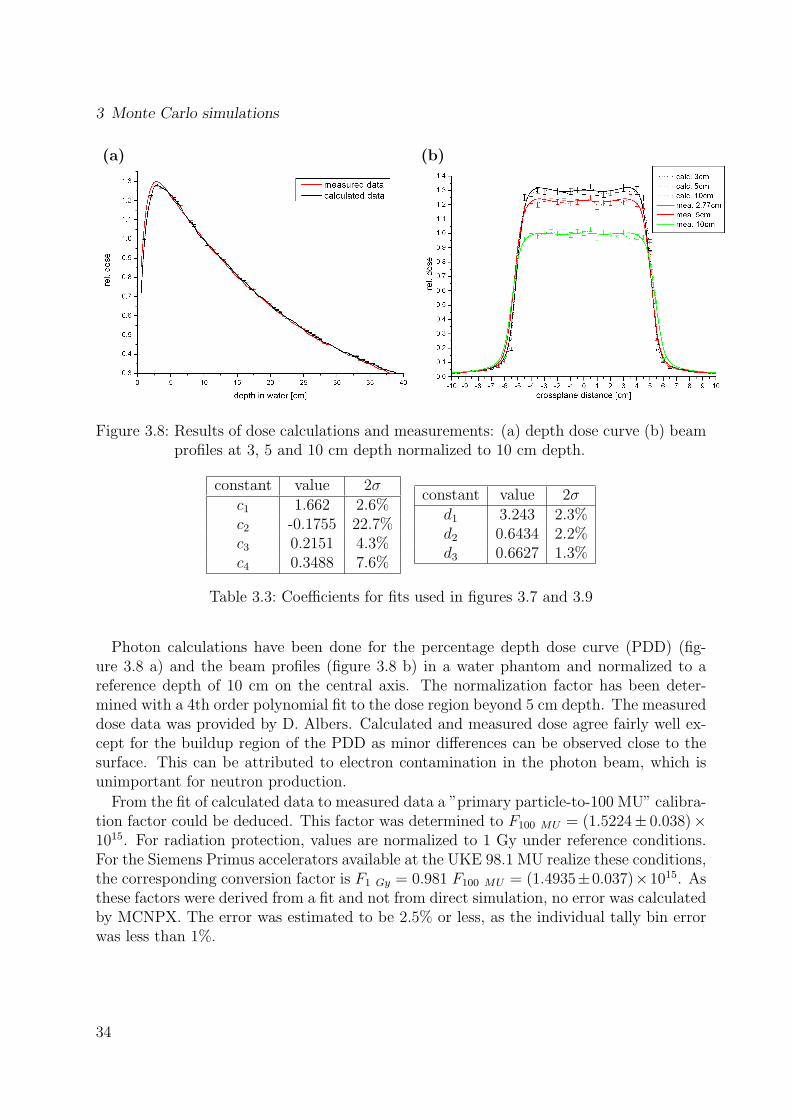
Photon calculations have been done for the percentage depth dose curve (PDD) (fig-ure 3.8 a) and the beam profiles (figure 3.8 b) in a water phantom and normalized to areference depth of 10 cm on the central axis. The normalization factor has been deter-mined with a 4th order polynomial fit to the dose region beyond 5 cm depth. The measureddose data was provided by D. Albers. Calculated and measured dose agree fairly well ex-cept for the buildup region of the PDD as minor differences can be observed close to thesurface. This can be attributed to electron contamination in the photon beam, which isunimportant for neutron production.
From the fit of calculated data to measured data a ”primary particle-to-100 MU” calibra-tion factor could be deduced. This factor was determined to F100 MU = (1.5224± 0.038)×1015. For radiation protection, values are normalized to 1 Gy under reference conditions.For the Siemens Primus accelerators available at the UKE 98.1 MU realize these conditions,the corresponding conversion factor is F1 Gy = 0.981 F100 MU = (1.4935±0.037)×1015. Asthese factors were derived from a fit and not from direct simulation, no error was calculatedby MCNPX. The error was estimated to be 2.5% or less, as the individual tally bin errorwas less than 1%.
34

3.3 The Siemens Primus medical linear accelerator
Location contribution cell1
primary collimator 54.85 % 9MLC and jaws 26.72 % 130-133target 10.08 % 6target slide 5.64 % 22flattening filter 1.74 % 11bending magnet 0.61 % 201-218steel block 0.13 % 24steel and lead shield 0.11 % 231x-low collimator 0.07 % 23steel skeleton 0.03 % 280absorber 0.01 % 10steel plate 0.003 % 25electronics 0.001 % 26other 0.006 % -
1 see figure 3.3
Table 3.4: Contribution of individual accelerator components to the overall neutron pro-duction.
3.3.4 The medical accelerator as neutron source
Most neutrons produced inside the accelerator originate in (γ,n) reactions. Other possiblereactions (such as (n,2n)) were found to be insignificant in comparison with photoneutronproduction. The cross section for photoneutron production is high in materials with a highZ, such as tungsten and lead (see figure 2.2). Other materials such as iron or aluminiumcan also produce photoneutrons, but their low cross section requires a high photon fluxfor a significant contribution of photoneutrons. Non-tungsten components that fulfill theseconditions are absorber (aluminium) and flattening filter (steel).
Locations of neutron production
In table 3.4 the locations where photoneutrons are produced are listed. Neutron spectrum(next paragraph) and component contribution were calculated with an MCNPX run pro-ducing 10 million photoneutrons requiring 30 million primary particles. Following variancereduction methods were used: cell importance, biased bremsstrahlung production, biasedphotonuclear production, electron and photon energy cutoff of 7 MeV (threshold energy ofmost (γ,n) reactions) and particle weight cutoff (-1 for electrons, -1 for photons, -10−9 forneutrons).
Excluding the target (made from tungsten, copper, steel, water and graphite), tungstencomponents account for roughly 87 %, steel components for roughly 2 % of the totalneutron production.
35

3 Monte Carlo simulations
Figure 3.9: Normalized neutron source spectrum differential in energy at the respectivelocation of neutron production.
The most important component for photoneutron production not included in photonsimulations is the target slide with a contribution of about 5 % to the total photoneu-tron production. The other components contribution is usually in the order of 0.1 % orless. Nevertheless components with low photoneutron production are essential for neutronscattering and have to be included when treatment room distributions are studied.
The values from table 3.4 agree fairly well with the values found in literature for thePrimus [16]. Compared with values published for a Varian Clinac 2100/2300C the Primusproduces less neutrons in the target (15% Varian, 10% Siemens) and flattening filter (8%Varian, 1.7 % Siemens) and about the same amount in primary collimator and MLC andjaws [17, 18].
Neutron spectrum
The spectral distribution of photoneutrons is shown in figure 3.9. The fit function fromequation 3.2 is used, values for coefficients are found in table 3.3.
n(E) = d1Ed2exp(−E
d3
) (3.2)
Distinguishing between source spectrum and spectrum at a given location is important.Counting each neutron only once, the source spectrum (figure 3.9) tallies neutron weightand energy at time of production. Counting every neutron which transverses the tallyvolume (voxel of (10cm)3), the spectrum at the isocenter shows the final neutron distri-bution at this location. On the average each neutron is counted three times, as neutrons
36
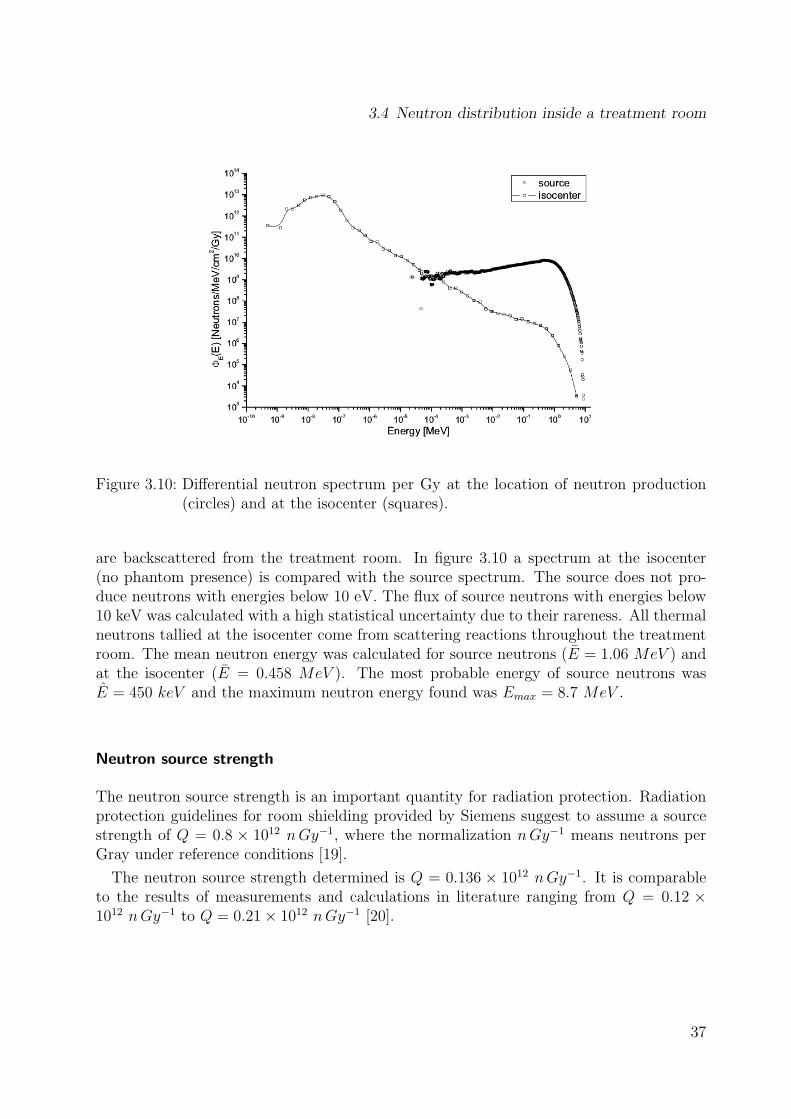
3.4 Neutron distribution inside a treatment room
Figure 3.10: Differential neutron spectrum per Gy at the location of neutron production(circles) and at the isocenter (squares).
are backscattered from the treatment room. In figure 3.10 a spectrum at the isocenter(no phantom presence) is compared with the source spectrum. The source does not pro-duce neutrons with energies below 10 eV. The flux of source neutrons with energies below10 keV was calculated with a high statistical uncertainty due to their rareness. All thermalneutrons tallied at the isocenter come from scattering reactions throughout the treatmentroom. The mean neutron energy was calculated for source neutrons (E = 1.06 MeV ) andat the isocenter (E = 0.458 MeV ). The most probable energy of source neutrons wasE = 450 keV and the maximum neutron energy found was Emax = 8.7 MeV .
Neutron source strength
The neutron source strength is an important quantity for radiation protection. Radiationprotection guidelines for room shielding provided by Siemens suggest to assume a sourcestrength of Q = 0.8 × 10¹² n Gy−1, where the normalization n Gy−1 means neutrons perGray under reference conditions [19].
The neutron source strength determined is Q = 0.136 × 10¹² n Gy−1. It is comparableto the results of measurements and calculations in literature ranging from Q = 0.12 ×10¹² n Gy−1 to Q = 0.21× 10¹² n Gy−1 [20].
37

3 Monte Carlo simulations
Figure 3.11: Relative neutron flux distribution along central axis (X=0 cm, Y=0 cm).
3.4 Neutron distribution inside a treatment room
As neutrons scatter easily they can be found outside of the intended radiation field. Howthey are distributed inside the treatment room is dependent on many factors. The actualgeometry of the room has the largest influence. Additionally the neutron energy is ofimportance. Fast neutrons (0.1 MeV < En) behave almost like photons, they tend tomove in strait lines and can be collimated. Thermal neutrons (En ≤ 1 eV ) on the otherhand behave almost like a free gas and tend to diffuse. Epithermal neutrons (1 eV < En ≤0.1 MeV ) have moderate energies and behave somehow in the middle, they diffuse lessthan thermal neutrons and can only be collimated with more effort than fast neutrons.
Knowledge of the neutron distribution is most important for radiation protection consid-erations. Neutrons can activate materials, thus creating radioisotopes. These radioisotopesmay be important for radiation protection purposes, as persons not present during irradi-ation (e.g. medical staff) may come into contact with them later.
The calculations were done with 181 million primary particles. Thermal, epithermal andfast neutron flux were tallied with a mesh grid superimposed on the geometry. The gridsize was 20 cm in each direction. Following variance reduction methods were used: cellimportance, biased bremsstrahlung production, biased photonuclear production, electronand photon energy cutoff of 7 MeV (threshold energy of most (γ,n) reactions) and particleweight cutoff (-1 for electrons, -1 for photons, -10−9 for neutrons).
Figure 3.11 shows the relative flux distribution along the z-axis (X=0 cm and Y=0 cm).The z-axis corresponds to the SSD. Absolute peak intensities were 3.17×10⁷ n/cm2/Gy forthermal, 1.67× 10⁸ n/cm2/Gy for epithermal and 5.54× 10⁸ n/cm2/Gy for fast neutrons.
38

3.4 Neutron distribution inside a treatment room
(a) (b)
(c) (d)
Figure 3.12: Distribution of neutrons in the L3 treatment room for Z=110 cm (a) roomgeometry, (b) En ≤ 1 eV , (c) 1 eV < En ≤ 0.1 MeV , (d) 0.1 MeV < En.
39

3 Monte Carlo simulations
(a) (b)
(c) (d)
Figure 3.13: Distribution of neutrons in the L3 treatment room for Z=210 cm (a) roomgeometry, (b) En ≤ 1 eV , (c) 1 eV < En ≤ 0.1 MeV , (d) 0.1 MeV < En.
40

3.4 Neutron distribution inside a treatment room
(a) (b)
(c) (d)
Figure 3.14: Distribution of neutrons in the L3 treatment room for X=-80 cm (along thedark line seen in figure 3.12 (a)) (a) room geometry, (b) En ≤ 1 eV , (c)1 eV < En ≤ 0.1 MeV , (d) 0.1 MeV < En.
41

3 Monte Carlo simulations
(a) (b)
Figure 3.15: Neutron flux change by implementing radiation protection plastic (a) thermalneutron flux, (b) thermal neutron flux reduction.
The normalization is to Gray under reference conditions. The target is located at Z=0 cm.It is observed that the neutron peaks are shifted to a higher z-coordinate, thermal neutronsmore than neutrons of higher energy. A basic 1/r2 dependence is observed for fast neutronsas well as significant influences of the room geometry. The patient couch increased neutronflux above its position and decreased neutron flux below its position. A decrease observedfor z > 240 is due to the beginning of the floor. The small increase of thermal neutron inthe ceiling is due to the thermalization of neutrons with higher energies.
The figures 3.12 to 3.14 show the neutron distribution inside our L3 treatment room. Allfigures given in terms of neutron flux per Gray (n/cm2/Gy). The basic 1/r2 dependencecan be observed, as well as the influence of the room geometry (thin wall to machine roomand treatment couch in figure 3.13). From the figures can be concluded, that there isalmost no height dependence with sufficient distance from the central axis.
The distribution for the L1 treatment room has also been calculated showing the samefeatures as the distribution inside the L3 room, but a higher neutron flux. This is due tothe fact that the L1 room is smaller in volume and thermal and epithermal neutron fluxhave a 1/V dependence, as shown in literature [16].
3.5 Alternative plastics for radiation protection
The effect of replacing plastic cover elements of the accelerator with plastics for radiationprotection has been studied. The outer plastic cover material was replaced in the simula-tion, the geometry was kept unchanged. Additionally 1 cm of shielding material has beenadded to the outside of the lead and steel shielding (cell 231 in figure 3.3).
Two shielding materials have been studied. Both materials are based on polyethylene,an inexpensive plastic. The plastic was loaded with 10B (13 % of weight) or LiF (28 % ofweight corresponding to 0.5 % 6Li). These materials were investigated by the NASA forlow energy neutron shielding in space shuttles [13].
42

3.5 Alternative plastics for radiation protection
(a) (b)
Figure 3.16: Neutron flux change by implementing radiation protection plastic (a) totalneutron flux, (b) total neutron flux reduction.
The materials can be used as shielding material for neutrons as they have a high hydrogencontent and are loaded with materials which capture thermal neutrons. Hydrogen richmaterials work as a moderator for non thermal neutrons, as non thermal neutrons loosetheir energy mainly in the proton recoil process. Hydrogen, 6Li and 10B have a high capturecross-section for thermal neutrons, therefore reducing the thermal neutron flux. Hydrogenundergoes radiative capture releasing a high energy photon, which may be undesired forradiation protection considerations.
The same calculation parameters as in the last paragraph (neutron distribution inside atreatment room) were used running 139 and 104 million primary particles for boron andlithium shielding, respectively.
The reduction in total neutron flux and thermal neutron flux has been studied. Fig-ures 3.15 and 3.16 show flux distribution along the x-direction, which corresponds to thedirection along the gantry at the height of the target (Z=0 cm). From the left to -675 cmthe outer treatment room wall is positioned, the maze is located from -675 cm to -450 cm,the maze wall (shielding concrete) from -450 cm to -380 cm, the treatment room from-380 cm to 160 cm, from 160 cm to 170 cm a thin wall-air-thin wall combination separatestreatment and machine room, the machine room stretches from 170 cm to 630 cm and from630 cm on the outer treatment room wall is positioned.
These structures can be observed in figure 3.15, especially the maze wall and the wall tothe machine room disturb the 1/r2 distribution. All figures show no reduction in neutronsource strength, as the peak at the target location (x = 0 cm) remains undisturbed. Thesame peak is present in figures 3.15 (b) and 3.16 (b) as shielding is applied to the outercover of the linac and not inside the accelerator.
It can be deduced from figure 3.16 (b) that a 20 % reduction in neutron flux can beachieved when implementing LiF-loaded polyethylene and a 35 % reduction when imple-menting 10B loaded polyethylene. The reduction is even higher (40-80 % reduction for 10Bload) when only thermal neutrons are considered (figures 3.15 (a) and (b)).
43

4 Ionization chambers for neutrondetection
Using ionization chambers is an established way of dosimetry in medical physics (see 2.4.2).Ionization chambers measure absorbed dose via measuring collected charge. Knowing thatabsorbed dose is proportional to collected charge allows dosimetry in photon and electronfields.
Having different RBEs mixed neutron/photon fields require a separation of dose com-ponents. Ionization chambers used for neutron detection are always sensitive to neutronsand photons, thus special techniques to distinguish neutron and photon components ofthe chamber signal are needed. If similar ionization chambers with different sensitivities toneutron and photon radiation are used the individual beam components can be determinedby solving an equation system. For each component to be separated one chamber has tobe used. Neutron and photon contributions can be separated with a twin chamber system,thermal neutron, non-thermal neutron and photon contributions can be separated with atriple chamber system. The paired chamber system is available for photon fields with verylow neutron contamination. All three systems will be discussed in detail below.
The calibration of the triple chamber system has already been published in ”Physics inMedicine and Biology”, Vol. 53, No 13, p. 3715-3725 on 25 May 2007, so some paragraphsand figures are similar to the published text [21].
4.1 Ionization chambers used for measurements
Three ionization chambers of type IC 30 manufactured by Wellhofer Dosimetry were avail-able for experiments. All three chambers have an active volume of 0.3 cm3, are watertightand were flushed by 1 liter per hour from an external gas supply.
1. A tissue equivalent chamber with A150 plastic as wall material and a wall thicknessof 2.5 mm. The chamber was flushed by TE gas. This neutron sensitive chamberwas denoted as TE/TE chamber.
2. A magnesium chamber with magnesium as wall material and a wall thickness of2 mm. The chamber was flushed by high purity argon gas. This neutron insensitivechamber was denoted as Mg/Ar chamber.
3. A magnesium chamber similar in design to the Mg/Ar chamber, but 3 µm of enriched(92%) 10B are coated to the inside of the cavity wall. This chamber was denoted asMgB/Ar chamber.
45

4 Ionization chambers for neutron detection
Accelerator MMgB MMg krel
4 MV, MDX-2 14.683 ± 2% 14.600 ± 2% 1.005716 MV, MDX-2 15.210 ± 2% 15.050 ± 2% 1.010636 MV, Primus 15.140 ± 2% 15.040 ± 2% 1.00665mean 1.00766 ± 3%
Table 4.1: krel values determined by irradiating 100 MU at two linacs in 3 cm depth of asolid water phantom.
Different chamber systems can be realized if more than one chamber is used for mea-surement. All combinations used for measurement are described below.
To do measurements in an environment with reduced thermal neutron flux a lithiumcap (6LiF embedded in epoxy resin) of cylindrical design with a minimum wall thicknessof 3.5 mm and an area density of 328 mg/cm2 6LiF was available for both the Mg/Arand MgB/Ar chamber. A second lithium cap fitting to the TE/TE chamber with a wallthickness of 5 mm was available at the Petten nuclear facility.
All measurements have been carried out with a Farmer NE 2570 electrometer operatedat a negative voltage of 250 V. A Farmer chamber of type FC65-G with an active volumeof 0.6 cm3 has been used as reference chamber when necessary. The Farmer chamber wascalibrated in terms of absorbed dose to water for cobalt radiation by the manufacturer.
4.1.1 Paired chamber system
To estimate the neutron contamination in photon fields the paired chamber system, usingboth magnesium chambers, can be used. It is suitable when the neutron flux is very smallcompared to the photon flux. The (neutron insensitive) magnesium chamber reading isrelated to the total dose in the usual way:
Dtotal = kQND,W MMg (4.1)
Where MMg is the chamber reading corrected for temperature and pressure, ND,W thecobalt calibration factor and kQ the photon quality correction factor.
When the borated chamber is used in the same place as the magnesium chamber theneutron signal, in form of the excess charge, can be calculated in the following way:
∆Q = MMgB − krelMMg (4.2)
krel was determined in photon fields not contaminated with neutrons, here ∆Q = 0 perdefinition as no neutrons are present. Data from experimental determination is shown intable 4.1. As both accelerators used for krel determination have a different mean photonenergy, it can be assumed that the value of krel is dependent on the photon spectrum.
The experimental set-up for krel determination is explained in paragraph 4.3.2.The resulting value of ∆Q is proportional to the (n,α) reaction rate in 10B at the chamber
location. This reaction rate can be easily calculated with MCNPX, as it is the convolution
46

4.1 Ionization chambers used for measurements
of neutron spectrum and 10B(n,α) cross-section (σ10B(n,α)). It is calculated with equa-tion 4.3:
∆Q = C∫ ∞
0σ10B(n,α)(E)Φn(E) dE, (4.3)
where C is a constant and Φn(E) = dΦ(E)dE
is the differential flux of neutrons with the energyE.
4.1.2 Twin chamber system
The twin chamber system allows dose separation into gamma contribution and neutroncontribution. Both components have to be roughly in the same order of magnitude. Twochambers with different sensitivities to neutrons are used. A tissue equivalent chamberis routinely used as it is almost equally sensitive to photons and neutrons. As neutroninsensitive chamber a magnesium chamber flushed with argon is often used, although agraphite chamber flushed with carbon dioxide can be used instead. The following equationsystem has be solved to determine the dose components:
RT = hT ·Dγ + kT ·Dn (4.4)
RU = hU ·Dγ + kU ·Dn (4.5)
Where R is the chamber reading corrected for temperature and pressure multiplied byND,W . ND,W is the sensitivity of the chamber to the 60Co radiation used for calibration.Dγ and Dn are the dose components from photons and neutrons, respectively. Dose isgiven as absorbed dose to muscle tissue. h and k are relative sensitivities compared to60Co radiation for photons and neutrons for the individual chambers.
4.1.3 Triple chamber system
In BNCT treatments it is essential to know the thermal neutron contribution in a mixedneutron/photon field. To separate dose components in these fields, the response of eachchamber has to be separated into gamma, fast neutron and thermal neutron contribution.In this case fast neutrons and fast neutron dose are defined as neutrons with non thermalenergies and dose deposited by them. A triple chamber system using all three chamberswas available for this purpose. The following equations, derived from the twin chambersystem, have to be solved for dose separation:
RTE = hTE ·Dγ + kTE ·Dn + iTE ·Dt
RMg = hMg ·Dγ + kMg ·Dn + iMg ·Dt
RMgB = hMgB ·Dγ + kMgB ·Dn + iMgB ·Dt
(4.6)
The denotations from the twin chamber system are used with the addition of Dt, thedose component from thermal neutrons, and i, the relative sensitivity to thermal neutronscompared to 60Co radiation for the individual chambers.
47

4 Ionization chambers for neutron detection
Figure 4.1: MCNPX geometry used for the simulation of the ionization chambers. Darkgrey: wall material (magnesium or A150). Medium grey: insulator. Light grey:TE- or argon-gas. Not visible 3µm enriched 10B, which is only present in theMgB/Ar chamber.
4.2 Monte Carlo studies of the used ionization chambers
Two Monte Carlo studies of response to neutron radiation were done. At first the sensitivityof the MgB/Ar chamber to maxwellian distributed thermal neutrons in dependence of kTwas studied. Second the response of all three chambers to monoenergetic neutrons wasstudied by dividing absorbed dose to the cavity gas by absorbed dose to the muscle tissuebeing replaced by the chamber. In case of the MgB/Ar chamber the result of the divisionwas normalized to 25500. The results of this calculations are found in figure 4.3.
The simplified geometry shown in figure 4.1 was used for the calculations. The lightion recoil option of MCNPX was activated and all possible secondary particles were trans-ported.
MCNPX has the following important limitations influencing the applicability of thesimulation outcome to the real chamber properties:
• Protons from the 14N(n, p)14C reaction are not created for transport by all avail-able cross-section libraries (ENDF/B-VI.6 and ENDF/B-VI.8 evaluation, other cross-sections did not support charged particle production). Therefore the proton (Ep ≈0.5 MeV ) is absorbed locally, which is only correct if charged particle equilibriumwas achieved. In case of the TE/TE chamber this prohibits the transport of protonsfrom this reaction, probably underestimating its sensitivity to thermal neutrons.
• Ionic dose (charge collected by the electrometer) can not be tallied. Ionic dose isabsorbed dose divided by the average energy required to produce an ion pair (W/e0).Therefore dose absorbed to the cavity gas is tallied. For fast neutrons W/e0 is mostlyconstant, but increases with decreasing neutron energy, as shown in ICRU Report31. This may lead to an underestimation of the sensitivity of Mg/Ar and TE/TEchamber for low energy neutrons.
• Lithium particles from the 10B(n, α)7Li reaction are neither produced nor trans-ported. To overcome this problem the 10B cross-section had to be extended. Detailsare explained below.
48

4.3 Calibration of the ionization chambers
4.2.1 Simulation of the boron decay
Using the provided cross-section for 10B, boron decay is handled by MCNPX in the fol-lowing way: When a thermal neutron is absorbed and the (n, α) reaction type is sampledone of two events occur. With 93.9% probability a photon of 480 keV energy is produced,banked for further transport and 2.314 MeV are deposited locally. With 6.1% probabilityno photon is produced and 2.796 MeV are deposited locally. This mechanism is valid ifboth lithium and α-particle are stopped within the cell of their production or chargedparticle equilibrium is achieved for them. In case of the borated chamber both conditionsdo not apply.
To be able to estimate the chamber response the 10B cross-section was enhanced withsecondary particle production data in the following way: When a (n, α) reaction type issampled an α-particle of 1.47 MeV energy is produced, banked for further transport andthe deposited energy is reduced by 1.47 MeV.
This is only approximately true for the physical decay process because of the followingreasons:
1. With 6.1% probability the produced α-particle has an energy of 1.77 MeV.
2. The direction of the α-particle is sampled uniformly in space.
3. The remaining energy is transferred to a Li-particle. Li-particles are not transportedby MCNPX. If the Li-particle leaves the cell in which it is created and charged particleequilibrium is not given, the approximation of local energy deposition will wrong.
As the Li-particles carry roughly one half on the energy of the α-particles the abovementioned limitations can be corrected in case of the boron coated magnesium chamber.
Total dose absorbed to the chamber cavity is Dtotal = Dn + De + Dα + DLi, De includesdose from secondary electrons of photon radiation. As mentioned before DLi cannot becalculated by MCNPX, but can be estimated from the kinetic energy of the particle to beabout half of Dα, so total dose could be approximated as Dtotal = Dn + De + 1.5Dα.
4.3 Calibration of the ionization chambers
Ionization chambers used for clinical dosimetry have to calibrated either directly at acobalt source or against a different ionization chamber which is already calibrated. Forphoton dosimetry ND,W and kQ values, for calibration of the triple chamber system h, kand i-values have to be determined. All values have to be determined for each chamberindividually.
ND,W values are determined at a cobalt source. A calibrated reference chamber is neededor the absorbed dose to water has to be known at a reference position.
h values are correlated with the correction for beam quality kQ, known from photondosimetry. The kQ formalism is described by the IAEA technical reports series no. 398 [22].
49

4 Ionization chambers for neutron detection
If it is assumed that absorbed dose to muscle tissue and absorbed dose to water are equiv-alent for photons the following equation will be valid:
h =1
kQ
(4.7)
Experimental k value determination is complicated and was not done in this work.Instead energy dependence of the k value was studied with MCNPX, result are shown infigure 4.3. Reference values from literature have been used when necessary.
The value of i can be derived in the following two ways:Starting from equation 4.6 in an environment where gamma and fast neutron dose arenegligible, compared to thermal neutron dose, and charged particle equilibrium is givenif the chamber is not present, a direct approach is shown in equation 4.10. M is thechamber reading corrected for temperature and pressure, ND,W is the sensitivity of thechamber to the 60Co radiation used for calibration, R(E) is the calibration factor relatingthe chamber signal to fluence, Φt is the thermal neutron flux and K(E) is the fluence-to-kerma conversion factor.
M ·ND,W = h ·Dγ + k ·Dn + i ·Dt (4.8)
inserting Dγ = Dn = 0 and Dt = K(E) · Φt
M ·ND,W = i ·K(E) · Φt (4.9)
with M = R(E) · Φt
i =R(E)
K(E)·ND,W (4.10)
The indirect approach can be used in situations where gamma and fast neutron doseare non-negligible compared to the thermal neutron dose. It utilizes a lithium cap, whereit is assumed that the disturbance by the lithium cap is negligible for photons and fastneutrons (equation 4.13). Assuming that the thermal neutron flux is reduced by the cap,the reduction ratio of thermal neutrons can be estimated by determining the reduction ofthe response of the MgB/Ar chamber (results in table 4.5). At the used reference sourcesthe MgB/Ar chamber could be considered selectively sensitive to thermal neutrons.
R = h ·Dγ + k ·Dn + i ·Dt (4.11)
RLi = h ·Dγ + k ·Dn + i · Dt
reduction ratio(4.12)
i =R−RLi
(1− 1/reduction ratio) ·Dt
(4.13)
4.3.1 60Co calibration
All three chambers have been calibrated against a Farmer chamber in a 60Co beam atthe Petten nuclear facility. Measurements were done free-in-air at a distance of 50 cm.Build up caps have been used in case of the magnesium chambers resulting in the same
50

4.3 Calibration of the ionization chambers
TE/TE chamber Mg/Ar chamber MgB/Ar chamber0.08894 ± 0.002 0.06858 ± 0.00005 0.06363 ± 0.0003
Table 4.2: ND,W values determined by 60Co calibration. Values are given in Gy/nC.
collected charge, as the increased charged particle equilibrium compensated the additionalphoton attenuation. Due to its calibration the Farmer chamber yielded absorbed doseto water. Dose values of the farmer chamber agreed within 1% with absorbed dose towater values provided by the source manufacturer and equation 4.14 was used for ND,W
determination, with Mchamber being the chamber reading corrected for temperature andpressure. Determined ND,W values are shown in table 4.2.
ND,W,chamber =DW,farmer
Mchamber
(4.14)
4.3.2 kQ determination for photon dosimetry
X-ray fields for kQ determination were provided by two clinical accelerators at the UKE, aSiemens Mevatron MDX-2 offering 4 MV and 6 MV fields and a Siemens Primus offering6 MV and 15 MV fields. The irradiation of each chamber was done with 100 MU ofa 10×10 field at 3 cm depth of a solid water (RW3) phantom consisting of a stack of30 cm × 30 cm × 1 cm RW3 slabs. The chambers were mounted at the center of acorrespondingly drilled 30 cm × 30 cm × 2 cm PMMA slab. The overall height of thephantom was 13 cm. Again the Farmer chamber has been used as reference.
All kQ values determined are listed in table 4.3. The corresponding h values derivedby equation 4.7 are summarized in table 4.4. Being contaminated with neutrons, the 15MV mode of the Siemens Primus could not be used for kQ determination of the MgB/Ar-chamber. This contamination is small enough to be neglected in case of the TE/TE andthe Mg/Ar chamber.
Assuming that after passing through 35 cm of water the neutron contamination in theHB11 beam (explained below) becomes negligible, the ratio of hMg/hTE can be determinedto be 1.079 ± 0.005. As neither hMg nor hTE could be determined separately in the HB11beam unity was assumed for hTE.
The h value of the MgB/Ar chamber for the 15 MV mode of the Siemens Primus accel-erator can be estimated by equation 4.15.
hMgB(15 MV ) = hMg(15 MV )hMgB(6 MV )
hMg(6 MV )(4.15)
4.3.3 Response to neutron irradiation
To calibrate the chamber response to neutron irradiation three neutron sources were avail-able. The purely thermal neutron beam at GKSS, the mostly thermal neutron beam at
51

4 Ionization chambers for neutron detection
beam quality TE/TE chamber Mg/Ar chamber MgB/Ar chamber4 MV, MDX-2 0.992 ± 0.005 0.955 ± 0.005 1.023 ± 0.0056 MV, MDX-2 0.983 ± 0.005 0.947 ± 0.005 1.010 ± 0.0056 MV, Primus 0.977 ± 0.005 0.938 ± 0.005 1.004 ± 0.00515 MV, Primus 0.946 ± 0.005 0.901 ± 0.005 *
Table 4.3: kQ values derived from comparison with a Farmer chamber at a medical linearaccelerator. Values marked with an asterisks (*) could not be determined asthere is a small neutron contamination in high energy photon fields.
beam quality TE/TE chamber Mg/Ar chamber MgB/Ar chamberHB11 1.000* 1.079* 1.008*4 MV, MDX-2 1.008 ± 0.005 1.047 ± 0.005 0.977 ± 0.0056 MV, MDX-2 1.017 ± 0.005 1.055 ± 0.005 0.990 ± 0.0056 MV, Primus 1.024 ± 0.005 1.066 ± 0.005 0.996 ± 0.00515 MV, Primus 1.057 ± 0.005 1.110 ± 0.005 1.037*
Table 4.4: Summary of h values determined. Values marked with an asterisks are estimates.
the LFR and the epithermal neutron beam at the HFR. Each of them is described below.Kerma factors for muscle tissue for each spectrum were calculated by convoluting the neu-tron spectrum (maxwellian distribution) with the kerma factor for the individual energies.As the kerma factors provided by ICRU Report 44 were available at discrete energies only,they were continuously interpolated before convolution.
Thermal neutron beam at GKSS
A neutron reference field from the Physikalisch-Technische Bundesanstalt (PTB) at thePOLDI beamline at the GKSS facility at Geesthacht, Germany was available for calibra-tion.
The beam from the PTB was described in detail by Bottger et al [23]. A reference posi-tion for measurements was provided. The spectrum was described by a maxwellian distri-bution with a kT of 22.25 meV (see figure 4.2), the cadmium ratio is RCd = 3.3×10⁴±20%,no neutrons with energies higher than 1 MeV could be detected with a highly enriched 238Ufission chamber and a Cd-plate in beam and a gamma dose rate of about 2 µSv/h was mea-sured at the reference position by Bottger et al [23]. The average flux is 8.5×104 cm−2s−1
± 5%. The kerma factor for this spectrum is 3.213×10⁻¹³ Gycm2. The measurements weredone free-in-air at the reference position with the beam axis perpendicular to the chamberaxis.
Mostly thermal neutron beam at LFR
This mostly thermal neutron beam is a mixed neutron/photon field with a high thermalneutron flux. It is located at the BIBNIF at the Low Flux Reactor (LFR) at the Petten
52

4.3 Calibration of the ionization chambers
Figure 4.2: Neutron spectrum of the PTB reference field. Solid line shows measured spec-trum, dotted line shows a maxwellian distribution with a kT of 22.25 meV.
nuclear facility, the Netherlands.
Foil measurements at LFR and HFR where performed with a set of three foils consistingof AuAl- (1wt% Au), Cu- and MnNi-foils (88wt% Mn) encapsulated in rice paper. Thefoils were analyzed by A. Paardekooper from NRG Fermi-lab at the Petten nuclear facility.
The spectrum at the LFR can be described by a maxwellian spectrum with a kT of27 meV. The kerma factor for this thermal spectrum is 2.916×10⁻¹³ Gycm2. The averageflux has been determined by foil measurements to be 6.925×108 cm−2s−1 ± 2.5%. Therewere only 0.5 % neutrons faster than thermal. These neutrons were assumed to be epither-mal following an 1/E distribution. There was a significant contamination of photons, witha dose rate of about 1 Gy/h, in the beam. The measurements were set up on a trolleythat was inserted into the reactor by the operating crew. The chambers were positionedfree-in-air on this trolley with chamber axis perpendicular to the beam axis [24, 25].
Epithermal neutron beam at HFR
Finally an epithermal neutron beam (HB11) used for BNCT treatments at the High FluxReactor (HFR) at the Petten nuclear facility, the Netherlands was available for calibration.
Measurements were done in a computer controlled WP 700 water phantom from WellhoferDosimetry (64.5 cm × 67.5 cm × 56 cm). The water phantom was positioned at 30 cmdistance from the beam exit. As the beam axis of the HB11 beam propagates horizontallythe 1.5 cm lucite wall of the water phantom had to be passed by the beam. Calibrationsand foil measurements where done at 3 cm depth along the beam axis (i.e. 1.5 cm lucite
53
4 Ionization chambers for neutron detection
Location kT [meV] measured reduction ratioPTB 22.25 1445.9LFR 27 179.5HB11 45 42.0
Table 4.5: Reduction ratios of the lithium cap determined with the MgB/Ar chamber.
and 1.5 cm water), so the distance to the beam exit was 33 cm. No corrections due tolucite wall have been made.
The HB11 beam of the HFR has been well described in literature [26]. The kermaweighted mean energy of the beam is 10.4 keV. Inside our water phantom we assumed amaxwellian distribution of thermal neutrons with a kT of 45 meV, due to the incompletethermalization of the neutron beam at the point of measurement. The kerma factor ofmaxwellian neutrons with a kT of 45 meV is 2.283×10⁻¹³ Gycm2. The average flux ofthermal neutrons was determined by foil measurements to be 8.401×108 cm−2s−1 ± 2.5%,about 4% of the neutrons were faster than thermal [25]. There is a significant contaminationof photons in the beam, additionally a 2.23 MeV photon field is produced by capturereactions at the hydrogen atoms of the phantom.
Determination of reduction ratios due to the lithium cap
The reduction ratios used by equation 4.13 have been determined with the MgB/Ar cham-ber by dividing the charge collected without cap by the charge collected with cap. Thereduction ratios can be found in table 4.5.
Determination of k values
k values for the triple chamber system have been studied by Monte Carlo simulation. Cal-culated values are compared with the k values determined by Waterman et al in figure 4.3.They studied the energy dependence for neutron energies from 1 MeV to 50 MeV, butonly values from 1 MeV to 10 MeV are shown in the figure. i values (determined below)are added for comparison at their kT value, although a maxwellian distribution is notmonoenergetic in nature.
For epithermal beams k values for lower energies are usually needed. Raaijmakers etal [27] have studied the k value for their TE/TE chamber extensively. They determineda value of 0.87 ± 0.03 for the HB11 beam (kerma weighted mean energy 10.4 keV). Allvalues are summarized in table 4.6.
Determination of i values
The response of the MgB/Ar chamber signal against the most probable energy of thethermal neutrons is shown in figure 4.4. There is a good agreement between calculatedand the measured values. The response of the MgB/Ar chamber decreases with neutron
54

4.3 Calibration of the ionization chambers
Figure 4.3: Energy dependence of k values. kTE is shown by the solid line, kMgB by thedotted line, kMg by the dashed line. Comparison of calculated values (lines)with measured values (markers).
neutron energy TE/TE chamber Mg/Ar chamber MgB/Ar chamber10 keV (Raaijmakers) 0.87 ± 0.03 - -1 MeV 0.960 ± 0.096 0.021 ± 0.002 0.021 ± 0.0022 MeV 0.960 ± 0.096 0.030 ± 0.003 0.030 ± 0.0033 MeV 0.960 ± 0.096 0.035 ± 0.004 0.035 ± 0.0044 MeV 0.960 ± 0.096 0.040 ± 0.004 0.040 ± 0.0045 MeV 0.959 ± 0.096 0.046 ± 0.005 0.046 ± 0.0056 MeV 0.958 ± 0.096 0.054 ± 0.005 0.054 ± 0.0057 MeV 0.957 ± 0.096 0.060 ± 0.006 0.060 ± 0.0068 MeV 0.956 ± 0.096 0.075 ± 0.008 0.075 ± 0.0089 MeV 0.954 ± 0.095 0.088 ± 0.009 0.088 ± 0.00910 MeV 0.951 ± 0.095 0.103 ± 0.010 0.103 ± 0.010
Table 4.6: k values reproduced from Waterman et al and Raaijmakers et al . Identical val-ues for the Mg/Ar and MgB/Ar chamber have been chosen, as the contributionof 10B is insignificant at high energies.
55

4 Ionization chambers for neutron detection
Figure 4.4: Response of MgB/Ar chamber to maxwellian distributed thermal neutrons.
energy. Thus the chamber is calibrated in terms of charge collected by the electrometerper thermal neutron fluence (at the point of measurement without chamber presence). Byusing equation 4.10 the i values of the MgB/Ar chamber can be determined directly. Asshown in figure 4.3 the i value is nearly constant at low neutron energies. This is due tothe energy dependence of the neutron kerma factor, which tends to compensate the energydependence of the response of the MgB/Ar chamber.
i values of TE/TE and Mg/Ar chamber had to be determined by the indirect methodshown in equation 4.13, the reduction ratios from table 4.3 have been used.
The MgB/Ar chamber is sensitive to the orientation of the chamber in relation to thedirection of the neutrons. Ludemann et al [28] studied this effect and determined a valueof 0.835 for the compensation of isotropic irradiation. Therefore the values from HB11had to be multiplied by 0.835 to compensate the isotropic distribution of thermal neutronsinside the water phantom.
4.4 Triple chamber system at the LFR
Dose rate values for the LFR have been calculated and verified with foil measurements byothers. However these values change to a certain amount with the fuel cycle of the reactor.The thermal neutron dose rate was determined by multiplying flux, determined with foilmeasurements, and kerma factor. This allowed a cross check of the triple chamber system.
For dose separation with the triple chamber system the equations 4.6 have to be solved.
56

4.4 Triple chamber system at the LFR
TE/TE chamber Mg/Ar chamber MgB/Ar chamberPTB - - 23150 ± 2000LFR 2.47 ± 0.05 1.32 ± 0.3 23350 ± 2000HB11* - 2.88 ± 0.5* 25950 ± 2000*mean 2.47 ± 0.05 2.10 ± 0.5 24150 ± 2000Raaijmakers 1.490 ± 2% 1.259 - 0.477 ± 2% -
Table 4.7: i values were determined directly for the MgB/Ar chamber, indirectly for theother chambers. Values marked with an asterisks have been multiplied by 0.835.Values from Raaijmakers et al were determined for a different type of chamber.
type of dose measured [Gy/h] given by LFR [Gy/h]gamma dose 0.977 ± 10% about 1.0fast neutron dose 0.184 ± 20% less than 0.2thermal neutron dose 0.714 ± 5% 0.727
Table 4.8: Dose rate of individual dose components at the LFR. Gamma and fast neutrondose where provided by operating company of the LFR. Thermal neutron doserate was calculated by multiplying flux and kerma factor.
For this purpose h, k and i values for each chamber have to be known. h values from HB11(table 4.4) have been used for the photon sensitivity, as it is the only neutron source intable 4.4. kMg and kMgB values for 1 MeV from Waterman et al , kTE from Raaijmakerset al have been chosen, as they are the values with the lowest neutron energy available. Itis expected that non-thermal neutrons at the LFR will have a low energy. Finally the ivalues determined directly at the LFR (table 4.7) were used.
Inserting all values into the equations 4.6 and solving the system yields the dose ratevalues presented in table 4.8. Different uncertainties for the calculated values are assumed,as the results are influenced by each other. Fast neutron dose is most sensitive to smalluncertainties in calibration values, thermal neutron dose is least sensitive. All calculateddose rate values are in good agreement with the provided values.
57


5 Experiments
Three different experimental set-ups for measurement of the neutron contamination in the15 MV mode of the Siemens Primus accelerator have been studied. All measurements weredone with the ionization chambers introduced in the last chapter.
Utilizing tungsten for photon fluence attenuation, the first experiment reduces the fluenceratio (Φγ/Φn = 105) to facilitate the neutron measurement.
Measuring in a solid water phantom without photon attenuation, the second experi-ment shows the applicability of the paired chamber system for measurements in clinicalsituations.
Using a water phantom, the third experiment realizes common reference conditions ofclinical dosimetry.
Modeling the experiments in MCNPX and calculating total dose and reaction rate in 10B(response of the paired chamber system) allows to compare predictions from simulationswith measurements.
Some of the following studies have been included into a publication which was submittedto ”Physics in Medicine and Biology” on 05. June 2007, so some paragraphs and figuresare similar to the submitted text.
59

5 Experiments
(a) (b)
Figure 5.1: MCNPX Geometry plots of (a) set-up with 6 cm tungsten, (b) set-up withEasyCube.
5.1 Shielding with tungsten
An experimental set-up for measuring the neutron contamination in the photon beam hasbeen studied. A stack of tungsten plates (10 cm × 10 cm × 1 cm each) is placed on topof a solid water (RW3) phantom. The RW3 phantom dimensions are 30 cm × 30 cm ×13 cm and a 10×10 photon field was chosen for irradiation.
The phantom was realized by stacking together RW3 slabs of 1 cm height each. Theionization chambers used for measurements were mounted in a correspondingly drilledPMMA plate of 2 cm height. So the overall composition of the phantom (from top tobottom) was 2 cm RW3, 2 cm PMMA (with chamber at the center), 9 cm RW3. Theupper surface of the phantom was positioned in SSD 100.
Being a dense material, tungsten attenuates the photon beam, while simultaneouslycreating additional photoneutrons. Neutrons can also be scattered back from the treatmentroom and thus contribute to tally and measurement.
5.1.1 Simulations
Ranging in tungsten thickness from 1 cm to 6 cm, 6 MCNPX runs were done running 20million primary particles each. Figure 5.1 (a) shows an MCNPX plot of the geometry.Following variance reduction methods were used: cell importance, biased bremsstrahlung
60

5.1 Shielding with tungsten
(a) (b)
Figure 5.2: Comparison of measurement with calculation for 100 MU of a 10×10 field withdifferent tungsten thickness. All measurements have been done at the samereference position (3 cm depth) increasing the height of the tungsten stack.Total photon dose measurements (a) utilize the Mg/Ar chamber only, excesscharge determination (b) uses both chambers.
production, biased photonuclear production, electron energy cutoff of 200keV and particleweight cutoff (-0.1 for electrons, -0.2 for photons, -10−9 for neutrons).
Total dose and reaction rate in 10B were tallied in 3 cm depth of the RW3 phantom (flatcylinder with z=0.4 cm, r=2.5 cm, center at 3 cm depth).
5.1.2 Measurements
Chamber measurements have been done three times, at a depth of 3 cm in the phantom,producing the same results. Uncertainties originate in the uncertainty of the chambercalibration, the electrometer, the positioning accuracy and the daily variation of the ac-celerator. These uncertainties should be in the order of 3% or less and are not included inthe figures.
Figure 5.2 shows the comparison of measurement and calculation. Total photon dose wasderived from measurement with the Mg/Ar chamber using equation 4.1. Excess charge wasmeasured using both chambers and equation 4.2. Agreement of measured and calculatedphoton dose is within 3%. Agreement of calculated excess charge and reaction rate iswithin 7%, although a slightly different gradient can be observed.
61

5 Experiments
Figure 5.3: Influence of the patient couch on simulation outcome. Both calculations havebeen done with the isocentrically placed EasyCube, either on the patient couchdirectly or on a polystyrene block.
5.2 Neutrons in a solid water phantom
It was concluded from the experimental verification of the tungsten shielding experimentthat the paired chamber method was sensitive enough to detect neutrons in the photonfield without additional reduction of the photon flux.
This experiment uses an IMRT verification phantom called EasyCube. It is in use for theverification of patient treatments and very easy to handle. It is a cube of 18 cm × 18 cm× 18 cm and made of solid water (RW3). It consists of an outer cubic cage (wall thickness1 cm), where slabs and blocks of RW3 are inserted. For ionization chamber measurementsthe cube has to be opened on one side reducing its size in this direction by 1 cm.
The IMRT verification phantom EasyCube was positioned on a polystyrene block in theway that the center of the EasyCube is placed at the isocenter (figure 5.1 (b)). Mg/Ar andMgB/Ar chamber were mounted on the central axis of the cube with a specially drilledRW3 adaptor allowing the chamber to be positioned at the desired depth (2 cm to 16 cm).Figure 5.3 shows the significance of the placement on polystyrene. If the EasyCube wasplaced directly onto the carbon fibre table thermal neutrons would be reflected by the tableincreasing the tallied reaction rate in the EasyCube.
5.2.1 Simulations
For comparison with the measured data one MCNPX run with 147 million primary particleswas calculated. Tally volumes were small cylinders (z=0.2 cm, r=2.5 cm) positioned at each
62

5.2 Neutrons in a solid water phantom
Figure 5.4: Calculated neutron dose (µGy) along the central axis of an EasyCube geometryper 100 MU of a 10×10 field in different materials. All runs used the samegeometry.
full centimeter of depth (1, 2, ... 15 cm). Tallied quantities were total dose, neutron doseand reaction rate in 10B. Following variance reduction methods were used: cell importance,biased bremsstrahlung production, biased photonuclear production, electron energy cutoffof 200keV and particle weight cutoff (-0.1 for electrons, -0.4 for photons, -10−7 for neutrons).
Additionally three MCNPX runs with 118 million, 90 million, 86 million primary par-ticles using the same geometry and variance reduction methods but replacing RW3 withmuscle tissue, brain tissue or water have been done. The resulting depth dose distributionsare shown in figure 5.4.
It can be observed that RW3 is neither tissue nor water equivalent for neutrons. There-fore special care has to be taken when comparing the absorbed neutron dose.
Muscle and brain tissue show a depth dose behavior which is comparable to water, butabsorbed neutron dose to muscle tissue is approximately 6 % higher than neutron doseabsorbed to water.
A separate MCNPX run tallied the distribution of reaction rate, total dose and neutrondose was in a mesh grid running 76 million primary particles. The mesh is equally spacedin the volume of the EasyCube with 1/64 cm3 voxels. The central plane along the z-axis(voxel center at X= -0.13 cm) of this distributions is shown in figure 5.5.
The results of the mesh calculation appear fuzzy, which is due to the small voxel sizerequiring more primary particles to be run. Nevertheless a general behavior of the studiedquantities can be deduced. Figure 5.5 (a) shows reaction rate in 10B. The distribution is
63

5 Experiments
(a) (b)
(c) (d)
Figure 5.5: Distributions in the central plane of a 10×10 field in the EasyCube (a) reactionrate in 10B normalized to unity, (b) total dose [Gy/100MU], (c) neutron dose[mGy/100MU], (d) neutron contribution to total dose [% of total dose].
64

5.2 Neutrons in a solid water phantom
(a) (b)
Figure 5.6: Comparison of measurement with calculation for 500 MU of a 10×10 field indifferent depths of the EasyCube phantom. Total photon dose measurements(a) utilize the Mg/Ar chamber only, excess charge determination (b) uses bothchambers.
independent of the photon field size, has its maximum in 3 cm depth and decreases towardsthe edges of the EasyCube due to missing thermal neutron backscatter. Figure 5.5 (b)shows total dose, which is dominated by the 10×10 photon field. Figure 5.5 (c) showsthe neutron dose distribution. Neutron dose decreases exponentially and no photon fieldborder or no buildup effect can be observed. Finally figure 5.5 (d) the neutron contributionto total dose. The highest contribution is observed at the corners of the EasyCube. Valueswith more than 1% have to be considered carefully, as more primary particles should becalculated and areas with a high neutron contribution correspond with areas where fewphotons have been sampled so far.
5.2.2 Measurements
A 10×10 field with 500 MU was irradiated for each measurement. Results are shown infigure 5.6. Total photon dose was derived from measurement with the Mg/Ar chamber us-ing equation 4.1. Calculated and measured dose agree well beyond 3 cm depth. Calculateddose in the build-up region is to low. The same effect is observed in figure 3.8 (a) and canbe attributed to the mismatch of the electron contamination of the photon beam. Excesscharge was measured using both chambers and equation 4.2.
Agreement of measurement and calculation of photon dose beyond 3 cm depth is within2%. Agreement of calculated excess charge and reaction rate is within 7%, showing asimilar gradient.
A relation between excess charge and neutron dose is essential when clinical set-ups arestudied. The relation shown in figure 5.7 falls rapidly with increasing depth due to the
65

5 Experiments
Figure 5.7: Neutron dose per excess charge measured on the central axis of a 10×10 fieldin the EasyCube.
thermalization of the neutron component. Fast neutrons become thermal with increasingdepth and thermal neutrons are detected by the MgB/Ar chamber. Beyond 8cm depth anearly constant rate of Dn/∆Q = 30µGy/nC is reached.
This calibration allows to estimate the neutron dose measured by the paired chambersystem. Although RW3 is neither tissue nor water equivalent for neutrons figure 5.7 showsa calibration of the measured excess charge in RW3 to absorbed dose in muscle tissue,brain tissue and water.
Neutron dose absorbed to muscle tissue, brain tissue and water was calculated in separateMCNPX runs (see above) with identical geometry. Thus this calibration allows to measureabsorbed dose to a tissue (or water) phantom if a RW3 phantom is used for measurement.
66

5.3 Neutrons in a water phantom
5.3 Neutrons in a water phantom
Solid water (RW3) is not tissue or water equivalent for neutrons. Fast neutrons interactmainly by the proton recoil process, so the hydrogen concentration defines tissue equiva-lency in first order approximation. Muscle tissue contains about 10% hydrogen, A150 andWater contain approximately the same amount, while RW3 contains only 7.6% hydrogen(see table 3.2).
To be able to make valid assumptions of the distribution of neutron dose in a patient awater phantom is routinely used. The water phantom available for experimental verificationhas an outer dimension of 64.5 cm × 67.5 cm × 56 cm and could be filled with water toa height of 49.5 cm. The PMMA walls of the phantom are 1.5 cm thick. For simulationpurposes the wall material was not included. Only a water cuboid of 60 cm × 60 cm ×50 cm was included.
5.3.1 Simulations
The distribution of reaction rate, total dose and neutron dose was tallied in a mesh grid fora 5×5, 10×10 and a 20×20 field with MCNPX runs with 15.1, 20.3 and 15.7 million primaryparticles, respectively. The mesh grid used voxels of 1 cm3 size, covered the whole depthof the phantom (50 cm) and the X and Y direction from -15.5 cm to 15.5 cm equally. Thefollowing variance reduction methods were used: cell importance, biased bremsstrahlungproduction, biased photonuclear production, electron energy cutoff of 200keV and particleweight cutoff (-0.1 for electrons, -0.2 for photons, -10−9 for neutrons). The central plane ofthe 10×10 field along the z-axis is shown in figure 5.8. Figure 5.9 shows field size effects.
The water phantom has been subdivided into 25 water slabs of 2 cm height increasingthe cell importance with increasing depth of the slab. For electrons the cell importancewas increased by a factor of 2 for each slab. For photons the cell importance was increasedby 10% for each slab and for neutrons the cell importance was increased by 50% for thefirst slabs decreasing to a 10% increase for the last slabs.
Figure 5.8 shows distributions in the central plane of the water phantom for a 10×10field. Figure 5.8 (a) shows reaction rate in 10B normalized to unity. A build up effect can beobserved, but photon field borders are not observable. The reaction rate is decreasing withincreased distance to the central axis, at a distance of 15.5 cm a decrease of approximately20% was calculated. Figure 5.8 (b) shows total dose [Gy/100MU]. Total dose is dominatedby photon radiation and shows the usual behavior for a 10×10 field. Figure 5.8 (c) showsneutron dose [mGy/100MU]. Again no photon field borders are observable, neither a buildup effect. The neutron dose is decreasing exponentially. Figure 5.8 (d) shows neutroncontribution to total dose [% of total dose]. Neutron contribution is highest close to thewater surface and distant from the central axis. This is due to the fact that (scattered)photon dose is minimal at these points.
Figure 5.9 shows the general behavior of the neutron field. The neutron dose is decreasingexponentially, a buildup effect cannot be observed (b). A field size dependency is observedin form of an intensity change, the overall neutron dose increases with increased field size
67

5 Experiments
(a) (b)
(c) (d)
Figure 5.8: Distributions in the central plane of the water phantom for a 10×10 field (a)reaction rate in 10B normalized to unity, (b) total dose [Gy/100MU], (c) neutrondose [mGy/100MU], (d) neutron contribution to total dose [% of total dose].
68

5.3 Neutrons in a water phantom
(a) (b)
(c) (d)
Figure 5.9: Field size dependency in the water phantom studied for a 5×5, 10×10 and20×20 field (a) reaction rate in 10B along central axis, (b) neutron dosealong central axis [mGy/100MU], (c) neutron dose profile in 1.5 cm depth[mGy/100MU], (d) neutron contribution to total dose in 1.5 cm depth [% oftotal dose].
69

5 Experiments
((b) and (c)). On the other hand, the neutron dose distribution is mostly undisturbed(c). Figure 5.9 (d) shows the neutron contribution to the total dose along the crossplanedirection. It can be observed that the neutron contribution is highest for the 5×5 field andlowest for the 20×20 field. This is due to the fact that the (scattered) photon dose outsidethe field borders increases with increasing field size.
5.3.2 Measurements
Measurements in the water phantom have been done using the triple chamber system.However the large difference between photon and neutron flux (Φγ/Φn = 105 at the isocen-ter without phantom presence) and the experimental errors in the calibration factors of thetriple chamber system prohibited a direct measurement of neutron dose. The evaluationof the measurement has been done for the paired chamber system instead.
Figure 5.10 shows the comparison of the calculated reaction rate with the measuredexcess charge. All values have been normalized to the maximum along the central axis. Ashift can be observed when the radiation field edge is reached in figure 5.10 (b),(d) and (f).This shift can be explained as an energy dependence of the krel value used in the pairedchamber system, as the mean photon energy differs significantly inside and outside of thephoton field. This energy dependence also explains the negative excess charge values infigure 5.10 (a), (b) and (c). Near the water surface secondary electrons and low energyphotons contaminate the beam resulting in a different mean photon energy.
70

5.3 Neutrons in a water phantom
5×5 field (a) (b)
10×10 field (c) (d)
20×20 field (e) (f)
Figure 5.10: Comparison of measurement with calculation for a 5×5 (a,b), 10×10 (c,d) and20×20 (e,f) field in the water phantom. Reaction rate in 10B and measuredexcess charge are compared (a,c,e) along the central axis and (b,d,f) crossplaneat a depth of 3 cm and 10 cm in the water phantom. All values have beennormalized to the maximum along the central axis of the corresponding field.Figures showing results along the central axis and crossplane figures are scaleddifferently.
71

5 Experiments
Figure 5.11: Neutron dose per excess charge measured on the central axis of all three fieldsizes in the water phantom.
A relation between excess charge and neutron dose can be calculated similar to the oneobtained from the EasyCube measurement. The relation is shown in figure 5.11 and fallsrapidly with increasing depth due to the thermalization of the neutron component. Therelation was not calculated for regions of negative excess charge.
This calibration is different than the calibration obtained from the EasyCube experiment(figure 5.7), as neutron dose absorbed to water was calculated and divided by measuredexcess charge. Neutron depth dose curves differ for RW3 and water because of the dif-ferent neutron attenuation in both materials, resulting in a different calibration. Thiscalibration (figure 5.11) allows to estimate neutron dose when using a water phantom formeasurements.
72

6 Estimation of neutron contaminationin clinical treatment situations
Clinical treatment situation typically implement multiple photon fields to create high dosesin the targeted volume (planning target volume, PTV), while sparing other tissue. Forplanning purposes neutron contamination and leakage radiation are usually considerednegligible and not explicitly calculated. It is expected that leakage radiation and neutroncontamination increase when more monitor units are delivered.
Increasing the complexity of a treatment plan increases the applied monitor units asmore fields are irradiated. This is most pronounced in intensity modulated radio therapywhere the number of applied monitor units rises by a factor of 3-9, depending on theirradiation technique, delivering comparable doses to the target volume but with increasedsparing of organs at risk (OAR) and normal tissue.
There is an ongoing discussion whether high precision radiation treatments like IMRTshould be used with high energy photon fields because of neutron contamination andleakage radiation [1].
Clinical radiation therapy is not delivered at one but in fractions. The reasons forfractionated irradiation are biological in nature, as normal tissue regenerates between eachfraction. Tumorous tissue regenerates differently, and a therapeutical gain is achieved infractionating the treatment.
All treatment plans shown in this chapter were calculated by Dirk Albers using thetreatment planning system CMS XiO version 4.3.3.
6.1 Conventional 3D conformal treatment
Conventional 3D conformal treatment delivers radiation in individually shaped fields frommultiple angles. Field shaping is usually done with the MLC of the accelerator, although inrare cases special individual absorbers are manufactured and used. Inhomogeneous fieldscan be applied by using wedges.
The following two plans were calculated for a real patient planning 72 Gy to the prostate.In transferring plan to phantom, dose delivered to the PTV changes, as patient and phan-tom have different geometries. In a real clinical situation an additional dose boost of 3fractions would be applied after completion of the plan. Ignoring the boost, both planswere delivered to the RW3 phantom EasyBody, which is the EasyCube phantom withabdominal extensions.
73

6 Estimation of neutron contamination in clinical treatment situations
(a) (b)
Figure 6.1: (a) standard and (b) crossed 4-field box plan for prostate treatment.
Measurements were done using the paired ionization chamber system in two points. Thefirst point is inside the PTV and the second point is inside a femoral head, a potential organat risk. The points of measurement were chosen this way to have two clinically relevantpoints (PTV and OAR) which are located more than 8 cm deep inside the phantom.
Deep seated points of measurements are necessary as the neutron dose calibration of thepaired chamber system is strongly depth dependent for depth lower than 8 cm. The resultsof measurements are shown in table 6.1.
6.1.1 Standard 4-field box for prostate treatment
A standard 4-field box treatment was calculated for the EasyBody phantom, as shown infigure 6.1 (a). Combining all four fields 230 monitor units were irradiated per fraction,resulting in a total dose to the PTV of 75.5 Gy.
Standard 4-field boxes are a common way of treating prostate cancer, as they are easyin planning. Additionally they can be delivered faster that IMRT deliveries.
6.1.2 Crossed 4-field box for prostate treatment
The crossed 4-field box is similar to the standard 4-field box treatment, but irradiation isdone from different angles to avoid direct irradiation of the femoral heads. The total doseto the PTV is 74.5 Gy, with 210 monitor units per fraction.
A crossed 4-field box can be applied if irradiation of femoral heads have to be spared.This can be the case when a patient has one or more hip prothesis. As these prothesesare commonly made from titanium or other high Z materials, the dose distribution of thestandard 4-field box would be altered.
74

6.2 IMRT treatments with 15 MV photons
(a) (b)
Figure 6.2: (a) prostate and (b) head & neck IMRT plan. A different scale was used forfigure (b).
6.2 IMRT treatments with 15 MV photons
IMRT treatment planning is different from 3D conformal planning. The planning processis inverse, meaning the physicist defines beam angles and dose constrains to PTV andpotential organs at risk, letting a computer calculate the optimal configuration of theMLC and monitor units for delivery.
Delivering IMRT treatments takes more time than delivering 4-field techniques, as IMRTuses more beam angles and more field segments than 3D conformal treatment.
Today 15 MV IMRT treatments are not routinely used in radiation therapy at the UKE,6 MV IMRT treatments are used instead. There is an ongoing discussion whether theincreased risks in 15 MV IMRT treatments (neutrons, leakage radiation) are outweighedby the benefits of high energy irradiation (reduced skin dose, steeper gradients) [1].
The results of the measurements in IMRT deliveries are shown in table 6.1.
6.2.1 IMRT for the prostate
An IMRT plan for the prostate using 5 beams, suitable for patient treatment, was appliedto the EasyBody phantom. The patient received an integrated boost resulting in 76 Gy tothe prostate. The total dose to the PTV in the EasyBody was 81 Gy using 32 MLC fieldsegments and irradiating 322 MU per fraction. Measurements where done with the pairedchamber system at the points of measurement used in 3D conformal treatment.
75

6 Estimation of neutron contamination in clinical treatment situations
Plan frac. MU DPTV,p DPTV,m DOAR,p DOAR,m Dn,PTV Dn,OAR
standard box 40 9200 75.5 72.4 40.1 38.5 1.10 1.16crossed box 40 8400 74.5 71.1 4.0 4.0 1.21 1.07
prostate IMRT 40 12880 81.0 77.6 33.5 33.8 1.32 1.35head&neck IMRT 30 14610 60.7 58.7 29.2 29.9 1.74 1.84
Table 6.1: Results of the measurements in clinical set-ups. All doses are given as sumover all fractions in Gray, neutron doses in mGy. Subscript p indicates dosetaken from planning system, subscript m indicates measured dose. Neutrondose (Dn) was calculated from measurements with the paired chamber systemusing a conversion factor of 30 µGy/nC.
6.2.2 IMRT in a hypothetical head & neck case
Being highly individual no two IMRT plans are identical. To have an estimate of howneutron contamination changes with different IMRT plans a hypothetical head & neckcase using seven beams was planned for the EasyCube phantom. Measurements were donein the high dose region and in a hypothetical organ at risk (spinal cord).
Points of measurement were selected in the way as for the 3D conformal plans. Totaldose to the PTV was 60.7 Gy using 70 MLC field segments, total dose to the organ at riskwas 29.2 Gy, thirty fractions where assumed, irradiating 487 MU per fraction.
6.3 Summary of clinical results
All results are summarized in table 6.1. Except for the crossed 4-field box all plans showcomparable neutron doses in PTV and OAR. The difference of PTV and OAR in thecrossed 4-field box is approximately 20 %. So it can be said neutrons distribute more orless homogenously in the phantom.
This is due to two effects. First, irradiation is done from at least 4 different angles, whichare distributed evenly around the phantom, except for the crossed 4-field box, which wasirradiated from 35◦, 145◦, 215◦ and 325◦ gantry angle. Second, neutron distribution wasshown to be independent of the photon field size in the last chapter (figure 5.9 (c)).
It can be observed, that neutron dose to the organ at risk rises when more monitor unitsare delivered. This is also true for the PTV if the crossed 4-field box is excepted.
When calculating equivalent doses the neutron dose usually is multiplied with qualityfactors. Even large factors of 25 Sv/Gy result in equivalent doses of less than 50 mSv,although this dose has to be seen an a whole body dose due to the homogenous neutrondistribution [29, 30, 31].
The final decision whether approximately 50 mSv are an acceptable whole body dose fora radiotherapy patient has to be made by the radiotherapist responsible for the treatment.
76

7 Summary
This thesis investigated the photon contamination of the 15 MV mode of the SiemensPrimus accelerator. These investigations were performed with Monte Carlo methods aswell as with ionization chamber measurements.
The Monte Carlo simulations were verified with existing photon dose distributions andthe ionization chambers were calibrated to neutron dose.
This resulted in a paired chamber system, which could be used for neutron dose mea-surements in various clinical situations.
7.1 Monte Carlo simulations
Monte Carlo simulations in this work can be divided into following categories: charac-terization of the linac, simulations of neutron distributions inside the treatment room,simulations of the ionization chambers, calculations of neutron and photon dose distribu-tions inside a of two phantoms and simulations of the experiments.
7.1.1 Characterization of the linac
Studying the primary electron distribution, photon dose distributions have been calculatedfor multiple nominal energies of primary electrons. The energy distribution providing thedose distribution fitting best to available data (Ee = 14.55MeV ) was selected for allfollowing calculations of the accelerator.
The therapeutically used photon spectrum has been calculated, showing a mean photonenergy of Eγ = 4.149 MeV and a maximum photon energy of Eγ,max = 14.5 MeV . Theresulting percentage depth dose curve and beam profiles in a water phantom were studiedand compared to measured data finding good agreement except for the build-up region.
The neutron source of the linac was characterized, showing a mean neutron energy ofEn = 1.06 MeV , a most probable energy of En = 450 keV and a maximum neutronenergy of En,max = 8.7 MeV . Additionally locations of neutron production were studied,finding that primary collimator, MLC, Jaws and target produce more than 80% of thephotoneutrons. The neutron source strength was calculated to be Q = 0.136×10¹²n Gy−1,which is comparable to values for the Primus found in literature [20].
This characterization allows to calculate dose distributions and particle spectra for otherset-ups than the reference set-up. Therefore theoretical expectations for experimental set-ups can be made.
77

7 Summary
7.1.2 Neutron distribution inside the treatment room
The neutron flux distribution for thermal neutrons (En ≤ 1eV ), epithermal neutrons(1eV < En ≤ 0.1 MeV ) and fast neutrons (0.1 MeV < En) has been studied for theL1 and L3 treatment room of the UKE. It was observed that the fast neutron distribu-tion followed the 1/r2 law with modifications due to the room geometry. The patienttable reflects neutrons along the central axis, creating and increased flux compared to the1/r2 distribution above and and decreased flux below the table. Additionally neutrons arereflected from the room walls.
To study the possibilities of neutron shielding the material of the plastic cover wasreplaced with two different kinds of neutron shielding plastic. Both shielding plastics werebased on polyethylene, one being loaded with LiF the other with 10B. A 20 % or 35 %decrease in the total neutron flux was observed using lithium or boron shielding.
Knowing the neutron distribution inside the treatment room are essential for radiationprotection calculations. The introduction of plastics for radiation protection is a cheapway to reduce the total neutron flux. If a strong neutron flux reduction is included in theaccelerator design, simpler radiation protection measures can be used for treatment roomshielding.
7.2 Ionization chambers for neutron detection
The ionization chambers used for measurements have been calibrated at several locationsand a Monte Carlo study of the response to neutron radiation was done.
Characterization and calibration of the chambers allows to measure neutron dose inclinical situations which are difficult to calculate with Monte carlo methods.
7.2.1 Ionization chamber simulations
The neutron response of the used ionization chambers to neutrons has been simulated.For the MgB/Ar chamber the response to maxwellian distributed thermal neutrons wasadditionally studied, showing a decrease of the response with increasing energy (kT) of thedistribution.
For all three chambers the energy dependence of the k value was studied. This value isthe chamber sensitivity to neutrons compared to the 60Co radiation used for calibration.The values for the TE/TE chamber were found to be nearly constant, the values for theMg/Ar chamber were found to be very small for low energy neutrons and slightly increasingfor energies above 1 MeV. The values for the MgB/Ar chamber were nearly constant inthe thermal energy region, strongly decreasing for epithermal energies and similar to thevalues of the Mg/Ar chamber for energies above 1 MeV.
78

7.3 Experiments
7.2.2 Calibration of the ionization chambers
The ionization chambers have been calibrated at a cobalt source in Petten, the Netherlands,both absolute and with a reference chamber.
Photon calibrations have been done using medical accelerators available at the UKE.Both accelerators used for calibration were Siemens machines, one being a Mevatron MDX-2 offering 4 MV and 6 MV photon energy, the other being a Primus machine offering 6MV and 15 MV photon energy.
For neutron calibration two neutron sources in Petten, the Netherlands, were available.One being the LFR, offering a mostly thermal neutron beam with a relatively high photoncontamination and the other being the HB11 beam from the HFR reactor used for BNCTtreatments. The MgB/Ar chamber was additionally calibrated at a third neutron source,the reference field at the GKSS facility in Geesthacht, Germany.
Using the calibration, the triple chamber system reproduced the dose components of theLFR validating the applicability of the triple chamber system for measurements in mixedneutron/photon fields..
7.3 Experiments
All experiments were done using ionization chambers as detectors.
Three different experiments have been done to verify the paired chamber method andthe Monte Carlo simulations. Therefore all experiments were simulated in MCNPX andthe results of simulations and measurements were compared.
The experiments showed the paired chamber system to be suitable for neutron detectionin high energy photon fields. Being calibrated to neutron dose the paired chambers systemcan be used in clinical situations which are difficult to simulate.
7.3.1 Neutron and photon dose distributions
Photon and neutron dose distributions have been calculated for for the 10×10 field in asolid water phantom and three field sizes in the water phantom (5×5, 10×10 and 20×20).It was observed that the build up region of the depth dose curve did not fit well to themeasured data. As this region is mainly influenced by low energy photons and secondaryelectrons, a mismatch in low energy photons and secondary electrons has no influence on theneutron distribution. The neutron dose distribution was shown to be mostly independentof field size and decreasing exponentially from the phantom surface, but different field sizesproduced different neutron intensities. Comparison of neutron and photon dose showedthat neutron dose is usually small compared to photon dose, except close to the surfaceoutside the photon field, where the neutron contribution to the total dose reaches the orderof magnitude of one percent.
The (n,α) reaction rate in 10B was calculated together with the dose distribution toestimate the signal of the paired chamber system.
79

7 Summary
7.3.2 Shielding with tungsten
Having a relative difference of 5 orders of magnitude in photon and neutron flux, it wasassumed that measuring neutrons required the photon flux to be reduced. To achievethis goal tungsten plates were brought into the beam path. Being a dense material tung-sten attenuates the photon beam and having a high photonuclear cross-section, additionalneutrons are created inside the tungsten.
Measurements were done in 3 cm depth of a solid water phantom. Simulations talliedtotal dose and reaction rate in 10B at the location of measurement and the results werecompared with the measurement. Good agreement (≤ 3% for photons, ≤ 7% for excesscharge) between measurement and simulations was found.
7.3.3 Neutrons in a solid water phantom
A depth dose curve was measured and simulated for the EasyCube IMRT verificationphantom. Tallied quantities were total dose, neutron dose and reaction rate in 10B. Goodagreement between simulations and measurements was found for depths greater than 3 cm(≤ 2% for photons, ≤ 7% for excess charge).
Using calculated neutron dose data, a calibration of neutron dose to paired chambersignal (excess charge) could be done. The calibration factor showed to be depth dependent,decreasing until reaching a depth of 8 cm.
7.3.4 Neutrons in a water phantom
The triple chamber system was used for measurements in a water phantom. It could beshown that the neutron dose contribution was too small to be detected with twin chambersystem or triple chamber system. A neutron signal could be measured using the pairedchamber system.
Depth and crossplane profiles of the neutron signal were compared with calculationsshowing that the krel factor used for the paired chamber system is energy dependent.
Assuming that the jumps in signal height at the field edges are due to the change of themean photon energy it could be said that the measured neutron distribution is independentof the photon field size.
7.4 Neutron contamination in clinical situations
The neutron contamination in four clinical treatment plan examples has been studied. Twoconventional prostate plans and two IMRT plans were investigated. Neutron measurementshave been done in a high dose region inside the PTV and in a low dose region in an OAR.
The neutron dose calibration determined in the experiment using the solid water phan-tom was used, as the treatment plans were applied to the same phantom.
Is was observed that the neutron dose was distributed almost equally inside the phantomas neutron doses measured inside the PTV and inside an OAR were almost the same. The
80

7.4 Neutron contamination in clinical situations
neutron dose to PTV and OAR showed to increase with increased number of monitorunits. The overall equivalent whole body dose in the studied IMRT treatments was lessthan 50 mSv.
Whether 50 mSv whole body dose equivalent are acceptable has to be decided by theradiotherapist of the patient.
81


A Appendix
A.1 Introduction and summary of this work in Germanlanguage
A.1.1 Einleitung
Die Strahlentherapie ist ein fester Bestandteil heutiger Krebstherapie. Dies ist in sofernwiderspruchlich, da die Strahlung an sich selbst krebserregend ist. In der Strahlentherapiewerden nun hochgradig zellschadigende Strahlungsdosen appliziert, welche so aber auchTumorzellen abtoten.
Daraus ergibt sich die zentrale Herausforderung in der Strahlentherapie: das Tumorge-webe mit hohen Dosen zu zerstoren und dabei gleichzeitig gesundes Gewebe zu schonenund zu erhalten.
Unterschiedliche Arten der Strahlentherapie sind heutzutage etabliert, darunter die Be-strahlung mit einem medizinischen Linearbeschleuniger (Linac). In dieser Arbeit wird derSiemens Primus Elektronenbeschleuniger untersucht, der hochenergetische Photonenfeldermit einer maximalen Energie von 14,5 MeV erzeugt.
Da diese Energie hoher ist als die Schwellenenergie des Kernphotoeffekts (≈ 7 MeV inSchwermetallen) ist das Photonenfeld mit Neutronen kontaminiert. Dieser Effekt fuhrte zuder grundsatzlichen Diskussion, ob hochprazise Strahlentherapie (z.B. IntensitatsmodulierteStrahlentherapie IMRT) uberhaupt mit hochenergetischen Photonen durchgefuhrt werdensollte [1].
Diese Arbeit untersucht nun die Kontamination von hochenergetischen Photonfeldernmit Photoneutronen und versucht ein System zu entwickeln die Neutronendosis zuverlassigabzuschatzen. Da diese Kontamination bei dem untersuchten Linac klein ist, erfordert derNachweis dieser Neutronen entsprechende Detektoren, die in der Strahlentherapie nichtroutinemaßig verwendet werden. Fur diesen Nachweis wurden drei, besonders fur Neu-tronenmessungen geeignete, Ionisationskammern verwendet, mit Monte Carlo Methodenuntersucht und experimentell kalibriert.
Die Monte Carlo Untersuchungen des Beschleunigers wurden in einem Zwei-Stufen-Prozess durchgefuhrt, da es erforderlich ist zu trennen, wann Simulationsergebnisse anMessungen angepasst wurden und wann Simulationsergebnisse durch Messungen verifiziertund zur Kalibrierung verwendet wurden.
In der ersten Stufe wurde die Photonenerzeugung untersucht und die zugrunde liegen-den Daten wurden solange angepasst, bis berechnete Dosisverteilungen mit gemessenenubereinstimmten.
83

A Appendix
Die Neutronenerzeugung wurde dann in der zweiten Stufe untersucht. Die daraus ge-wonnenen Ergebnisse wurden daraufhin mit Ionisationskammermessungen verifiziert undanschließend verwendet um die Kammern auf Neutronendosis zu kalibrieren.
Mittels dieser Kalibrierung war es moglich die Neutronenkontamination in mehrerenklinischen Situationen (unter Verwendung von hochenergetischen Photonenfeldern) zu un-tersuchen und die Neutronendosis abzuschatzen.
Die Resultate werden hier allerdings nicht in chronologischer Reihenfolge dargestellt son-dern in weitaus sinnvollerer thematischer Sortierung. Dies hat den Grund, dass Monte CarloSimulationen mit einem hohen Rechenaufwand verbunden sind und sich somit sehr zeitauf-wendig gestalten. Um diesem Umstand zu berucksichtigen wurden mehrere Teilaufgabengleichzeitig in Angriff genommen, die Resultate lagen so jedoch haufig erst vor, nachdemdie Arbeit an einem neuen Teilprojekt begonnen hatte, wodurch sich eine thematischeSortierung eher anbietet.
A.1.2 Zusammenfassung
Monte Carlo Simulationen: Beschreibung des Linacs
Zur Beschreibung des Linacs ist die Verteilung von drei wichtige Quellengroßen entschei-dend. Die Verteilung der Primarelektronen, der therapeutisch genutzten Photonen und derNeutronen, wobei die Neutronenverteilung von der Photonenverteilung abhangig ist, diesewiederum von der Verteilung der Primarelektronen.
Es wurden mehrere mogliche Energieverteilungen der Primarelektronen untersucht. Furalle Energieverteilungen wurden Dosisverteilungen berechnet und die Energieverteilung mitder besten Ubereinstimmung von berechneten und simulierten Daten (Ee = 14, 55MeV )wurde fur alle folgenden Monte Carlo Simulationen verwendet.
Das therapeutisch verwendete Photonenspektrum wurde berechnet. Dabei wurde einmittlere Photonenenergie von Eγ = 4, 149 MeV festgestellt und eine maximale Photonen-energie von Eγ,max = 14, 5 MeV . Die resultierenden Tiefendosiskurven und Querprofilestimmten mit gemessenen Daten gut uberein, mit Ausnahme der Aufbauregion. Diese Auf-bauregion wird durch niederenergetische Photonen und Sekundarelektronen im Photonen-strahl bestimmt, welche keine Auswirkungen auf die Neutronenverteilung haben.
Die Neutronenquelle des Linacs wurde mit einer mittleren Neutronenenergie von En =1, 06 MeV , einer wahrscheinlichsten Neutronenenergie von En = 450 keV und einer ma-ximalen Neutronenenergie von En,max = 8, 7 MeV beschrieben. Die Orte der Neutro-nenentstehung wurden untersucht und es wurde gezeigt, dass Primarkollimator, MLC,Jaws und Target mehr als 80% aller Neutronen erzeugen. Die Quellenstarke wurde zuQ = 0, 136× 1012n Gy−1 bestimmt, was vergleichbar ist mit Literaturwerten [20].
Monte Carlo Simulationen: Neutronenverteilung im Behandlungsraum
Fur Strahlenschutzberechnungen ist es unerlasslich eine recht genaue Vorstellung von derNeutronenverteilung im Behandlungsraum zu haben und gegebenenfalls adaquate Ab-
84

A.1 Introduction and summary of this work in German language
schirmmaßnahmen zu treffen.Die Neutronenflussverteilung im L1 und L3 Behandlungsraum des UKE wurde fur drei
Neutronenenergien (thermisch (En ≤ 1eV ), epitherm (1eV < En ≤ 0.1 MeV ) und schnell(0.1 MeV < En)) untersucht. Es zeigte sich das die schnellen Neutronen einer 1/r2-Verteilung folgen, welche durch die Raumgeometrie beeinflusst wird. So reflektiert bei-spielsweise der Patiententisch Neutronen entlang des Zentralstrahls, sodass der Fluss uberdem Tisch erhoht und unter dem Tisch reduziert wird. Außerdem werden Neutronen vonden Wanden des Behandlungsraums reflektiert.
Zusatzlich wurde der Einfluss von besonderen Materialien fur den Strahlenschutz auf dieFlussverteilung untersucht. Beide Materialien basieren auf Plastik (Polyethylen) und sindentweder mit LiF oder 10B angereichert. Es wurde eine 20%-ige bzw. 30%-ige Reduktiondes totalen Neutronenflusses festgestellt, wenn entsprechende Materialien benutzt werden.
Simulationen der Ionisationskammern
Da Ionisationskammern als Detektoren verwendet wurden, ist es unerlasslich Erkenntnisseuber ihr Ansprechen auf Neutronenstrahlung zu haben. Diese Erkenntnisse wurden so-wohl durch Monte Carlo Simulationen gewonnen als auch durch die direkte experimentelleKalibrierung der Kammern (nachster Absatz).
Das Neutronenansprechvermogen der Kammern wurde mit MCNPX simuliert. Fur dieMgB/Ar Kammer wurde das Ansprechen auf maxwellverteilte thermische Neutron unter-sucht. Es zeigte sich, das das Ansprechvermogen mit steigender Energie (kT) abnimmt.
Der k Wert wurde fur alle Kammern in Abhangigkeit von der Neutronenenergie unter-sucht. Dieser Wert ist das Ansprechvermogen auf Neutronen relativ zu 60Co Strahlung. DerWert fur die TE/TE Kammer ist fast konstant, der Wert fur die Mg/Ar Kammer ist sehrklein fur niedrige Energien und steigt leicht an fur Energien jenseits von 1 MeV. Der Wertfur die MgB/Ar Kammer ist fast konstant im thermischen Energiebereich, fallt stark abfur epitherme Energien und ist sehr nah am Wert der Mg/Ar Kammer fur Energien großerals 1 MeV.
Kalibrierung der Ionisationskammern
Alle Ionisationskammern wurde in Petten, Niederlande, an einer Cobalt Quelle absolut undmit einer Referenzkammer kalibriert.
Die Photonenkalibrierfaktoren kQ wurden an zwei Beschleunigern am UKE bestimmt.Beide Beschleuniger wurden von Siemens hergestellt, ein Mevatron MDX-2 mit 4 MV und6 MV Photonenenergie und ein Primus mit 6 MV und 15 MV Photonenenergie.
Die Neutronenkalibrierung wurde an zwei Neutronenquellen in Petten, Niederlande,durchgefuhrt. Die erste Quelle war der LFR Reaktor, welcher einen großtenteils thermali-sierten Neutronenstrahl mit einer hohen Photonenkontamination liefert, die zweite Quellewar der HB11 Strahl der HFR Reaktors, welcher fur BNCT Behandlungen eingesetzt wird.Die MgB/Ar Kammer konnte zusatzlich an einer dritten Neutronenquelle kalibriert werden,dem Neutronenreferenzfeld der PTB am GKSS in Geesthacht.
85

A Appendix
Experiment: Neutronen- und Photonendosisverteilungen
Um adaquate Aussagen uber das Verhalten von Neutronen in klinischen Situationen tref-fen zu konnen wurden Photonen- und Neutronendosisverteilungen fur die dosimetrischrelevanten Referenzfelder (5×5, 10×10 und 20×20) bestimmt.
Dosisverteilungen fur Photonen und Neutronen wurden fur das 10×10 Feld im Easy-Cube und fur 5×5, 10×10 und 20×20 Felder im Wasserphantom berechnet. Die Photo-nendosisverteilungen stimmten mit gemessen Photonendosisverteilungen uberein, lediglichder Aufbaueffekt konnte nicht reproduziert werden. Der Aufbaueffekt wird jedoch durchniederenergetische Photonen und Sekundarelektronen im Photonenstrahl bestimmt, welchekeine Auswirkungen auf die Neutronenverteilung haben.
Die Neutronendosisverteilungen zeigen keine Abhangigkeit von den Photonenfeldrandern,aber die Neutronenintensitat steigt mit großerer Feldgroße. Die Neutronendosis fallt ex-ponentiell mit der Tiefe ab. Vergleiche von Neutronen- und Photonendosis zeigen, dassdie Neutronendosis klein im Vergleich zur Photonendosis ist, außer nahe der Oberflacheund außerhalb des Photonenfeldes, wo der Neutronenbeitrag die Großenordnung von einemProzent annimmt.
Experiment: Wolframabschirmung
Da sich Photonen- und Neutronenfluss um funf Großenordnungen unterscheiden wurde an-genommen, dass der Photonenfluss reduziert werden musse um die Neutronen zu messen.Um dies zu erreichen wurden Wolframplatten in den Strahlengang eingebracht. Wolframist ein sehr dichtes Material und reduziert somit den Photonenfluss sehr stark. Zusatzlichkonnen weitere Photoneutronen im Wolfram erzeugt werden, da es einen hohen Wirkungs-querschnitt fur den Kernphotoeffekt hat.
Alle Messungen wurden in 3 cm Tiefe in einem Festwasserphantom durchgefuhrt. Paralleldazu wurden Gesamtdosis und Reaktionsrate in 10B am Messort simuliert. Vergleiche vonSimulation und Messung ergaben eine gute Ubereinstimmung (≤ 3% fur Photonendosis,≤ 7% fur Ladungsuberschuss).
Experiment: Neutronen im EasyCube
Da das EasyCube IMRT Verifikationsphantom eine art Referenzphantom am UKE istwurde das 10×10 Feld in diesem Phantom genauer untersucht.
Fur den EasyCube wurde eine Tiefendosiskurve gemessen und simuliert. Gesamtdosis,Neutronendosis und Reaktionsrate in 10B wurden berechnet. Es gab eine gute Uberein-stimmung zwischen Messung und Simulation fur Tiefen jenseits von 3 cm (≤ 2% fur Pho-tonendosis, ≤ 7% fur Ladungsuberschuss).
Mittels der berechneten Neutronendosis konnte das ’paired chamber system’ auf Neu-tronendosis kalibriert werden. Der Kalibrierfaktor ist tiefenabhangig und fallt bis zu einerTiefe von ca. 8 cm steil ab.
86

A.1 Introduction and summary of this work in German language
Experiment: Neutronen im Wasserphantom
Messung mit dem Dreikammersystem zeigten, dass die Neutronendosis zu klein ist umdirekt nachgewiesen zu werden. Es konnte jedoch ein Neutronensignal mit dem ’pairedchamber system’ gemessen werden.
Es wurden Tiefen- und Querprofile des Neutronensignals mit Simulationen verglichen.Dabei zeigte sich, dass der krel Faktor des ’paired chamber systems’ energieabhangig ist.
Wenn man die Sprunge im Messsignal an den Feldrandern des Photonensignals außeracht lasst und die relative Verschiebung des Neutronensignals auf die Energieabhangigkeitzuruckfuhrt, lasst sich feststellen, das die Neutronenverteilung unabhangig von der Photo-nenfeldgroße ist.
Neutronenkontamination in klinischen Situationen
Mittels der Erkenntnisse uber das Ansprechen des ’paired chamber systems’, die in denbeiden vorangestellten Absatzen erlautert wurden, konnte das ’paired chamber system’ zuUntersuchungen in klinischen Situationen eingesetzt werden.
Die Neutronenkontamination in vier klinischen Bestrahlungsplanen wurde untersucht.Davon waren zwei Plane als 3D konformale Plane und zwei als IMRT-Plane erstellt. Mes-sungen wurden jeweils in einem Hochdosisbereich und einem Risikoorgan durchgefuhrt.
Die Neutronendosiskalibrierung aus dem EasyCube-Experiment wurde verwendet, daalle Plane auf das EasyCube Phantom abgestrahlt wurden.
Es wurde beobachtet, das sich die Neutronendosis fast homogen uber das gesamte Phan-tom verteilte. Dosis im Zielvolumen und im Risikoorgan waren in etwa gleich und stiegenmit erhohter Anzahl der Monitorimpulse. Die Ganzkorper-Aquivalentdosis in den unter-suchten Planen war geringer als 50 mSv.
Eine abschließende Beurteilung, ob 50 mSv Ganzkorper-Aquivalentdosis fur den Patien-ten akzeptabel sind muss durch den behandelnden Strahlentherapeuten getroffen werden.
87

A.2 Set-up and calibration of a triple ionization chambersystem for dosimetry in mixed neutron/photon fields
This publication with the title ”Set-up and calibration of a triple ionization chamber systemfor dosimetry in mixed neutron/photon fields” has been published in the journal ”Physicsin Medicine and Biology” (PMB) volume 52 pages 3715-3725 on 25 May 2007 [21].
It was written during the work on this thesis and describes the ionization chambers andtheir calibration. Most of the publication content can be found in chapter 4 ”Ionizationchambers for neutron detection”.
88

IOP PUBLISHING PHYSICS IN MEDICINE AND BIOLOGY
Phys. Med. Biol. 52 (2007) 3715–3727 doi:10.1088/0031-9155/52/13/004
Set-up and calibration of a triple ionization chambersystem for dosimetry in mixed neutron/photon fields
J Becker1, E Brunckhorst1, A Roca2, F Stecher-Rasmussen3, R Moss2,R Bottger4 and R Schmidt1
1 Department of Radiotherapy and Radio-Oncology, University Medical Center,Hamburg-Eppendorf, University of Hamburg, Martinistr. 52, 20246 Hamburg, Germany2 Joint Research Centre of the European Commission, PO Box 2, 1755ZG Petten,The Netherlands3 NCT Physics, Alkmaar, The Netherlands4 Physikalisch-Technische Bundesanstalt, Bundesallee 100, 38116 Braunschweig, Germany
E-mail: [email protected]
Received 1 March 2007, in final form 13 April 2007Published 25 May 2007Online at stacks.iop.org/PMB/52/3715
AbstractThe aim of this study is to introduce a triple ionization chamber system toseparate dose components of mixed neutron/photon fields. Fast and thermalneutron dose components have a different biological effectiveness than gammadose components. If boron neutron capture is used to enhance the dose incertain areas of a patient, the precise knowledge of the thermal neutron flux isessential. A tissue equivalent and two magnesium ionization chambers havebeen prepared for use in a triple chamber system for this purpose. One of themagnesium chambers is coated with 10B on the inside to enhance its responseto thermal neutrons. All three chambers have been calibrated at a cobalt source,medical linear accelerators and several neutron sources. The chambers havebeen studied in Monte Carlo simulations and the results are compared withmeasurements.
1. Introduction
When neutrons are used for irradiation in radiotherapy, the neutron beam is generallycontaminated with photons. These photons originate either in the neutron source itself orin the 1H(n, γ )2H capture reaction at hydrogen atoms in the patient or phantom. As neutronsand photons have a different biological effectiveness, it is necessary to separate these dosecomponents. The twin chamber system with a tissue equivalent (TE) chamber and a neutroninsensitive magnesium (Mg) chamber has been established for many years (ICRU Report 26(1976), ICRU Report 45 (1989b)).
0031-9155/07/133715+13$30.00 © 2007 IOP Publishing Ltd Printed in the UK 3715
89

3716 J Becker et al
The twin chamber system has been used by Konsunen et al (1999) for dosimetry in anepithermal neutron beam, separating neutron and gamma dose. In boron neutron capturetherapy (BNCT) and boron neutron capture enhanced fast neutron therapy (BNCEFNT), it isalso essential to know the contribution of thermal neutrons, as they create a dose boost in areasenriched with 10B. The 10B(n, α)7Li reaction produces secondary particles with a range of thedimensions of a human cell. The 14N(n, p)14C reaction of thermal neutrons produces protonsof about 580 keV energy which also deposit their energy locally. Neutrons of higher energiesinteract mainly through the proton recoil process.
To study the thermal neutron flux in fast neutron beams, a special ionization chamberhas been introduced by Ludemann et al (1995). This chamber is a commercially availablemagnesium chamber, which is made selectively sensitive to thermal neutrons by a coatingof enriched 10B on the inside of the chamber cavity. This chamber has already been usedto determine the thermal neutron flux around a 252Cf source (Schmidt et al 1999) and, incombination with a magnesium chamber and a Geiger-Mueller-counter, to measure dosecomponents of a 252Cf source (Wanwilairat et al 2000). Concerning thermal neutrons it is aparticle detector, not an ionization chamber. It will be calibrated to thermal neutron flux inthis paper.
A chamber utilizing the same principle as the one used by Ludemann et al (1995) has beenintroduced by Burmeister et al (1999). They used a paired Mg and Mg(B) ionization chambersystem at a fast neutron beam and a 252Cf source and studied the possible dose enhancementeffect due to the enrichment of 10B in tissue.
Separation of dose components can be done by a triple chamber technique with a tissueequivalent chamber, unshielded and shielded GM-counters, as done by Schmidt and Heß(1982) in a fast neutron beam. Rogus et al (1994) have used a tissue equivalent and a carbongraphite chamber as well as gold foils at the MITR-II research reactor. A twin chambersystem with a magnesium chamber instead of the graphite chamber and TLDs have been usedby Raaijmakers et al (1995) at the BNCT facility in Petten, The Netherlands. Munck et al(2003) have used a system similar to that of Rogus et al (1994), but used a magnesium chamberinstead of the graphite chamber at Studsvik, Sweden.
This paper will introduce a triple chamber system to separate dose components without theneed of additional measurements by TLDs or foils and describes the measurements necessaryto calibrate the system.
2. Materials and methods
2.1. Ionization chambers
Three ionization chambers of type IC 30 manufactured by Wellhofer Dosimetry(Schwarzenbruck, Germany) have been used. All three chambers have an activevolume of 0.3 cm3, are watertight and were flushed by 1 L h−1 from an external gassupply.
(1) A tissue equivalent chamber with A150 plastic as wall material and a wall thickness of2.5 mm. The chamber was flushed by TE gas consisting of 64.4 vol% methane 32.4 vol%carbon dioxide and 3.2 vol% nitrogen (ICRU Report 44 (1989a)). This neutron sensitivechamber will be denoted as the TE/TE chamber.
(2) A magnesium chamber with magnesium as wall material and a wall thickness of 2 mm.The chamber was flushed by high purity argon gas. This neutron insensitive chamber willbe denoted as the Mg/Ar chamber.
90

Triple chamber system for mixed neutron/photon fields 3717
(3) A magnesium chamber similar in design to the Mg/Ar chamber, but different by a3 µm thin coating of enriched (92%) 10B. This chamber has already been thoroughlyinvestigated by Ludemann et al (1995) and will be denoted as the MgB/Ar chamber.
To do measurements in an environment with reduced thermal neutron flux a lithium cap(6LiF embedded in epoxy resin) of cylindrical design with a minimum wall thickness of3.5 mm and an area density of 328 mg cm−2 6LiF was available for both the Mg/Ar andMgB/Ar chamber. A second lithium cap fitting to the TE/TE chamber with a wall thicknessof 5 mm was available at the Petten LFR reactor.
All measurements have been carried out with a Farmer NE 2570 electrometer operatedat a negative voltage of 250 V. A Farmer chamber of type FC65-G with an active volumeof 0.6 cm3 has been used as reference chamber where necessary. The Farmer chamber wascalibrated in terms of absorbed dose to water for cobalt radiation by the manufacturer.
2.2. Reference beams, phantoms and set up
For calibration a 60Co source was available at the Petten nuclear facility. All measurementsthere were done free-in-air with a distance between source and central axis of chamber of50 cm. The chamber axis was perpendicular to the beam and chamber axis.
X-ray fields provided by two clinical accelerators at the University Medical CenterHamburg-Eppendorf, a Siemens Mevatron MDX-2 offering 4 MV and 6 MV fields and aSiemens Primus offering 6 MV and 15 MV fields, were also used for calibration. Theirradiation of each chamber was done with 100 MU of a 10 cm × 10 cm field at 3 cm depthof a solid water (RW3) phantom consisting of a stack of 30 cm × 30 cm × 1 cm RW3 slabs.The chambers were mounted at the centre of a correspondingly drilled 30 cm × 30 cm ×2 cm PMMA slab. The overall height of the phantom was 13 cm. Again the Farmer chamberhas been used as reference.
For our investigation of the neutron sensitivity, neutrons from three different sources wereused.
• A neutron reference field from the Physikalisch-Technische Bundesanstalt (PTB) at thePOLDI beamline at the GKSS facility at Geesthacht, Germany. This facility has beendescribed by Bottger et al (2004).
• A mixed neutron/photon field with high thermal neutron flux at the low flux reactor(LFR) at the Petten nuclear facility, The Netherlands. This facility has been described byVroegindeweij et al (1996).
• An epithermal neutron beam (HB11) used for BNCT treatments at the high flux reactor(HFR) at the Petten nuclear facility, The Netherlands.
The beam from the PTB was described in detail by Bottger et al (2004). A referenceposition for measurements is provided. The spectrum can be described by a Maxwelliandistribution with a kT of 22.25 meV (see figure 1), the cadmium ratio is RCd = 3.3 × 10⁴ ±20%, no neutrons with energies higher than 1 MeV could be detected with a highly enriched238U fission chamber and a Cd-plate in beam and a gamma dose rate of about 2 µSv h−1 wasmeasured at the reference position (Bottger et al 2004). The average flux is 8.5 × 104 cm−2
s−1± 5%. The kerma factor for this spectrum is 3.213 × 10⁻¹³ Gy cm2. The measurementswere done free-in-air at the reference position with the beam axis perpendicular to the chamberaxis.
The spectrum at the LFR can be described by a Maxwellian spectrum with a kT of 27 meV.The kerma factor for this thermal spectrum is 2.916 × 10⁻¹³ Gy cm2. The average flux hasbeen determined by foil measurements to be 6.925 × 108 cm−2 s−1± 2.5%. There were only
91

3718 J Becker et al
Figure 1. PTB spectrum at the POLDI beamline. The solid line shows measured spectrum, thedotted line shows a Maxwellian distribution with a kT of 22.25 meV (Bottger et al 2004).
0.5% neutrons faster than thermal. These neutrons were assumed to be epithermal followinga 1/E distribution (Paardekooper 2006). There was a significant contamination of photonswith a dose rate of about 1 Gy h−1 in the beam (Vroegindeweij et al 1996, Raaijmakers et al1996). The measurements were set up on a trolley that was inserted into the reactor by theoperating crew. The chambers were positioned free-in-air on this trolley with the chamberaxis perpendicular to the beam axis.
The HB11 beam of the HFR has been well described in the literature (Konijnenberg et al1995, Wheeler et al 1999). The kerma weighted mean energy of the beam is 10.4 keV. Insideour water phantom we assumed a Maxwellian distribution of thermal neutrons with a kT of45 meV, due to the incomplete thermalization of the neutron beam at the point of measurement.The kerma factor of Maxwellian neutrons with a kT of 45 meV is 2.283 × 10⁻¹³ Gy cm2.The average flux of thermal neutrons was determined by foil measurements to be 8.401 ×108 cm−2 s−1± 2.5%, about 4% of the neutrons were faster than thermal. There is a significantcontamination of photons in the beam; additionally a 2.2 MeV photon field is produced bycapture reactions at the hydrogen atoms of our phantom.
The measurements were done in a computer-controlled WP 700 water phantom (WellhoferDosimetry, Schwarzenbruck, Germany) (64.5 cm × 67.5 cm × 56 cm). The water phantomwas positioned at 30 cm distance from the beam exit. As the beam axis of the HB11 beampropagates horizontally the 1.5 cm lucite wall of the water phantom had to be passed by thebeam. Calibrations and foil measurements where done at 3 cm depth along the beam axis (i.e.1.5 cm lucite and 1.5 cm water), so the distance from the beam exit was 33 cm. No correctionsdue to lucite wall have been made.
Foil measurements at LFR and HFR were performed with a set of three foils consistingof AuAl- (1wt% Au), Cu- and MnNi-foils (88wt% Mn) encapsulated in rice paper. The foilswere analyzed by A Paardekooper from NRG Fermi-Lab at the Petten nuclear facility.
92

Triple chamber system for mixed neutron/photon fields 3719
Figure 2. Sketch of the modeled geometry. Dark gray: wall material (magnesium or A150).Medium gray: insulator. Light gray: TE- or argon-gas. Not visible 3 µm enriched 10B, which isonly present in the MgB/Ar chamber.
2.3. Monte Carlo simulations
Monte Carlo simulations have been used by several authors to determine chamber properties.Munck et al (2002) calculated photon quality correction factors and Raaijmakers et al (1996)studied neutron sensitivity. In this paper, we did two studies. At first the sensitivity ofthe MgB/Ar to Maxwellian distributed thermal neutrons in dependence of kT was studied.Second the response of all three chambers to monoenergetic neutrons was studied by dividingabsorbed dose to the cavity gas by absorbed dose to the muscle tissue being replaced by thechamber. In the case of the MgB/Ar chamber, the result of the division was normalized to25 500.
We used a slightly simplified geometry (figure 2). Magnesium and argon were assumedto be of 100% purity, A150, muscle tissue and TE-gas composition have been chosen inaccordance with the elemental compositions of materials presented in ICRU Report 44 (1989a).The MgB/Ar chamber is identical to the Mg/Ar chamber but coated with 3 µm of enrichedboron (8% 11B, 92% 10B) on the inside of the chamber wall. The light ion recoil option ofMCNPX was activated and all possible secondary particles were transported.
MCNPX has the following important limitations.
• Protons from the 14N(n, p)14C reaction are not created for transport by all available cross-section libraries (ENDF/B-VI.6 and ENDF/B-VI.8 evaluation, other cross-sections didnot support charged particle production). Therefore, the proton (Ep ≈ 0.5 MeV) isabsorbed locally, which is only correct if charged particle equilibrium was achieved. Inthe case of the TE/TE chamber, this prohibits the transport of protons from this reaction,probably underestimating its sensitivity to thermal neutrons.
• Ionic dose (charge collected by the electrometer) cannot be tallied. Ionic dose is absorbeddose multiplied by the average energy required to produce an ion pair (W/e0). Therefore,dose absorbed to the cavity gas is tallied. For fast neutrons W/e0 is mostly constant, butincreases with decreasing neutron energy (ICRU Report 31 (1979)). This may lead to anunderestimation of the sensitivity of the Mg/Ar and the TE/TE chamber for low-energyneutrons.
• Lithium particles from the 10B(n, α)7Li reaction are neither produced nor transported.Lithium particles account for roughly one third, alpha particles for two thirds of theionization caused by this reaction. To account for the boron capture reaction the crosssection library of 10B had to be extended to produce secondary alpha particles of 1.47 MeVenergy at each (n, α) event. Total dose is Dtotal = Dn + De + Dα + DLi. De includes dosefrom secondary electrons of the photon radiation. DLi cannot be calculated by MCNPXbut is about half of Dα , so total dose was calculated as Dtotal = Dn + De + 1.5Dα .
93

3720 J Becker et al
2.4. Triple chamber system formalism
To separate dose components in a mixed field, the response of each chamber has to be separatedinto gamma, fast neutron and thermal neutron contribution. In this case, fast neutrons andfast neutron dose are defined as neutrons with non-thermal energies and dose deposited bythem. For the triple chamber system, the following equations, derived from the twin chambersystem, have been used:
RTE = hT E · Dγ + kTE · Dn + iTE · Dt (1)
RMg = hMg · Dγ + kMg · Dn + iMg · Dt (2)
RMgB = hMgB · Dγ + kMgB · Dn + iMgB · Dt, (3)
where R is the chamber reading corrected for temperature and pressure and multiplied by ND,W .ND,W is the sensitivity of the chamber to the 60Co radiation used for calibration. Dγ ,Dn,Dt
are the dose components from photons, fast neutrons and thermal neutrons, respectively. Doseis given as absorbed dose to muscle tissue. h, k, i are the relative sensitivities compared to60Co radiation for photons, fast neutrons and thermal neutrons for the individual chambers.
h values are correlated with the correction for beam quality kQ known from photondosimetry. The kQ formalism is described by the IAEA Technical Reports Series no. 398(2000). If it is assumed that absorbed dose to muscle tissue and absorbed dose to water areequivalent for photons the following equation will be valid:
h = 1
kQ
. (4)
The value of i can be derived in the following two ways: starting from equation (3) in anenvironment where gamma and fast neutron dose are negligible compared to thermal neutrondose and charged particle equilibrium is given if the chamber is not present a direct approachis shown in equation (7). M is the chamber reading corrected for temperature and pressure,ND,W is the sensitivity of the chamber to the 60Co radiation used for calibration, R(E) is thecalibration factor relating the chamber signal to fluence, �t is the thermal neutron flux andK(E) is the fluence-to-kerma conversion factor.
M · ND,W = h · Dγ + k · Dn + i · Dt (5)
inserting Dγ = Dn = 0 and Dt = K(E) · �t
M · ND,W = i · K(E) · �t (6)
with M = R(E) · �t
i = R(E)
K(E)· ND,W . (7)
The indirect approach can be used in situations where gamma and fast neutron dose arenon-negligible compared to the thermal neutron dose. It utilizes a lithium cap, where it isassumed that the disturbance by the lithium cap is negligible for photons and fast neutrons(equation (10)). It is similar to the approach Raaijmaker et al (1996) used. They assumed thatthe thermal neutron flux is reduced to zero by the lithium cap. In contrast, we assumed that thethermal neutron flux is only reduced by the cap. The reduction ratio of thermal neutrons canbe estimated by determining the reduction of the response of the MgB/Ar chamber (results intable 4). The Mg/B chamber is, even with a lithium cap, only sensitive to thermal neutrons.
R = h · Dγ + k · Dn + i · Dt (8)
94

Triple chamber system for mixed neutron/photon fields 3721
Table 1. ND,W values determined by 60Co calibration. Values are given in Gy nC−1.
TE/TE chamber Mg/Ar chamber MgB/Ar chamber
0.088 94 ± 0.002 0.068 58 ± 0.000 05 0.063 63 ± 0.0003
Table 2. kQ values derived from comparison with a Farmer chamber at a medical linear accelerator.Values marked with an asterisk (*) could not be determined as there is a small neutron contaminationin high-energy photon fields.
Beam quality TE/TE chamber Mg/Ar chamber MgB/Ar chamber
4 MV, MDX-2 0.992 ± 0.005 0.955 ± 0.005 1.023 ± 0.0056 MV, MDX-2 0.983 ± 0.005 0.947 ± 0.005 1.010 ± 0.0056 MV, Primus 0.977 ± 0.005 0.938 ± 0.005 1.004 ± 0.00515 MV, Primus 0.946 ± 0.005 0.901 ± 0.005 *
Table 3. Summary of h values determined. Values marked with an asterisk are estimates.
Beam quality TE/TE chamber Mg/Ar chamber MgB/Ar chamber
HB11 1.000* 1.079* 1.008*4 MV, MDX-2 1.008 ± 0.005 1.047 ± 0.005 0.977 ± 0.0056 MV, MDX-2 1.017 ± 0.005 1.055 ± 0.005 0.990 ± 0.0056 MV, Primus 1.024 ± 0.005 1.066 ± 0.005 0.996 ± 0.00515 MV, Primus 1.057 ± 0.005 1.110 ± 0.005 1.037*
RLi = h · Dγ + k · Dn + i · Dt
reduction ratio(9)
i = R − RLi
(1 − 1/reduction ratio) · Dt
. (10)
3. Results
3.1. ND,W values
All three chambers have been calibrated in a 60Co beam against a Farmer chamber. Althoughmeasurements were done free-in-air, the Farmer chamber yielded absorbed dose to water.Dose values of the Farmer chamber agreed within 1% with absorbed dose to water valuesprovided by the source manufacturer. Equation (11) was used for ND,W determination, withMchamber being the chamber reading corrected for temperature and pressure. Values for ND,W
are shown in table 1.
ND,W,chamber = DW,farmer
Mchamber. (11)
3.2. Determination of h values
All values of kQ are determined at medical accelerators and listed in table 2. The correspondingh values derived by equation (4) are summarized in table 3. The 15 MV mode of the SiemensPrimus accelerator is contaminated by neutrons produced in photonuclear reactions prohibiting
95

3722 J Becker et al
Table 4. Reduction ratios of the lithium cap determined with the MgB/Ar chamber.
Location kT (meV) Measured reduction ratio
PTB 22.25 1445.9LFR 27 179.5HB11 45 42.0
a kQ determination for the MgB/Ar-chamber at this energy. The contamination is small enoughto be neglected in the case of the TE/TE and the Mg/Ar chamber.
Assuming that after passing through 35 cm of water the neutron contamination in theHB11 beam becomes negligible, the ratio of hMg/hTE can be determined to be 1.079 ± 0.005.As neither hMg nor hTE could be determined separately in the HB11 beam unity was assumedfor hTE, as other authors have done (Raaijmakers 1995). Wanwilairat et al (2000) also useda hTE value of unity while studying a californium source. Munck af Rosenschold (2002)determined photon quality correction factors for their TE/TE chambers in the order of unityat the BNCT facility at Studvik.
The h value of the MgB/Ar chamber for the 15 MV mode of the Siemens Primusaccelerator can be estimated by equation (12).
hMgB(15 MV) = hMg(15 MV)hMgB(6 MV)
hMg(6 MV). (12)
3.3. Determination of reduction ratios due to the lithium cap
The reduction ratios used by equation (10) have been determined with the MgB/Ar chamberby dividing the charge collected without cap by the charge collected with cap. The reductionratios can be found in table 4.
3.4. Determination of neutron sensitivities
k values for the triple chamber system have been studied by Monte Carlo simulation. Thecalculated values are compared with the neutron sensitivities determined by Waterman et al(1979) in figure 3. They studied the energy dependence for neutron energies from 1 MeV to50 MeV, but only values from 1 MeV to 10 MeV are shown in the figure. The i values are addedfor comparison at their kT value, although a Maxwellian distribution is not monoenergetic innature. For epithermal beams values for lower energies are usually needed. Raaijmakers et al(1996) have studied the neutron sensitivity for their TE/TE chamber extensively. Theydetermined a value of 0.87 ± 0.03 for the HB11 beam (kerma weighted mean energy10.4 keV). All values are summarized in table 5.
3.5. Determination of i values
The response of the MgB/Ar chamber signal against the most probable energy of the thermalneutrons is shown in figure 4. There is a good agreement between calculated and the measuredvalues. The response of the MgB/Ar chamber decreases with neutron energy. Thus thechamber is calibrated in terms of charge collected by the electrometer per thermal neutronfluence (at the point of measurement without chamber presence). The result of this calibrationis that when considering charged particle equilibrium the chamber’s presence must be ignored.By using equation (7) the i values of the MgB/Ar chamber can be determined directly. As
96

Triple chamber system for mixed neutron/photon fields 3723
Figure 3. Energy dependence of k values. kTE is shown by the solid line, kMgB by the dotted line,kMg by the dashed line. Comparison of simulated values (lines) with measured values (markers).
Table 5. k values reproduced from Waterman et al (1979) and Raaijmakers et al (1996). Identicalvalues for the Mg/Ar and MgB/Ar chambers have been chosen, as the contribution of 10B isinsignificant at high energies.
Neutron energy TE/TE chamber Mg/Ar chamber MgB/Ar chamber
10 keV (Raaijmakers) 0.87 ± 0.03 – –1 MeV 0.960 ± 0.096 0.021 ± 0.002 0.021 ± 0.0022 MeV 0.960 ± 0.096 0.030 ± 0.003 0.030 ± 0.0033 MeV 0.960 ± 0.096 0.035 ± 0.004 0.035 ± 0.0044 MeV 0.960 ± 0.096 0.040 ± 0.004 0.040 ± 0.0045 MeV 0.959 ± 0.096 0.046 ± 0.005 0.046 ± 0.0056 MeV 0.958 ± 0.096 0.054 ± 0.005 0.054 ± 0.0057 MeV 0.957 ± 0.096 0.060 ± 0.006 0.060 ± 0.0068 MeV 0.956 ± 0.096 0.075 ± 0.008 0.075 ± 0.0089 MeV 0.954 ± 0.095 0.088 ± 0.009 0.088 ± 0.009
10 MeV 0.951 ± 0.095 0.103 ± 0.010 0.103 ± 0.010
shown in figure 3 the i value is nearly constant at low neutron energies. This is due to the energydependence of the neutron kerma factor, which tends to compensate the energy dependenceof the response of the MgB/Ar chamber.
Raaijmakers et al (1996) calibrated their TE/TE and Mg/Ar chambers to thermalneutron flux relative to cobalt radiation. The relation between k′ and i values is shown inequation (13):
k′ = K(E) · i (13)
where K(E) is the kerma factor (2.916 × 10⁻¹³ Gy cm2) for the spectrum used.
97

3724 J Becker et al
Figure 4. Response of the MgB/Ar chamber to Maxwellian distributed thermal neutrons.
Table 6. i values were determined directly for the MgB/Ar chamber, indirectly for the otherchambers. Values marked with an asterisk have been multiplied by 0.835. Values from Raaijmakerset al (1996) were determined for a different type of chamber.
TE/TE chamber Mg/Ar chamber MgB/Ar chamber
PTB – – 23 150 ± 2000LFR 2.47 ± 0.05 1.32 ± 0.3 23 350 ± 2000HB11* – 2.88 ± 0.5* 25 950 ± 2000*Mean 2.47 ± 0.05 2.10 ± 0.5 24 150 ± 2000Raaijmakers (1996) 1.490 ± 2% 1.259 − 0.477 ± 2% –
The i values of TE/TE and Mg/Ar chamber had to be determined by the indirect methodshown in equation (10), the reduction ratios from table 4 have been used.
The MgB/Ar chamber is sensitive to the orientation of the chamber in relation to thedirection of the neutrons. Ludemann et al (1995) studied this effect and determined a value of0.835 for the compensation of isotropic irradiation. Therefore, the values from HB11 had tobe multiplied by 0.835 to compensate the isotropic distribution of thermal neutrons inside thewater phantom.
4. Comparison of values computed by the triple chamber system with known doserate values for the LFR
Dose rate values for the LFR have been calculated and verified with foil measurements byVroegindeweij et al (1996). However these values change to a certain amount with the fuel
98

Triple chamber system for mixed neutron/photon fields 3725
Table 7. Dose rate of individual components at the LFR. Gamma and fast neutron dose wereprovided by the operating company of the LFR. Thermal neutron dose rate was calculated bymultiplying flux and kerma factor.
Type of dose Measured (Gy h−1) Given by LFR (Gy h−1)
Gamma dose 0.977 ± 10% About 1.0Fast neutron dose 0.184 ± 20% Less than 0.2Thermal neutron dose 0.714 ± 5% 0.727
cycle of the reactor. The thermal neutron dose rate was determined by multiplying the flux,determined with foil measurements, by the kerma factor. This allowed a cross check of thetriple chamber system.
For dose separation with the triple chamber system equations (1)–(3) have to be solved.For this purpose h, k and i values for each chamber have to be known. h values from HB11(table 3) have been used for the photon sensitivity, as is the only neutron source in table 3.kMg and kMgB values for 1 MeV from Waterman et al (1979), kTE from Raaijmakers et al(1996) have been chosen, as they are the values with the lowest neutron energy available. Itis expected that non-thermal neutrons at the LFR will have a low energy. Finally the i valuesdetermined directly at the LFR (table 6) were used.
Inserting all values into the equations (1)–(3) and solving the system yields the dose ratevalues presented in table 7. Different uncertainties for the calculated values are assumed, as theresults are influenced by each other. Fast neutron dose is most sensitive to small uncertaintiesin calibration values, thermal neutron dose is least sensitive. All calculated dose rate valuesare in good agreement with the provided values.
5. Discussion
The ND,W values of the Mg/Ar and MgB/Ar chambers have shown to be surprisingly different,as both chambers are of identical design. Earlier measurements had not shown such adifference. But taking the h values into account the difference between both chambers isonly 0.7%, which is easily explained by small variations of the individual chambers.
The i values could only be determined with high relative uncertainties. The kerma factorsused in the calibration of the MgB/Ar chamber were not available for all neutron energies andhad to be interpolated from values published in ICRU Report 44 (1989a). The values of i forthe TE/TE and Mg/Ar chambers can only be seen as rough estimates, due to the assumptionof an undisturbed photon field when the lithium cap is present. 60Co radiation was attenuatedby 2.7% when the lithium cap was present.
Calculated i values for the TE/TE and Mg/Ar chambers are lower than the measuredvalues. This may be due to to the limitations of the Monte Carlo code which lead to anunderestimation of the sensitivity to thermal neutrons. The assumption of a constant averageenergy required to produce an ion pair affects both chambers, as energy deposited in the gas istallied, but ionization in the gas is measured. Raaijmakers et al (1996) showed the effects onthe k value of a non-constant average energy required to produce an ion pair of their TE/TEchamber. The local deposition of protons from the 14N(n, p) reaction results in an additionalunderestimation of the TE/TE chamber’s response to thermal neutrons.
Comparison of the calculated k values with the values published by Waterman et al (1979)showed good agreement for the TE/TE chamber. Concerning the magnesium chambers valuesof the same order of magnitude and similar energy dependence (increasing sensitivity with
99

3726 J Becker et al
increasing energy) were calculated. For non-hydrogenous ionization chambers small detailslike precise shape of the anode or position of insulators and air cavities or contamination withtrace elements are important factors for the neutron sensitivity. Considering that Watermanet al (1979) used a different type of chamber and further considering the rather simple geometryused for MCNPX calculation the results for the Mg/Ar and MgB/Ar chambers are acceptable.
Other authors showed that small impurities in the gas may have a significant influenceon the measurement (Jesse effect, Zoetelief et al (1986)). We measured at multiple locationswith different gas provisions at each of them and the Jesse effect was not observed during ourmeasurements, so it has been stable or negligible.
6. Conclusions
It has been shown that the triple chamber system can be used for the separation of dosecomponents in mixed photon/neutron fields. Especially the MgB/Ar chamber has provento be selectively sensitive to thermal neutrons, and is, because of the 10B(n, α)7Li reaction,extremely useful for BNCT and BNCEFNT dosimetry. All three chambers have been modeledby MCNPX reproducing the values of Waterman et al (1979) well (TE/TE chamber) or in theright order of magnitude (magnesium chambers). An extensive study of the HB11 beam in awater phantom with the triple chamber system is in preparation.
Acknowledgments
The authors like to thank the Petten nuclear facility, especially the BNCT group for allowingus to measure at the HB11 beam, the crew of the LFR for operating the reactor and assisting inmeasurements, A Paardekooper from NRG Fermi-Lab for analyzing the foil measurements,the Physikalisch-Technische Bundesanstalt for providing and Stefan Lob for operating thereference field at the GKSS. This study was supported by the German Research Foundation(DFG project SCHM1070/26-1).
References
Bottger R, Friedrich H and Janßen H 2004 The PTB thermal neutron reference field at GeNF Wiss. VeroffentlichungenPTBbericht 47 1–40
Burmeister J, Kota C, Yudelev M and Maughan R L 1999 Paired Mg and Mg(B) ionization chambers for themeasurement of boron neutron capture dose in neutron beams Med. Phys. 26 2482–7
International Atomic Energy Agency (IAEA) 2000 Absorbed dose determination in external beam radiotherapy: aninternational code of practice for dosimetry based on standards of absorbed dose to water Technical Reports Ser.398
International Commission on Radiation Measurements and Units (ICRU) 1976 Neutron dosimetry for biology andmedicine Report 26
International Commission on Radiation Measurements and Units (ICRU) 1979 Average energy required to producean ion pair Report 31
International Commission on Radiation Measurements and Units (ICRU) 1989a Tissue substitutes in radiationdosimetry and measurements Report 44
International Commission on Radiation Measurements and Units (ICRU) 1989b Clinical neutron dosimetry: Part 1.Determination of absorbed dose in a patient treated by external beams of fast neutrons Report 45
Konijnenberg M W, Dewitt L G H, Mijnheer B J, Raaijmakers C P J and Watkins P R D 1995 Dose homogeneity inboron neutron capture therapy using an epithermal neutron beam Radiat. Res. 142 327–39
Kosunen A, Kortesnimi M, Yla-Mella H, Seppala T, Lampinen J, Seren T, Auterinen I, Jarvinen H andSavolainen S 1999 Twin ionization chambers for dose determinations in phantom in an epithermal neutronbeam Radiat. Prot. Dosim. 81 187–94
100
Triple chamber system for mixed neutron/photon fields 3727
Ludemann L, Matzen T, Matzke M, Schmidt R and Scobel W 1995 Determination of the thermal neutron flux in afast neutron beam by use of a boron-coated ionization chamber Med. Phys. 22 1743–7
Munck af Rosenschold P M, Ceberg C P, Giusti V and Andreo P 2002 Photon quality correction factors for ionizationchambers in an epithermal neutron beam Phys. Med. Biol. 47 2397–409
Munck af Rosenschold P M, Giusti V, Ceberg C P, Capala J, Skold K and Person B R R 2003 Reference dosimetryat the neutron capture facility at Studsvik Med. Phys. 30 1569–79
Paardekooper A 2006 Neutron fluence rate measurements for BNCT research in the LFR and HFR (personalcommunication)
Raaijmakers C P J and Konijnenberg M W 1995 Determination of dose components in phantoms irradiated with anepithermal neutron beam for boron neutron capture therapy Med. Phys. 22 321–9
Raaijmakers C P J, Watkins P R D, Nottelman E L, Verhagen H W, Jansen J T M, Zoetelief J and Mijnheer B J 1996The neutron sensitivities of dosimeters applied to boron neutron capture therapy Med. Phys. 23 1581–9
Rogus R D, Harling O K and Yanch J C 1994 Mixed field dosimetry of epithermal neutron beams for boron neutroncapture therapy at the MITR-II research reactor Med. Phys. 21 1611–25
Schmidt R and Heß A 1982 Triple chamber technique for thermal neutron dose measurements in fast neutron beamsStrahlentherapie 158 612–5
Schmidt R, Maughan R L, Yudelev M, Kota C and Wanwilairat S 1999 Experimental determination of the thermalneutron flux around two different types of high intensity 252Cf sources Med. Phys. 26 83–6
Vroegindeweij C, Stecher-Rasmussen F and Huiskamp R 1996 A thermal neutron facility for radiobiological studiesAnn. Nucl. Energy 23 1229–38
Wanwilairat S, Schmidt R, Vilaithong T, Lorvidhaya T and Hoffman W 2000 Measurement of the dose components offast and thermal neutrons and photons from 0.1 mg 252Cf source in water for brachytherapy treatment planningMed. Phys. 27 2357–62
Waterman F M, Kuchnir F T, Skaggs L S, Kouzes R T and Moore W H 1979 Energy dependence of the neutronsensitivity of C–CO2, Mg–Ar and TE–TE ionization chambers Phys. Med. Biol. 24 721–33
Wheeler F J, Nigg D W, Capala J, Watkins P R D, Vroegindeweij C, Auterinen I, Seppala T and Bleuel D 1999Boron neutron capture therapy BNCT: implications of neutron beam and boron compound characteristics Med.Phys. 26 1237–44
Zoetelief J, Schlegel-Bickmann D, Schraube H and Dietze G 1986 Characteristics of Mg/Ar ionization chambersused as gamma-ray dosemeters in mixed neutron–photon fields Phys. Med. Biol. 31 1339–51
101

A.3 Photoneutron production of a Siemens Primus linearaccelerator studied by Monte Carlo methods and apaired magnesium and boron coated magnesiumionization chamber system
This publication with the title ”Photoneutron production of a Siemens Primus linear ac-celerator studied by Monte Carlo methods and a paired magnesium and boron coatedmagnesium ionization chamber system” has been submitted to PMB on 05 June 2007.
It was written during the work on this thesis and describes the use of the paired chambersystem at the Primus linac. Most of the publication content can be found in chapter 5”Experiments”.
102

Photoneutron production of a Siemens Primus
linear accelerator studied by Monte Carlo methods
and a paired magnesium and boron coated
magnesium ionization chamber system
J Becker, E Brunckhorst and R Schmidt
Department of Radiotherapy and Radio-Oncology, University Medical CenterHamburg-Eppendorf, University of Hamburg, Martinistr. 52, 20246 Hamburg,Germany
E-mail: [email protected]
Abstract. When radiotherapy with photon energies greater than 10 MV is doneneutrons contaminate the photon beam. In this paper the neutron contamination ofthe 15 MV photon mode of the Siemens Primus accelerator was studied. The MonteCarlo code MCNPX was used for the description of the treatment head and treatmentroom. The Monte Carlo results were verified by studying the photon depth dose curveand beam profiles in a water phantom. After these verifications the locations of neutronproduction were studied and the neutron source spectrum and strength were calculated.The neutron response of the paired Mg/Ar and MgB/Ar ionization chamber systemwas calculated and experimentally verified for two experimental set-ups. The pairedchamber system allowed to measure neutron inside the field borders and allowed rapidand point wise measurement in contrast to other methods of neutron detection.
Keywords: photoneutrons, neutron production in high energy photon fields, MCNPX,
Siemens Primus
103

Photoneutron production of a Siemens Primus linear accelerator 2
1. Introduction
High energy photon beams of modern medical linear accelerators produce photons with
energies higher than the (γ,n) threshold energy in several accelerator components. Thus
neutrons and other secondary particles contaminate the photon beam.
Several authors studied the neutron contamination of Siemens Primus machines
either through direct measurements (Followill et al 2003, Lin et al 2001) or Monte
Carlo simulations (Pena et al 2005, Chibani and Ma 2003, Ongaro et al 2000). The
Siemens Primus machine available at our institution has undergone a tungsten target
replacement. The original target used a thin gold foil for bremsstrahlung production.
The tungsten target uses a small disk of tungsten that is embedded in a thermal
conductor made of copper. As both tungsten and copper can produce photoneutrons
and are located directly in the target, this replacement might have an influence on the
photoneutron production.
Direct measurements of the neutron contamination in high energy photon beams
have been done with nuclear physics equipment like Bonner spheres, bubble chambers or
foil activation techniques requiring knowledge of nuclear physics. Tosi et al (1991) used
activation moderators with activation foils inside the treatment room and active 3He
detectors outside of the treatment room finding that active detectors cannot be used
inside the therapy room due to the pulsed nature of the photon radiation and induced
neutron radiation. Bubble chambers were used and validated with track etch detectors
by d’Errico et al (1998) at a CGR Saturne 20 MeV linac. Bubble chambers, moderated
BF3 proportional counters and P2O5 powder were used by Lin et al (2001) to measure
neutron source strength, mean photoneutron energy, neutron flux and dose equivalent
for a Siemens Primus machine. Finally a Bonner sphere moderation system has been
used with TLD detectors at a Varian Clinac 2100/2300C by Howell et al (2005).
This paper will introduce a paired ionization chamber system for neutron
measurements which is handled like other ionization chambers and therefore easy to
use. The advantages of the paired chamber system are: its small size, allowing nearly
point wise measurement, its sensitivity, allowing to measure inside the clinically use
photon field and its rapid evaluation in contrast to TLDs or foil activation techniques.
Additionally a Monte Carlo approach to the calculation of the neutron source
characteristics (strength and spectrum) of the Siemens Primus machine using the Monte
Carlo Code MCNPX version 2.5.0 is introduced. This Monte Carlo calculation will be
checked against existing photon depth dose curves and beam profiles in a water phantom.
Finally the response of the paired chamber system will be calculated and verified
for two experimental set-ups, showing the functionality of the paired chamber system.
104

Photoneutron production of a Siemens Primus linear accelerator 3
2. Materials and Methods
2.1. Monte Carlo simulations
2.1.1. Libraries The most recently available cross-sections were used wherever possible
(ENDF/B.VI-8 for photons, ENDF/B.VI for most neutron cross-sections). The
photonuclear evaluations used are a subset of the IAEA Coordinated Research Project
(CRP) on photonuclear data. These evaluations were provided by the Los Alamos
National Laboratory (LANL), the Korean Atomic Energy Institute (KAERI) and the
Chinese Nuclear Data Center (CNDC). When cross-sections were not provided by this
library, cross-sections from the Nuclear Physics Group (T-16) at Los Alamos National
Laboratory were used. Thermal scattering cross-section for water and graphite from
ENDF/B.VI-3 were used where appropriate.
2.1.2. Geometry The basic geometry of the Siemens Primus accelerator is assumed
to be known and not repeated here as it has been studied with Monte Carlo methods
by various authors (Lin et al 2001, Lin et al 2002, Chibani and Ma 2003, Pena et al
2004, Pena et al 2005). Geometry data provided by Alfredo Siochi (Siemens Medical
Systems) specifying the gold target was used in most of these simulations. Pena et
al (2005) included additional elements, not necessary for photon simulations and the
treatment room, when studying photoneutron production.
As shown by Pena et al (2005) these elements and the room geometry had a
significant influence on the simulation outcome.
The head geometry is shown in figure 1 as a MCNPX plot with cell numbers.
Following elements of the treatment head were included (numbers in parentheses are
cell numbers shown in figure 1):
• tungsten target instead of gold target (6)
• electron absorber (10)
• primary collimator (9)
• flattening filter (11)
• jaws (130-131)
• MLC (not shown)
• mirror (shown but no number)
• bending magnet (200-211)
• target slide (22)
• 6 MV primary collimator (23)
• supportive steel structure (block) housing both collimators (24)
• steel plate where most of the accelerator components are mounted on (25)
• steel skeleton of the gantry (280)
• electronics filling the inside of the treatment head (26)105

Photoneutron production of a Siemens Primus linear accelerator 4
Figure 1. MCNPX plot of the treatment head geometry. Dark grey colored cellscontain tungsten, light grey material colored contain steel. The MLC is included inthe simulation but not shown in this figure. A cell description is given in the text.
• outer steel and lead shielding of the treatment head (231)
• outer plastic cover of the gantry (282)
• treatment room (1000)
• treatment room walls (1006)
The patient couch, which is not visible in figure 1, was also included.
Parts of the geometry not modeled were dose chambers, bending magnet exit
window and 15 MV compensator.
106

Photoneutron production of a Siemens Primus linear accelerator 5
Figure 2. Energy distribution of primary electrons impinging on the target. Basedon a gaussian distribution but decreasing linearly to zero for probabilities smaller than0.3.
2.1.3. Simulation parameters and variance reduction methods Having the same energy
(6 MV, 15 MV), Siemens machines may differ significantly in the nominal energy of the
primary electrons. Sheikh-Bagheri and Rogers (2002) studied the influence of different
mean energies and energy distributions of the primary electrons, finding that both
parameters must be closely matched to reproduce photon measurements. Matching
their Primus machine Pena et al (2004) found a nominal energy of 11.5 MeV and a
spatial FWHM of 0.15 cm.
However, using the same FWHM and nominal energy did not reproduce the
measured depth dose at the UKE. To achieve a match the nominal electron energy had
to be increased to 14.5 MeV giving rise to the question how the neutron source strength
is influenced, as it is assumed that the source strength rises with higher nominal energy.
The energy distribution of primary electrons used is shown in figure 2.
Following MCNPX variance reduction options were used in the calculations:
cell importance, biased bremsstrahlung production, biased photonuclear production,
electron energy cutoff of 200keV, particle weight cutoff (-0.1 for electrons, -0.2 for
photons, -10−9 for neutrons).
Cell importance was chosen in such a way that photons and electrons which reach
the shielding concrete or a lateral distance of 1 m or more from the beam axis are
terminated.
Bremsstrahlung production was biased (BBREM 0.1 0.1 46I 50 3 6) in the materials
number 3 (graphite of the target) and number 6 (tungsten).
Maximizing the amount of photoneutrons available for transport, biased
photonuclear production was turned on. Biased production creates a photoneutron,
with a weight corresponding to its production possibility, at every photon collision.
Correspondingly a low neutron weight cutoff was chosen.
As the range of electrons with an energy below 0.2 MeV in water is approximately
107

Photoneutron production of a Siemens Primus linear accelerator 6
0.02 cm (smaller than any tally structure) a global electron energy cutoff of 0.2 MeV
was chosen.
The tallied quantities were total dose using the +F6 tally and the reaction rate in10B using the F4 tally and the FM4 1 107 99 card, where 99 is the material specified
by the M99 5010 1 card. Material 99 is used for tallying purposes only, a corresponding
warning was issued.
2.2. Paired ionization chamber system
Two magnesium ionization chambers of type IC 30 manufactured by Wellhofer
Dosimetry (Schwarzenbruck, Germany) have been used. Both chambers have an active
volume of 0.3 cm3, are watertight and were flushed with pure argon at a rate of 1 liter
per hour from an external gas supply. The first magnesium chamber is denoted Mg/Ar
chamber. The second magnesium chamber (denoted MgB/Ar chamber) is similar in
design to the first, but coated with 3 µm of enriched 10B (92%) on the inside of the
cavity wall. This chamber and its neutron detecting capabilities have been thoroughly
investigated elsewhere (Ludemann et al 1995, Becker et al 2007).10B has a high probability of capturing thermal neutrons. When a thermal neutron
is captured the compound nucleus decays instantly into an alpha and a lithium particle.
The thin coating on the inside of the cavity wall allows those particles to enter the
cavity. The coating thickness has been carefully selected as a thicker coating would
show self-absorbtion effects and a thinner coating would create less secondary particles.
The gas is ionized by alpha and lithium particles which reach the chamber cavity. If
compared to the unborated magnesium chamber the borated chamber collects additional
charge. This excess charge is proportional to the thermal neutron fluence at the chamber
location.
A similar system has been introduced by Burmeister et al (1999) to estimate the
thermal neutron fluence in fast neutron therapy. The same principle is used by Howell
et al (2005). They compare the readings of TLDs with different sensitivities to thermal
neutrons.
To estimate the neutron contamination in photon fields with the paired chamber
system the neutron flux has to be small compared to the photon flux. Under these
conditions the (neutron insensitive) magnesium chamber reading is related to the total
dose in the usual way:
Dtotal = kQND,W RMg (1)
Where RMg is the chamber reading corrected for temperature and pressure, ND,W
the cobalt calibration factor and kQ the photon quality correction factor.
When the borated chamber is used in the same place as the magnesium chamber
the neutron signal can be calculated in the following way:
∆Q = RMgB − krelRMg (2)
108

Photoneutron production of a Siemens Primus linear accelerator 7
krel is determined with a photon field not contaminated with neutrons. In the 6 MV
mode of the Primus no neutrons are present, thus ∆Q = 0. Experimental determination
yielded krel = 1.007± 3%.
The resulting value of ∆Q is proportional to the (n,α) reaction rate in 10B at the
chamber location. This reaction rate can be easily calculated with MCNPX, as it is the
convolution of neutron spectrum and 10B(n,α) cross-section (σ10B(n,α)). It is calculated
with equation 3.
∆Q = C∫ ∞0
σ10B(n,α)(E)Φn(E) dE (3)
Where C is a constant and Φn(E) is the flux of neutrons with the energy E.
All measurements have been carried out with a Farmer NE 2570 electrometer
operated at a negative voltage of 250 Volt.
2.3. Phantoms and experimental set up
Two different phantoms were used for the experiments. The first one consisted of solid
water slabs (RW3) of 30 cm×30 cm×1 cm dimension. Positioned in 3 cm depth, the
chambers were mounted at the center of a correspondingly drilled 30 cm×30 cm×2 cm
PMMA slab. The overall height of the phantom was 13 cm (2 cm RW3, 2 cm PMMA,
9 cm RW3), the SSD was 100 cm and the SAD 103 cm. This phantom was placed
directly on the patient couch.
A stack of tungsten plates (10 cm × 10 cm × 1 cm each) was placed on top of the
first RW3 phantom and a 10 cm × 10 cm photon field was chosen for irradiation.
Being a dense material, tungsten attenuated the photon flux while simultaneously
creating additional photoneutrons. Neutrons backscattered from the treatment room
contribute to the corresponding tally and measurement.
Additionally the IMRT verification phantom EasyCube (Euromechanics, Ger-
many), developed at our institution, was used. Its dimensions are 18 cm × 18 cm
× 18 cm and it is made of solid water (RW3). It consists of an outer cubic cage of
1 cm wall thickness, where slabs and blocks of RW3 are inserted. One of the blocks was
modified to house our ionization chambers. For ionization chamber measurements the
cube has to be opened on one side reducing its size in this direction by 1 cm.
The EasyCube center was positioned at the isocenter, mounted on a polystyrene
block. This polystyrene block was included in the simulation, as preliminary test have
shown its significance. Placing the EasyCube directly onto the carbon fibre table,
thermal neutrons are reflected by the couch thus increasing the tallied reaction rate
in the lower third of the EasyCube.
109

Photoneutron production of a Siemens Primus linear accelerator 8
Figure 3. Normalized photon spectrum of the 15 MV mode at SSD 100, calculatedwith a bin width of 50 keV, without phantom presence.
Table 1. Coefficients for fits used in figures 3 and 5.
constant value 2σ
c1 1.662 2.6%c2 -0.1755 22.7%c3 0.2151 4.3%c4 0.3488 7.6%
constant value 2σ
d1 3.243 2.3%d2 0.6434 2.2%d3 0.6627 1.3%
3. Results
3.1. Photon calculations
Figure 3 shows the calculated photon spectrum at SSD 100 cm without phantom
presence. The mean energy of the photons is 4.149 MeV. Equation 4 shows the fit
function used in figure 3, values for coefficients are found in table 1.
n(E) = c1Ec2exp(−c3E − c4
E) (4)
Photon dose calculations have been done for the percentage depth curve (figure 4
a) and beam profiles (figure 4 b) in a water phantom. Dose data was normalized to
a reference depth of 10 cm depth on the central axis. The normalization factor was
determined using a 4th order polynomial fit to the dose region beyond 5 cm depth.
Measured dose data was obtained with a Wellhofer CC 03 chamber when commissioning
our treatment planning system. Calculated and measured dose agree fairly well except
for the buildup region of the PDD. Minor differences can be observed close to the surface
which can be attributed to electron contamination in the photon beam. This electron
contamination is unimportant for neutron production.
110

Photoneutron production of a Siemens Primus linear accelerator 9
(a) (b)
Figure 4. Results of dose calculations and measurements: (a) depth dose curve (b)beam profiles at 3/5/10 cm depth. All data was normalized to 10cm depth.
Table 2. Contribution of individual accelerator components to the overall neutronproduction.
Location This work Pena et al
primary collimator 54.85 % 52.29 %MLC and jaws 26.72 % 27.74 %
target 10.08 % 12.43 %target slide 5.64 % 5.27 %
flattening filter 1.74 % 0.41 %bending magnet 0.61 % 1.86 %
steel block 0.13 % -steel and lead shield 0.11 % -
x-low collimator 0.07 % -steel skeleton 0.03 % -
absorber 0.01 % 0.00 %steel plate 0.003 % -electronics 0.001 % -
other 0.006 % -
3.2. Locations of neutron production
Table 2 shows locations of photoneutron production. Excluding the target (made from
Tungsten, copper, steel, water and graphite), tungsten components account for roughly
87 %, steel components for roughly 2 % of the total neutron production. Neutron
spectrum and component contribution were calculated with a MCNPX run producing
10 million photoneutrons requiring 30 million primary particles. Following additional
variance reduction methods were used in this run: electron and photon energy cutoff
of 7 MeV (threshold energy of most (γ,n) reactions) and particle weight cutoff (-1 for
electrons, -1 for photons, -10−9 for neutrons).
111

Photoneutron production of a Siemens Primus linear accelerator 10
Figure 5. Normalized neutron source spectrum differential in energy at the respectivelocation of neutron production.
The values from table 2 agree fairly well with the values published by Pena et al
(2005), where MLC and jaws are separated and target slide is split into target container
and shielding. The largest difference in neutron production is found in target and
primary collimator. This might be due to the tungsten target replacement letting more
high energy photons escape to the primary collimator.
Comparison with values published for a Varian Clinac 2100/2300C (Zanini et al
2004 and Howell et al 2005) shows that Varian machines produce more neutrons in
the target (15.2%/14%) and flattening filter (8.9%/8%) and about the same amount in
primary collimator and MLC and jaws.
3.3. Neutron spectrum
figure 5 shows the spectral distribution of photoneutrons. The fit function from equation
5 is used, values for coefficients are found in table 1.
n(E) = d1Ed2exp(−E
d3
) (5)
Distinguishing between source spectrum and spectrum at a given location is
important. Counting each neutron only once, the source spectrum (figure 5) shows
neutron weight and energy at the time of production. Counting every neutron which
transverses the tally volume (voxel of (10cm)3, the spectrum at the isocenter shows the
final neutron distribution at this location. On the average each neutron is counted three
times, as neutrons are backscattered from the treatment room. In figure 6 a spectrum at
the isocenter (no phantom presence) is compared with the source spectrum. The source
does not produce neutrons with energies below 10 eV. The flux of source neutrons with
energies below 10 keV was calculated with a high statistical uncertainty due to their
rareness. All thermal neutrons tallied at the isocenter come from scattering reactions
throughout the treatment room. The mean neutron energy was calculated for source112

Photoneutron production of a Siemens Primus linear accelerator 11
Figure 6. Neutron spectrum (ΦE(E)) differential in energy per Gray under referenceconditions at the location of neutron production (solid line) and at the isocenter (dottedline).
neutrons (E = 1.06 MeV ) and at the isocenter (E = 0.458 MeV ). Lin et al (2001)
found a mean neutron energy of 0.5 MeV 1 meter away from the isocenter.
3.4. Neutron source strength
Neutron source strength Q is an important quantity for radiation protection. The
neutron flux at a given location from the source can be calculated in the following way
(McGinley and Landry 1989):
Φ(r) =aQ
4πr2+
5.4aQ
S(6)
where r is the distance to the neutron source, a is the neutron transmission factor for
the head shielding and S is the surface area of the treatment room.
Radiation protection guidelines for room shielding provided by Siemens suggest
assuming a source strength of Q = 0.8 × 10¹²n Gy−1, where the normalization n Gy−1
means neutrons per Gray at the depth dose maximum of a 10 cm × 10 cm field in a
water phantom with SSD 100 cm (reference conditions).
Neutron source strength determined here is Q = 0.136 × 10¹²n Gy−1. It is
comparable to the results of the measurements from Followill et al (2003) (Q =
0.12 × 10¹²n Gy−1 and Q = 0.21 × 10¹²n Gy−1) and from Lin et al (2001) (Q =
0.20× 10¹²n Gy−1). Pena et al (2005) calculated a value of Q = 0.17× 10¹²n Gy−1.
3.5. Verification with tungsten shielding
Ranging in tungsten thickness from 1 cm to 6 cm, 6 MCNPX runs were done running
20 million primary particles each. Total dose and reaction rate in 10B were tallied in113

Photoneutron production of a Siemens Primus linear accelerator 12
Figure 7. Comparison of measurement with calculation for 100 MU of a 10 cm ×10 cm field with different tungsten thickness. All measurements have been done atthe same reference position increasing the height of the tungsten stack. Total photondose measurements (a) utilize the Mg/Ar chamber only, excess charge determination(b) uses both chambers.
3 cm depth of the RW3 phantom (flat cylinder with z=0.4 cm, r=2.5 cm, center at 3 cm
depth). Results are compared to measurements with the paired chamber system. figure 7
shows the comparison of measurement and calculation. Total photon dose was derived
from measurement with the Mg/Ar chamber using equation 1. All measurements were
done in the same depth (3 cm) of the solid water phantom with an increasing thickness
of tungsten on the phantom. Excess charge was measured using both chambers and
equation 2. Agreement of measurement and calculation of photon dose is within 3%.
Agreement of calculated excess charge and reaction rate is within 7%, although a slightly
different gradient can be observed.
3.6. Verification with EasyCube phantom
It was concluded from the tungsten shielding experiment that the paired chamber
method was sensitive enough to detect neutrons in the photon field without additional
reduction of the photon flux.
All necessary data could be calculated with one MCNPX run with 147 million
primary particles. Tally volumes were small cylinders (z=0.2 cm, r=2.5 cm) centered
at each full centimeter of depth (1, 2, ... 15 cm). Tallied quantities were again total
dose and reaction rate in 10B. A 10 cm × 10 cm field with 500 MU was irradiated for
each measurement. Results are shown in figure 8. Total photon dose was derived from
measurement with the Mg/Ar chamber using equation 1. Calculated and measured dose
agree well beyond 3 cm depth. For the build-up region the calculation is to low. the
same effect is observed in figure 4 (a). Excess charge was measured using both chambers
and equation 2. Agreement of measurement and calculation of photon dose beyond 3 cm
depth is within 2%. Agreement of calculated excess charge and reaction rate is within
114

Photoneutron production of a Siemens Primus linear accelerator 13
Figure 8. Comparison of measurement with calculation for 500 MU of a 10 cm× 10 cm field in different depths of the EasyCube phantom. Total photon dosemeasurements (a) utilize the Mg/Ar chamber only, excess charge determination (b)uses both chambers.
7%, showing a similar gradient.
4. Discussion
Producing the same results, all chamber measurements in the tungsten shielding
experiment have been done three times. Remaining uncertainties originate in
uncertainty of the chamber calibration, electrometer, positioning accuracy and daily
variation of the accelerator. These uncertainties apply to all chamber measurements
should be in the order of 3% or less and are not included in the figures.
Measurement of excess charge uses the krel factor, which was found to be sensitive to
the mean photon energy. Errors of the excess charge measurements should be expected
to be in the order of 6 %.
The statistical error of the simulations was usually below 1% except for bins with
very few particles where is was below 10 %. The statistical error does not include any
error in cross-section evaluations or of approximations in physics models of the Monte
Carlo code. It should be assumed that these errors are in the order of 5 % or less and
are not included in the figures.
Simulations showed that the most important component for photoneutron
production not included in photon simulations, is the target slide with a contribution of
about 5 % to the total photoneutron production. The other components contribution is
usually in the order of 0.1 % or less. Nevertheless components with low photoneutron
production are essential for neutron scattering and have to be included when treatment
room distributions are studied.
Although the nominal primary electron energy was higher than in the work of
Pena et al (2005) the neutron source strength was about the same they calculated and
Followill et al (2003) measured. One might expect the source strength to increase with115

Photoneutron production of a Siemens Primus linear accelerator 14
nominal energy, however this was not the case. There are two effects that explain this
behavior.
First, the neutron source strength is normalized to 1 Gray under reference
conditions. At higher nominal energies more high energy photons are created per
primary electron, thus depositing more dose per photon. So less primary electrons
are needed to realize the standard conditions and therefore less neutrons are created.
Second, the neutron yield per primary electron is not linear with the nominal
energy. The photonuclear reaction can be explained by the giant dipole resonance.
The resonance peak in heavy metals has its maximum around 13.5 MeV, which is lower
than the maximum photon energy of 14.5 MeV.
The calculations have been verified by comparison with photon measurements
and specially designed experiments for the paired chamber system. Calculations and
measurements showed agreement within assumed error margins (5% for simulations and
3 % for chamber measurements).
Considered water equivalent for photons, RW3 is neither tissue equivalent nor water
equivalent for neutrons. However this is not an issue in this paper as all calculations
have been done using the elemental composition of RW3. Transferring the results of
neutron measurements in RW3 to clinical situations requires careful consideration of the
missing equivalency.
Some minor but time consuming modifications can be done to the parameters of
the primary electron beam to improve the match in the build up region of the photon
depth dose curve. However these modifications mainly concern photon and electron
energies lower than the photonuclear energy threshold and are negligible for neutron
calculations.
5. Conclusions
It has been shown that Monte Carlo methods can be used to calculate the neutron
contamination in high energy photon beams. To receive accurate results for neutron
transport components that are negligible for photon and electron calculations have to
be included.
The paired chamber system has been shown to be able to detect neutrons even
in high photon flux fields. This is an important advantage to some other neutron
detection techniques that can not be used inside high photon flux fields. The paired
chamber system can now be used to determine the neutron contamination in various
clinical situations that are difficult to simulate with Monte Carlo methods.
The main advantage of the paired chamber system is its size. Voluminous bubble
chambers or bonner spheres can not be used in regions of neutron flux gradients due to
their large size. A chamber has a diameter of 1 cm allowing a point wise determination
of neutron contaminations.
It was found that the neutron source strength was relatively insensitive to changes
in the nominal primary electron energy.116

Photoneutron production of a Siemens Primus linear accelerator 15
Acknowledgments
The authors would like to thank M Todorovic for providing help and assistance in
operating the linacs and T Schoch for building the RW3 adaptor for the chambers and
fixing the gas provision. This study was supported by the German research foundation
(DFG project SCHM1070/26-1).
References
Becker J, Brunckhorst E, Roca A, Stecher-Rasmussen F, Moss R, Bottger R and Schmidt R 2007 Set-upand calibration of a triple ionization chamber system for dosimetry in mixed neutron/photon fieldsPhys. Med. Biol. 52 3715-27
Burmeister J, Kota C, Yudelev M and Maughan R L 1999 Paired Mg and Mg(B) ionization chambersfor the measurement of boron neutron capture dose in neutron beams Med. Phys. 26 2482-87
Chibani O and Ma C-M C 2003 Photonuclear dose calculations for high-energy photon beams fromSiemens and Varian linacs Med. Phys. 30 1990-2000
d’Errico F, Nath R, Tana L, Curzio G and Alberts W G 1998 In-phantom dosimetry and spectrometryof photoneutrons from an 18 MV linear accelerator Med. Phys. 25 1717-24
Followill D S, Stovall M S, Kry S F and Ibbott G S 2003 Neutron source strength measurements forVarian, Siemens, Elekta, and General electric linear accelerators J. Appl. Clin. Med. Phys. 4 189-94
Howell R M, Ferenci M S, Hertel N E and Fullerton G D 2005 Investigation of secondary neutron dosefor 18 MV dynamic MLC IMRT delivery Med. Phys. 32 786-93
Lin J-P, Chu T-C, Lin S-Y and Liu M-T 2001 The measurement of photoneutrons in the vicinity of aSiemens Primus linear accelerator Appl. Radiat. Isot. 55 315-21
Lin S-Y, Chu T-C, Lin J-P and Huang C-Y 2002 Monte Carlo simulation of surface percent depth doseAppl. Radiat. Isot. 56 505-10
Ludemann L, Matzen T, Matzke M, Schmidt R and Scobel W 1995 Determination of the thermalneutron flux in a fast neutron beam by use of a boron-coated ionization chamber Med. Phys. 221743-47
McGinley P H, Landry J C 1989 Neutron contamination of x-ray beams produced by the Varian Clinac1800 Phys. Med. Biol. 34 777-83
Tosi G, Torresin A, Agosteo S, Foglio Para A, Sangiust V, Zeni L and Silari M 1991 Neutronmeasurements around medical electron accelerators by active and passive detection techniquesMed. Phys. 18 54-60
Ongaro C, Zanini A, Nastasi U, Rodenas J, Ottaviano G and Manfredotti C 2000 Analysis ofphotoneutron spectra produced in medical accelerators Phys. Med. Biol. 45 L55-61
Pena J, Franco L, Gomez F, Iglesias A, Lobato R, Mosquera J, Pazos A, Pardo J, Pombar M, RodrıguezA and Sendon J 2004 Commissioning of a medical accelerator photon beam Monte Carlo simulationusing wide-field profiles Phys. Med. Biol. 49 4929-42
Pena J, Franco L, Gomez F, Iglesias A, Pardo J and Pombar M 2005 Monte Carlo study of SiemensPRIMUS photoneutron production Phys. Med. Biol. 50 5921-33
Sheikh-Bagheri D and Rogers D W O 2002 Sensitivity of megavoltage photon beam Monte Carlosimulations to electron beam and other parameters Med. Phys. 29 379-90
Zanini A, Durisi E, Fasolo F, Ongarao C, Visca L, Nastasi U, Burn K W, Scielzo G, Adler J O, AnnandJ R M and Rosner G 2004 Monte Carlo simulation of the photoneutron field in linac radiotherapytreatments with different collimation systems Phys. Med. Biol. 49 571-82
117

Bibliography
[1] David S. Followill, Fridtjof Nusslin and Colin G. Orton. IMRT should not be ad-ministered at photon energies greater than 10 MV. Med Phys, 34(6):1877–1879, June2007.
[2] K. H. Beckurts and K. Wirtz. Neutron Physics. Springer Verlag, 1964.
[3] Attix and Tochilin. Radiation Dosimetry, volume 1-3. AP, 1969.
[4] Hanno Krieger. Strahlenphysik, Dosimetrie und Strahlenschutz, volume 2. Teubner,2001.
[5] G. Musiol, J. Ranft, R. Reif and D. Seeliger. Kern- und Elementarteilchenphysik.VCH, 1988.
[6] EXFOR database, Nuclear Energy Agency. Nuclear data services database access.http://www.nea.fr/html/dbdata/databases.htm.
[7] X-5 Monte Carlo Team. MCNP - A General Monte Carlo N-Particle Transport CodeVersion 5 Volume I: Overview and Theory, April 24, 2003 (Revised 10/3/05).
[8] Denise B. Pelowitz. MCNPX USER’S MANUAL Version 2.5.0, April 2005.
[9] Alfredo C. Siochi. Description of the Siemens Primus accelerator with the serialnumber 3362 for simulation in BEAM. Eletronic data file, August 2001.
[10] International Commission on Radiation Measurements and Units (ICRU). Tissuesubstitutes in radiation dosimetry and measurements Report 44, 1989.
[11] Gunter Christ. White polystyrene as a substitude for water in high energy photondosimetry. Med Phys, 22(12):2097–2100, Dec 1995.
[12] Deutsches Institut fur Normung. Klassifikation von Betonen nach Elementanteilen beider Verwendung zur Neutronenabschirmung. DIN 25 413, Mar 1976.
[13] Robert C. Singleterry Jr. and Sheila A. Thibeault. Materials for Low-Energy NeutronRadiation Shielding. Report number L-17773; NAS 1,60210281; NASA TP-2000-210281, 2000.
[14] IAEA. Photonuclear data library. http://www-nds.iaea.org/photonuclear/.
119
Bibliography
[15] Oncology Care Systems Group. Linac Service Essentials for Biomeds-Experts. Partic-ipant Guide. Technical report, Siemens Medical Solutions, Inc., February 2004.
[16] J. Pena, L. Franco, F. Gomez, A. Iglesias, J. Pardo and M. Pombar. Monte Carlo studyof Siemens PRIMUS photoneutron production. Phys Med Biol, 50(24):5921–5933, Dec2005.
[17] Rebecca M. Howell, Michele S. Ferenci, Nolan E. Hertel and Gary D. Fullerton. In-vestigation of secondary neutron dose for 18 MV dynamic MLC IMRT delivery. MedPhys, 32(3):786–793, Mar 2005.
[18] A. Zanini, E. Durisi, F. Fasolo, C. Ongaro, L. Visca, U. Nastasi, K. W. Burn, G.Scielzo, J. O. Adler, J. R. M. Annand and G. Rosner. Monte Carlo simulation of thephotoneutron field in linac radiotherapy treatments with different collimation systems.Phys Med Biol, 49(4):571–582, Feb 2004.
[19] Oncology Care Systems Group, Siemens Medical Solutions, Inc. PRIMUS Mid- andHigh-Energy Advanced Medical Linear Accelerator, 2002.
[20] David S. Followill, Marilyn S. Stovall, Stephen F. Kry and Geoffrey S. Ibbott. Neutronsource strength measurements for Varian, Siemens, Elekta, and General Electric linearaccelerators. J Appl Clin Med Phys, 4(3):189–194, 2003.
[21] J. Becker, E. Brunckhorst, A. Roca, F. Stecher-Rasmussen, R. Moss, R. Bottger andR. Schmidt. Set-up and calibration of a triple ionization chamber system for dosimetryin mixed neutron/photon fields. Phys Med Biol, 52(13):3715–3727, May 2007.
[22] P. Andreo, D. T. Burns, K. Hohlfeld, M. S. Huq, T. Kanai, F. Laitano, V. Smythand S. Vynckier. Absorbed Dose Determination in External Beam Radiotherapy: AnInternational Code of Practice for Dosimetry based on Standards of Absorbed Doseto Water. Technical report, International Atomic Energy Agency, 2004.
[23] R. Bottger, H. Friedrich and H. Janßen. The PTB Thermal Neutron Reference Fieldat GeNF. Technical Report PTB-N-47, Physikalisch-Technische Bundesanstalt, 2004.
[24] C. Vroegindeweij, F. Stecher-Rasmussen and R. Huiskamp. A thermal neutron facilityfor radiobiological studies. Ann Nucl Energy, 23:1229–1238, 1996.
[25] A. Paardekooper. Neutron fluence rate measurements for BNCT research in the LFRand HFR. Personal communication, 31. October 2006.
[26] F. J. Wheeler, D. W. Nigg, J. Capala, P. R. Watkins, C. Vroegindeweij, I. Auterinen,T. Seppala and D. Bleuel. Boron neutron capture therapy (BNCT): implications ofneutron beam and boron compound characteristics. Med Phys, 26(7):1237–1244, Jul1999.
120

Bibliography
[27] C. P. Raaijmakers, P. R. Watkins, E. L. Nottelman, H. W. Verhagen, J. T. Jansen, J.Zoetelief and B. J. Mijnheer. The neutron sensitivity of dosimeters applied to boronneutron capture therapy. Med Phys, 23(9):1581–1589, Sep 1996.
[28] L. Ludemann, T. Matzen, M. Matzke, R. Schmidt and W. Scobel. Determination ofthe thermal neutron flux in a fast neutron beam by use of a boron-coated ionizationchamber. Med Phys, 22(11 Pt 1):1743–1747, Nov 1995.
[29] International Commission on Radiation Measurements and Units (ICRU). The QualityFactor on Radiation Protection Report 40, 1986.
[30] International Commission on Radiation Measurements and Units (ICRU). ConversionCoefficients for use in Radiological Protection Against External Radiation Report 57,1998.
[31] International Commission on Radiation Measurements and Units (ICRU). Determi-nation of Operational Dose Equivalent Quantities For Neutrons Report 66, 2001.
[32] International Commission on Radiation Measurements and Units (ICRU). Neutrondosimetry for biology and medicine Report 26, 1976.
[33] International Commission on Radiation Measurements and Units (ICRU). Averageenergy required to produce an ion pair Report 31, 1979.
[34] International Commission on Radiation Measurements and Units (ICRU). Clinicalneutron dosimetry: Part 1. Determination of absorbed dose in a patient treated byexternal beams of fast neutrons Report 45, 1989.
[35] F. d’Errico, R. Nath, L. Tana, G. Curzio and W. G. Alberts. In-phantom dosimetryand spectrometry of photoneutrons from an 18 MV linear accelerator. Med Phys,25(9):1717–1724, Sep 1998.
[36] J. Burmeister, C. Kota, M. Yudelev and R. L. Maughan. Paired Mg and Mg(B)ionization chambers for the measurement of boron neutron capture dose in neutronbeams. Med Phys, 26(11):2482–2487, Nov 1999.
[37] Omar Chibani and Chang-Ming Charlie Ma. Photonuclear dose calculations for high-energy photon beams from Siemens and Varian linacs. Med Phys, 30(8):1990–2000,Aug 2003.
[38] M. W. Konijnenberg, L. G. Dewit, B. J. Mijnheer, C. P. Raaijmakers and P. R.Watkins. Dose homogeneity in boron neutron capture therapy using an epithermalneutron beam. Radiat Res, 142(3):327–339, Jun 1995.
[39] J. P. Lin, T. C. Chu, S. Y. Lin and M. T. Liu. The measurement of photoneutrons inthe vicinity of a Siemens Primus linear accelerator. Appl Radiat Isot, 55(3):315–321,Sep 2001.
121
Bibliography
[40] Sung-Yen Lin, Tieh-Chi Chu, Jao-Perng Lin and Chao-Yuan Huang. Monte Carlosimulation of surface percent depth dose. Appl Radiat Isot, 56(3):505–510, Mar 2002.
[41] L. Ludemann, T. Matzen, R. Schmidt and W. Scobel. BNCT as a boost for fastneutron therapy? Bull Cancer Radiother, 83 Suppl:198s–200s, 1996.
[42] Thomas Matzen. Experimentelle Untersuchungen zur Separierung der Dosisanteile imtherapeutisch genutzen Neutronenfeld. Master’s thesis, University of Hamburg, 1995.
[43] C. Ongaro, A. Zanini, U. Nastasi, J. Rodenas, G. Ottaviano, C. Manfredotti and K.W. Burn. Analysis of photoneutron spectra produced in medical accelerators. PhysMed Biol, 45(12):L55–L61, Dec 2000.
[44] J. Pena, L. Franco, F. Gomez, A. Iglesias, R. Lobato, J. Mosquera, A. Pazos, J.Pardo, M. Pombar, A. Rodrıguez and J. Sendon. Commissioning of a medical accel-erator photon beam Monte Carlo simulation using wide-field profiles. Phys Med Biol,49(21):4929–4942, Nov 2004.
[45] C. P. Raaijmakers, M. W. Konijnenberg, B. J. Mijnheer, F. Stecher-Rasmussen andH. Verhagen. Determination of the gamma-ray dose in an epithermal neutron beam.Strahlenther Onkol, 169(1):18–20, Jan 1993.
[46] C. P. Raaijmakers, M. W. Konijnenberg, H. W. Verhagen and B. J. Mijnheer. De-termination of dose components in phantoms irradiated with an epithermal neutronbeam for boron neutron capture therapy. Med Phys, 22(3):321–329, Mar 1995.
[47] C. P. Raaijmakers, E. L. Nottelman, M. W. Konijnenberg and B. J. Mijnheer. Dosemonitoring for boron neutron capture therapy using a reactor-based epithermal neu-tron beam. Phys Med Biol, 41(12):2789–2797, Dec 1996.
[48] R. D. Rogus, O. K. Harling and J. C. Yanch. Mixed field dosimetry of epithermalneutron beams for boron neutron capture therapy at the MITR-II research reactor.Med Phys, 21(10):1611–1625, Oct 1994.
[49] P. M. Munck af Rosenschold, C. P. Ceberg, V. Giusti and P. Andreo. Photon qualitycorrection factors for ionization chambers in an epithermal neutron beam. Phys MedBiol, 47(14):2397–2409, Jul 2002.
[50] P. M. Munck af Rosenschold, V. Giusti, C. P. Ceberg, J. Capala, K. Skold and B. R.R. Persson. Reference dosimetry at the neutron capture therapy facility at Studsvik.Med Phys, 30(7):1569–1579, Jul 2003.
[51] R. Schmidt, R. L. Maughan, M. Yudelev, C. Kota and S. Wanwilairat. Experimentaldetermination of the thermal neutron flux around two different types of high intensity252Cf sources. Med Phys, 26(1):83–86, Jan 1999.
122

Bibliography
[52] R. Schmidt and A. Hess. Triple chamber technique for thermal neutron dose measure-ments in fast neutron beams. Strahlentherapie, 158(10):612–615, Oct 1982.
[53] Daryoush Sheikh-Bagheri and D. W. O. Rogers. Sensitivity of megavoltage photonbeam Monte Carlo simulations to electron beam and other parameters. Med Phys,29(3):379–390, Mar 2002.
[54] G. Tosi, A. Torresin, S. Agosteo, A. Foglio Para, V. Sangiust, L. Zeni and M. Silari.Neutron measurements around medical electron accelerators by active and passivedetection techniques. Med Phys, 18(1):54–60, 1991.
[55] F. M. Waterman, F. T. Kuchnir, L. S. Skaggs, R. T. Kouzes and W. H. Moore.Energy dependence of the neutron sensitivity of C–CO2, Mg–Ar and TE–TE ionisationchambers. Phys Med Biol, 24(4):721–733, Jul 1979.
123


Thanks to
I would like to thank
• Prof. Dr. R. Schmidt, for the possibility to work in medical physics and providingthis interesting topic, the possibility to cooperate with international working groupsand the liberty to write publications.
• Prof. Dr. P. Schleper, for the external assistance and suggesting to study radiationprotection plastics.
• E. Brunckhorst, for being an excellent supervisor, answering all my questions and allthe proof reading.
• M. Todorovic, who helped in operating the linacs and never tired to enter his pass-word.
• D. Albers, who calculated all plans and provided images, depth dose data, etc.
• A. Bartels, who was always willing to talk about something other than just physics.
• E. Thom, for always being cheerful.
• E. Drud, for allowing me to remain silent when certain ”minor” corrections had tobe made.
• H. Thurmann, for his support, especially in the beginning of my thesis.
• T. Schoch, for always fixing the gas provisions of the ionization chambers, no matterwhere they started to leak.
• the whole working group, for the nice atmosphere.
• A. Roca, F. Stecher-Rassmussen and the rest of the BNCT group at Petten, for theirhospitality and the possibility to calibrate our ionization chambers.
• R. Bottger, for the possibility to measure at the PTB reference field.
And Daniela Hedke, my future wife, for changing my life and always reminding me that 8is the answer.


Hiermit versichere ich, die vorliegende Arbeit selbstandig angefertigt und nur die angegebe-nen Hilfsmittel verwendet zu haben.Ich bin mit der Ausleihe meiner Arbeit durch die Bibliothek einverstanden.
Hamburg, im Juli 2007
Julian Becker