Embed Size (px)
Citation preview
ELK ASIA PACIFIC JOURNAL OF APPLIED THERMAL ENGINEERING
ISSN 2394-0433 (Online); EAPJATE/issn. 2394-0433/2016; Volume 1 Issue 2 (2016)
www.elkjournals.com
………………………………………………………………………………………………
SIMULATION OF AIR INLET COOLING SYSTEM OF A GAS TURBINE POWER
PLANT
Ejiroghene Kelly Orhorhoro
Department of Mechanical Engineering,
Faculty of Engineering, Delta State Polytechnic,
Otefe-Oghara, Nigeria,
Oghenero Wilson Orhorhoro
Department of Electrical and Electronic
Engineering,
Faculty of Engineering, Delta State Polytechnic,
Otefe-Oghara, Nigeria
ABSTRACT
This research work focus on the simulation of air inlet cooling system of a gas turbine power plant using an
ASPEN HYSYS simulation software. ASPEN HYSYS is engineering software suite. The user interface is predicated
on a library of ready-made user editable component models based in FORTRAN. Operating data for gas turbine
unit were collected in every two hours on a daily control log sheet for a period of one month. The daily average
operating variable were statistically analyzed and mean values were computed for the period of collection. The
performance of the plant was determine by simulation using ASPEN HYSYS software to obtain the compressor
work, turbine work. Other results such as Net-power, specific fuel consumption, heat Rate and thermal efficiency
was calculated in excel sheet. The results obtained show that decrease in inlet air temperature brings about an
increase in power output and thermal efficiency. Also, retrofitting of the existing gas turbine plant with
mechanical system give a better performance.
Keywords: ASPEN HYSYS simulation software, Gas Turbine, Air inlet cooling, Temperature,
INTRODUCTION
The performance of a gas turbine power
plant is sensible to the ambient condition.
The ambient temperature has huge
influence on the performance of a gas
turbine plant. As the ambient air
temperature arises, less air can be
compressed by the compressor, thus, the
gas turbine output is reduced at a given
turbine entry temperature [1]. Besides, the
compression work increases because the
limited volume of the air increases in
proportionality to the intake air
temperature [2,3]. Inlet air cooling and
intercooling are two important methods for
rising power output of gas turbine cycles.
ELK ASIA PACIFIC JOURNAL OF APPLIED THERMAL ENGINEERING
ISSN 2394-0433 (Online); EAPJATE/issn. 2394-0433/2016; Volume 1 Issue 2 (2016)
………………………………………………………………………………………………
Gas turbine intake air cooling may cause a
small decrease in efficiency because a lot
of fuel is needed to make compressor
exhaust gas [4]. Gas turbine makes use of
ambient air for its operation and it
performance is greatly affected by these
factors (ambient temperature, ambient
pressure, relative humidity) which
influence the flow rate of air delivered to
the compressor, in terms of weight and
physical conditions [5].
An increase in compressor inlet
temperature brings about a corresponding
increase in the specific work required to
compress the air. However, the weight
delivered will be increase (because of
decrease in specific weight). Consequently,
the power output, turbine efficiency and
useful work diminish [6]. If the
compressor inlet temperatures decrease,
the reverse process occurs. This
temperature depends on the air aspirated
by the compressor. Power and efficiency
varies from turbine to turbine, according to
cycle parameters, compressor and
expanded output and air delivery rate etc.
As a result, the variation ratios of gas
turbine performance parameter are
proportional to design point [7]. Figure 1
shows how power, heat consumption, heat
rate and the delivery rate of the exhaust
gases are influence by ambient temperature
[8]. (Refer Fig. 1)
The inability of a gas turbine engines to
perform to an optimum efficiency is as a
result of increase in compressor air above
ISO condition (150C) [8]. This research
work is aimed at the improving the gas
turbine performance and bring it near to
ISO conditions.
METHODS AND MATERIALS
SOFTWARE MODELLING AND
SIMULATION TOOL
ASPEN HYSYS is engineering software
suite. The user interface is predicated on a
library of ready-made user editable
component models based in FORTRAN.
By connecting these components by
material heat and work streams and
providing appropriate inputs, the user is
able to model complex processes. ASPEN
is commonly used software platform for
process modeling, particularly in the oil
and gas industry, Power Generation
Company etc.
DATA USED
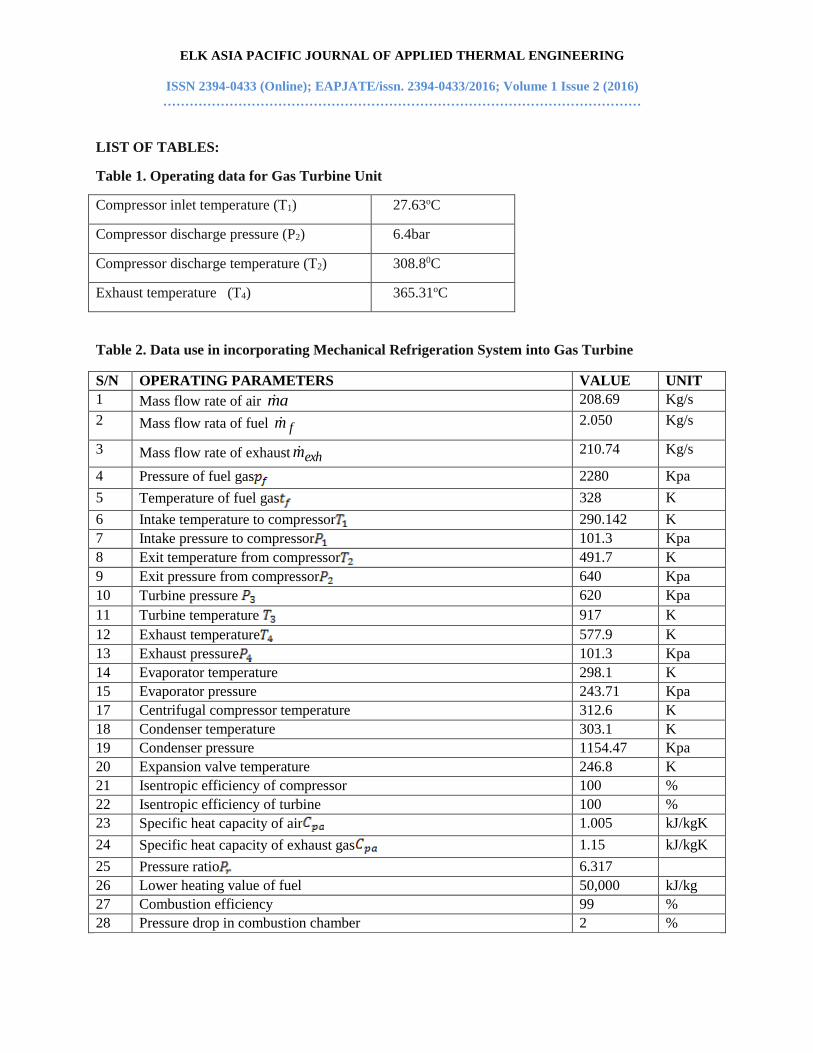
Operating data for gas turbine unit were
collected in every two hours on a daily
control log sheet for a period of one
ELK ASIA PACIFIC JOURNAL OF APPLIED THERMAL ENGINEERING
ISSN 2394-0433 (Online); EAPJATE/issn. 2394-0433/2016; Volume 1 Issue 2 (2016)
………………………………………………………………………………………………
month. The daily average operating
variable were statistically analyzed and
mean values were computed for the period
of collection (Refer Table 1).
3.4 MODELLING OF GAS
TURBINE UNIT
The basic gas turbine cycle is Brayton
cycle. Air enters the compressor where it is
compressed and heated. It goes to the
combustion chamber; the fuel is burned at
constant pressure where the temperature of
air is fired to a high temperature (T3). The
resulting high temperature gases enter the
turbine where they expand to generate the
useful work and the exhaust gases leave
the turbine (open-cycle gas turbine
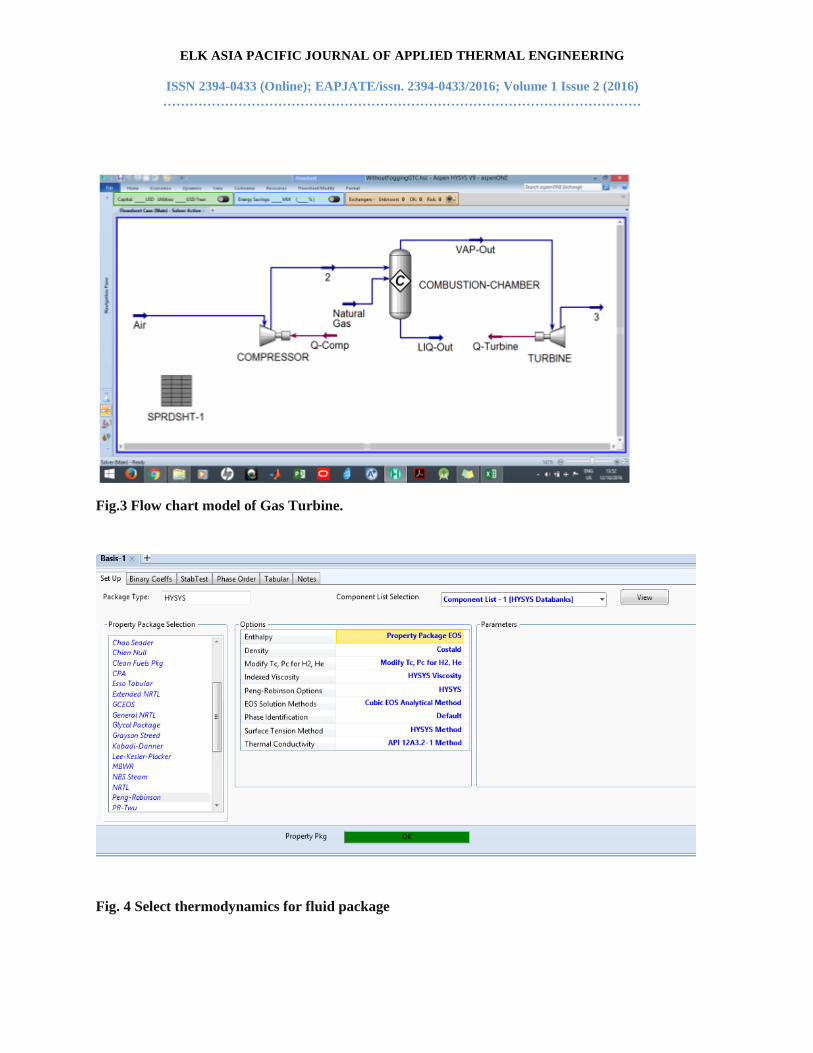
engine). Figure 2 shows the schematic
diagram of simple Gas Turbine and figure
3 shows the flow chart of model Simple
Gas Turbine. (Refer Fig. 2)
In Figure 2, the compressor inlet
temperature is equal to ambient air
temperature since the base-case neglects
the cooling effect and simulate the cycle
under ISO condition (T1 = 150C, P1 =
101.3kpa and = 60%). There is no
pressure drop at inlet and exhaust ducts
thus; pressure drop across combustion
chamber is taken to be 2% [9]. (Refer Fig.
3)
The gas turbine plant consists of
compressor, combustion chamber and
turbine. In this research work, the inlet
cooling technique proposed for the
analysis is mechanical refrigeration
cooling system. The performance of the
gas turbine is evaluated with the proposed
cooling technique and compared with
values. In the mechanical refrigeration
system, the refrigeration vapour is
compressed using vapour compression.
The vapour passes through the condenser
where expansion takes place in the
expansion valve, thus, providing the
cooling effect. The evaporator helps to
chills the incoming air before entering the
compressor. The gas turbine power plant is
model base on the following assumptions;
i. All component has adiabatic boundaries
ii. Plant performance at ISO conditions
iii. The air and the combustion products are
assume ideal characteristics
iv. Kinetic and potential components of
energy are neglected
v. The ambient conditions of temperature
and pressure are at 27.630C and
101.3kpa
vi. The vapour entering the compressor is
dry saturated and there is no
undercooling
ELK ASIA PACIFIC JOURNAL OF APPLIED THERMAL ENGINEERING
ISSN 2394-0433 (Online); EAPJATE/issn. 2394-0433/2016; Volume 1 Issue 2 (2016)
………………………………………………………………………………………………
vii. Lower heating value of fuel (LHV) to
be 50,000kJ/kg
viii. The pressure drop in combustion
chamber 2%
ix. Combustion efficiency to be 0.99
x. Isentropic efficiency for compressor and
turbine 100%
xi. Pressure and temperature of the
evaporator to be (2.4371bar, -5)
xii. Pressure and temperature of the
condenser to be (11.5447bar, 45)
xiii. Work fluid of refrigerant 134a
PROCESS SIMULATION
The first step in creating the model was the
selection of a standard set of components
and a thermodynamic basis to model the
physical properties of these components.
The selected components data required for
the Gas Turbine simulation are shown in
(Refer Table 2).
When the component list was created,
HYSYS created a new component list
called “Component List-1”. The next step
was the selection of a ‘Fluid Package’ for
it. The ‘Fluid Package’ which is the
thermodynamic system associated with the
chosen list of components (Refer Figure
4).
To account for the reaction that will be
taking place in the Combustion Chamber
the reaction methane was added to the
process simulation (Refer Figure 5).
Figure 6 shows the process flow sheet for
Gas Turbine with Mechanical
Refrigeration Unit. (Refer Fig 6)
The refrigerant is compressed in the
centrifugal compressor unit and this is
followed by condensation. The condense
vapour is expanded in the expansion valve
where it provides the cooling effect. The
cold air compressed in the compressor
entered the combustion chamber. Hot
gases produced in the combustion chamber
are expanded in the turbine to produce the
work, which drive the compressors.
RESULTS AND DISCUSSION
The performance of the plant was
determine by simulation using ASPEN
HYSYS software to obtain the compressor
work, turbine work. Other results such as
Net-power, specific fuel consumption,
Heat Rate and Thermal Efficiency was
calculated in excel sheet. Table 3 shows
the results obtained. (Refer Table 3)
The simulation results obtained by
incorporating air intake cooling system
(mechanical refrigeration system), the
ambient air temperature, pressure at inlet
and exit, mass flow rate of refrigerant,

ELK ASIA PACIFIC JOURNAL OF APPLIED THERMAL ENGINEERING
ISSN 2394-0433 (Online); EAPJATE/issn. 2394-0433/2016; Volume 1 Issue 2 (2016)
………………………………………………………………………………………………
mass flow rate of air entering the
mechanical refrigeration unit, the ambient
air temperature varied at different
condition is show in (Refer Table 4).
Figure 7 shows the graph of net power
output against ambient temperature. An
increases inlet air temperature from 301k
to 313k decreases the power output. This
lead to approximately 0.135% drop in
power loss, this loss can be prevented by
cooling the inlet air temperature from 313k
to 301k, thus, an approximately 0.136%
increase in power output. (Refer Fig. 7)
Figure 8 shows the graph of thermal
efficiency against ambient temperature. It
was observed that as the inlet air
temperature increase from 301k to 313k,
there was a decrease in thermal
efficiencies. Therefore, an approximately
0.0605% drop in thermal efficiency was
recorded. This drop can be increase by
cooling the inlet air temperature from 313k
to 301k which leads to approximately
0.066% increase in thermal efficiency.
(Refer Fig. 8)
Figure 9 shows the graph of specific fuel
consumption against ambient temperature.
Increase in ambient inlet temperature from
301k to 313k brings about an increase in
specific fuel consumption. This lead to
approximately 2.41% increase in high CO
and HC emission. The emission can be
prevented by cooling the air inlet
temperature from 313k to 301k which will
bring about an approximately 2.35%
decrease in fuel burning. (Refer Fig. 9)
Figure 10 shows the graph of heat rate
against ambient temperature. An increase
in ambient air inlet temperature from 301k
to 313k increase the heat rate. This lead to
approximately 0.460 drop in fuel
efficiency. This drop can be prevented by
cooling the inlet air temperature from 313k
to 301k thereby increasing fuel efficiency
by 0.462% efficiency. (Refer Fig. 10)
CONCLUSION
Simulation model that consist of thermal
analysis of gas turbine couple to
refrigeration cooler was develop. The
performance analysis is based on coupling
the thermodynamic parameters of the gas
turbine and cooler unit with the other
variable. The augmentation of the Gas
turbine plant performance is characterized
using the power gain ratio (PGR) and
thermal efficiency change term (TEC). The
performance analysis of the gas turbine
shows that the intake air temperature
decrease by 27.630C to 17.790C while the
PGR increase to a maximum of 10.75%.
ELK ASIA PACIFIC JOURNAL OF APPLIED THERMAL ENGINEERING
ISSN 2394-0433 (Online); EAPJATE/issn. 2394-0433/2016; Volume 1 Issue 2 (2016)
………………………………………………………………………………………………
There was an average increase in power
output from 33.794MW to 37.425MW
with significant increase in plant thermal
efficiencies from 33.279% to 36.855%.
Therefore, decrease in inlet air temperature
brings about an increase in power output
and thermal efficiency.
REFERENCES
Zhang, W., Chen, L., Sun, F. (2009).
Performance Optimization for an open
cycle gas turbine power plant with a
refrigeration cycle for compressor inlet
air cooling. Part 2: power and efficiency
optimization. Proceedings of the
Institution of Mechanical Engineers, Part
A. Journal of Power and Energy 223 (5),
pp.515-522
Mohanty, B., Paloso, G. (1995).
Enhancing gas turbine performance by
intake air cooling using an absorption
chiller. Heat Recovery Systems and CHP
15 (1995) 41-50
Ana P.P., Claudia, R.A, Edision, L.Z.
(2012). Comparison of different gas
turbine inlet Air cooling methods. World
Academy of science, Engineering and
Technology 61˸40–45
Hall, A.D., Strover, J.C., Breisch, R.L.
(1994). Gas turbine inlet air chilling at a
cogeneration facility. Transaction of the
American society refrigerating, and air
conditioning engineers.100(1994)595–
600
Tobi, A.I. (2009). Performance
enhancement of gas turbines by inlet
cooling. International conference on
communication, computer and power
(ICCCP’09) Muscat, February
15‒18˸165‒170
Dawaud, B. (2005). Thermodynamic
Assessment of power requirement and
impact of different Gas Turbine Air
cooling technologies at two locations in
Oman. Applied Thermal Engineering
Vol 25, pp 1579 – 1598.
Al-Ansary, H.A. (2007). The use of
ejector refrigeration systems for turbine
inlet air cooling: a thermodynamic and
CFD study”. Proceedings of the energy
sustainability conference, Long Beach,
California, pp. 231-238.
Mahmood F.G., Mahdi, D.D (2009). A
New Approach for Enhancing
performance of a gas turbine (case study:
Khangiran Refinery). Applied energy,
86: 2750-2759.

ELK ASIA PACIFIC JOURNAL OF APPLIED THERMAL ENGINEERING
ISSN 2394-0433 (Online); EAPJATE/issn. 2394-0433/2016; Volume 1 Issue 2 (2016)
………………………………………………………………………………………………
LIST OF FIGURES:
Fig. 1. Influence of external factor on gas turbine performance [8].
Fig. 2 Schematic diagram of simple gas turbine unit
ELK ASIA PACIFIC JOURNAL OF APPLIED THERMAL ENGINEERING
ISSN 2394-0433 (Online); EAPJATE/issn. 2394-0433/2016; Volume 1 Issue 2 (2016)
………………………………………………………………………………………………
Fig.3 Flow chart model of Gas Turbine.
Fig. 4 Select thermodynamics for fluid package

ELK ASIA PACIFIC JOURNAL OF APPLIED THERMAL ENGINEERING
ISSN 2394-0433 (Online); EAPJATE/issn. 2394-0433/2016; Volume 1 Issue 2 (2016)
………………………………………………………………………………………………
Fig. 5 Parameters for the reaction in the combustion chamber
Figure 6. Process Flow sheet for Gas Turbine with mechanical refrigeration Unit

ELK ASIA PACIFIC JOURNAL OF APPLIED THERMAL ENGINEERING
ISSN 2394-0433 (Online); EAPJATE/issn. 2394-0433/2016; Volume 1 Issue 2 (2016)
………………………………………………………………………………………………
31000
32000
33000
34000
35000
36000
37000
38000
301
301
302
302
302
303
303
304
304
304
305
305
306
306
306
307
307
308
308
308
309
309
310
310
310
311
311
312
312
312
313
Ambient Temperature K
Net
Pow
er O
utpu
t (W
)
Net Power Output Without Cool ing (KW)
Net Power With Cool ing (KW)
Fig. 7 Effect of Ambient Air Temperature on Net Power Output
31
32
33
34
35
36
37
38
301
301
301
302
302
302
303
303
303
303
304
304
304
305
305
305
306
306
306
306
307
307
307
308
308
308
309
309
309
309
310
310
310
311
311
311
312
312
312
312
313
313
Ambient Temperature (K)
Ther
mal
Effi
cien
cy %
Thermal Efficiency (No Cool ing)
Thermal Efficiency (Cool ing)
Fig. 8. Effect of Ambient Air Temperature on Thermal Efficiency

ELK ASIA PACIFIC JOURNAL OF APPLIED THERMAL ENGINEERING
ISSN 2394-0433 (Online); EAPJATE/issn. 2394-0433/2016; Volume 1 Issue 2 (2016)
………………………………………………………………………………………………
0.185
0.19
0.195
0.2
0.205
0.21
0.215
0.22
0.225
301
301
301
302
302
302
303
303
303
303
304
304
304
305
305
305
306
306
306
306
307
307
307
308
308
308
309
309
309
309
310
310
310
311
311
311
312
312
312
312
313
313
Ambient Temperature (K)
Spec
ific
Fuel
Co
nsu
mp
tio
n (K
g/K
wh
)Speci fic Fuel Consumption (No Cool ing)
Speci fic Fuel Consumption (Cooled)
Fig. 9 Effect of ambient air temperature on specific fuel consumption
9000
9200
9400
9600
9800
10000
10200
10400
10600
10800
11000
301
301
301
302
302
302
303
303
303
303
304
304
304
305
305
305
306
306
306
306
307
307
307
308
308
308
309
309
309
309
310
310
310
311
311
311
312
312
312
312
313
313
Ambient Temperature (K)
Net
Sta
tio
n H
eat
Rat
e (K
J/K
wh
)
Net Station Heat Rate (No Cool ing)
Net Station Heat Rate (Cooled)
Fig. 10 Effect of ambient air temperature of heat rate
ELK ASIA PACIFIC JOURNAL OF APPLIED THERMAL ENGINEERING
ISSN 2394-0433 (Online); EAPJATE/issn. 2394-0433/2016; Volume 1 Issue 2 (2016)
………………………………………………………………………………………………
LIST OF TABLES:
Table 1. Operating data for Gas Turbine Unit
Compressor inlet temperature (T1) 27.63oC
Compressor discharge pressure (P2) 6.4bar
Compressor discharge temperature (T2) 308.80C
Exhaust temperature (T4) 365.31oC
Table 2. Data use in incorporating Mechanical Refrigeration System into Gas Turbine
S/N OPERATING PARAMETERS VALUE UNIT
1 Mass flow rate of air am 208.69 Kg/s
2 Mass flow rata of fuel fm 2.050 Kg/s
3 Mass flow rate of exhaust exhm 210.74 Kg/s
4 Pressure of fuel gas 2280 Kpa
5 Temperature of fuel gas 328 K
6 Intake temperature to compressor 290.142 K
7 Intake pressure to compressor 101.3 Kpa
8 Exit temperature from compressor 491.7 K
9 Exit pressure from compressor 640 Kpa
10 Turbine pressure 620 Kpa
11 Turbine temperature 917 K
12 Exhaust temperature 577.9 K
13 Exhaust pressure 101.3 Kpa
14 Evaporator temperature 298.1 K
15 Evaporator pressure 243.71 Kpa
17 Centrifugal compressor temperature 312.6 K
18 Condenser temperature 303.1 K
19 Condenser pressure 1154.47 Kpa
20 Expansion valve temperature 246.8 K
21 Isentropic efficiency of compressor 100 %
22 Isentropic efficiency of turbine 100 %
23 Specific heat capacity of air 1.005 kJ/kgK
24 Specific heat capacity of exhaust gas 1.15 kJ/kgK
25 Pressure ratio 6.317
26 Lower heating value of fuel 50,000 kJ/kg
27 Combustion efficiency 99 %
28 Pressure drop in combustion chamber 2 %

ELK ASIA PACIFIC JOURNAL OF APPLIED THERMAL ENGINEERING
ISSN 2394-0433 (Online); EAPJATE/issn. 2394-0433/2016; Volume 1 Issue 2 (2016)
………………………………………………………………………………………………
Table 3. Simulated result obtained at simple type gas turbine unit
S/N Result of simulated simple type gas turbine Values
1 Compressor power 50255.194kW
2 Turbine power 84049.196kW
3 Net power 33794.002kW
4 Specific fuel consumption 0.2183819kg/kWh
5 Thermal efficiency 33.279%
6 Heat rate 10809.906kJ/kWh
Table 4. Simulation result of incorporating air intake cooling system (Mechanical Refrigeration
system)
S/N Results of simulation Value
1 Compressor power 41338.639kW
2 Refrigeration compressor power 91.375kW
3 Turbine power 80655.259kW
4 Net power 37425.866kW
5 Thermal efficiency 36.855%
6 Specific fuel consumption 0.197kg/kWh
7 Heat rate 9761.157kJ/kW
8 Regeneration heat effects 370.67KW