Embed Size (px)
Citation preview
1
The 5th International Symposium - Supercritical CO2 Power Cycles March 29 to 31, 2016, San Antonio, Texas
Simulation of a Direct Fired Oxy-Fuel Combustor for sCO2 Power Cycles
Jacob Delimont, Ph.D. Southwest Research Institute
San Antonio, Texas, USA [email protected]
Aaron McClung, Ph.D. Southwest Research Institute
San Antonio, Texas, USA [email protected]
Marc Portnoff Thar Energy
Pittsburg, PA, USA [email protected]
ABSTRACT Direct fired oxy-fuel combustion as a heat source for a variety of supercritical carbon dioxide power
cycles is a promising method for providing heat input for a power cycle. The combustor component in
this type of cycle is an active area of ongoing research. The combustion within super critical carbon
dioxide a pressures above 200 bar and with inlet temperature is an area that has not been
experimentally explored. Reaction kinetics were explored and input in to ANSYS CFX software which was
used to explore various auto ignition type combustor geometries. A discussion of the modelling
techniques used within ANSYS CFX and the difficulties encountered will presented. Various injector
configurations will be examined and metrics will be used to compare the various configurations.
Conclusions regarding the autoignition style of direct oxy-fuel combustor will also be drawn. It was
determined that injection fuel 24 inches upstream of the oxygen injection plane resulted in the best
combustor design. This design resulted in complete combustion, good outlet temperature mixing, and
no excessive flame or wall temperatures.
INTRODUCTION Supercritical carbon dioxide (sCO2) power cycles offer a method to achieve a highly efficient
conversion of fossil fuel into electrical power. In addition, the ease with which carbon capture can be
implemented on a direct fired version of this cycle makes them extremely attractive for future base load
power generation. Most proposed sCO2 power cycles require a high degree of recuperation within the
cycle in order to achieve their high efficiencies. This results in a narrow thermal input window for a fossil
fuel combustor than many more traditional cycles. This leads to higher combustor inlet temperature
than many more traditional combustors would experience. In addition sCO2 power cycles operate at
pressures ranging from 150 to 300 bar. The combination of the narrow thermal input window and high
operating pressure is quite different from traditional combustion processes used in currently operating
fossil-based power plants.
There are a significant number of challenges associated developing a combustor for a direct fired
sCO2 power plant. As previously mentioned, the extremely high pressure and high inlet temperature are
different than a traditional combustion system. In addition, in order to achieve water and CO2 as the
only products of combustion, it is necessary to use an oxy-fuel combustor. The use of an oxy-combustion
system adds another level of complexity to the combustion system and increases the difficulty of the
design task.

2
Direct fired oxy-fuel combustion also offers a path to a higher fuel to bus bar efficiency than many
indirect power cycles do. The efficiencies projected for a plant operating this type of power cycle are
greater than 50%. One of the other major benefits of using a direct fired oxycombustor is the ability to
capture all of the CO2 generated from the combustion process. Since the combustion processes take
place at such a high pressure, even after expansion through a turbine, the CO2 is still at an elevated
pressure and sequestration ready. Given these advantages, the considerable effort to develop a direct
fired oxy-combustor is warranted.
INITIAL ANALYSIS The analysis performed in this paper utilizes oxy fuel cycle calculations found in the work of McClung
et al. [1]. This work shows that for a recompression or condensation cycle, the combustor inlet
temperature is in +800°C range with the outlet temperature at 1200°C. This temperature is high enough
that auto ignition processes will govern the combustion ignition. This simplifies the combustor design
because the combustor does not require flame holders. This also simplifies the mechanical design,
because of the difficulty in maintaining adequate life in flame holding components which are heated to
the extreme temperatures which are seen within the combustor.
The analytical analysis performed was focused on determining the geometry thought to be most
appropriate for the combustor. It was determined fairly early on in the process that the simplest oxy-fuel
combustor that would work effectively would be a tube with jets of O2 and fuel injected into the cross
flow. This jet-in-cross-flow arrangement generated a vortex pair which promotes mixing. This mixing
should allow the combustion products to be fairly evenly distributed by the exit of the burner section.
The other major portion of the analytical analysis was calculating a first guess at what the hole
diameter should be for the fuel and oxidizer injector ports. The correlations used to do this calculation
were limited to fluids with the same density as the mainstream flow [2]. For the fuel, this is
approximately true; but for the oxidizer, it is not true. Still, it was decided that this approximation would
be adequate for the first round of analysis with modifications to the hole size made after examining the
preliminary CFD results. It was also determined that the ports would be of different diameters for both
the oxidizer and the fuel.
CFD MODELING SETUP
The combustion modeling for this project was accomplished using the CFD program Ansys CFX. From
the basic analytical calculations, it was determined that the a 3-inch diameter pipe size would allow for a
relatively slow flow in order to keep the pipe length for an appropriate residence time, while still
maintaining high enough velocity to ensure strong turbulent mixing. The computational domain was
created in Solidworks and the meshing was accomplished using Ansys Workbench meshing tool.
Solutions were then run and the chemistry was evaluated, as well as performance with regards to
convergence. The CFX time step was handled carefully, as some simulations tended to have convergence
issues at larger time steps.
An unstructured Ansys workbench mesh was chosen for the simplicity of the meshing operation. The
mesh had a boundary layer inflate layer, as shown below in Figure 1. The overall mesh size was between
3 and 4 million elements, depending on the number of injector ports and other geometry changes that
were explored. A mesh independence study was conducted at the beginning of this study using the

3
initial single oxidizer, single fuel injection port. Runs of 2 million, 4 million, 8.5 million, and 17 million
elements were used. Various inflation layers were used as well. Since most of the combustion processes
take place in the main core of the flow, as well as the relative simplicity of the geometry, the inflation
layers in the boundary were found not to play a major role in the overall results. Additionally, the
4 million element case was found to produce mesh independent results.
Figure 1. Mesh generated using Ansys Workbench meshing
COMBUSTION MODELING
An extremely reduced chemical kinetics model was developed for use with the CFD simulation. It
was determined that the combustion in the autoignition style combustor is nearly completely mixing
limited thus the chemical kinetics used are not extremely important as long as the correct heat release is
obtained. The reduced model used is shown below in the form of two Arrhenius equations that are the
variable values for each of the two possible cycle configurations.
0.95 𝐶𝐻4 + 0.05 𝐶2𝐻6 + 1.55 𝑂2 → 2.05 𝐻2𝑂 + 1.05 𝐶𝑂 𝑟1 = 𝐴1𝑇𝑛1𝑒−𝐸𝑎1𝑅𝑇 [𝐶𝐻4]𝑎1[𝐶2𝐻6]𝑎1[𝑂2]𝑏1
𝐶𝑂 + 0.5 𝑂2 → 𝐶𝑂2 𝑟2 = 𝐴2𝑇𝑛2𝑒−𝐸𝑎2𝑅𝑇 [𝐶𝑂]𝑎2[𝑂2]𝑏2

4
Cycle Recompression Condensation
Pressure (bara) 200 200
A1 1.20e14 1.00e13
Ea1 4.78e04 4.78e04
n1 0.0 0.0
a1 0.4 0.3
b1 0.8 0.7
A2 8.50e10 3.00e11
Ea2 4.00e04 4.00e04
n2 0.0 0.0
a2 1.0 1.0
b2 0.5 0.5
CFD SIMULATIONS Many different geometries were explored as part of the actual CFD simulations. Some of the major
issues were the exploration of hole diameter that should be used for the injectors, the number injectors,
the clocking (or angle) of the injector holes, and the spacing between the injectors. All of these different
parameters were explored, and results presented in this report show the resultant solutions for many of
these geometries. Metrics were developed to determine which of the geometries was the best for use in
the final design. Finally, a comparison of all of the different geometries clearly shows some of the
concepts that should be included in the final design.
One of the first, most important areas to explore was injector hole diameter. This parameter was first
estimated for both the oxidizer and the fuel port, as described in the preliminary analysis section. There
were several CFD runs done with hole sizes significantly smaller than the initial analysis suggested. This is
because both the oxidizer and fuel are entering the combustor at a fairly cold temperature, and the CO2
is at 800°C for the condensation cycle case. The higher density allows the cold fuel and oxidizer to
penetrate significantly farther into main flow than predicted. Figure 2 shows a temperature contour of
this simulation with this characteristic. It was also found that when two holes were aligned immediately
downstream of each other, the second jet would cross through the center of the vortex pair generated
from the first hole. This decreased the rate of momentum loss of the second hole’s jet and allowed it to
penetrate further into the stream than it otherwise would. This along with the extremely high flame
temperatures associated with having the fuel and oxidizer eject in such close proximity, made the
aligned-hole case appear less favorable.

5
Figure 2. Example result from a smaller than ideal hole size
The equations used to size the fuel and oxidizer injection jets assume the jet and the main flow to
have nearly the same density. The image in Figure 3 shows the effect of the low density of the fuel when
compared with the oxidizer, with the upstream hole being the fuel, and the downstream hole being the
oxidizer. The mixture of methane and ethane has a density that is much lower than that of the oxidizer.
Thus, it is not able to carry as far into the main flow as the oxidizer.
Figure 3. Streamline colored for temperature showing an example of low density of fuel (upstream hole) relative to main flow causing poor penetration into the combustor chamber

6
Several additional iterations were run to find the correct hole sizes. It was necessary to repeatedly
decrease the size of the fuel hole to achieve adequate penetration into the main flow. The final hole
sizes are shown in Table 1. The example streamline image shown in Figure 4 shows the penetration
achieved by both the methane, which is injected via the vertical and horizontal axis ports, and the
oxidizer, which is clocked 45° from the horizontal in this four-port case.
Table 1. Final injector port sizes for condensation cycle
Fuel Oxygen
2-Hole Diameter (inch) 0.055 0.15
4-Hole Diameter (inch) 0.027 0.075
Figure 4. Final hole sizes for the four-hole each of fuel and oxidizer
Several different metrics were selected with which to evaluate the various geometry cases. The
metrics selected are as follows:
Maximum Wall Temperature – This metric is the maximum temperature seen at the wall.
Temperatures that are too high could damage the combustor walls, causing melting or other
damage
Maximum Overall Temperature – The maximum temperature seen anywhere in the
combustor domain. An extremely elevated temperature is going to be out of range of the
reduced-order mechanism, making the results suspect
Temperature Spread at the Outlet – The minimum temperature subtracted from the
maximum temperature of the combustor outlet. This metric generally shows the level of the
thermal gradient mixing that has occurred by the outlet plane of the combustor. A low value
of this will prevent local hotspots from damaging downstream components.

7
Percent Unburned Fuel – All the results indicate a small amount of unburned fuel remaining
in the flow. Very large percentages of this indicate incomplete mixing of fuel and oxidizer is
occurring and the geometry is not suited for the combustor.
The first two metrics were the first two that were examined on each run. If the wall temperature was
too high or the maximum flame temperature was too high, then it was determined that the particular
geometry being analyzed was unsuitable and no comparison of the last two metrics was necessary. If the
combustor configuration was suitable using the first two metrics, then the temperature spread at the
outlet and the percent unburned fuel metrics were used to further distinguish the two cases.
CFD RESULTS
A very large number of CFD runs were done as part of this project. Three different cases will be
discussed in detail in this section. The three cases are: the 4-hole case with a 45° clocking between the
fuel and the oxidizer injection, a second 4-hole case with 11.25° clocking between the fuel and the
oxidizer, and the 4-hole case with a 24-inch upstream injection of the fuel. Contours of temperature, as
well as plots of the mean and maximum temperature along the length of the combustion chamber, offer
insight into the combustion processes that are occurring in each case. The different metrics are shown
and compared, and a selection is made of the best configuration.
The four-hole configuration shows good promise for yielding a well-mixed outlet flow while
maintaining a relatively low flame and wall temperatures. The clocking between the position of the fuel
and the oxidizer holes is set to 45° in this particular simulation. Temperature contours of the results can
be seen in Figure 5. These results show cut plane contours of temperature starting just before the fuel
and oxidizer and injected and downstream from that point. The fuel and oxidizer are injected and begin
to react almost immediately. At the mixing plane between the fuel and oxidizer, the reaction is at it
hottest. In this case, this high temperature region is kept well away from the walls. Figure 6 shows how
the maximum temperature spikes in the first half of the combustor, where almost all of the chemical
reaction takes place. The remaining half of the combustor primarily allows for the hot regions of highest
temperature to mix with regions of lower temperature. The 45° clocking of the fuel ports from the
oxidizer ports allows for a relatively gradual combustion rate as compared to aligned cases or other
cases, where there are regions of very high proportions of fuel and oxidizer compared to CO2 diluent.

8
Figure 5. Temperature contours of four-hole 45° clocked case
Figure 6. Temperature conditions along the four-hole 45° clocking combustor length
1000
1100
1200
1300
1400
1500
1600
1700
1800
1900
2000
0.00 0.20 0.40 0.60 0.80 1.00
Tem
pe
ratu
re (
K)
Distance (m)
Ave Temperature (K)
Max Temperature (K)
9
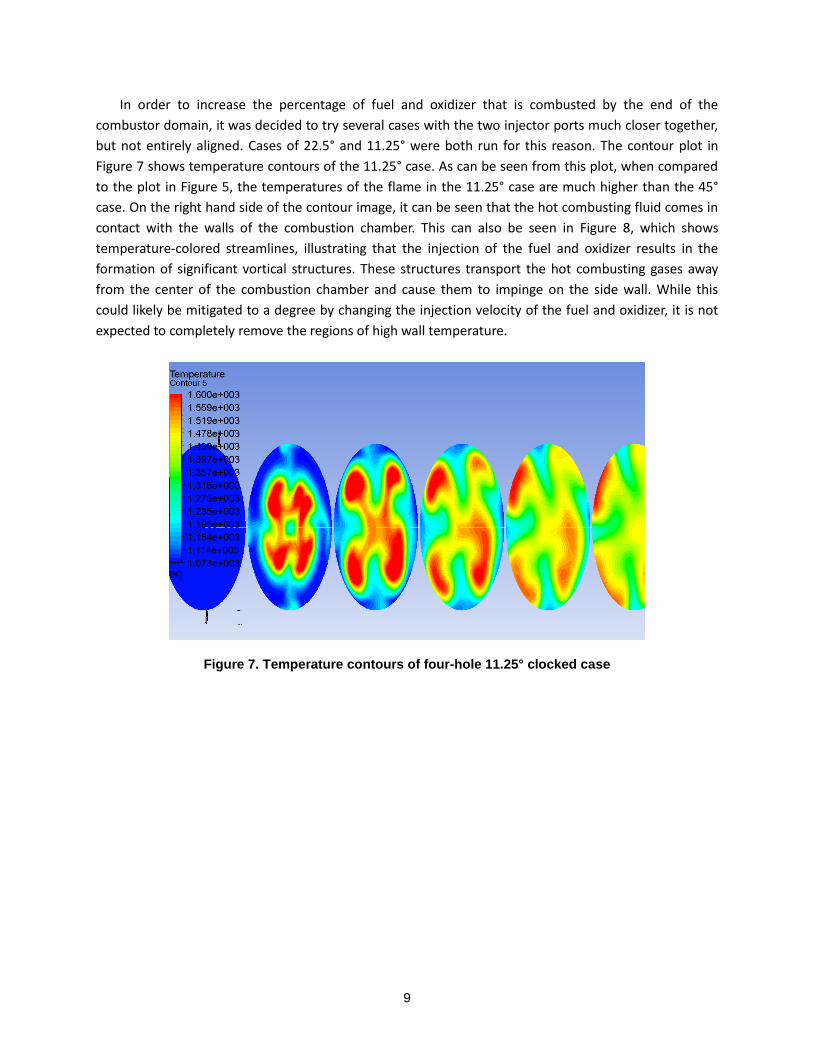
In order to increase the percentage of fuel and oxidizer that is combusted by the end of the
combustor domain, it was decided to try several cases with the two injector ports much closer together,
but not entirely aligned. Cases of 22.5° and 11.25° were both run for this reason. The contour plot in
Figure 7 shows temperature contours of the 11.25° case. As can be seen from this plot, when compared
to the plot in Figure 5, the temperatures of the flame in the 11.25° case are much higher than the 45°
case. On the right hand side of the contour image, it can be seen that the hot combusting fluid comes in
contact with the walls of the combustion chamber. This can also be seen in Figure 8, which shows
temperature-colored streamlines, illustrating that the injection of the fuel and oxidizer results in the
formation of significant vortical structures. These structures transport the hot combusting gases away
from the center of the combustion chamber and cause them to impinge on the side wall. While this
could likely be mitigated to a degree by changing the injection velocity of the fuel and oxidizer, it is not
expected to completely remove the regions of high wall temperature.
Figure 7. Temperature contours of four-hole 11.25° clocked case

10
Figure 8. Temperature colored streamlines showing high levels of non-streamwise transport
Figure 9 shows the average and maximum temperature along the combustion chamber in the
streamwise direction. The large spike just downstream of the fuel and oxidizer injection zone indicates a
very high flame temperature. This was also seen in the contour plot in Figure 7. Following the
completion of most of the combustion, which happens very rapidly, the hot and cold portions of the flow
continue to mix together for the remainder of the length of the combustor. This results in a lower
temperature spread at the outlet, and a relatively low level of unburnt fuel, but the wall temperature
and the maximum temperature are very high. This high wall temperature makes this design unsuitable
for the combustor.
Figure 9. Temperature conditions along the four-hole 11.25° combustor length
The next case described in detail is the case in which the fuel in injected 24 inches upstream of the
oxidizer injection point. This case has four holes for fuel injection and four for the oxidizer injection. The
clocking for the case is at 45°, but that is not expected to be significant due to the amount of diffusion of
the fuel into the CO2 before the plane of the oxygen injection. The temperature contour results from this
case are shown in Figure 10. This image shows that the flame temperature in this case is much lower
1000
1100
1200
1300
1400
1500
1600
1700
1800
1900
2000
0.00 0.20 0.40 0.60 0.80 1.00
Tem
pe
ratu
re (
K)
Distance (m)
Ave Temperature (K)
Max Temperature (K)

11
than the previous two cases examined. This is unsurprising, given the level of mixing of the fuel that has
occurred prior to the oxygen injection. Essentially, this method relies on the mixing of the oxygen into
the fuel-CO2 mixture to control the flame. This also means that it is more reliant than other cases on
getting full mixture of the oxygen into the main stream to achieve complete combustion. Figure 11
shows the entire length of the combustion chamber, including the 24 inch upstream segment where the
fuel mixes into the main flow. As can be seen in the graph, the introduction of the fuel into the main flow
actually lowers the temperature of the main flow in the first 24 inches, but when the oxygen is injected,
the combustion process starts. The combustion process takes more distance than in the previous two
examples because of the need for the oxygen to fully mix with the main flow, as opposed to the fuel and
oxidizer both being injected into roughly the center of the combustion tube at the same time.
Figure 10. Temperature contours of four-hole 11.25° clocked case
Figure 11. Temperature conditions along the length of the four-hole 24-inch upstream fuel injection case
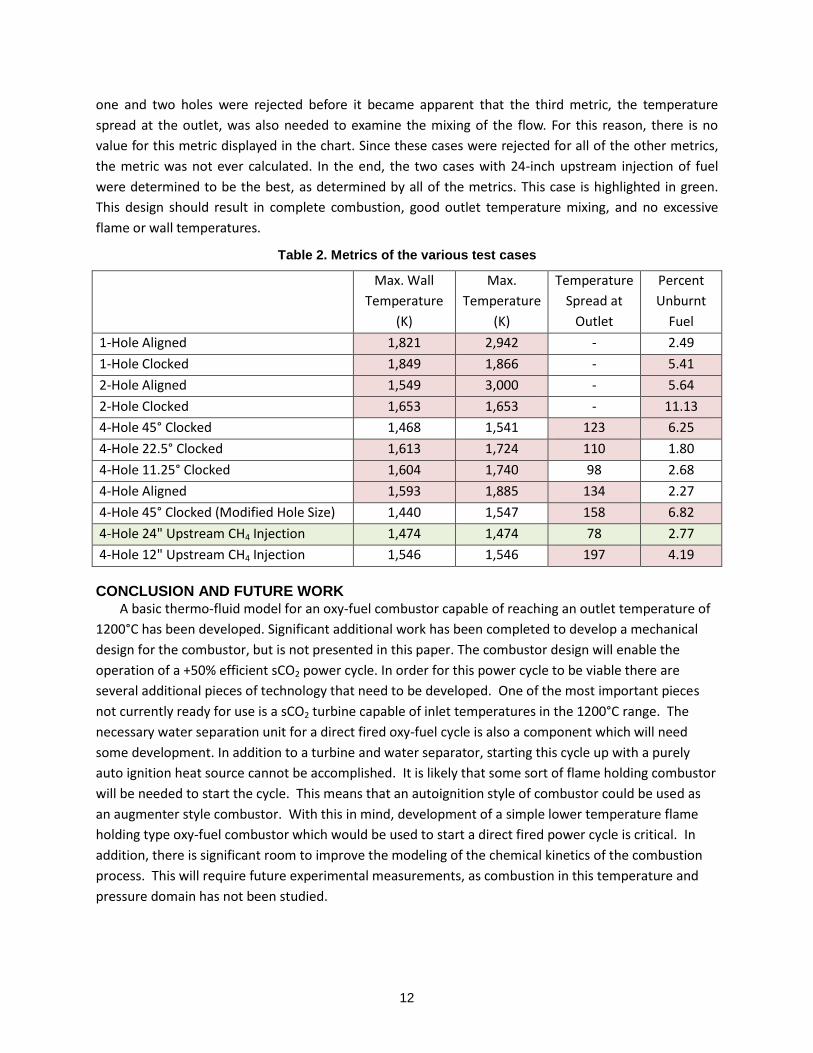
DISCUSSION The results of the different cases are shown with the values of the metrics in Table 2. Cases in which
the value for the metric was too high and rejected are highlighted in red. Many of the early cases with
1000
1100
1200
1300
1400
1500
1600
0.00 0.50 1.00 1.50 2.00
Tem
pe
ratu
re (
K)
Distance (m)
Ave Temperature (K)
Max Temperature (K)
12
one and two holes were rejected before it became apparent that the third metric, the temperature
spread at the outlet, was also needed to examine the mixing of the flow. For this reason, there is no
value for this metric displayed in the chart. Since these cases were rejected for all of the other metrics,
the metric was not ever calculated. In the end, the two cases with 24-inch upstream injection of fuel
were determined to be the best, as determined by all of the metrics. This case is highlighted in green.
This design should result in complete combustion, good outlet temperature mixing, and no excessive
flame or wall temperatures.
Table 2. Metrics of the various test cases
Max. Wall
Temperature
(K)
Max.
Temperature
(K)
Temperature
Spread at
Outlet
Percent
Unburnt
Fuel
1-Hole Aligned 1,821 2,942 - 2.49
1-Hole Clocked 1,849 1,866 - 5.41
2-Hole Aligned 1,549 3,000 - 5.64
2-Hole Clocked 1,653 1,653 - 11.13
4-Hole 45° Clocked 1,468 1,541 123 6.25
4-Hole 22.5° Clocked 1,613 1,724 110 1.80
4-Hole 11.25° Clocked 1,604 1,740 98 2.68
4-Hole Aligned 1,593 1,885 134 2.27
4-Hole 45° Clocked (Modified Hole Size) 1,440 1,547 158 6.82
4-Hole 24" Upstream CH4 Injection 1,474 1,474 78 2.77
4-Hole 12" Upstream CH4 Injection 1,546 1,546 197 4.19
CONCLUSION AND FUTURE WORK
A basic thermo-fluid model for an oxy-fuel combustor capable of reaching an outlet temperature of
1200°C has been developed. Significant additional work has been completed to develop a mechanical
design for the combustor, but is not presented in this paper. The combustor design will enable the
operation of a +50% efficient sCO2 power cycle. In order for this power cycle to be viable there are
several additional pieces of technology that need to be developed. One of the most important pieces
not currently ready for use is a sCO2 turbine capable of inlet temperatures in the 1200°C range. The
necessary water separation unit for a direct fired oxy-fuel cycle is also a component which will need
some development. In addition to a turbine and water separator, starting this cycle up with a purely
auto ignition heat source cannot be accomplished. It is likely that some sort of flame holding combustor
will be needed to start the cycle. This means that an autoignition style of combustor could be used as
an augmenter style combustor. With this in mind, development of a simple lower temperature flame
holding type oxy-fuel combustor which would be used to start a direct fired power cycle is critical. In
addition, there is significant room to improve the modeling of the chemical kinetics of the combustion
process. This will require future experimental measurements, as combustion in this temperature and
pressure domain has not been studied.

13
WORKS CITED
[1] A. McClung, K. Brun and J. Delimont, "Comparison of Supercritical Carbon Dioxide Cycles for Oxy-
Combustion," in ASME Turbo Expo, Montreal, 2015.
[2] L. J. Forney, "Jet Injection for Optimum Pipeline Mixing," in Mixing Phenomena and Practices, pp.
660-690.