Embed Size (px)
Citation preview

International Journal of Scientific & Engineering Research Volume 11, Issue 4, April-2020 443
ISSN 2229-5518
IJSER © 2020
http://www.ijser.org
Simulation based comparative study of Gasoline Direct Injection and Multi-Port Fuel Injection
Engines Nikhil Katti
Abstract— Since the discovery of IC engines, decades of research have been focused on improving the performance and efficiency of the engine. In the
recent decade, there have been increasing concerns regarding the environmental effects engines have and hence there is a need for more fuel-efficient and
fewer emissions in an engine. GDI engines have played a major role in the past decade to improve upon the fuel economy with cleaner emissions. On the
other hand, a PFI engine that has a similar fuel system is used more widely in the market in high-performance vehicles. Though the market for GDI
engines is increasing, it has not made a mark in regions other than Europe and the US where the emission norms are rigid. In this case, we have
compared both these engines having similar dimensional attributes using a standard KTM Duke 390 engine which is a PFI engine and simulated the
results using Lotus engine simulation software. The research has been carried out at various speed levels to observe the performance changes for
changing RPMs. As this is a simulation-based study the results observed could inaccurately depict the practical scenario but these results could help in
understanding the difference in these two fuel systems to the basic level.
Index Terms— Gasoline Direct Injection, Port fuel Injection, KTM Duke 390, Lotus Engine Simulation, Engine Performance.
—————————— ——————————
1 INTRODUCTION
HIS research aims to develop a comparative study between var-
ious aspects of GDI engines and MPFI engines. In commercial
terms MPFI engines are widely used due to their low cost and
high power output whereas GDI engines being more fuel efficient
and develop lesser emissions compared to most of the commercial
engines.
This study majorly focuses on the comparison between the
MPFI engines and GDI engines based on their performance criteria
like Brake Torque, Brake Power, BMEP, BSFC and Volumetric effi-
ciency keeping the dimensional attributes same across both the en-
gines. This is a simulation based study using software named Lotus
Engine Simulation V 5.07 developed by Lotus Cars Ltd.
The main objective of this study was to understand the
difference in the performance criteria of two engines which are simi-
lar in architecture but serve different purposes like MPFI engine
which gives a high power output and hence being less fuel efficient
whereas GDI engine is more fuel efficient and produces cleaner
emissions compared to MPFI.
The research aims to prove the above practical scenario
though the simulation done on a standard KTM Duke 390 engine
which is a single cylinder MPFI engine.the article is being submitted
to and the manuscript identification number. Click the forward arrow
in the pop-up tool bar to modify the header or footer on subsequent
pages.
2 METHODOLOGY
The methodology used for the research is comparative type of simu-
lation based study where two systems are simulated under similar
test conditions considering its principle differences in design and
working. In this case MPFI engine and GDI engine are the two sys-
tems under consideration and the simulation is carried in as standard
industrial purpose engine simulation software called Lotus Engine
Simulation.
3 RESEARCH DESIGN
Initially as a prerequisite to the simulation we need to gather the
dimensional and material data for various parameters for the compo-
nents like inlet valve, intake port, engine cylinder, outlet valve, outlet
port. These data have to be entered into the software and then the test
conditions have to be declared and later the simulation is to be per-
formed.
The results of the simulation have to be compared and then it is to
be analysed. Finally the research has to be concluded and compared
with the research aims
4 TOOLS
Initially to gather the physical data from the KTM Duke 390 engine
measuring tools such as bore gauge and vernier callipers and later
the major tool used was Lotus Engine Simulation software where the
Simulation of both the MPFI engine and GDI engines were carried
out
T
————————————————
Nikhil Katti is currently pursuing Bachelors degree program in Mechanical engineering in KLE Technological University,India,
E-mail: [email protected]
IJSER

International Journal of Scientific & Engineering Research Volume 11, Issue 4, April-2020 444
ISSN 2229-5518
IJSER © 2020
http://www.ijser.org
5 PROCEDURE
First the various physical measurements of the KTM Duke 390 en-
gine were done. It mainly involved parameters from components like
inlet port and valve, engine cylinder and exhaust port and valve.
Later these values were fed into the Lotus Engine Simulation Soft-
ware.
Step 1: Initially a standard engine module is imported from the side
panel
Figure 2: Full engine model in LES workspace
Step 2: Then the type of fuel is and fuel system is decided. In this
case the fuel remains the same for both the iterations i.e. Gasoline
and the fuel system is iterated between Port injection and direct in-
jection
Step 3: In the engine model the Cylinder parameters of KTM Duke
390 are entered
TABLE 1 DIMENSIONAL PARAMETERS OF THE ENGINE
Step 4: The parameters for Port Flow Data and Intake Valve data is
entered
Figure 3: Graph of Valve lift vs. Flow Co-efficient for intake port
Figure 4: Graph of CAM angle vs. Lift for intake valve
Step 5: Similarly the Port flow data and Exhaust valve data is entered
Step 6: Finally the test conditions are defined which remains same
for both PFI and GDI engines
6 TEST CONDITIONS
After defining all the above parameters the test is simulated for an
RPM from 1000 to 10500 with an increment of 500 RPM under
normal temperature and pressure conditions.
IJSER

International Journal of Scientific & Engineering Research Volume 11, Issue 4, April-2020 445
ISSN 2229-5518
IJSER © 2020
http://www.ijser.org
Figure 5: Overall Test Conditions for both the engines
7 RESULTS
After running the Simulation for the above test conditions the Re-
sults were obtained and manually plotted in the tables below.
Table 2 contains the Performance results for MPFI engines
with performance data entered against the speed from 1000 to 10500
RPMs with an increment of 500, while Table 3 contains the Perfor-
mance results for GDI engines.
TABLE 2 RESULTS OBTAINED FOR MPFI ENGINE
TABLE 3 RESULTS OBTAINED FOR GDI ENGINE
8 ANALYSIS OF RESULTS
From the numerical data obtained in the Results we can compare the
simulations of both MPFI engine and GDI engine using the Graphs
as below.
Figure 6: Comparison of Brake Power (kW) between MPFI and GDI
engine
In Figure 6, we can see that for RPMs from 1000 to 3500 the Brake
Power increases linearly and remains the same both for MPFI and
GDI engines. The lines start diverging after 4000 RPM up until
10500 RPM where we see, for higher RPMs MPFI produce more
0
5
10
15
20
25
30
35
1000
2000
3000
4000
5000
6000
7000
8000
9000
10000
Bra
ke P
ow
er
(kW
)
Engine Speed (RPM)
MPFI
GDI
IJSER
International Journal of Scientific & Engineering Research Volume 11, Issue 4, April-2020 446
ISSN 2229-5518
IJSER © 2020
http://www.ijser.org
Power compared to GDI engine. At 10500 RPM we observe that
MPFI produces 3.5% more Brake Power (kW) than GDI engine.
Figure 7: Comparison of Brake Torque (Nm) between MPFI and
GDI engine
In Figure 7 both the engines follow similar but independent paths.
MPFI has higher Brake Torque at all the RPMs compared to GDI. At
8000 RPM we see that Brake Torque of MPFI is 4.4% higher than
that of GDI engine which is the maximum difference. Hence this
states that MPFI has higher torque at all the speeds.
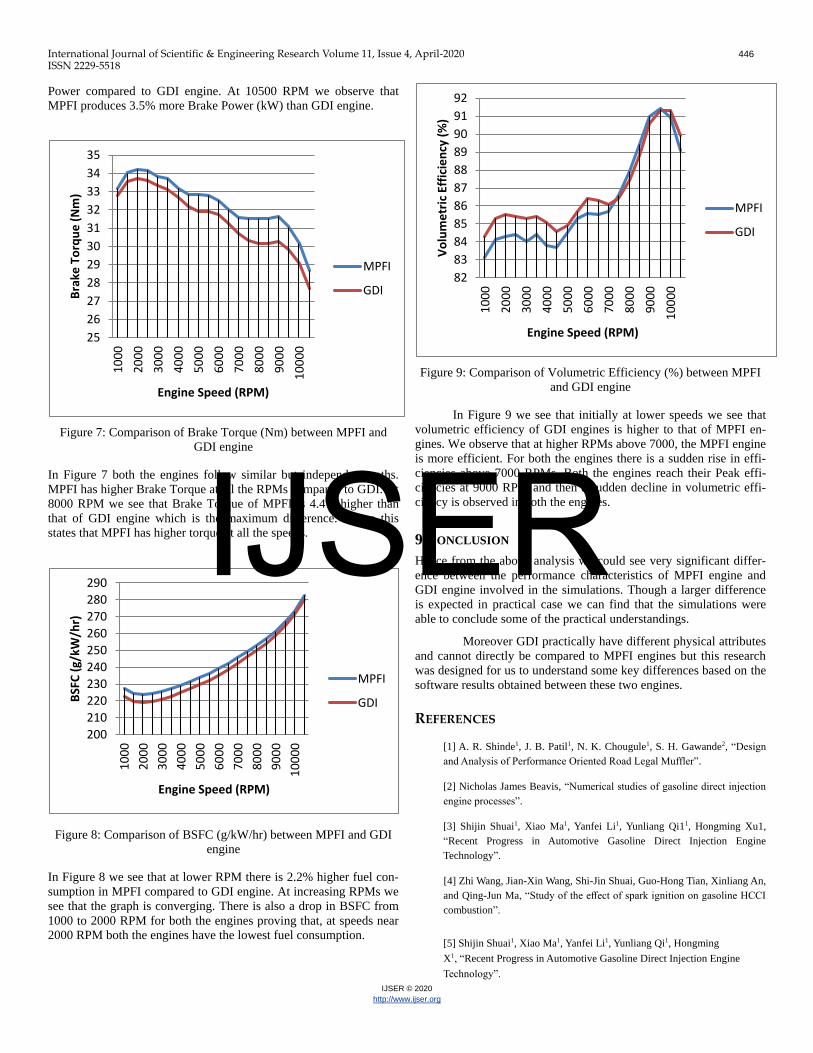
Figure 8: Comparison of BSFC (g/kW/hr) between MPFI and GDI
engine
In Figure 8 we see that at lower RPM there is 2.2% higher fuel con-
sumption in MPFI compared to GDI engine. At increasing RPMs we
see that the graph is converging. There is also a drop in BSFC from
1000 to 2000 RPM for both the engines proving that, at speeds near
2000 RPM both the engines have the lowest fuel consumption.
Figure 9: Comparison of Volumetric Efficiency (%) between MPFI
and GDI engine
In Figure 9 we see that initially at lower speeds we see that
volumetric efficiency of GDI engines is higher to that of MPFI en-
gines. We observe that at higher RPMs above 7000, the MPFI engine
is more efficient. For both the engines there is a sudden rise in effi-
ciencies above 7000 RPMs. Both the engines reach their Peak effi-
ciencies at 9000 RPM and then a sudden decline in volumetric effi-
ciency is observed in both the engines.
9 CONCLUSION
Hence from the above analysis we could see very significant differ-
ence between the performance characteristics of MPFI engine and
GDI engine involved in the simulations. Though a larger difference
is expected in practical case we can find that the simulations were
able to conclude some of the practical understandings.
Moreover GDI practically have different physical attributes
and cannot directly be compared to MPFI engines but this research
was designed for us to understand some key differences based on the
software results obtained between these two engines.
REFERENCES
[1] A. R. Shinde1, J. B. Patil1, N. K. Chougule1, S. H. Gawande2, “Design
and Analysis of Performance Oriented Road Legal Muffler”.
[2] Nicholas James Beavis, “Numerical studies of gasoline direct injection
engine processes”.
[3] Shijin Shuai1, Xiao Ma1, Yanfei Li1, Yunliang Qi11, Hongming Xu1,
“Recent Progress in Automotive Gasoline Direct Injection Engine
Technology”.
[4] Zhi Wang, Jian-Xin Wang, Shi-Jin Shuai, Guo-Hong Tian, Xinliang An,
and Qing-Jun Ma, “Study of the effect of spark ignition on gasoline HCCI
combustion”.
[5] Shijin Shuai1, Xiao Ma1, Yanfei Li1, Yunliang Qi1, Hongming
X1, “Recent Progress in Automotive Gasoline Direct Injection Engine
Technology”.
25
26
27
28
29
30
31
32
33
34
35
1000
2000
3000
4000
5000
6000
7000
8000
9000
10000
Bra
ke T
orq
ue
(N
m)
Engine Speed (RPM)
MPFI
GDI
200
210
220
230
240
250
260
270
280
290
1000
2000
3000
4000
5000
6000
7000
8000
9000
10000
BSF
C (
g/kW
/hr)
Engine Speed (RPM)
MPFI
GDI
82
83
84
85
86
87
88
89
90
91
92
1000
2000
3000
4000
5000
6000
7000
8000
9000
10000
Vo
lum
etr
ic E
ffic
ien
cy (
%)
Engine Speed (RPM)
MPFI
GDI
IJSER