Embed Size (px)
Citation preview

Simulation and thermal imaging of the 2006 EsperanzaWildfire in southern California: applicationof a coupled weather–wildland fire model
Janice L. CoenA,C and Philip J. RigganB
ANational Center for Atmospheric Research, PO Box 3000, Boulder, CO 80307-3000, USA.BPacific Southwest Research Station, USDA Forest Service, 4955 Canyon Crest Drive,
Riverside, CA 92507, USA.CCorresponding author. Email: [email protected]
Abstract. The 2006 Esperanza Fire in Riverside County, California, was simulated with the Coupled Atmosphere–Wildland Fire Environment (CAWFE)model to examine how dynamic interactions of the atmospherewith large-scale fire
spread and energy release may affect observed patterns of fire behaviour as mapped using the FireMapper thermal-imaging radiometer. CAWFE simulated the meteorological flow in and near the fire, the fire’s growth as influenced bygusty Santa Ana winds and interactions between the fire and weather through fire-induced winds during the first day of
burning. The airflowwas characterised by thermally stratified, two-layer flow channelled between the SanBernardino andSan Jacinto mountain ranges with transient flow accelerations driving the fire in Cabazon Peak’s lee. The simulationreproduced distinguishing features of the fire including its overall direction and width, rapid spread west-south-westward
across canyons, spread up canyons crossing its southern flank, splitting into two heading regions and feathering of the fireline. The simulation correctly depicted the fire’s location at the time of an early-morning incident involving firefighterfatalities. It also depicted periods of deep plume growth, but anomalously described downhill spread of the head of the fireunder weak winds that was less rapid than observed. Although capturing the meteorological flow was essential to
reproducing the fire’s evolution, fuel factors including fuel load appeared to play a secondary role.
Additional keywords: airborne remote sensing, coupled atmosphere–fire model, fire behaviour, horizontal roll vortices,Santa Ana winds.
Received 19 November 2012, accepted 7 April 2014, published online 9 July 2014
Introduction
Our ability to learn from previous wildland fire events is limited
by our understanding about how factors such as evolvingweather, fuels and terrain combine; and why. Operationalmodels such as BehavePlus (Andrews 2009) and FARSITE(Finney 1998) are used by US land management agencies to
predict themovement of wildland fires across landscapes. These‘kinematic’ models consider weather, terrain and fuels aslargely external, non-interacting variables and do not explicitly
represent the forces involved in fire propagation. In contrast,coupled weather–wildland fire models, which interactively joina description of fire behaviour with a full numerical weather
prediction model, simulate not only the direction and rate of firepropagation but also the dynamic forces that determine a fire’sevolution, including its alteration of the flow and structure of the
atmosphere by the release of heat and moisture.Here we present the application of one such interactive
model, the Coupled Atmosphere–Wildland Fire Environment(CAWFE) model, to the simulation of the 2006 Esperanza Fire,
which was ignited near Cabazon, California, and swept throughchaparral, coastal sagebrush and annual grasses along the
northern flank of the San Jacinto Mountains during a moderateSanta Ana wind event. We describe the atmospheric regime inwhich the fire occurred, summarise salient characteristics of thesimulation, analyse the sensitivity of the simulation to fuel and
modelling parameters, and compare some simulated andobserved fire properties. This work represents a test or partialvalidation of the model under complex, actual conditions.
Background
Santa Ana wind events occur when a high-pressure system overthe Great Basin drives air south-westward across the Transverseand Peninsular ranges of southern California towards low
pressure offshore. Events are typically associated with strong,gusty winds and very low relative humidity. Air crossing themountain ranges is channelled and accelerated through passesand canyons, notably in the Santa Clara River Valley, along the
CSIRO PUBLISHING
International Journal of Wildland Fire 2014, 23, 755–770
http://dx.doi.org/10.1071/WF12194
Journal compilation � IAWF 2014 www.publish.csiro.au/journals/ijwf
Santa Ana River canyon between Riverside and Orange coun-ties, below the Santa Suzanna and Cajon passes, and along
Banning Pass between the San Bernardino and San Jacintomountains (Whiteman 2000). Santa Ana events are commonfrom September through April and create the greatest fire riskwhen they coincide with low live fuel moisture during late
summer and autumn (Schroeder et al. 1964; Dennison et al.
2008). Although a strong offshore pressure gradient is indicativeof Santa Ana conditions, the strength of surface winds may be
comparably influenced by synoptic forcing such as downwardmomentum transfer from a strong upper-level offshore flow andby smaller-scale factors such as near-surface flow that is forced
by a strong temperature gradient from the high desert to the
ocean and modified by flow through complex terrain (Hughesand Hall 2010). Only a few studies have examined Santa Ana
flow dynamics, such as the breaking of gravity waves, surfacingof strong upper-level winds (Huang et al. 2009) and channellingof winds around barriers and through passes and canyons(Fosberg 1965; Fosberg et al. 1966; Ryan 1969).
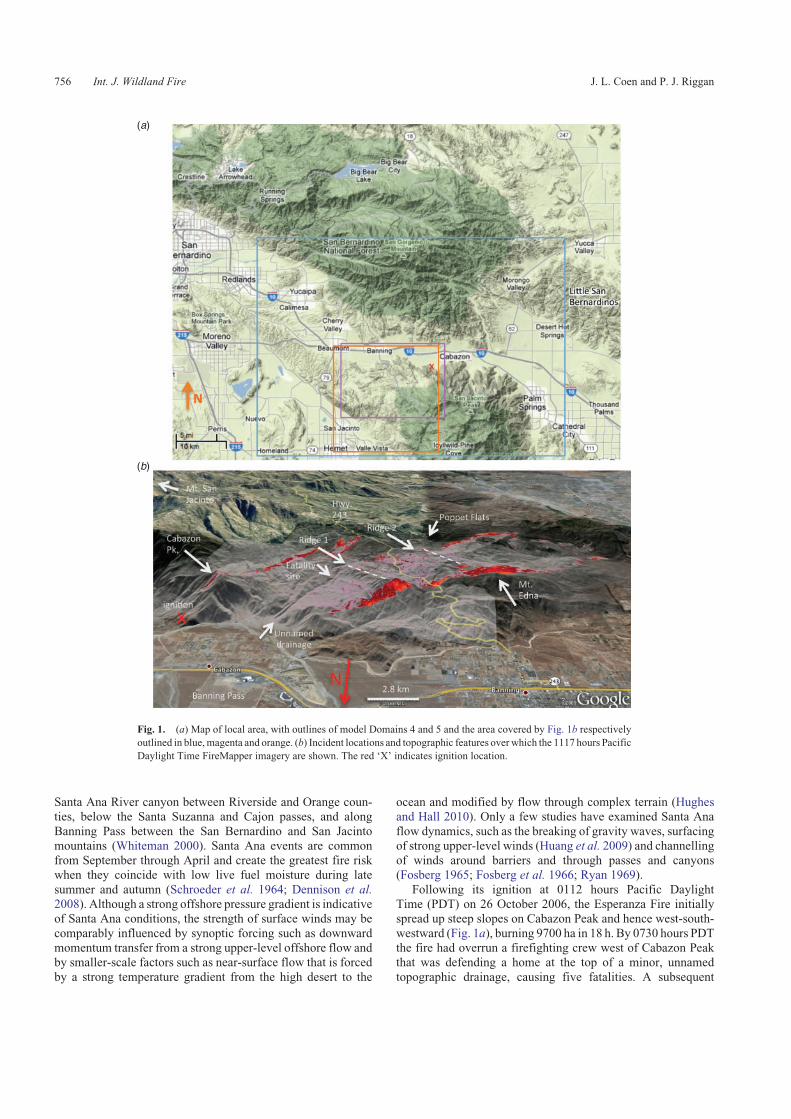
Following its ignition at 0112 hours Pacific DaylightTime (PDT) on 26 October 2006, the Esperanza Fire initiallyspread up steep slopes on Cabazon Peak and hence west-south-
westward (Fig. 1a), burning 9700 ha in 18 h. By 0730 hours PDTthe fire had overrun a firefighting crew west of Cabazon Peakthat was defending a home at the top of a minor, unnamed
topographic drainage, causing five fatalities. A subsequent
(a)
(b)
Fig. 1. (a) Map of local area, with outlines of model Domains 4 and 5 and the area covered by Fig. 1b respectively
outlined in blue,magenta and orange. (b) Incident locations and topographic features over which the 1117 hours Pacific
Daylight Time FireMapper imagery are shown. The red ‘X’ indicates ignition location.
756 Int. J. Wildland Fire J. L. Coen and P. J. Riggan

investigation of that incident described fire suppression opera-tions, fuels, weather and fire behaviour (Esperanza InvestigationTeam 2007). By containment on 30 October 2006, the fire had
burned ,16 300 ha (40 200 acres).
Model description
CAWFE couples a three-dimensional, non-hydrostatic numer-ical weather prediction model with a fire behaviour module that
describes the propagation of a wildland fire in response tospatially varying terrain and fuels, and spatially and temporallyevolving weather. The modelling system can represent thecomplex interactions between a fire and the atmosphere: low-
level winds drive spread of the fire, which releases sensible heat,latent heat and smoke into the lower atmosphere at rates thatvary in space and time according to the rate at which fuel is
consumed. The heat fluxes, in turn, feed back to affect the windsdirecting the fire.
Fire module components treat physical processes including
the flaming front’s rate of spread, post-frontal heat release,crown fire ignition and consumption, and up-scaling of heatrelease into the atmospheric model. An additional algorithm
defines the subgrid-scale interface between burning andun-ignited fuel. Because it is designed to resolve atmosphericmotions from tens of metres to hundreds of kilometres, andcombustion processes occur at scales several orders of magni-
tude smaller than that, CAWFE does not explicitly simulateflames or combustion; neither the fuel or fire temperature, northe consumption of oxygen or flammable pyrolysed gases are
tracked by this model. Instead, CAWFE parameterises thesesubgrid-scale processes by adapting semi-empirical and empiri-cal relationships. Coen (2013) described a recent version of
CAWFE; subsequent development is described below. Coenand Schroeder (2013) applied CAWFE using new satelliteremote sensing active fire-detection data to introduce a wildfirealready in progress into the model and to evaluate the simulated
growth at later times.Riggan et al. (1994) noted that in the absence of substantial
deadwood biomass, fire spreads through natural chaparral
stands only with low live fuel moisture and either wind orsteep terrain. Weise et al. (2005) developed and tested a modelto predict the probability of fire spread in living fuels in
marginal burning conditions. However, a threshold wind speedfor such sustained spread has not been determined, and indeed,there have been only limited measurements of the rate of fire
spread through chaparral, that is, during prescribed burningunder low wind velocity (Stephens et al. 2008). This thresholdbehaviour suggests that the mechanism for spread is pilotedignition of nearby shrubs by flame contact. Cheney et al. (1998)
noted that sustained spread of a heading fire through pasturesrequired a wind velocity greater than 1.4m s�1 at 10m aboveground level (AGL).We have incorporated this contact ignition
perspective into our rate of spread calculation and, untilresearch reveals what this threshold should be in other fueltypes, apply a non-zero wind coefficient (as defined by
Rothermel 1972) only at wind speeds greater than 0.55m s�1,which is Cheney et al.’s threshold adjusted by a logarithmicprofile typical of atmospheric surface layers to the 2m heighttypical of chaparral fuels.
Airborne remote sensing of the Esperanza incident
The Pacific Southwest Research Station of the US Departmentof Agriculture (USDA) Forest Service applied its airborneFireMapper thermal-imaging radiometer during the Esperanza
Fire to obtain unprecedented, high-resolution measurements ofthe behaviour across an entire wildland fire under the influenceof Santa Ana winds. The FireMapper employs a BAE Systems
(Lexington, MA) microbolometer focal plane array and twolevels of onboard calibration to measure and map upwellingthermal radiation in a broad band channel encompassing
wavelengths from 8 to 12.5 mm and narrow band channels at8.1–9.0 and 11.5–12.3mm. The latter narrow band channelprovides unsaturated data over largewildland fires. Quantitativeimage data from individual aircraft passes on 26 October were
assembled into six orthorectified maps that depicted the fire’sprogress and apparent spread rate between 1117 and 2142 hoursPDT. Radiometric temperature and radiant flux density mea-
surements at long-wave infrared wavelengths primarily areindicative of ground surface temperatures, even beneath activefire fronts, and thereby indicate radiant fire intensity, local
variations in fire energy release and flaming front depth andresidence time.
Model initialisation and experimental design
Atmospheric model initialisation
A Weather Research and Forecasting (WRF) model regionalweather simulation with two nested domains (with 30- and
10-km horizontal grid spacing) was initialised with data fromthe National Center for Environmental Prediction’s finalOperational Global Analysis and applied to simulate the period
1200 UTC 25 October 2006 (0500 hours PDT) to 1200 UTC 27October 2006. The WRF simulation provided initial conditionsand boundary conditions for the finer resolution CAWFEmodelsimulation (Fig. 1b). Terrain for the modelling domains was
derived from 0.33-, 1- and 3-arc-second elevation data. Near thefire, the terrain is dominated by Mount San Jacinto (elevation3302m) andMount SanGorgonio (elevation 3506m), which are
separated by the west–east oriented Banning Pass with a max-imum elevation of 485m (Fig. 1a).
Fuel characteristics and condition
The spatial distribution of fuel properties in CAWFE’s inner-most modelling domain (Fig. 2) was obtained from the
LANDFIRE geospatial database (see http://www.landfire.gov,accessed 19 December 2011), which was developed from sat-ellite remote sensing data and limited in-situ sampling.LANDFIRE classifies fuels into stylised fuel models using the
Albini (1976) classification system as restated by Anderson(1982). Low terrain at Banning Pass, greater Cabazon and theignition point were classified as un-vegetated or covered by
short grass; either Fuel Model 4 (mature chaparral) or FuelModel 5 (young chaparral with little dead fuel) characterisedvegetation on mid-level slopes. Fuel properties are given in
Table 1. Given that fire spread in chaparral often coincides withlow live fuel moisture (Riggan et al. 1994; Dennison et al.
2008), it is possible that fire spread in such fuels is influenced bylive fuel moisture; however, experimental studies in shrubs
Simulation and observations of Esperanza wildfire Int. J. Wildland Fire 757

(Fernandes et al. 2000; Fernandes 2001; Bilgili and Saglam2003) have not found live moisture content to have a significanteffect on rate of spread, other than a weak connection in oak
chaparral (Lindenmuth and Davis 1973). This influence couldmanifest in several ways, by affecting (1) a probability of spreadin marginal conditions (Weise et al. 2005), (2) a threshold wind
speed below which fire will not spread or (3) the rate of spreaditself. We acknowledge that live fuel moisture may affect rate ofspread, but have not included it in our formulation because there
is no evidence that distinguishes if or how live fuel moistureaffects the rate of spread in chaparral or similar fuels, andschemes for describing the live fuel moisture effect on rate of
spread in chaparral (e.g. Fosberg and Schroeder 1973) either arelargely untested or could not be applied: in one situation theyproduced a composite fuel moisture above the moisture content
of extinction. Consequently, we set fuel moisture for all fuelmodels to 6% based on diagnosed 10-h dead fuel moisture atnearby remote automated weather stations (RAWS). This
14
12
10
8
6
4
2
0
10
8
6
4
2
0201510
X (km)
Y (
km)
50
Fig. 2. Spatial distribution of fuel models in the innermost modelling domain (Domain 5), categorised by the
Anderson (1982) fuel model classification system. Fuel models are given by colour bar at right, where white
indicates no fuel. The terrain contour interval is 150m. Fuel model properties are given in Table 1. The red
‘X’ indicates the ignition location.
Table 1. Fuel models used in the innermost modelling domain
Columns show fuel properties associated with each fuel model
Fuel
model
Name Surface fuel
load (kgm�2)
Weighting
parameter,
W (s)
Surface area to
volume ratio,
s (m�1)
Fuel depth (m) Fuel moisture
content of
extinction
Canopy fuel
load (kgm�2)
Canopy fuel
burnout
time (s)
1 Short grass 0.167 7 11 483 0.305 0.12 0 –
2 Grass þ understorey 0.896 30 7500 0.610 0.15 0 –
4 Chaparral 3.591 360 4400 2.000 0.20 0 –
5 Brush 0.784 360 5100 0.667 0.20 0 –
7 Southern rough 1.091 360 5125 0.762 0.40 0 –
8 Closed timber litter 1.120 1200 2089 0.061 0.30 1.121 60
9 Hardwood litter 0.780 1200 6916 0.061 0.25 1.121 120
10 Timber litter þunderstorey
2.692 1200 2089 0.305 0.25 1.121 180
99 No vegetation 0.000 – – – – – –
758 Int. J. Wildland Fire J. L. Coen and P. J. Riggan
approach is in accordance with our hypothesis that fire propa-gation in grasses and shrubs occurs through piloted ignition of
fine, dead fuel.
Experimental design
Beginning with the atmospheric state given by the WRF simu-
lation at 2200 UTC 25 October 2006 (1500 hours PDT),CAWFE first simulated 10 h of weather before the fire’s igni-tion. During this time, CAWFE refined the horizontal grid
spacing from 10.0 km in its coarsest modelling domain (a980� 980� 15.6-km domain covering the western USA) to3.33 km, 1.11 km, 0.370 kmand 0.123 km in the finest resolution
modelling domain (a 21.0� 14.8� 6.2-km domain coveringBanning Pass and the San Jacinto Mountains) in which firegrowth is modelled. The stretched vertical grid was corre-spondingly refined. The finest domain’s first three grid levels
were located at 16, 36 and 62m, with the first half-grid level(where the lowest horizontal wind components are located) at7.9m above ground. Shear forces drove the turbulent boundary
layer’s development; solar heating of the surface was not con-sidered. The atmospheric wind was dominated by the synoptic-scale weather modified by motion over and around topographic
features, in addition to stresses produced by topographic gra-dients and surface stresses that arose from vegetation roughness.At the reported ignition time, the simulation ignited a fire in the
finest domain above the wash on the north-east side of CabazonPeak. The model simulated the subsequent 19 h of weather andfire behaviour.
A second experiment repeated the simulation without ignit-
ing a fire. Examining themathematical difference between thesetwo simulations showed to what extent the fire altered theatmospheric environment. Other sensitivity experiments varied
parameters used in applying the fire’s feedback to the atmo-sphere and tested the sensitivity of CAWFE to fuel parametersbecause these may affect simulations in a dynamic model
differently than kinematic models such as FARSITE.
Results
Simulated atmospheric flow and Santa Ana structure
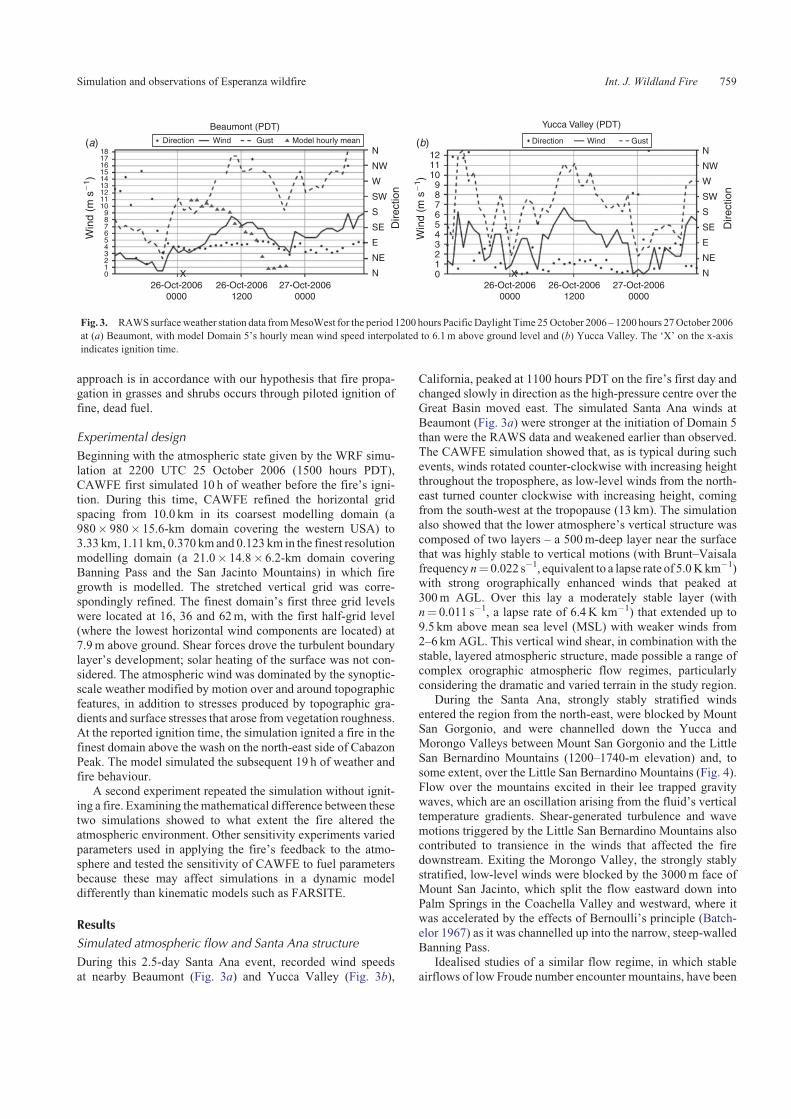
During this 2.5-day Santa Ana event, recorded wind speeds
at nearby Beaumont (Fig. 3a) and Yucca Valley (Fig. 3b),
California, peaked at 1100 hours PDT on the fire’s first day andchanged slowly in direction as the high-pressure centre over the
Great Basin moved east. The simulated Santa Ana winds atBeaumont (Fig. 3a) were stronger at the initiation of Domain 5than were the RAWS data and weakened earlier than observed.
The CAWFE simulation showed that, as is typical during suchevents, winds rotated counter-clockwise with increasing heightthroughout the troposphere, as low-level winds from the north-
east turned counter clockwise with increasing height, comingfrom the south-west at the tropopause (13 km). The simulationalso showed that the lower atmosphere’s vertical structure was
composed of two layers – a 500m-deep layer near the surfacethat was highly stable to vertical motions (with Brunt–Vaisalafrequency n¼ 0.022 s�1, equivalent to a lapse rate of 5.0K km�1)with strong orographically enhanced winds that peaked at
300m AGL. Over this lay a moderately stable layer (withn¼ 0.011 s�1, a lapse rate of 6.4K km�1) that extended up to9.5 km above mean sea level (MSL) with weaker winds from
2–6 km AGL. This vertical wind shear, in combination with thestable, layered atmospheric structure, made possible a range ofcomplex orographic atmospheric flow regimes, particularly
considering the dramatic and varied terrain in the study region.During the Santa Ana, strongly stably stratified winds
entered the region from the north-east, were blocked by MountSan Gorgonio, and were channelled down the Yucca and
Morongo Valleys between Mount San Gorgonio and the LittleSan Bernardino Mountains (1200–1740-m elevation) and, tosome extent, over the Little San Bernardino Mountains (Fig. 4).
Flow over the mountains excited in their lee trapped gravitywaves, which are an oscillation arising from the fluid’s verticaltemperature gradients. Shear-generated turbulence and wave
motions triggered by the Little San Bernardino Mountains alsocontributed to transience in the winds that affected the firedownstream. Exiting the Morongo Valley, the strongly stably
stratified, low-level winds were blocked by the 3000m face ofMount San Jacinto, which split the flow eastward down intoPalm Springs in the Coachella Valley and westward, where itwas accelerated by the effects of Bernoulli’s principle (Batch-
elor 1967) as it was channelled up into the narrow, steep-walledBanning Pass.
Idealised studies of a similar flow regime, in which stable
airflows of low Froude number encounter mountains, have been
26-Oct-20060000
(a) (b)
X X0123456789
101112
0123456789
101112
131415161718
26-Oct-20060000
26-Oct-20061200
Direction
Dire
ctio
n
Dire
ctio
n
DirectionWind
Win
d (m
s�
1 )
Win
d (m
s�
1 )
WindGust Gust
Beaumont (PDT) Yucca Valley (PDT)
Model hourly mean
26-Oct-20061200
27-Oct-20060000
N
NE
E
SE
S
SW
W
NW
N
N
NE
E
SE
S
SW
W
NW
N
27-Oct-20060000
Fig. 3. RAWSsurfaceweather station data fromMesoWest for the period 1200 hours PacificDaylight Time 25October 2006 – 1200 hours 27October 2006
at (a) Beaumont, with model Domain 5’s hourly mean wind speed interpolated to 6.1m above ground level and (b) Yucca Valley. The ‘X’ on the x-axis
indicates ignition time.
Simulation and observations of Esperanza wildfire Int. J. Wildland Fire 759

described by Hunt et al. (1997). The Froude number is given byFr¼U(nh)�1, whereU is the ambient air speed (m s�1), n is theBrunt–Vaisala frequency (s�1) and h (m) is the mountain height.
Weakly stratified flows (Fr. 1) around three-dimensionalobjects are generally well understood, particularly when theterrain slope is small. Stably stratified flows are more complex
and often involve nonlinear effects (e.g. Vosper et al. 1999).In these simulations, with higher velocity airflow than in Huntet al. (1997), air impinging on Mount San Jacinto rode upslopeabove its level of neutral buoyancy. Becoming cooler than its
surroundings, it spilled down the lower slopes of Mount SanJacinto north-westward, producing gusts each 5–7min. A theo-retical basis for this frequency is not available because of the
complex environment. As air descended, some of it crossedCabazon Peak (1382m above MSL). The combined thermalstratification (Fig. 5a) and wind structure (Fig. 5b) of this flow
over Cabazon Peak, where we estimated Fr to be 1.1 atmountaintop, caused the flow to become supercritical, as inDurran’s (1986) idealised two-layer two-dimensional flowsimulations in this Froude number regime. This caused a sharp
increase in descending lee-side, near-surface winds that resem-bled a hydraulic jump, although that analogy is not exact(Durran 1986). This combination created dramatic unsteady
topographic flow accelerations (not shown) down into the lowersection of an unnamed drainage west of Cabazon Peak in whichthe fire established itself. A photograph (Fig. 6) taken from
north-west of the smoke plume during this period documents thefast-moving stable layer of air trapped near the ground and thewind’s hydraulic jump-like structure. Thus, in contrast to con-
clusions based on the perceived alignment of the prevailingSanta Ana flow with the unnamed drainage, the simulationindicated that airflow was not channelled up into the south-west-to-north-east-oriented, unnamed drainage from Banning
Pass. Not until the air reached less steep walls further downwinddid the near-surface winds channelled through Banning Pass fanout onto the upland south of the pass. Some upland areas were
sheltered from the Santa Ana winds by topographic featuresincluding the topographic bowl south of Cabazon Peak contain-ing the Twin Pines Ranch and the area south-west of two north-
west-to-south-east trending ridges straddling State Route 243that ultimately bisected the fire.
The coupled weather–fire simulations were sensitive to the
amount of diffusion, a combination of natural atmosphericmixing and necessary numerical smoothing, which reducedstrong gradients in the atmospheric state. Simulations with lessmixing built strong potential temperature and velocity gradients
that led to gravity wave overturning and breaking over CabazonPeak. Experiments with strong mixing, in the form of back-ground numerical dissipation, numerical filters, or coarser
vertical resolution, experienced strong winds only in BanningPass. In those trials, strong winds and the simulated fire did notextend up to the slopes that burned and, although acceleration
occurred over Cabazon Peak, the airflow had weaker mountain-top winds and did not produce dramatic flow amplification inits lee.
As is common inmountainous areas, limited verification datawere available even for near-surface wind fields. Only theBeaumont RAWS was located in the area covered by thesimulation’s innermost domain; that station reported only
10-min average wind speed and gusts over the previous 1 h,which was insufficient to evaluate the gust frequency producedin the model.
Modelled fire growth and behaviour
The Esperanza Fire event was a complex, shifting interplay
between (1) advances driven by the local, time-varying wind,(2) local topographic effects on the fire that included not only theinclination of a flat surface but also the concavity of canyons,
(3) occasions for particularly enhanced growth when wind andtopographic effects compounded each other, and (4) occasionswhen they opposed each other.
Following ignition, the simulated fire traversed CabazonPeak’s north face and, while experiencing strong winds in thesupercritical flow in its lee or west side (as discussed in the
previous section), was rapidly driven down into the unnameddrainage’s base (in agreement with Esperanza InvestigationTeam 2007) with rates of spread ranging from 0.2 to 1.6m s�1
(Fig. 7a).
From 0450 to 0620 hours PDT, the spear-shaped fire’sleading edge spread downwind (west-south-westward) primari-ly across, rather than up, the unnamed drainage, with enhanced
growth on its southern, upslope flankwhere it lay in the drainage(Fig. 7b). The momentum created by this heat release in thedrainage was transported downwind to the head, further accel-
erating the head downwind.As it ascended from the drainage, the fire front became
uneven, developing multiple lobes that extended forward alongthe front (Fig. 7b), as locations along the fireline encountered
upward-leading canyons, air currents, or possibly fuel propertiesfavouring faster growth. The fire front developed protuberancesalong the heading region and flanks that were drawn up
drainages that it crossed. One of these grew from the north
510.0
487.8
465.6449.6 480.7
X (km)
Y (
km)
511.9
10 m s�1
Fig. 4. Modelled wind speeds in Domain 4 at 7.9m above ground level at
0045 hours PacificDaylight Time on 26October 2006. Topography contours
are shown every 250m. The grey line indicates the location of the cross
section in Fig. 5.
760 Int. J. Wildland Fire J. L. Coen and P. J. Riggan

flank and became a flank run (Fig. 7c). The southern (upslope)
flank, along which winds blew parallel and slightly into the fire,climbed upslope all along its length. For the 10-h period fromignition until the research aircraft’s arrival, few data for valida-
tion exist other than the location and approximate time of the
engine crew entrapment (Esperanza Investigation Team 2007).
At that time in the simulation, the upslope flank of the southernheading region lay only 0.13 km past the entrapment site(Fig. 7c), with a 1 km-wide vertically oriented vortex located
overhead. The simulation suggested that the heading region had
Fig. 6. The wind is travelling left to right in this image, taken at,0800 hours Pacific Daylight Time. The smoke
plume outlines the fast-moving stable layer of winds trapped near the ground and the hydraulic jump-like structure
of the winds during the first morning of the fire. Photo courtesy of Jeff Zimmerman.
Z (
km a
bove
MS
L)
465.09
0
0.78
1.55
2.33
3.11
468.54 472.00 475.46
X (km)
478.91 482.37 485.82
465.09
0
0.78
1.55
2.33
3.11
(a)
(b)
468.54 472.00 475.46 478.91 482.37 485.82
Fig. 5. Vertical west–east cross section (location shown in Fig. 4) through Cabazon Peak (indicated by ‘þ’ on the
x-axis) of (a) potential temperature (contour every 1K) and (b) wind speed (contour every 2m s�1) at 0045 hours
Pacific Daylight Time. The wind indicated in this image was travelling from right to left, opposite to Fig. 6.
MSL, mean sea level.
Simulation and observations of Esperanza wildfire Int. J. Wildland Fire 761

90 00081 00072 00063 00054 00045 00036 00027 00018 00090000
90 00081 00072 00063 00054 00045 00036 00027 00018 00090000
90 00081 00072 00063 00054 00045 00036 00027 00018 00090000
90 00081 00072 00063 00054 00045 00036 00027 00018 00090000
90 00081 00072 00063 00054 00045 00036 00027 00018 00090000
(a) (b)
(c)
(e)
(d)
Fig. 7. Modelled fire heat flux (given by colour bar), and vectors showing thewind every third
model grid cell, are shown at 20m above ground level at (a) 0255 hours, (b) 0554 hours,
(c) 0718 hours (where the yellow ‘X’ indicates the fatality location), (d ) 0815 hours and
(e) 1012 hours Pacific Daylight Time. The red ‘X’ indicates the ignition location.
762 Int. J. Wildland Fire J. L. Coen and P. J. Riggan

passed downwind across the unnamed drainage and its upslopeflank was climbing through this location, with faster rates of
spread through topographic chimneys.The fire’s two heading regions subsequently rejoined
(Fig. 7d ), leaving pockets of unburned fuel between them,
before splitting again (Fig. 7e). This occurred because thenorthern head was driven downwind west-south-westwardacross canyons by ambient winds aided by smooth, upwardly
inclined terrain. The fire’s southern head simultaneously trav-elled south-west, its head and upslope southern flank drawn uptopographic chimneys, while east-south-easterly winds, blow-
ing along and slightly into the fire perimeter, widened the headto the west by encouraging lateral wind-driven growth on the
downwind side. Each of these two major heading regionsdeveloped multiple fingers along their leading edges as locally
favourable growth paths, such as upward-tilted draws, encour-aged locally faster spread.
Cross sections approximately tangent to the surface (Fig. 8a)
and vertically through the southern head of the modelled fire(Fig. 8b) revealed the wind structure in the fire’s vicinity.Updrafts several hundreds of metres wide with maximum
vertical velocities of 10–20m s�1 lay along the fire front andleaned downwind ahead of the fire line. Under these inclinedupdrafts there was confluence in surface winds. In between the
updrafts lay 5–10m s�1 downdrafts, under which there wasdiffluence in surface winds. This pattern indicates a row of
(a)
(b)
10
�10
8
�8
6
�6
4
�4
2
�20
10
�10
8
�8
6
�6
4
�4
2
�20
Fig. 8. Cross sections at 1012 hours PacificDaylight Time, the same time as Fig. 7e, of vertical velocity (given
by the colour bar, where positive is upward motion in m s�1 and values from �0.75 to 0.75m s�1 are
transparent) in (a) a near-surface plane where the southern edge is inclined 28 above horizontal and (b) a vertical
plane (the location is shown as a white line in (a)) through the southern heading region at an angle 338 clockwise
from north. The red ‘X’ indicates the ignition location.
Simulation and observations of Esperanza wildfire Int. J. Wildland Fire 763
inclined horizontal roll vortices, described in crown fires by
Haines (1982). A swathe of air descending at 2–5m s�1 behindthe fire line (Fig. 8b) supplied air into the inclined rotatingplumes. The locally steeper terrain on the sides of the notched
drainage was seen to increase fire rate of spread, the rate of heatrelease, updraft strength and confluence of winds into the plume
base, and thereby further increase the rate of spread. Thus,
whereas upwardly sloped terrain increases rate of spread (suchas in the northern heading region in Figs 7e, 8a), a concave shapesuch as a canyon was seen to accelerate the fire rate of spread,
both through direct effects on that rate and fire–atmospherefeedbacks (as in the southern heading region of Figs 7e, 8a, b).
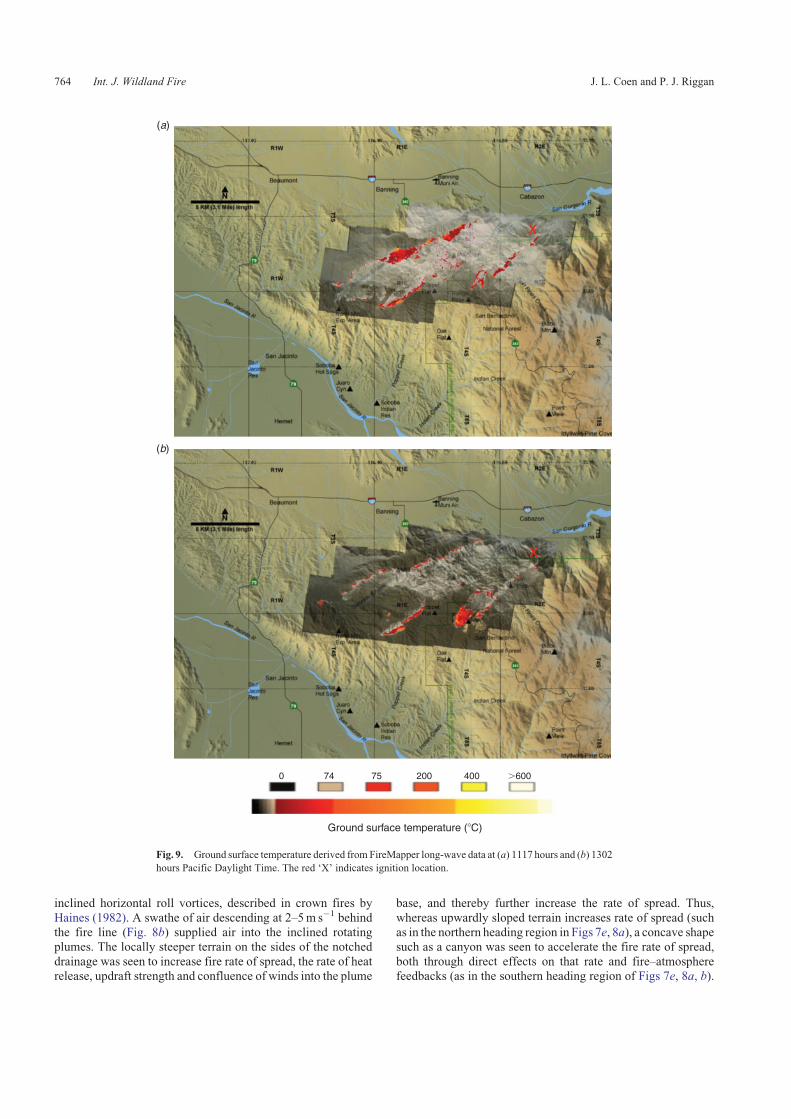
Ground surface temperature (�C)
(a)
(b)
74 75 200 400 �6000
Fig. 9. Ground surface temperature derived fromFireMapper long-wave data at (a) 1117 hours and (b) 1302
hours Pacific Daylight Time. The red ‘X’ indicates ignition location.
764 Int. J. Wildland Fire J. L. Coen and P. J. Riggan
Later fire growth and comparison withaircraft observations
At the aircraft’s first pass at 1117 hours PDT, the EsperanzaFire’s primary run had travelled 16 km west-south-westwardfrom its ignition point, encountering vegetation that was 6–10years old and that released little energy, as evidenced by low
temperatures and narrow flaming zone recorded by the radi-ometer at the fire’s head and the discontinuities across areas ofelevated surface temperature (Fig. 9a). Substantial regions of
high temperature occurred primarily on north-facing aspects andin higher productivity vegetation along the fire’s north flank,particularly as the fire ascended the half-pipe walls and in
vegetation greater than 50 years old in the south-west. A sepa-rate flank run developed to the south-east (Fig. 9b). Other iso-lated runs downwind occurred along the fire’s southern flank,such as immediately east of the fire’s main head in vegetation
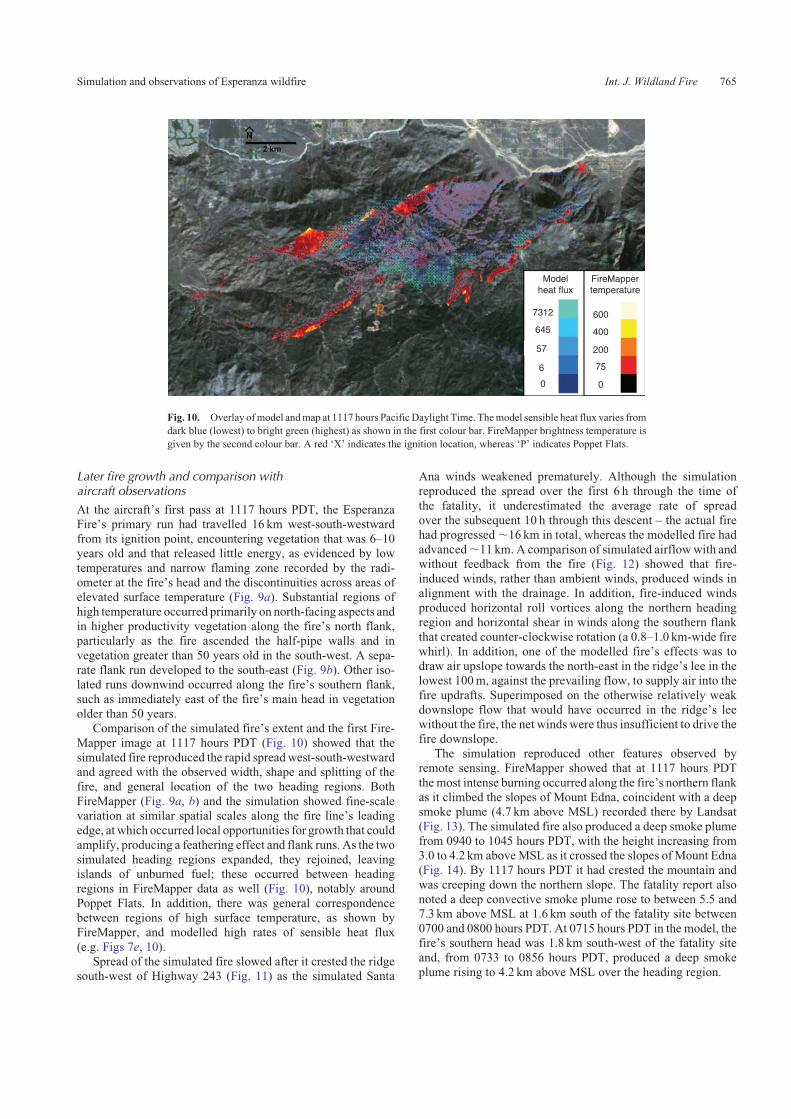
older than 50 years.Comparison of the simulated fire’s extent and the first Fire-
Mapper image at 1117 hours PDT (Fig. 10) showed that the
simulated fire reproduced the rapid spreadwest-south-westwardand agreed with the observed width, shape and splitting of thefire, and general location of the two heading regions. Both
FireMapper (Fig. 9a, b) and the simulation showed fine-scalevariation at similar spatial scales along the fire line’s leadingedge, at which occurred local opportunities for growth that could
amplify, producing a feathering effect and flank runs. As the twosimulated heading regions expanded, they rejoined, leavingislands of unburned fuel; these occurred between headingregions in FireMapper data as well (Fig. 10), notably around
Poppet Flats. In addition, there was general correspondencebetween regions of high surface temperature, as shown byFireMapper, and modelled high rates of sensible heat flux
(e.g. Figs 7e, 10).Spread of the simulated fire slowed after it crested the ridge
south-west of Highway 243 (Fig. 11) as the simulated Santa
Ana winds weakened prematurely. Although the simulationreproduced the spread over the first 6 h through the time of
the fatality, it underestimated the average rate of spreadover the subsequent 10 h through this descent – the actual firehad progressed,16 km in total, whereas the modelled fire had
advanced,11 km. A comparison of simulated airflowwith andwithout feedback from the fire (Fig. 12) showed that fire-induced winds, rather than ambient winds, produced winds in
alignment with the drainage. In addition, fire-induced windsproduced horizontal roll vortices along the northern headingregion and horizontal shear in winds along the southern flank
that created counter-clockwise rotation (a 0.8–1.0 km-wide firewhirl). In addition, one of the modelled fire’s effects was todraw air upslope towards the north-east in the ridge’s lee in thelowest 100m, against the prevailing flow, to supply air into the
fire updrafts. Superimposed on the otherwise relatively weakdownslope flow that would have occurred in the ridge’s leewithout the fire, the net winds were thus insufficient to drive the
fire downslope.The simulation reproduced other features observed by
remote sensing. FireMapper showed that at 1117 hours PDT
themost intense burning occurred along the fire’s northern flankas it climbed the slopes of Mount Edna, coincident with a deepsmoke plume (4.7 km above MSL) recorded there by Landsat
(Fig. 13). The simulated fire also produced a deep smoke plumefrom 0940 to 1045 hours PDT, with the height increasing from3.0 to 4.2 km aboveMSL as it crossed the slopes of Mount Edna(Fig. 14). By 1117 hours PDT it had crested the mountain and
was creeping down the northern slope. The fatality report alsonoted a deep convective smoke plume rose to between 5.5 and7.3 km above MSL at 1.6 km south of the fatality site between
0700 and 0800 hours PDT. At 0715 hours PDT in the model, thefire’s southern head was 1.8 km south-west of the fatality siteand, from 0733 to 0856 hours PDT, produced a deep smoke
plume rising to 4.2 km above MSL over the heading region.
Modelheat flux
FireMappertemperature
7312 600
400
200
75
0
645
57
6
0
Fig. 10. Overlay ofmodel andmap at 1117 hours PacificDaylight Time. Themodel sensible heat flux varies from
dark blue (lowest) to bright green (highest) as shown in the first colour bar. FireMapper brightness temperature is
given by the second colour bar. A red ‘X’ indicates the ignition location, whereas ‘P’ indicates Poppet Flats.
Simulation and observations of Esperanza wildfire Int. J. Wildland Fire 765

10
9
8
8 10 12
X (km)
Y (
km)
14
�6
�4
4
6
�2
2
0
20 m s�1
7
6
5
Fig. 12. The difference between a simulation that includes the fire and one without, showing the effect of the fire
on the model state (i.e. fire-induced winds) at 1117 hours Pacific Daylight Time at 16m above ground level. The
vectors show the effect of the fire on the horizontalwind components. The colour contours show the effect of the fire
on the vertical velocity, coloured according to the colour bar at right. The orange contour contains area where fire’s
sensible heat flux is.100Wm�2. The ignition location is right of the upper right corner. Black terrain contours are
shown every 200 m; the highest four are bold.
90 00081 00072 00063 00054 00045 00036 00027 00018 00090000
Fig. 11. Modelled fire heat flux (Wm�2), and vectors showing the wind every third model grid cell, are shown at
20m above ground level at 1615 hours Pacific Daylight Time. ‘P’ indicates Poppet Flats. Ridge 2 (from Fig. 1)
shown by dashed yellow line.
766 Int. J. Wildland Fire J. L. Coen and P. J. Riggan

Sensitivity analyses
In other simulations (not shown), we varied fuel properties
including load (doubling it), the fuel particle surface area tovolume ratio (s), and fuel depth; the atmospheric depth overwhich heat is distributed (as); and the distance behind the fire
from which wind velocity is used to calculate spread rate. The
fire’s shape and character were largely unchanged and its extent
varied by less than 10%.Of the fuel properties,s had the greatesteffect: casting it towards smaller components, consistent withenvisioning fire spread as occurring by piloted contact ignition
of small fuel particles, resulted in a flashier fire that spreadmorereadily. With higher average s, for example, the simulated fire
Fig. 13. A Landsat image of smoke at ,1100 hours Pacific Daylight Time showed the burning was occurring
primarily around the flanks with a deep plume on the west edge of the north flank near Mount Edna, indicating
intense burning.
70 00060 00050 00040 00030 000
10 00020 000
0
90 00080 000
Fig. 14. Smoke (misty white) plumes rose over areas of simulated fire growth on sides of a topographic bowl at
0846 hours Pacific Daylight Time. A red ‘X’ indicates ignition location.
Simulation and observations of Esperanza wildfire Int. J. Wildland Fire 767
heads spread slightly farther downslope and the shapes of smallprotuberances were more jagged, although the fire’s overallcharacter did not change. We also used fuel loads derived from
remote sensing data according to the techniques described inRiggan et al. (2010), in which the primary differences werethat fuel loads at lower elevations were half or less than
the LANDFIRE-derived values but 2–4 times higher thanLANDFIRE-derived values at mid-slope in broad areas domi-nated by shrubs categorised as Fuel Model 4 or 5 (but with no
change in fuel depth, thus increasing the fuel packing ratio). Theprimary effect was to slow the fire in the earlier period, resultingin a fire that reached locations ,0.5 h later.
Discussion
By capturing details of transient airflows and feedbacks from the
fire, the CAWFE simulation was able to reproduce many dis-tinguishing features of the Esperanza Fire despite incorporationin the model of semi-empirical components that originated in
small-scale laboratory or experimental fires. We found it wasessential to capture not just the orographic channelling of windsbetween mountain ranges, but also transient topographic and
thermodynamic enhancements arising from vertical motions ofstably stratified air and the modification of complex flowregimes by heat release from the fire. For example, flowaccelerations and a hydraulic jump-like flow in Cabazon Peak’s
lee were simulated to have accelerated the fire down into thetopographic drainage that was associated with firefighter fatal-ities. Diagnostic flow-simulation tools, such as Wind Wizard
(Butler et al. 2004), could not have described the transientfeatures and atmospheric stratification and thermodynamiceffects on winds that characterised the Esperanza Fire. Simi-
larly, key features of the fire could not have been predicted fromreliance on data from one or a few local weather stations, norfrom description of the Santa Ana as a simple, synoptic flowfrom high to low pressure. In fact, FARSITE simulations using
four sources ofwind information (Weise et al. 2007), including aRAWS, a meso-scale model, a regional spectral model and theWind Wizard diagnostic tool, incorrectly described the fire as
spreading due west in Banning Pass instead of west-south-westward up into the San Jacinto wilderness. Two factors mayexplain this discrepancy. First, some topographic flow effects
described here were not captured in Weise et al.’s two weathermodel-driven experiments because their horizontal grid spacingwas 8–32 times coarser. Second, fire-induced winds (the mag-
nitude of which was comparable to ambient winds) drove thefire up the drainage; Weise et al. (2007) did not capture thesewith their one-way coupling between weather and fire models.
The fire was directed by local winds and the local slope
(including both the inclination and concavity of terrain); thesecombined at different locations and timeswith either reinforcingor opposing effects on fire spread. This was seen, for instance,
where the simulated leading edge of the Esperanza Firebranched into protuberances as it found favourable routes forlocally increased growth. Yet we found that when one segment
of the fire front found favourable growth downwind while anearby segment was drawn up canyon, orthogonal to the wind,the fire’s leading edge was split into two heading regions. Alonga flank, this behaviour led to flanking runs.
Ultimately, the simulation captured the fire’s overall direc-tion, width and splitting, and the general shape of lobes on thefire line. The simulated rate of spread across complex but
generally inclined terrain (east of Highway 243) was similarto that observed. It also captured intense burning observed on thefire’s flanks where the fire experienced local growth as it
climbed out of a half-pipe, with creation of strong updraftsand deep smoke plumes over the growth surge. The simulationwas less successful in describing the fire spread across a
descending landscape later during the first day as the simulatedSanta Ana winds had weakened earlier than observed and weretoo weak to drive the fire downhill against mild upslope windscreated by the fire. Note that the overall shape of the simulated
fire was neither imposed in the simulation nor subject toelliptical growth imposed at points along the fire line (as inFARSITE), but developed due to dynamic interactions of fire,
atmospheric processes and terrain. The coupling producedphenomena such as horizontal roll vortices and rotatingupdrafts, of which observations were not available.
Simulations varying individual fuel properties such as fuelload (s) and fuel depth across a range of possible valuessuggested that their effects were of secondary importance and,
in these modelling results, neither altered the event’s characternor significantly changed its timing. This concurs with previousmodelling studies (Coen et al. 2013) and experiments (Cheneyet al. 1993, Dupuy 1995,McAlpine 1995) that suggested the rate
of spread depends weakly or not at all on fuel load. Theunderlying Rothermel (1972) surface fire spread relationshipmakes it probable that, were there not strong ambient or fire-
inducedwinds, fuel properties would have a greater effect on themodelled fire’s chronology. This relative insensitivity of theevent’s character to fuel properties does not necessarily apply to
fire effects. As experiments in Coen et al. (2013) showed, in acoupledmodel, higher fuel loads led to a stronger, deeper plume,affecting smoke transport and the height of thermal damage tovegetation, but did not strongly affect the fire’s rate of spread,
although those experiments were limited to flat ground. Fire-Mapper imagery showed that temperatures and energy release infire fronts, which are important in fire effects, were clearly
related to vegetation age and aspect, which are reasonablesurrogates for fuel loading.
There are limitations to our approach, namely, the well-
recognised limits to predictability, particularly the limits tosimulating details of fine-scale features and the deteriorationof a weather simulation with time from initialisation. Science
gaps hamper the treatment of variables that could be important,for example, quantifying the effect of live fuel moisture on therate of spread in chaparral, which is not estimated here. It is alsoextremely difficult to gather complete datasets for input and
validation at the scale and resolution of the phenomena. Newapproaches and datasets for validation must be developed thatemphasise remote sensing of fire physical properties. The heat
flux and other physical phenomena along a fire line vary greatly,so airborne and high-resolution satellite measurements that canmap a fire’s spatial variability provide a perspective unmatched
by ground-based measurements such as those described inFrankman (2009) that characterise a point on the fire line, if itwere even possible to establish instrumentation ahead of amajor fire.
768 Int. J. Wildland Fire J. L. Coen and P. J. Riggan
Albert Einstein paraphrased Occam’s razor, advising thateverything should be kept as simple as possible, but no simpler.If the purpose is to rapidly estimate the immediate rate of spread
of a simply shaped flaming front or to project the fire perimeterusing current conditions without concern for the mechanismsand forces causing this to occur, current operational tools may
produce an acceptable result. However, full numerical weatherprediction models that capture transient airflow effects andfeedbacks from the fire are the minimum required to understand
the forces that cause this growth; to capture where fuels, terrainand wind amplify fire growth in blowups; to simulate firephenomena such as fire whirls or flank runs; or to simulate theunfolding of large fire events with all of their complexity.
Acknowledgements
This material is based upon work supported by the National Science
Foundation (NSF) under Grants 0324910, 0421498 and 0835598, and the
Federal Emergency Management Agency under Award EMW-2011-FP-
01124. The National Center for Atmospheric Research is sponsored by
NSF. Any opinions, findings and conclusions or recommendations
expressed in this material are the authors’ and do not necessarily reflect the
views of NSF. We thank Charles Jones, Francis Fujioka, David Weise and
Shyh-Chin Chen for their insights. We thank Jeff Zimmerman for photo-
graphs, and Lynn Wolden and Robert Tissell for producing images used in
this paper. No endorsement by the USDA is implied. Trade names are
provided for informational purposes only and do not constitute endorsement
by the USDA. Part of the manuscript was prepared by USA government
employees on official time and is therefore not subject to copyright and is in
the public domain.
References
Albini FA (1976) Estimating wildfire behavior and effects. USDA Forest
Service Intermountain Forest and Range Experiment Station, General
Technical Report INT-30. (Ogden, UT)
Anderson HE (1982) Aids to determining fuel models for estimating fire
behavior. USDA Forest Service, Intermountain Forest and Range
Experiment Station, General Technical Report INT-122. (Ogden, UT)
Andrews PL (2009) BehavePlus fire modeling system, version 5.0: Vari-
ables. USDAForest Service, RockyMountainResearch Station,General
Technical Report RMRS-GTR-213WWW Revised. (Fort Collins, CO)
Batchelor GK (1967) ‘An Introduction to Fluid Dynamics.’ (Cambridge
University Press: Cambridge, UK)
Bilgili E, Saglam B (2003) Fire behavior in maquis fuels in Turkey. Forest
Ecology and Management 184, 201–207. doi:10.1016/S0378-1127(03)
00208-1
Butler BW, Forthofer JM, Finney M, Bradshaw LS, Stratton R (2004) High
resolution wind direction and speed information for support of fire
operations. In ‘Monitoring Science and Technology Symposium: Uni-
fying Knowledge for Sustainability in the Western Hemisphere’, 20–24
September 2004, Denver, CO. (Eds C Aguirre-Bravo, PJ Pellicane,
DP Burns, S Draggan) USDAForest Service, RockyMountain Research
Station, Proceedings RMRS-P-37CD, (Fort Collins, CO) Available at
http://www.fs.fed.us/rm/pubs/rmrs_p042.pdf [Verified 14 May 2014]
CheneyNP, Gould JS, CatchpoleWR (1993) The influence of fuel, weather
and fire shape variables on fire-spread in grasslands. International
Journal of Wildland Fire 3, 31–44. doi:10.1071/WF9930031
Cheney NP, Gould JS, Catchpole WR (1998) Prediction of fire spread in
grasslands. International Journal of Wildland Fire 8, 1–13. doi:10.1071/
WF9980001
Coen JL (2013) Modeling wildland fires: a description of the Coupled
Atmosphere–Wildland Fire Environment model (CAWFE). NCAR
Technical Note NCAR/TN-500þSTR. Available at http://nldr.library.
ucar.edu/repository/collections/TECH-NOTE-000-000-000-866 [Veri-
fied 13 April 2014]
Coen JL, Schroeder W (2013) Use of spatially refined satellite remote
sensing fire detection data to initialize and evaluate coupled weather–
wildfire growth model simulations. Geophysical Research Letters 40,
5536–5541. doi:10.1002/2013GL057868
Coen JL, CameronM, Michalakes J, PattonE, Riggan P, YedinakK (2013)
WRF-Fire: coupled weather–wildland fire modeling with the Weather
Research and Forecasting model. Journal of Applied Meteorology and
Climatology 52, 16–38. doi:10.1175/JAMC-D-12-023.1
Dennison PE, Moritz MA, Taylor RS (2008) Evaluating predictive
models of critical live fuel moisture in the Santa Monica Mountains,
California. International Journal of Wildland Fire 17, 18–27.
doi:10.1071/WF07017
Dupuy JL (1995) Slope and fuel load effects on fire behavior: laboratory
experiments in pine needles fuel beds. International Journal of Wildland
Fire 5, 153–164. doi:10.1071/WF9950153
Durran DR (1986) Another look at downslope windstorms. Part I. On the
development of analogs to supercritical flow in an infinitely deep,
continuously stratified fluid. Journal of the Atmospheric Sciences
43, 2527–2543. doi:10.1175/1520-0469(1986)043,2527:ALADWP.
2.0.CO;2
Esperanza Investigation Team (2007) Esperanza Fire accident investigation
factual report, Riverside County, CA. Available at http://www.fire.ca.
gov/fire_protection/downloads/esperanza_00_complete_final_draft_05_
01_2007.pdf [Verified 13 April 2014]
Fernandes PAM (2001) Fire spread prediction in shrub fuels in Portugal.
Forest Ecology and Management 144, 67–74. doi:10.1016/S0378-1127
(00)00363-7
Fernandes PM, Catchpole WR, Rego FC (2000) Shrubland fire behaviour
modellingwithmicroplot data.Canadian Journal of Forest Research 30,
889–899. doi:10.1139/X00-012
Finney MA (1998) FARSITE: Fire Area Simulator – model development
and evaluation. USDA Forest Service, Rocky Mountain Station,
Research Paper RMRS-RP-4. (Ogden, UT)
Fosberg MA (1965) A case study of the Santa Ana winds in the San Gabriel
Mountains. USDA Forest Service, Pacific Southwest Forest and Range
Experimental Station, Research Paper PSW-78. (Berkeley, CA)
Fosberg MA, Schroeder MJ (1973) Fine herbaceous fuels in fire-danger
rating. USDA Forest Service, Rocky Mountain Forest and Range
Experiment Station, Research Note RM-185. (Fort Collins, CO)
Fosberg MA, O’Dell CA, Schroeder MJ (1966) Some characteristics of the
three-dimensional structure of Santa Ana winds. USDA Forest Service,
Pacific Southwest Forest and Range Experimental Station, Research
Paper PSW-30. (Berkeley, CA)
Frankman DJ (2009) Radiation and convection heat transfer in wildland fire
environments. PhD thesis, Brigham Young University, Provo, UT.
Haines DA (1982) Horizontal roll vortices and crown fires. Journal of
Applied Meteorology 21, 751–763. doi:10.1175/1520-0450(1982)
021,0751:HRVACF.2.0.CO;2
Huang C, Lin Y, Kaplan ML, Charney JJ (2009) Synoptic-scale and meso-
scale environments conducive to forest fires during the October 2003
extreme fire event in southern California. Journal of Applied Meteorol-
ogy and Climatology 48, 553–579. doi:10.1175/2008JAMC1818.1
Hughes M, Hall A (2010) Local and synoptic mechanisms causing
Southern California’s Santa Ana winds. Climate Dynamics 34, 847–
857. doi:10.1007/S00382-009-0650-4
Hunt JCR, Feng Y, Linden PF, Greenslade MD, Mobbs SD (1997) Low-
Froude-number stable flows past mountains. Nuovo Cimento-Societa
Ocieta Italiana a di Fisica Sezione C 20, 261–272.
Lindenmuth AW, Davis JR (1973) Predicting fire spread in Arizona’s oak
chaparral. USDA Forest Service, Rocky Mountain Forest and Range
Experiment Station, Research Paper RM-101. (Fort Collins, CO)
Simulation and observations of Esperanza wildfire Int. J. Wildland Fire 769

McAlpine RS (1995) Testing the effect of fuel consumption on fire spread
rate. International Journal of Wildland Fire 5, 143–152. doi:10.1071/
WF9950143
Riggan PJ, Franklin SE, Brass JA, Brooks FE (1994) Perspectives on fire
management in Mediterranean ecosystems of southern California. In
‘The Role of Fire in Mediterranean-type Ecosystems’. (Eds JMMoreno,
WC Oechel) pp. 140–162. (Springer-Verlag: New York)
Riggan PJ, Wolden LG, Tissell RG, Coen J (2010) Remote sensing fire
and fuels in southern California. In ‘Proceedings of 3rd Fire Behavior
and Fuels Conference’, 25–29 October 2010, Spokane, Washington.
(Ed. D Wade) (CD-ROM) (International Association of Wildland Fire:
Birmingham, AL)
Rothermel RC (1972) A mathematical model for predicting fire spread in
wildland fuels. USDA Forest Service, Intermountain Forest and Range
Experiment Station, Research Paper INT-115. (Ogden, UT)
Ryan BC (1969) A vertical perspective of Santa Ana winds in a canyon.
USDA Forest Service, Pacific Southwest Forest and Range Experimen-
tal Station, Research Paper PSW-52. (Berkeley, CA)
Schroeder MJ, Glovinsky M, Henricks VF, Hood FC, Hull MK (1964)
Synoptic weather types associated with critical fire weather. USDA
Forest Service, Pacific Southwest Forest and Range Experiment Station,
report 0036944. (Berkeley, CA)
Stephens SL, Weise DR, Fry DL, Keiffer RJ, Dawson J, Koo E, Potts J,
Pagni PJ (2008) Measuring the rate of spread of chaparral prescribed
fires in northern California. Fire Ecology 4, 74–86. doi:10.4996/FIRE
ECOLOGY.0401074
Vosper SB, Castro IP, SnyderWH, Mobbs SD (1999) Experimental studies
of strongly stratified flow past three-dimensional orography. Journal of
Fluid Mechanics 390, 223–249. doi:10.1017/S0022112099005133
Weise DR, Zhou X, Sun L, Mahalingam S (2005) Fire spread in chaparral
-‘go or no-go?’ International Journal of Wildland Fire 14, 99–106.
doi:10.1071/WF04049
Weise DR, Chen S, Riggan PJ, Fujioka FM (2007) Using high-resolution
weather data to predict fire spread using the FARSITE simulator – a case
study in southern California chaparral. In ‘Proceedings of the Seventh
Symposium on Fire and Forest Meteorology’, 23–25 October 2007, Bar
Harbor,ME. Paper 8.2. (AmericanMeteorological Society: Boston,MA,
USA) Available at https://ams.confex.com/ams/pdfpapers/126873.pdf
[Verified 13 April 2014]
Whiteman CD (2000) ‘Mountain Meteorology: Fundamentals and Applica-
tions.’ (Oxford University Press: New York)
www.publish.csiro.au/journals/ijwf
770 Int. J. Wildland Fire J. L. Coen and P. J. Riggan