Embed Size (px)
Citation preview

International Journal of Aviation, International Journal of Aviation,
Aeronautics, and Aerospace Aeronautics, and Aerospace
Volume 7 Issue 4 Article 7
2020
Simulation Analysis of the Effects of Performance-Based Simulation Analysis of the Effects of Performance-Based
Navigation on Fuel and Block Time Efficiency Navigation on Fuel and Block Time Efficiency
Shlok Misra Embry-Riddle Aeronautical University, Daytona Beach, [email protected]
Follow this and additional works at: https://commons.erau.edu/ijaaa
Part of the Aviation Safety and Security Commons, and the Management and Operations Commons
Scholarly Commons Citation Scholarly Commons Citation Misra, S. (2020). Simulation Analysis of the Effects of Performance-Based Navigation on Fuel and Block Time Efficiency. International Journal of Aviation, Aeronautics, and Aerospace, 7(4). https://doi.org/10.15394/ijaaa.2020.1528
This Article is brought to you for free and open access by the Journals at Scholarly Commons. It has been accepted for inclusion in International Journal of Aviation, Aeronautics, and Aerospace by an authorized administrator of Scholarly Commons. For more information, please contact [email protected].

Commercial aviation has seen a steady rise over the past decade (2010-
2019) in the United States of America (US) in terms of the number of flights
operated and passengers traveled. According to statistics reported by the
Department of Transportation (DOT) through the Bureau of Transportation
Statistics (BTS), the number of flights operated in the US has seen a 2.2% rise from
2010 to 2019, and the number of passengers traveled has seen a rise of 33.68% in
the same period (DOT, 2020). An increase in the number of flights operated in the
National Airspace System (NAS) leads to system delays which ultimately leads to
increased costs for the operators/airlines and an increase in fuel emissions (FAA,
2018). The delay costs to the airlines include direct compensation to passengers for
missed flights or connections and reputation costs (Ferguson et al., 2013). State
agencies such as the Federal Aviation Administration (FAA), airlines, and
stakeholders in the NAS have directed efforts towards improving the efficiency of
the NAS while maintaining the safety standards. Some of these efforts include
developing Performance-based Navigation (PBN), Performance-based
Communication and Surveillance (PBCS), Automatic-Dependent Surveillance-
Broadcast (ADS-B), and Collaborative Decision Making (CDM)(FAA, 2018).
The FAA NextGen Program is a major effort by the FAA to develop
technologies to prepare the NAS for the growing air traffic demand (FAA, 2018).
While the NextGen program is being developed and implemented on an industry-
wide level with the FAA, airlines have taken initiatives as well to improve
operational efficiencies such as improving cost index calculation algorithms and
investing in disruption management strategies and technology (Maria et al., 2017).
Increasing efficiency and reducing costs while maintaining safety has been a major
goal for the airlines and the FAA while introducing new strategies and initiatives.
Statement of the Problem
The NextGen Program is aimed towards modernizing the NAS by
introducing technology that will not only improve efficiency but also reduce
operating costs and improve environmental considerations such as reducing fuel
emissions (FAA, 2018). The implementation of PBN is a global effort to shift the
dependency for navigation from ground-based systems to satellite-based systems
(Kasim, 2017). PBN is changing the way aircraft navigate through the NAS
(Kasim, 2017). The FAA claims that the implementation of PBN will allow
operators to fly more efficient routes and improve the efficiency of departure and
arrival routing through Optimized Descent Paths (OPDs) (FAA, 2016b). As of
2020, the FAA is midway through the implementation of the NextGen program
that has been planned to be implemented in four segments between 2010 and
2030 (FAA, 2018). The four segments are Alpha (2010-2015), Bravo (2016-
2020), Charlie (2020-2025), and Delta (2026-2030) (FAA, 2018). As of 2020, the
FAA is transitioning from the Bravo segment to the Charlie segment and is
1
Misra: Performance-Based Navigation on Fuel and Block Time Efficiency
Published by Scholarly Commons, 2020

approximately at the mid-point of the 20 years long implementation period.
However, there is a lack of literature that quantifies the benefits of utilizing PBN
on flights of different distances and times. Considering that 2020 is a transition
stage and a mid-point of the implementation plan, there is a need for a
quantitative assessment of the progress made by the FAA and the benefits it
currently offers to operators and airlines operating in the NAS.
The purpose of this study was to analyze the effects of PBN on fuel and
block time efficiency. Additionally, the study assessed the benefits of utilizing
PBN for flights of varying flight times and distances. This study is a quantitative
assessment of the benefits of PBN offered for flights of varying distances and
flight times.
PBN will impact all stakeholders of the NAS as it will change the way
flights navigate and operate through the NAS (FAA, 2016b). The study is
significant for airline operators and stakeholders in the NAS. Considering that
2020 is a transition stage from the Bravo segment to the Charlie segment of the
NextGen implementation plan and it’s approximately the mid-point of the 20
years long implementation plan, this study offers a quantitative assessment of the
benefits of PBN for operators and airlines that utilize the PBN infrastructure in
the NAS. With the completion of the PBN implementation scheduled in 10 years
(2030), the results of this study will also benefit stakeholders and airlines in
forecasting and predicting the future impact of PBN on flight operations. The
results of this study can be used to assess operational strategies such as variations
in cost index calculations for routes and developing investment strategies for
utilizing PBN for flight operations on different routes. The results of this study
can be utilized for further research on optimization models and methods for
calculating block times.
Research Questions
The researcher for this study conducted the study to answer the following
research question:
• How does fuel and block time efficiency change when using PBN routes
and procedures for flights of different distances?
Review of Relevant Literature
FAA NextGen Program
The FAA NextGen program aims to modernize the NAS while
maintaining the safety standards of the NAS. The FAA describes the NextGen
program as "the planning and implementation of innovative new technologies and
airspace procedures after thorough safety testing” (FAA, 2020b, p. 1).
The FAA explains that replacing legacy systems with digital technology is
a core element of the NextGen program (FAA, 2020b). This shift leads towards
better cost-saving techniques, better environmental considerations, and improved
2
International Journal of Aviation, Aeronautics, and Aerospace, Vol. 7 [2020], Iss. 4, Art. 7
https://commons.erau.edu/ijaaa/vol7/iss4/7DOI: https://doi.org/10.15394/ijaaa.2020.1528

efficiency and performance. The NextGen program is aimed towards modernizing
three critical areas of the NAS which are communication, navigation, and
surveillance. In the communications focus, the FAA has focused on increasing the
reliance on datalink methods of communication between the aircraft and Air
Traffic Control (ATC). The increased use of datalink results in a faster, more
reliable, and more accurate exchange of messages between ATC and pilots. Some
programs that are being implemented in the NextGen program that focus on
communication are Controller Pilot Datalink Communications (CPDLC), ADS-B,
and Automatic Database Broadcast-Contract (ADS-C). In the navigation focus,
the FAA has focused on increasing the reliance on satellite-based equipment and
procedures and moving away from the reliance and usage of ground-based
equipment such as Very High-Frequency Omnidirectional Range (VORs) and
Instrument Landing System (ILS). Satellite-based systems are more reliable and
allow aircraft to fly more precise and efficient routes along with more efficient
climbs and descents into and out of airports. Satellite-based navigation will not
only improve the efficiency of the NAS but also help operators cut costs on fuel
and reduce delays as aircraft will fly more direct routes. In the surveillance focus,
the FAA is focused on improving the accuracy and performance of surveillance
systems that are used by ATC. Some of the key programs that are the focus in the
NextGen program are Data Communication (Data Comm), PBN, ADS-B,
Decision Support System (DSS), System Wide Information Management
(SWIM), and other environmental and safety initiatives. The analysis in this study
was limited to the usage of PBN.
Figure 1. Benefits (estimated in US Dollars) achieved per year through the
NextGen program (FAA, 2020c).
3
Misra: Performance-Based Navigation on Fuel and Block Time Efficiency
Published by Scholarly Commons, 2020
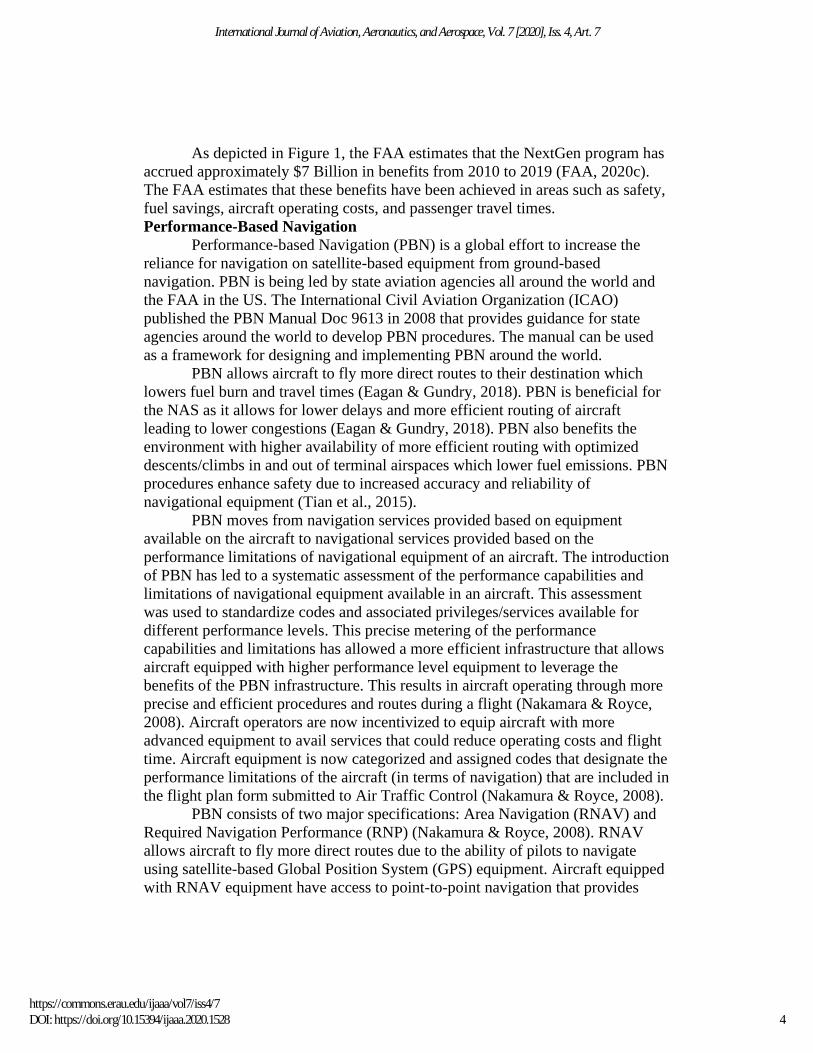
As depicted in Figure 1, the FAA estimates that the NextGen program has
accrued approximately $7 Billion in benefits from 2010 to 2019 (FAA, 2020c).
The FAA estimates that these benefits have been achieved in areas such as safety,
fuel savings, aircraft operating costs, and passenger travel times.
Performance-Based Navigation
Performance-based Navigation (PBN) is a global effort to increase the
reliance for navigation on satellite-based equipment from ground-based
navigation. PBN is being led by state aviation agencies all around the world and
the FAA in the US. The International Civil Aviation Organization (ICAO)
published the PBN Manual Doc 9613 in 2008 that provides guidance for state
agencies around the world to develop PBN procedures. The manual can be used
as a framework for designing and implementing PBN around the world.
PBN allows aircraft to fly more direct routes to their destination which
lowers fuel burn and travel times (Eagan & Gundry, 2018). PBN is beneficial for
the NAS as it allows for lower delays and more efficient routing of aircraft
leading to lower congestions (Eagan & Gundry, 2018). PBN also benefits the
environment with higher availability of more efficient routing with optimized
descents/climbs in and out of terminal airspaces which lower fuel emissions. PBN
procedures enhance safety due to increased accuracy and reliability of
navigational equipment (Tian et al., 2015).
PBN moves from navigation services provided based on equipment
available on the aircraft to navigational services provided based on the
performance limitations of navigational equipment of an aircraft. The introduction
of PBN has led to a systematic assessment of the performance capabilities and
limitations of navigational equipment available in an aircraft. This assessment
was used to standardize codes and associated privileges/services available for
different performance levels. This precise metering of the performance
capabilities and limitations has allowed a more efficient infrastructure that allows
aircraft equipped with higher performance level equipment to leverage the
benefits of the PBN infrastructure. This results in aircraft operating through more
precise and efficient procedures and routes during a flight (Nakamara & Royce,
2008). Aircraft operators are now incentivized to equip aircraft with more
advanced equipment to avail services that could reduce operating costs and flight
time. Aircraft equipment is now categorized and assigned codes that designate the
performance limitations of the aircraft (in terms of navigation) that are included in
the flight plan form submitted to Air Traffic Control (Nakamura & Royce, 2008).
PBN consists of two major specifications: Area Navigation (RNAV) and
Required Navigation Performance (RNP) (Nakamura & Royce, 2008). RNAV
allows aircraft to fly more direct routes due to the ability of pilots to navigate
using satellite-based Global Position System (GPS) equipment. Aircraft equipped
with RNAV equipment have access to point-to-point navigation that provides
4
International Journal of Aviation, Aeronautics, and Aerospace, Vol. 7 [2020], Iss. 4, Art. 7
https://commons.erau.edu/ijaaa/vol7/iss4/7DOI: https://doi.org/10.15394/ijaaa.2020.1528

efficiency and flexibility. RNAV increases system capacity and reduces delays
and congestions. RNAV allows pilots to navigate through either pre-defined GPS
waypoints or fixes located by latitudes and longitudes. Different aircraft
equipment have varying navigation capabilities that differentiate the types of PBN
routes and procedures that can be flown by aircraft. RNAV designators such as
RNAV 1, RNAV 2, and RNAV 10 categorize the navigational RNAV capabilities
of the aircraft. The FAA has published guidance for operators for the RNAV
codes for different equipment that must be included in the filed flight plan (FAA,
2020a). Required Navigational Performance (RNP) adds on RNAV with
additional functional enhancements related to accuracy and integrity monitoring
(Nakamura & Royce, 2008). RNP is characterized by onboard performance
monitoring and alerting capability which improves the integrity of the aircraft's
navigational capabilities. A higher RNP category helps the aircraft fly highly
precise routes, especially in the approach phase. These precise routes help the
aircraft reduce fuel burn and also helps the NAS with noise abatement procedures.
The FAA has published Advisory Circular 90-105A regarding the certification
and implementation of PBN equipment for US civil aircraft (FAA, 2016a). The
aircraft's navigation equipment is designated RNP values which denote the
aircraft navigational integrity and performance monitoring capability. The FAA
explains that the RNP value “designates the 95 percent lateral navigation (LNAV)
performance (in NM) and the related monitoring and alerting requirements
associated with an RNP instrument flight operation or a particular segment of that
instrument flight” (FAA, 2016, p. 4-2). The RNP values are designated in terms
of nautical miles where an RNP0.3 value denotes that an aircraft can maintain a
tracking accuracy of +/- 0.3NM for 95% of the flight (FAA, 2016a). As illustrated
in figure 2, the lower the RNP value, the higher the accuracy and integrity
monitoring capabilities.
Figure 2. RNP Values and integrity and monitoring performance for flight phases
(FAA, 2016a).
5
Misra: Performance-Based Navigation on Fuel and Block Time Efficiency
Published by Scholarly Commons, 2020

PBN implementation is a major focus of the FAA NextGen program. The
FAA published updates on the implementation of PBN in the FAA NextGen
Implementation Plan 2018-2019 (FAA, 2018). The implementation of PBN will
be completed by the end of the Delta segment of the NextGen program (FAA,
2018). The FAA is currently (as of August 2020) moving towards equipping more
airports with RNAV and RNP procedures and increasing the usage and
availability of high-performance navigational procedures such as RNP-AR
(Required Navigational Performance-Authorization Required) procedures.
The FAA selected 29 airports in the US and designated them as core
airports for the implementation of PBN (FAA, 2020b). The 29 core airports have
the highest focus on PBN and are the most advanced and well-equipped for PBN
procedures. As of October 2017, the FAA had implemented OPDs at 20 core
airports, RNP-AR procedures at 25 core airports, and RNAV procedures for 29
core airports and 310 non-core airports. For the purpose of the simulation in this
study, all flights will depart and arrive at core airports to leverage the higher
number of PBN procedures available at core airports.
PBN Implications on Flight Planning
Scheduled air carriers/airlines operate under the regulations mandated
under 14 Code of Federal Regulations Part 121. Airlines also utilize company-
specific operations specifications for managing flight planning and operations.
Larger transport category aircraft utilize flight altitudes above 18,000 feet which
places these flights in Class A airspace. As detailed in the Aeronautical
Information Manual Section 3-2-2, all flight operations conducted in Class A
airspace are to be conducted under Instrument Flight Rules (IFR) (FAA, 2020a).
IFR flight operations utilize pre-defined navigational procedures and routes that
can be accessed by pilots from published high-altitude charts and terminal
procedures publications. The implications of PBN can be studied for IFR flights
in three separate segments which are departure, en-route, and arrival.
Departure
For this analysis, the departure segment of a flight is considered the
segment of a flight when an aircraft takes-off from the departure airport and
climbs to the cruise altitude. An aircraft is directed from the terminal airspace to
the en route segment by ATC through radar vectors or published departure routes.
As detailed in the Aeronautical Information Manual Section 5-2-9, published
departure procedures can be either Obstacle Departure Procedures (ODPs),
Standard Instrument Departures (SIDs), or Departure Vector Areas (DVAs)
(FAA, 2020a). The flight crew operating the flight will be cleared to utilize a
published departure procedure to climb out of the terminal airspace. These
published departure procedures utilize navigational facilities such as VORs,
NDBs, or DME. However, with the introduction of PBN, the FAA is moving
towards introducing RNAV GPS departure procedures which will allow aircraft to
6
International Journal of Aviation, Aeronautics, and Aerospace, Vol. 7 [2020], Iss. 4, Art. 7
https://commons.erau.edu/ijaaa/vol7/iss4/7DOI: https://doi.org/10.15394/ijaaa.2020.1528

fly to the en route segment through more direct routes reducing fuel burn and time
taken to reach the en route segment.
En-route
For the purpose of this analysis, the en-route segment of flight will be
considered the segment of the flight when the aircraft reaches the cruise altitude
to the point when the aircraft commences descent to the arrival airport. The en
route segment of a flight under IFR is operated by either flying through
predefined airways (Victor Airways below 18,000 feet and Jet Routes above
18,000 feet). Flights could also fly direct between waypoints subjected to ATC
approval and operations. With the introduction of PBN, the FAA is moving
towards increasing the availability of GPS routes (such as Q-routes and T-routes),
which utilize GPS waypoints rather than ground-based equipment for creating
waypoints. Increased availability of GPS routes helps reduce flight times and fuel
burn as GPS routes offer more direct routing to aircraft as they are not dependent
on the location of ground-based equipment (FAA, 2020a).
Arrival
For the purpose of this analysis, the arrival segment of a flight will be
considered the segment of the flight when the aircraft begins the descent from the
en route segment to the arrival airport. Aircraft utilize ATC instructions for
descent and utilize predefined arrival procedures. As detailed in the Aeronautical
Information Manual Section 5-4-1, published arrival procedures are called
Standard Terminal Arrival Routes (STARs) (FAA, 2020a). STARs are pre-
defined arrival routes that pilots utilize with the approval of the controlling ATC
agency. STARs allow efficient sequencing of arriving aircraft to the airport and
reduce pilot-controller workload. The FAA has invested significantly in
improving the efficiency of STARs and instrument approach procedures utilized
for aircraft arriving airport under IFR. The FAA aims to increase the availability
of RNAV GPS and RNP arrival procedures that utilize higher GPS navigational
standards than ground-based equipment. RNAV GPS and RNP procedures allow
more precise routes into the airport reducing the total distance in the arrival
segment, fuel burn, and flight time. Another advantage of implementing PBN in
the arrival segment in the higher availability of OPDs, which allow a more fuel-
efficient arrival due to the reduction in step down level-offs for arriving aircraft.
Aircraft that are equipped with higher performance navigational equipment can
utilize RNAV GPS and RNP procedures which will help navigate the aircraft in
less time, distance, and fuel burn.
Block Time
Airlines schedule flights with respect to block times. Sohoni et al. (2011)
define block time of a flight as the time elapsed for a flight from push-back at the
departure gate to arrival at the destination gate. In colloquial terms, block time is
also referred to as the time from 'chocks off to chocks on' where chocks refer to
7
Misra: Performance-Based Navigation on Fuel and Block Time Efficiency
Published by Scholarly Commons, 2020

the parking brake and chocks for the wheels placed when the aircraft is parked at
the gate. The block time comprises of the taxi-out time, en route time, and taxi-in
time (Sohoni et al., 2011). Block times are of high significance for airlines as an
inaccurate prediction of block times can not only lead to delayed flights but also
lead to inefficient scheduling of resources. The FAA maintains data on the On-
Time Performance (OTP) of airlines, which is a common measure for assessing
airline efficiency and performance. According to the Department of Transport
(2020), a flight is 'on-time' if it arrives within 15 minutes after its scheduled
arrival time. A flight is considered delayed if the flight arrives 15 minutes or more
after its scheduled arrival time. Block times are a vital tool for airlines to estimate
scheduled arrival times.
Literature suggests that significant progress has been achieved in
optimizing block time calculations. Sohoni et al. (2011) suggest that inaccurate
block time calculations do not only lead to system delays for the airlines but also
affect network and schedule designs of airlines. Sohoni at. al (2011) designed a
stochastic integer programming formulation that was aimed at optimizing and
maximizing profits for an airline that included optimizing block time estimations.
Fan (2019) studied the systematic change in scheduled block times for non-stop
flights from 1986 to 2016. Fan observed that scheduled block times have been
increasing by 0.21 minutes to 0.33 minutes every year for non-stop flights. Some
of the factors that have led to this constant increase in block time are air traffic
growth, airport-specific congestions, flight delays, and airport slot policy amongst
other factors. An increase in block time leads to lesser flights being scheduled per
aircraft in a given period of time.
Kang and Hansen (2018) explained that block times directly impact an
airline's on-time performance and operating costs. Kang and Hansen studied the
impact of airport surface congestion management programs on block times of
airlines. Kang and Hansen developed a prediction model to predict the impact of
airport surface congestion on block times of aircraft. The block time of a flight
can be impacted by factors on the airport surface or in the air during the flight.
Methodology
The purpose of this study was to analyze the effects of PBN on fuel and
block time efficiency. The researcher utilized a quantitative research method with
a simulation design for the study.
Data
The data for this study was collected from 20 simulated flights. Out of the
20 flights, 10 of the flights were operated without using any GPS routes or RNP
procedures (denoted as Group A), and the other 10 flights were operated utilizing
GPS and RNP procedures (denoted as Group B). The flights were planned
utilizing the Navblue Flight Planning software and the flights were simulated
8
International Journal of Aviation, Aeronautics, and Aerospace, Vol. 7 [2020], Iss. 4, Art. 7
https://commons.erau.edu/ijaaa/vol7/iss4/7DOI: https://doi.org/10.15394/ijaaa.2020.1528

utilizing Aerowinx Flight Precision Simulator. The researcher selected 10 city-
pairs (One origin to one destination) and simulated one Group A flight and one
Group B flight for each route. The origin and destination in each sector was a core
airport in the PBN implementation plan as the researcher aimed to utilize the best
PBN capabilities available in the NAS for credible data collection (FAA, 2020b).
Group A flights
The researcher planned the flights on the Navblue Flight Planning
software by disabling GPS availability and utilizing the lowest PBN capability as
per the guidance from the FAA. The most efficient route with the defined
parameters was planned by Navblue.
Group B flights
The researcher planned the flights on the Navblue Flight Planning
software by enabling GPS availability and the highest PBN capability as per the
guidance of the FAA. The researcher planned the flights utilizing PBN to the
highest extent and degree possible. Utilizing the highest extent implies that at
certain route segments, the research planned the flight utilizing J-routes (utilizing
ground-based equipment) or ground-based approach procedures when a
comparable RNAV(GPS) route or procedure wasn't available. Utilizing PBN to
the highest degree possible implies that the researcher utilized routes and
procedures utilizing the highest RNAV performance category and RNP category
available for each sector in the Navblue Flight Planning software. Additionally,
the researcher utilized RNP-AR procedures when one was available. The
researcher utilized PBN to the highest degree possible to gather credible data for
analysis and comparison.
Navblue Flight Planning
The researcher utilized Navblue Flight Planning for planning the 20
simulated flights. Navblue Flight Planning is an operations solution offered by
Airbus that specializes in providing applications for flight planning, crew
management, performance planning, and fleet management (Navblue, 2020).
Navblue allows operators and dispatchers to plan flights efficiently utilizing
aircraft data and the worldwide navigation data that is available for Navblue
users. The researcher utilized the Boeing 747-400 flight planning data that was
incorporated in the Navblue Flight Planning software. The researcher planned 10
flights for Group A and 10 flights for Group B. The researcher was able to disable
RNP and GPS (RNAV) procedures for the Group A flights and utilize RNP and
GPS (RNAV) procedures to the highest extent and degree possible for Group B
flights. The researcher was able to accomplish this through the 'user' and
'administrator' accounts available to the researcher that allowed the researcher to
manipulate the aircraft navigational capability settings.
9
Misra: Performance-Based Navigation on Fuel and Block Time Efficiency
Published by Scholarly Commons, 2020

Aerowinx Precision Flight Simulator
Aerowinx Precision Flight Simulator (Aerowinx) is a commercially
available desktop flight simulator that is widely used for training and research
purposes (Aerowinx, 2020). Aerowinx utilizes a Boeing 747-400 for the
simulations and offers a realistic experience to users in terms of flight
management. Users can simulate flights all around the world utilizing the global
navigation database of Aerowinx. Users can input data into the FMS and Mode
Control Panel (MCP) amongst a range of other control inputs available to pilots.
Aerowinx also allows users to adjust and simulate different flight settings such as
system malfunctions and aircraft loading parameters along with different
environmental conditions such as winds and weather phenomenon. The analysis
tool in Aerowinx allows users to simulate a flight and record second-by-second
flight data similar to a flight data recorder (FDR). The flight data can be
downloaded as a Microsoft Excel file which allows researchers to conduct
statistical tests and analysis on the simulated flight data. The researchers set the
simulation as per the objectives and methodology required for the 20 simulated
flights and utilized the analysis functions for the analysis in this study.
Flight Planning
The flight planning utilized the NavBlue Flight Planning software. The
researchers utilized the cost index settings preset on the Navblue program and
utilized the most efficient route calculated by the software as per the settings
selected by the researcher (Group A and Group B flights). Every flight was
planned with an alternate that was within a distance of 100 nautical miles from the
destination airport. Every flight was operated at the same cruise altitude of FL340
(except flights A1 and B1 in Table 1). The Boeing 747-400 utilized for the
simulation and had a capacity of 400 passengers. The research planned each flight
with 350 passengers and 2000 pounds of additional cargo. 10 different city pairs
were chosen by the researcher for the 20 simulated flights (10 flights in Group A
and 10 flights in Group B). Every departure and arrival airport utilized for the
simulated flights was part of the 29 core airports selected by the FAA for PBN
implementation. The researcher selected the core airports because the core
airports have the highest availability of PBN procedures which helped build a
credible comparative analysis between Group A and Group B flights. The 10 city-
pairs were chosen by considering the great circle route (GCR) distance between
the departure and arrival airport to ensure that the researcher simulated flights of
varying distances to study the impact of PBN on different flight times and
distances. Table 1. describes the 20 simulated flights that were conducted for this
study. The shortest flight had a GCR of 470 nautical miles while the longest flight
had a GCR of 4189 nautical miles as the researcher aimed to gather data from
flights of varying routes distances and times.
10
International Journal of Aviation, Aeronautics, and Aerospace, Vol. 7 [2020], Iss. 4, Art. 7
https://commons.erau.edu/ijaaa/vol7/iss4/7DOI: https://doi.org/10.15394/ijaaa.2020.1528

Table 1
Details of the 20 Simulated Flights
Group A Group B Flight Great Circle
Distance
Flight A1 Flight B1
New York-John F
Kennedy Airport
(KJFK) to
Charlotte/Douglas
International Airport
(KCLT)
470 Nautical
Miles
Flight A2 Flight B2
New York-John F
Kennedy Airport
(KJFK) to
Minneapolis-St Paul
International Airport
(KMSP)
894 Nautical
Miles
Flight A3 Flight B3
New York-John F
Kennedy Airport
(KJFK) to Denver
International Airport
(KDEN)
1413 Nautical
Miles
Flight A4 Flight B4
New York-John F
Kennedy Airport
(KJFK) to Seattle
Tacoma
International Airport
(KSEA)
2104 Nautical
Miles
Flight A5 Flight B5
New York-John F
Kennedy Airport
(KJFK) TO Los
Angeles
International Airport
(KLAX)
2151 Nautical
Miles
11
Misra: Performance-Based Navigation on Fuel and Block Time Efficiency
Published by Scholarly Commons, 2020

Flight A6 Flight B6
Seattle Tacoma
International Airport
(KSEA) to Miami
International Airport
(KMIA)
2367 Nautical
Miles
Flight A7 Flight B7
Dallas Fort Worth
International Airport
(KDFW) to Daniel
K Inouye
International Airport
(PHNL)
3228 Nautical
Miles
Flight A8 Flight B8
Minneapolis-St Paul
International Airport
(KMSP) to Daniel K
Inouye International
Airport (PHNL)
3451 Nautical
Miles
Flight A9 Flight B9
Atlanta Hartsfield-
Jackson
International Airport
(KATL) to Daniel K
Inouye International
Airport (PHNL)
3912 Nautical
Miles
Flight A10 Flight B10
Washington Dulles
International Airport
(KIAD) to Daniel K
Inouye International
Airport (PHNL)
4186 Nautical
Miles
Results
Route Distance
The route distance in this analysis includes the distance the aircraft
traveled from take-off at the departure airport to landing at the arrival airport. The
distance covered by the aircraft during taxi was not considered for the analysis.
The data for flight distance for Group A and flight distance for Group B was
gathered from Aerowinx. Figure 3 depicts the GCR, route distance for Group A,
and route distance for Group B.
12
International Journal of Aviation, Aeronautics, and Aerospace, Vol. 7 [2020], Iss. 4, Art. 7
https://commons.erau.edu/ijaaa/vol7/iss4/7DOI: https://doi.org/10.15394/ijaaa.2020.1528

Figure 3. GCR, flight distance for Group A, and flight distances for Group B.
As depicted in Figure 3, the flights in Group A had higher flight distances
than the flights in Group B. The average increase in flight distance was 3.47%. As
depicted in figure 4, the percentage difference between group A flights and group
B flights remained largely constant with an increase in GCR distance. However,
the absolute difference (Nautical Miles) increases with an increase in GCR
distance.
Figure 4. Percentage change in flight distances with GCR.
0
1000
2000
3000
4000
5000
1 2 3 4 5 6 7 8 9 10
Nau
tica
l Mile
s
Flights
GCR Distance and Flight Distances for Group A and Group B Flights
GCR Group A Group B
0.00%
0.50%
1.00%
1.50%
2.00%
2.50%
3.00%
3.50%
4.00%
4.50%
0
500
1000
1500
2000
2500
3000
3500
4000
4500
1 2 3 4 5 6 7 8 9 10
Per
cen
tage
Ch
ange
Nau
tica
l Mile
s
Flight
GCR Distance and Percentage Changes
GCR % Change
13
Misra: Performance-Based Navigation on Fuel and Block Time Efficiency
Published by Scholarly Commons, 2020

Flight Time
The flight times calculated in this analysis include the time from take-off
at the departure airport to landing at the arrival airport. Taxi times at the departure
and arrival airports were not included in the analysis. Figure 5 depicts the flight
times for group A and group B flights.
Figure 5. Flight times (minutes) for flights in Group A and Group B.
As depicted in figure 5, the flights in Group A had higher flight times than
the flights in Group B. The average increase in flight times was 7.277%. Figure 6
depicts the percentage change in flight times for flights with increasing GCR
distance.
0
100
200
300
400
500
600
700
1 2 3 4 5 6 7 8 9 10
Min
ute
s
Flight
Flight Times for Flights in Group A and Group B
Group A Group B
14
International Journal of Aviation, Aeronautics, and Aerospace, Vol. 7 [2020], Iss. 4, Art. 7
https://commons.erau.edu/ijaaa/vol7/iss4/7DOI: https://doi.org/10.15394/ijaaa.2020.1528

Figure 6. Percentage increase in flight times between Group A and Group B with
GCR distance (NM).
Flight Fuel Usage
For this analysis, the fuel usage was analyzed from the time the aircraft
took off at the departure airport to the time the aircraft landed at the arriving
airport. The fuel usage during taxi was not considered in the analysis. Figure 7
depicts the difference in fuel usage for the flights in Group A and flights in Group
B.
Figure 7. Fuel usage for flights in Group A and Group B.
0.00%
2.00%
4.00%
6.00%
8.00%
10.00%
12.00%
0
500
1000
1500
2000
2500
3000
3500
4000
4500
1 2 3 4 5 6 7 8 9 10
Per
cen
tage
Ch
ange
Nau
tica
l Mile
s
Flight
GCR Distance and Percentage Change
GCR % Change
0
20000
40000
60000
80000
100000
120000
140000
160000
1 2 3 4 5 6 7 8 9 10
Po
un
ds
of
Fuel
Flight
Flight Fuel Usage for Flights in Group A and Group B
Group A Group B
15
Misra: Performance-Based Navigation on Fuel and Block Time Efficiency
Published by Scholarly Commons, 2020

As depicted in figure 7, the flights in Group A had higher fuel usage than
the flights in Group B. The average increase in fuel usage was 2.34%. Figure 8
depicts the percentage change in flight times for flights with increasing GCR
distance.
Figure 8. Percentage increase in fuel usage between Group A and Group B with
GCR distance (NM).
Analysis by Flight Segment
For the purpose of this study, the flights were segmented into departure,
en-route, and en route segments. The fuel usage and time to climb were analyzed
for each segment for every simulated flight.
Departure segment
For this analysis, the departure segment of a flight is considered the
segment of a flight when an aircraft takes-off from the departure airport and
climbs to the cruise altitude. The data recorded from Aerowinx was filtered to
only analyze data in the departure segment. Figure 9 depicts the time taken by the
flights of Group A and Group B during the departure segment. The average
increase in time (departure segment) for Group A compared to time for Group B
was 14.93%. The time differences between Group A and Group B do not
significantly change with an increase in GCR distance as all flights utilized a
common flight altitude of FL340 (except flights A1 and B1 in Table 1)(Figure 9).
0.00%
0.50%
1.00%
1.50%
2.00%
2.50%
3.00%
3.50%
0
500
1000
1500
2000
2500
3000
3500
4000
4500
1 2 3 4 5 6 7 8 9 10
Per
cen
tage
Ch
ange
Nau
tica
l Mile
s
Flight
GCR Distance and Percentage Change
GCR % Change
16
International Journal of Aviation, Aeronautics, and Aerospace, Vol. 7 [2020], Iss. 4, Art. 7
https://commons.erau.edu/ijaaa/vol7/iss4/7DOI: https://doi.org/10.15394/ijaaa.2020.1528

Figure 9. Time is taken to climb to cruise altitude for flights in Group A and
Group B.
Figure 10 depicts the fuel used by the flights of Group A and Group B
during the departure segment. The average increase in fuel usage (departure
segment) for Group A compared to time for Group B was 2.46%. The percentage
change in fuel usage for Group A and Group B remains largely constant with an
increase in route distance.
Figure 10. Fuel usage for departure to cruise altitude for flights in Group A and
Group B.
0.00%
5.00%
10.00%
15.00%
20.00%
25.00%
0.00
5.00
10.00
15.00
20.00
25.00
30.00
1 2 3 4 5 6 7 8 9 10
Per
cen
tage
Ch
ange
Min
ute
s
Flight
Time: Climb
Group A Group B % Change
0.00%
0.50%
1.00%
1.50%
2.00%
2.50%
3.00%
3.50%
4.00%
0
500
1000
1500
2000
2500
3000
3500
4000
1 2 3 4 5 6 7 8 9 10
Per
cen
tage
Ch
ange
Po
un
ds
of
Fuel
Flight
Fuel: Climb
Group A Group B % Change
17
Misra: Performance-Based Navigation on Fuel and Block Time Efficiency
Published by Scholarly Commons, 2020

En route segment
For the purpose of this analysis, the en-route segment of flight will be
considered the segment of the flight when the aircraft reaches the cruise altitude
to the point when the aircraft commences descent to the arrival airport. Figure 11
depicts the time taken by the flights of Group A and Group B during the en route
segment. The average increase in time (en route segment) for Group A compared
to time for Group B was 11.84%. The time in the en route segment for Group A
is significantly higher than time in the en route segment for Group B.
Figure 11. Time of flight in the en route segment.
Figure 12 depicts the fuel usage by the flights of Group A and Group B
during the en route segment. The average increase in fuel usage (en route
segment) for Group A compared to time for Group B was 2.93%. The fuel usage
in the en route segment for Group A is significantly higher than the fuel usage for
Group B.
0.00%
2.00%
4.00%
6.00%
8.00%
10.00%
12.00%
14.00%
16.00%
18.00%
0.00
100.00
200.00
300.00
400.00
500.00
600.00
700.00
1 2 3 4 5 6 7 8 9 10
Per
cen
tage
Ch
ange
Min
ute
s
Flight
Times: En-route
Group A Group B % Change
18
International Journal of Aviation, Aeronautics, and Aerospace, Vol. 7 [2020], Iss. 4, Art. 7
https://commons.erau.edu/ijaaa/vol7/iss4/7DOI: https://doi.org/10.15394/ijaaa.2020.1528

Figure 12. Fuel usage for flights in the en route segment.
Arrival segment
For the purpose of this analysis, the arrival segment of a flight will be
considered the segment of the flight when the aircraft begins the descent from the
en route segment to the arrival airport. Figure 13 depicts the time taken by the
flights of Group A and Group B during the arrival segment. The average increase
in time (arrival segment) for Group A compared to time for Group B was 10.47%.
The percentage change in time for Group A and Group B remains largely constant
with an increase in route distance.
0.00%
1.00%
2.00%
3.00%
4.00%
5.00%
6.00%
7.00%
0
20000
40000
60000
80000
100000
120000
140000
1 2 3 4 5 6 7 8 9 10
Per
cen
tage
Ch
ange
Po
un
ds
of
Fuel
Flight
Fuel: En-route
Group A Group B % Change
19
Misra: Performance-Based Navigation on Fuel and Block Time Efficiency
Published by Scholarly Commons, 2020

Figure 13. Flight times during the arrival segment.
Figure 14 depicts the fuel usage by the flights of Group A and Group B
during the arrival segment. The average increase in fuel usage (arrival segment)
for Group A compared to time for Group B was 2.48%. The percentage change in
fuel usage for Group A and Group B remains largely constant with an increase in
route distance.
Figure 14. Fuel usage during the arrival segment.
0.00%
5.00%
10.00%
15.00%
20.00%
25.00%
0.00
5.00
10.00
15.00
20.00
25.00
30.00
1 2 3 4 5 6 7 8 9 10
Per
cen
tage
Ch
ange
Min
ute
s
Flight
Time: Arrival
Group A Group B % Change
0.00%
0.50%
1.00%
1.50%
2.00%
2.50%
3.00%
3.50%
2000
2100
2200
2300
2400
2500
2600
2700
2800
1 2 3 4 5 6 7 8 9 10
Per
cen
tage
Ch
ange
Po
un
ds
of
Fuel
Fuel
Fuel: Arrival
Group A Group B % Change
20
International Journal of Aviation, Aeronautics, and Aerospace, Vol. 7 [2020], Iss. 4, Art. 7
https://commons.erau.edu/ijaaa/vol7/iss4/7DOI: https://doi.org/10.15394/ijaaa.2020.1528

Discussion
The purpose of this study was to analyze the effects of PBN on fuel and
block time efficiency. As reviewed in the literature, fuel and block times can
affect the efficiency and profitability of an airline. The FAA explained that the
introduction of PBN will allow aircraft to fly more optimized routes and fly more
efficient procedures into and out of airports in the terminal airspace. In this study,
20 flights on a Boeing 747-400 were simulated for 10 different city-pairs. The
analysis function of the Aerowinx Precision Simulator was utilized to derive the
results of this study.
In terms of the route distance from the origin airport to the destination
airport, the route distances for Group A and Group B flights were larger than the
GCR distance for all 10 city-pairs. Although a large focus in the development of
PBN has been to increase the availability of direct routes, it is an operationally
complex to develop routes that are almost the same distances as the GCR
distance. However, the results indicate that utilizing newer GPS routes allow
aircraft to fly shorter routes. The average decrease in route distance for Group B
flights in comparison to Group A flights was 3.47%. Additionally, the results
indicated that with an increase in route distance, the absolute difference in
distance (nautical miles per route) increased which indicates an increased
advantage for utilizing advanced PBN routes and procedures on longer routes.
This decrease in route distance resulted in a decrease in flight times and fuel
usage for Group B flights in comparison to Group A flights. The simulations
utilized for this study do indicate increased fuel savings of approximately 2.34%
for utilizing advanced PBN procedures. These savings will not only result in
increased profitability margins for the airlines but also decrease fuel emissions.
While 2.34% might only result in limited fuel savings for operators with small
scale operations, larger operators/airlines can substantially reduce fuel usage if
PBN procedures are utilized on the entire fleet. Additionally, the fuel saved per
route (Pounds of fuel saved per trip) increased with an increase in route distance.
So while utilizing PBN procedures might bring limited benefits for airlines flying
shorter regional routes, airlines operating aircraft on long haul routes will gain
significant advantages in terms of fuel savings. The results of the percentage fuel
savings from this study can be utilized for an enhanced cost-benefit analysis by
comparing the average cost savings due to lower fuel usage and the cost of
equipping and maintaining the aircraft fleet to comply with PBN regulations. A
cost-benefit analysis for an operator should consider factors such as fleet type,
average route distance for the operator, type of airports operated (core vs non-core
airports), and the cost of maintenance.
The simulation utilized for this study also indicated an increase in time
savings with an increase in route distance. While the time savings were observed
to be marginal for shorter routes (3-10 minutes), the time savings can be
21
Misra: Performance-Based Navigation on Fuel and Block Time Efficiency
Published by Scholarly Commons, 2020

significantly larger for long haul routes (>20 minutes). Saving of more than 20
minutes per flight can significantly increase block time efficiency for an airline
when considering large scale operations. Increased block time efficiency allows
for increased utilization of each aircraft which can lead to increased profits. As
observed in the results for time savings, the benefits offered for shorter routes are
limited and there is a need for a cost-benefit analysis for smaller operators
operating flights on shorter routes. This cost-benefit analysis needs to consider
factors such as aircraft fleet, cost of maintaining and equipping aircraft to comply
with PBN regulations, types of airports operated (core vs non-core airports), and
average route distance for the operator. The cost-benefit analysis can be a
foundation for future research.
The results were also divided in terms of time and fuel usage for the
climb, en-route, and en route segments. The largest savings in fuel and time were
observed in the en route segment which is because an aircraft spends the most
time in a flight during the en route segment and is most likely to gain the largest
benefits (minutes and pounds of fuel saved). In comparison to Group A flight,
Group B had higher fuel savings (mean savings of 2.46%) and time savings (mean
savings of 14.93%) during the en route segment. While the percentage changes in
terms of fuel and time savings were largely constant with an increase in route
distance, the absolute values of fuel and time increased significantly offering
increased benefits in long haul routes in comparison to short-haul routes. It is
critical to consider that for longer routes, the fuel-on-board the aircraft during the
take-off segment was larger than the fuel-on-board for shorter routes which
resulted in an increase in the take-off weights of the aircraft. An increase in the
weight of the aircraft will not only lead to degraded performance but also lead to
increased fuel usage. This needs to be factored in while analyzing the results of
the fuel and time savings during the departure segment. For the arrival segment,
the fuel and time savings remained marginal with an increase in route distance for
Group A and Group B. Irrespective of the route distance, flights are
approximately near at the same weight and fuel remaining during the arrival
segment which results in largely equal performance irrespective of route
distances. However, the marginal time and fuel savings can lead to increased time
and fuel savings for large operators when these marginal savings are multiplied
for the entire fleet. In comparison to Group A flight, Group B had higher fuel
savings (mean savings of 2.48%) and time savings (mean savings of 10.47%)
during the en route segment. While the percentage changes in terms of fuel and
time savings were largely constant with an increase in route distance, the absolute
values of fuel and time increased significantly offered increased benefits in long
haul routes in comparison to short-haul routes.
The results in this study provide a more comprehensive perspective when
considered for an operator with large scale operations. Fuel savings of 2.48%
22
International Journal of Aviation, Aeronautics, and Aerospace, Vol. 7 [2020], Iss. 4, Art. 7
https://commons.erau.edu/ijaaa/vol7/iss4/7DOI: https://doi.org/10.15394/ijaaa.2020.1528

might not be significant for a single flight but can lead to significant profit
margins for an airline that operates more than 1,000 flights a day. Similarly, a
saving of 10-20 minutes might seem insignificant when considering a single flight
but can lead to increased efficiency, higher fleet utilization, and the possibility of
an additional flight per day for an aircraft when the results are multiplied for the
entire fleet of a large operator.
Conclusion
The purpose of this study was to analyze the effects of PBN on fuel and
block time efficiency. While the results of this study have multiple limitations, the
study provides a literature foundation for future studies to study the economic
feasibility and cost-benefit analysis for the benefits offered by PBN for operators
with different route distances and types of operations. Utilizing advanced PBN
routes and procedures had a direct impact on fuel and block time efficiency for
the simulated flights. While the percentage changes in terms of fuel and time
savings were largely constant with an increase in route distance, the absolute
values of fuel and time increased significantly offering increased benefits in long
haul routes in comparison to short-haul routes. These benefits were observed
because, with an increase in PBN capability, the flights were flown on shorter
routes and utilized more efficient departure and arrival procedures. Operators
operating on long haul routes with larger operations will benefit in terms of fuel
expenditure and time savings by investing in equipping and maintaining the
aircraft to comply with higher PBN capability requirements. For an airline, this
benefit will not only result in decreased fuel expenditure but also will allow
airlines to adjust block times that will help airlines in disruption management,
reduce delays, optimize operational procedures such as cost index, and increase
aircraft utilization. This study analyzed the benefits offered by PBN to operators
and the benefits offered with PBN are expected to improve as we move towards
the Charlie and Delta segments of the PBN implementation plan. With the Charlie
and Delta segment of the PBN implementation to be completed by 2030, the users
of the NAS will benefit from the economic and operational advantages offered by
PBN.
Limitations
The study has several limitations and it is critical to be aware of the
limitations before interpreting the results of this study. All the data utilized for
this study was gathered from a simulator for a Boeing 747-400. The operational
parameters analyzed in this study might vary when the same study might be
conducted in an actual aircraft. Additionally, only 10 city-pairs with 20
simulations were analyzed. A study analyzing FDR data from a larger sample set
with repeated flights in the same city-pair will offer data that can be more easily
generalized. All the city-pairs were restricted to the US and airports that were
23
Misra: Performance-Based Navigation on Fuel and Block Time Efficiency
Published by Scholarly Commons, 2020

categorized as core airports by the FAA. While the results of this study have
multiple limitations, the study provides a literature foundation for future studies to
study the economic feasibility and cost-benefit analysis for the benefits offered by
PBN for operators with different route distances and types of operations.
24
International Journal of Aviation, Aeronautics, and Aerospace, Vol. 7 [2020], Iss. 4, Art. 7
https://commons.erau.edu/ijaaa/vol7/iss4/7DOI: https://doi.org/10.15394/ijaaa.2020.1528

References
Aerowinx. (2020). Introduction. Aerowinx Precision Flight Simulator.
http://www.aerowinx.com/
Eagan, M. E., & Gundry, R. (2018). Airport noise and performance-based
navigation: A force for good or evil? Journal of Airport
Management, 12(4), 359-369. https://www.ingentaconnect.com/
content/hsp/cam/2018/00000012/00000004/art00005
Fan, T. (2019). Schedule creep – In search of an uncongested baseline block time
by examining scheduled flight block times worldwide 1986–2016.
Transportation Research Part A: Policy and Practice.
https://doi.org/10.1016/j.tra.2019.01.006
Federal Aviation Administration. (2016a). Approval guidance for RNP operations
and barometric vertical navigation in the U.S National Airspace System
and in oceanic and remote continental airspace. Advisory Circular 90-
105A. https://www.faa.gov/documentLibrary/media/Advisory_Circular
/AC_90-105A.pdf
Federal Aviation Administration. (2016b). PBN NAS navigation strategy 2016.
U.S Department of Transportation. https://www.faa.gov/nextgen/
media/PBN_NAS_NAV.pdf
Federal Aviation Administration (2018). NextGen implementation plan 2018-19.
Office of NextGen. https://www.faa.gov/nextgen/media/
NextGen_Implementation_Plan-2018-19.pdf
Federal Aviation Administration. (2020a). Aeronautical information manual
2020. Washington, DC: Author.
Federal Aviation Administration. (2020b). Modernization of U.S. airspace. United
States Department of Transportation. https://www.faa.gov/nextgen/
Federal Aviation Administration. (2020c). Performance reporting: Details. United
States Department of Transportation. https://www.faa.gov/nextgen/
reporting/details/
Ferguson, J., Kara, A., Hoffman, K., & Sherry, L. (2013). Estimating domestic
US airline cost of delay based on the European model. Transportation
Research Part C. Emerging Technologies.
https://doi.org/10.1016/j.trc.2011.10.003\
International Civil Aviation Organization. (2008). Performance-based navigation
(PBN) manual: Doc 9613. https://www.icao.int/SAM/Documents/2009/
SAMIG3/PBN%20Manual%20-%20Doc%209613%20Final%205%
2010%2008%20with%20bookmarks1.pdf
Kang, L., & Hansen, M. (2018). Assessing the impact of tactical airport surface
operations on airline schedule block time setting. Transportation Research
Part C. Emerging Technologies, 89, 133-147.
https://doi.org/10.1016/j.trc.2018.01.018
25
Misra: Performance-Based Navigation on Fuel and Block Time Efficiency
Published by Scholarly Commons, 2020

Kasim, K. (2017). Assessing the benefits of performance-based navigation
procedures. Journal of Aviation Technology and Engineering, 7(1), 45-49.
https://doi.org/10.7771/2159-6670.1145
Maria, L., Vaaben, B., & Barnhart, C. (2017). Integrated disruption management
and flight planning to trade off delays and fuel burn. Transportation
Science, 51, 1, 88-111. https://doi.org/10.1287/trsc.2015.0609
Nakmura, D., & Royce, W. (2008). Operational benefits of performance-based
navigation. Boeing Aero Magazine. https://www.boeing.com/commercial/
aeromagazine/articles/qtr_2_08/AERO_Q208_article3.pdf
Navblue. (2020). N-flight planning. Navblue: An Airbus company.
https://www.navblue.aero/product/n-flight-planning/
Sohoni, M., Lee, Y., & Klabjan, D. (2011). Robust airline scheduling under block
time uncertainty. Transportation Science, 45(4), 451-464.
http://doi.org/10.1287/trsc.1100.0361
Tian, Y., Wan, L., Chen, C., & Yang, Y. (2015). Safety assessment method
performance-based navigation airspace planning. Journal of Traffic and
Transportation Engineering. https://doi.org/10.1016/j.jtte.2015.08.005
U.S Department of Transportation. (2020). Airlines and Airports: Traffic. Bureau
of Transportation Statistics. https://www.transtats.bts.gov
/Data_Elements.aspx?Data=2
26
International Journal of Aviation, Aeronautics, and Aerospace, Vol. 7 [2020], Iss. 4, Art. 7
https://commons.erau.edu/ijaaa/vol7/iss4/7DOI: https://doi.org/10.15394/ijaaa.2020.1528