Embed Size (px)
Citation preview

Simulating Potential Layouts for a Proton Therapy Treatment Center
Stuart Price-University of MarylandBruce Golden- University of Maryland
Edward Wasil- American UniversityHoward Zhang- University of Maryland School of Medicine
INFORMS HealthcareChicago, Illinois
June 2013
Outline
• Introduction to Proton Therapy• Modeling the System• Potential Layouts• Patient Scheduling• Future Work
2

3
Motivation
• In 2012, an estimated 1.6 million Americans were diagnosed with some form of cancer
• Approximately 60% of all U.S. patients with cancer are treated with radiation therapy, most of them with external beam radiation therapy
• Radiation therapy, while effective at destroying cancerous tissue, also tends to irradiate healthy tissue in the process causing unwanted side effects
• Proton therapy has the potential to deliver a lethal radiation dose to the tumor while delivering less radiation to adjacent tissue than current alternatives

Proton Therapy
• Proton therapy uses high energy protons to irradiate tumors
• Has the potential to more accurately deliver radiation, with less damage to adjacent tissue than current standard x-ray IMRT
• Limited availability due to high cost of initial investment, with new facilities costing upwards of $200 million
4
Proton Therapy
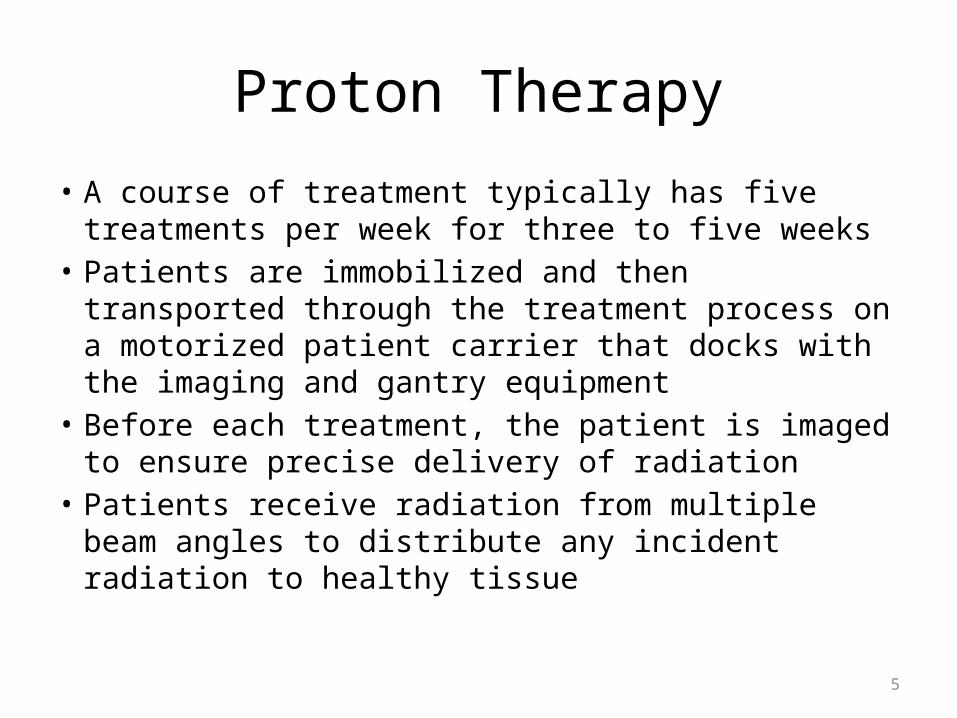
• A course of treatment typically has five treatments per week for three to five weeks
• Patients are immobilized and then transported through the treatment process on a motorized patient carrier that docks with the imaging and gantry equipment
• Before each treatment, the patient is imaged to ensure precise delivery of radiation
• Patients receive radiation from multiple beam angles to distribute any incident radiation to healthy tissue
5

Previous Work
Fava et al. (2012) simulate a comparison of remote positioning versus in-gantry positioning of patients for proton therapy centers• Used plans with up to nine minutes of beam time• Imposed strict limit of no more than three
minutes of waiting during any stage of treatment• Scheduled patients without considering their
treatment plan
6

Waiting Room
• Arrive for treatment
Imaging Room
• Loaded onto transporter
• Immobilized• Imaged by CT scanner
Gantry Room
• Dock transporter with gantry
• Receive treatment• Dismount from
transporter and discharged
Patient Flow Through the System
7

8
X-ray Computed Tomography
• Scan is taken prior to every treatment
• Patient is immobilized in imaging room, then scanned
• Landmarks are placed to aid in the correct delivery of radiation
9
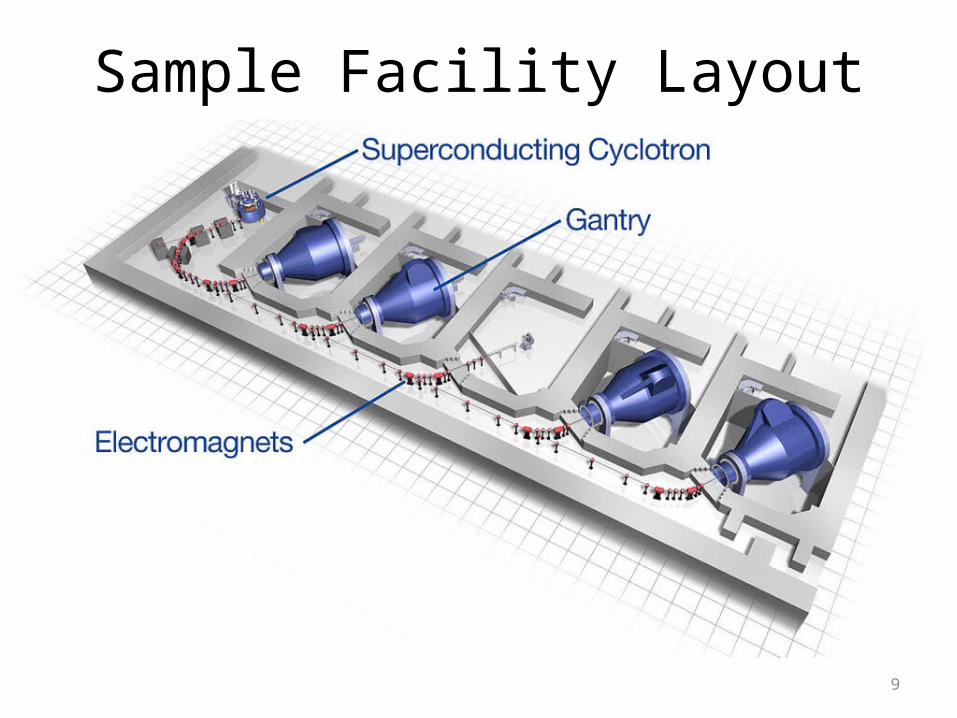
Sample Facility Layout

10
The Cyclotron and Room Switching• Cyclotron is able to deliver
protons to a single gantry room at any point in time
• The cyclotron is the single most expensive piece of equipment in the facility
• Switching delivery of protons from one gantry room to another incurs a delay of one minute

The Gantry Room
• Gantry must be rotated between each beam angle, a process that takes approximately 90 seconds
11

Simulation
• NetLogo 5.0.4, an open source multi-agent modeling programming language, was used to construct the simulation
• Treatment times were estimated based on Fava et al. (2012) and manufacturer specifications
• Triangular distributions were used to simulate the distribution of treatment times to ensure positive treatment times
12

Treatment Steps Mean Time(min)
Standard Deviation(min)
(1) Patient enters the facility
0.00 0.00(2) Imaging
16.49 6.35(3) Move to gantry room
1.23 0.00(4) Prepare for beam angles
6.49 1.38(5) First beam angle
1.00 0.00(6) Move gantry arm
1.50 0.00(7) Second beam angle
1.00 0.00(8) Move gantry arm
1.50 0.00(9) Third beam angle
1.00 0.00(10) Discharge patient and reset gantry room
5.18 2.11
13
Treatment Times
Treatment times are based on Fava et al. (2012) and manufacturer estimates

14
How Many Gantry Rooms Can a Cyclotron Support?
1 2 3 4 5 6 702468
101214161820
Gantry Rooms
Aver
age
Patie
nts P
er H
our
1 2 3 4 5 6 70
2
4
6
8
10
12
14
16
18
Gantry Rooms
Exce
ss T
ime
(min
utes
)
1 2 3 4 5 6 70
10
20
30
40
50
60
70
80
Gantry Rooms
% T
ime
Cyclo
tron
Idle
Average patients per hour, excess time in a gantry room (minutes), and percent of time that the cyclotron is idle as a function of the number of gantry rooms for a one cyclotron system. In this system, there is always a patient ready to enter an available gantry room.

How Many Gantry Rooms Can a Cyclotron Support?
• Adding a third gantry room increases throughput by 32%
• Adding a fourth increases throughput by a further 10%, but at maximum throughput, increases time spent waiting in the gantry room to almost four minutes
• Adding a fifth room only increases throughput by 2%; adding more rooms will not increase throughput since the cyclotron has no idle time
15

0 1 2 3 4 5 6 7 8 9 10 11 12 13 14 15 16 17 18 19 200
2
4
6
8
10
12
14
Distribution of Gantry Wait Times with Unlimited Imaging Rooms
3 Gantry Rooms4 Gantry Rooms5 Gantry Rooms
Length of Wait Time in Gantry Room (Minutes)
Perc
ent o
f Pati
ents
Wai
ting
16

Distribution of Waiting Times
• At maximum throughput in the three gantry room system the average wait time is 2.5 minutes and 43% of the patients wait more than three minutes
Number of Gantry Rooms
3 4 5
Average Wait Time 2.5 5.0 8.4
Standard Deviation of Wait time
1.7 2.7 3.9
17

Number of Rooms Number of Patients Time Spent (minutes)
Gantry Imaging Per Hour Per Day WaitingRoom
ImagingRoom
GantryRoom
Total
3 3 11.61 162.58 8.12 0.19 1.41 9.72
3 4 11.61 162.58 0.00 0.23 1.22 1.46
3 4 13.85 193.85 1.58 1.29 1.78 4.65
4 4 14.69 205.71 1.26 0.36 2.78 4.40
4 5 14.69 205.71 0.01 0.44 2.84 3.30
4 5 16.00 224.00 1.71 1.75 3.76 7.22
18
Wait Time as a Function of Arrival Rate

0.251.25
2.253.25
4.255.25
6.257.25
8.259.25
10.2511.25
12.250
2
4
6
8
10
12
Random Ordering
Wait Time (Minutes)
Perc
ent o
f Pati
ents
Wai
ting
19
Percent of patients experiencing wait times for a system with four gantry rooms and five imaging rooms using an arrival rate of 14.69 patients per hour (99% cyclotron utilization) for 10,000 patients.
Ordering Patients Based on Treatment Plan
0.25 11.75 2.5
3.25 44.75 5.5
6.25 77.75 8.5
0
2
4
6
8
10
12
Alternating Number of Beam Angles
Waiting RoomImaging RoomGantry Room
Wait Time (Minutes)
Perc
ent o
f Pati
ents
Wai
ting

Ordering Patients Based on Treatment Plan
By alternating the schedule between patients with 1,2, and 3 beam angle plans, we– Reduce total time in the system by more than
one minute– Reduce waiting time in the gantry room by
41 seconds– Reduce the percentage of patients waiting longer
than three minutes from 46% to 35%
20

Patient Tardiness and Absenteeism
• Proton therapy is available as an outpatient procedure with most of the local patients commuting daily for treatment
• Some fraction of the patients will be inpatients or be staying from out of town specially for treatment
• Patient tardiness and absenteeism are a major concern for outpatient procedures (Liu et al. 2010) and their effect on patient throughput and wait times may be significant
21
0.250.75
1.251.75
2.252.75
3.253.75
4.254.75
5.255.75
6.256.75
7.257.75
8.250
2
4
6
8
10
12
14
Waiting RoomImaging RoomGantry Room
Wait Time (Minutes)
Perc
ent o
f Pati
ents
Wai
ting
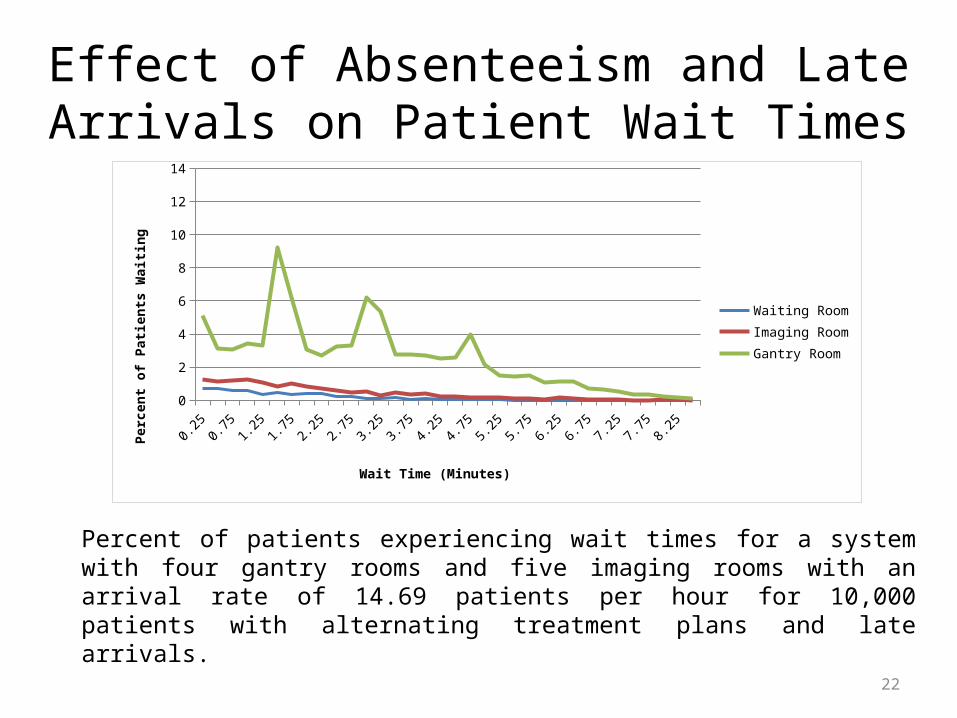
Percent of patients experiencing wait times for a system with four gantry rooms and five imaging rooms with an arrival rate of 14.69 patients per hour for 10,000 patients with alternating treatment plans and late arrivals.
22
Effect of Absenteeism and Late Arrivals on Patient Wait Times

Effect of Absenteeism and Late Arrivals on Patient Wait Times
• Despite seeing fewer total patients due to patient absenteeism, wait times increase by 16% in the gantry room and 27% throughout the system when patients have a chance of arriving late
• The status of each patient being inpatient or outpatient and local or out of town would effect the probability of tardiness and would be known prior to scheduling
23
Conclusions
• When designing a proton therapy treatment facility, a single cyclotron can achieve 99% utilization with four gantry rooms. The percent utilization is a function of the switching time, beam delivery time, and gantry arm rotation time
• Five imaging rooms are needed to fully utilize the four gantry rooms, since the imaging process takes longer than the total time spent in the gantry room
• When scheduling patients, it is necessary to take into account all available information, including the exact treatment plan and the status of the patient as an outpatient
24
Future Work
• Scheduling patients for batch arrival on the quarter hour, to better reflect hospital scheduling
• Identify the effects of potential technological and treatment advances
• Determine effect of patient mix on scheduling (i.e., pediatric patients require anesthesia)
25