Embed Size (px)
Citation preview

Victorian Clinical Skills Simulated Learning Environment Infrastructure Review Final Report November 2010

i
Table of Contents
1 Abbreviations ........................................................................................................................... iii
2 Key Messages ........................................................................................................................... vi
3 Executive Summary ..................................................................................................................vii
4 Introduction .............................................................................................................................. 1
4.1 Health care practitioner training in Victoria ........................................................................ 1
4.2 Simulated learning environments ....................................................................................... 2
4.2.1 Supporting the growth of SLEs .................................................................................... 2
4.3 The need to review Victorian SLE infrastructure ................................................................. 4
4.4 Methodology ..................................................................................................................... 4
4.4.1 Desktop Audit ............................................................................................................. 4
4.4.2 Stakeholder Identification .......................................................................................... 5
4.4.3 Activity Survey ............................................................................................................ 5
4.4.4 Improvement Survey .................................................................................................. 6
5 Desktop Audit ............................................................................................................................ 7
5.1 Contact details ................................................................................................................... 7
5.2 Funding .............................................................................................................................. 7
5.2.1 Equipment purchased................................................................................................. 7
5.3 Usage ................................................................................................................................. 8
6 Identifying Stakeholders .......................................................................................................... 11
7 Activity Survey Findings ........................................................................................................... 12
7.1 Response rate .................................................................................................................. 12
7.2 Organisation .................................................................................................................... 13
7.3 Equipment ....................................................................................................................... 15
7.4 Education ......................................................................................................................... 19
7.5 Training ............................................................................................................................ 22
7.6 Staffing ............................................................................................................................ 23
7.7 Budget ............................................................................................................................. 23
8 Improvement Survey Findings .................................................................................................. 26
8.1 Organisations with simulated learning environment infrastructure .................................. 28

ii
8.1.1 Improving Capacity ................................................................................................... 28
8.1.2 Improving Capability ................................................................................................. 35
8.1.3 General Improvements ............................................................................................. 44
8.2 Organisations without SLEs .............................................................................................. 48
8.3 Improving Victoria ............................................................................................................ 51
9 Discussion and Suggested Actions ............................................................................................ 53
9.1 Suggested Plan ................................................................................................................. 56
9.1.1 Staff recruitment and development .......................................................................... 56
9.1.2 Support Network ...................................................................................................... 57
10 Acknowledgements.............................................................................................................. 58
11 References ........................................................................................................................... 59
iii
1 Abbreviations ABG Arterial Blood Gas ACRRM Australian College of Remote & Rural Medicine ACME Acute Crisis Management in Emergency ACRM Anaesthesia Crisis Resource Management ACU Australian Catholic University Adv Advanced AED Automatic External Defibrillator ALS Advanced Life Support APLS Advanced Paediatric Life Support Art Arterial Line ARC Australian Resuscitation Committee ASSH Australian Society of Simulation in Healthcare ASSET Australian Surgical Skills Education and Training BDMH Benalla District Memorial Hospital BHS Ballarat Health Service BiPAP BiPhasic Positive Airway Pressure BLS Basic Life Support BoN Bachelor of Nursing BoN,P,M Bachelor of Nursing, Paramedicine, Midwifery CCU Critical care Unit Cert Certificate CGHS Central Gippsland Health Service CEO Chief Executive Officer CHI Centre for Health Innovation CNE Clinical Nurse Educator CNS Clinical Nurse Specialist COAG Committee of Australian Governments CPAP Continuous Positive Airway Pressure CPD Continuing Professional Development CPN Clinical Placement Network Cric Cricothroidotomy Crit Care Critical Care CRM Crisis Resource Management C Spine Cervical Spine CVAP Central Venous Access Port CVC Central Venous Catheter DME Director of Medical Education DH Department of Health DHS Department of Human Services Dip Diploma E&TC Emergency and Transit care EH Eastern Health ECG Electro Cardiogram ED Emergency Department EDAAC Emergency Department Acute Airway Course EDCIC Emergency Department Critical Incident Course EMAC Early Management Anaesthesia Crises

iv
EMACIC Early Management Anaesthesia Crises Intensive Care ENT Ear, Nose and Throat FSEP Foetal Scalp Electrode Placement GETGP Gippsland Education & training in General Practice GNP Graduate Nurse Programme GOTAFE Goulburn Ovens Technical and Further Education GP General Practitioner HACC Home and Community Care HPE Health Professional Education HR Human Resources HWA Health Workforce Australia ICC Intercostal catheter ICU Intensive Care Unit ILS Immediate Life Support IDC In Dwelling catheter IMG International Medical Graduate IV Intravenous LMA Laryngeal Mask Airway LRH LaTrobe Regional Health Med Medical MEO Medical Education Officer MET Medical Emergency Team METTI METTI Human Patient Mannequin PICC Percutaneous Intravenous Central Catheter NHWT National Health Workforce Taskforce NGT Nasogastric tube NICU Neonatal Intensive Care Unit NP Naso pharyngeal PACRM Post Anaesthesia Crisis Resource Management Paed Paediatric PALS Paediatric Advanced Life Support PCA Patient Controlled Analgesia PDU Professional development Unit PEG Percutaneous endo gastric Periop Perioperative PG Post Grad PH Peninsula Health PMCV Post-graduate Medical Council of Victoria PTT Part task Trainer RACRM Rural Anaesthesia Crisis Resource Management RANZCOG Royal Australian & New Zealand College of Obstetricians &
Gynaecologists RACS Royal Australasian College of Surgeons RECRM Rural Emergency Crisis Resource Management RMH Royal Melbourne Hospital RMIT Royal Melbourne Institute of Technology RMO Resident Medical Officer RN Registered Nurse RTO Registered Training Organisation

v
RWH Royal Women’s Hospital Sim Simulation SimMan LaerdalR High-tech Human Patient Mannequin SLE Simulated Learning Environment SOUP Stabilisation Of the Unwell Patient SRMO Senior Resident Medical Officer StJoG St John of God SVH St Vincent’s Hospital Tech Technology (as in complexity of simulation equipment) TAFE Technical & Further Education TNH The Northern Hospital TtT Train-the-Trainer VU Victoria University WDHS Western District Health Service WHCG Wimmera Health Care Group WMH Werribee Mercy Hospital

vi
2 Key Messages The Victorian Clinical Skills Simulated Learning Environment Infrastructure Review (SLE Review) was aimed at identifying the current barriers to capability and capacity of SLEs and how they could be removed. Recognising the current clinical placement climate in Victoria, it may be assistive to summarise these findings for ease of referral to sections or figures within the report, to facilitate SLE plans for Clinical Placement Networks (CPNs) or for use in funding applications.
Notes about the data Many respondents noted how busy they were with their work and other requests for information. This is likely to have affected the quantity and quality of data provided. Indeed, the authors are aware that some SLEs were unable to contribute to the review.
SLE distribution SLEs are located in every Victorian CPN. Depending on which survey is likely to be more accurate, high-tech SLEs are in all but three CPNs (Activity Survey data Table 8, page 16), or in all CPNs (Improvement Survey data Table 19, page 29).
SLE use For many organisations, SLE infrastructure is often purchased and used with a limited audience in mind. With most SLE equipment only used for half the time it is available for use (Table 9, page 17), it may be possible to broaden use to other areas. These areas may include introduction activities for high school students, vocational education and training (VET) courses, and skills currency and up-skilling different craft groups.
Barriers to increasing capacity and capability The vast majority of respondents indicated their SLE is not used to full capacity or capability (Section 8.1.1 Improving Capacity, page 28 and Section 8.1.2 Improving Capability, page 35). Skills/training of staff was the most nominated barrier to capacity (Table 20, page 30 and Figure 4, page 31) and the second most nominated barrier to capability (Table 23, page 37 and Figure 9, page 38). For both capacity and capability, respondents indicated a need for expertise in scenario design and further support to attend staff training (Figure 6, page 33 and Figure 11, page 40). Number of staff (specifically teaching staff) was the third biggest barrier to capacity (Figure 5, page32) and the biggest barrier to capability (Figure 10, page 39). Equipment storage space was the second biggest barrier to improving capacity (Table 20, page 30), but was ranked seventh for improving capability. Of note, lack of simulation equipment was only the eighth biggest barrier to capacity and fourth biggest barrier to capability.
Advice to planners Most, if not all CPNs have the range of SLE facilities within them. As funding becomes available from various sources, it will be important to recognise this and tailor applications accordingly including coordinating use of facilities within and across CPNs. Furthermore, although equipment for SLE is often requested, it is clear from this review that equipment is not the biggest barrier to improving SLE capability or capacity. Indeed, a very large proportion of equipment is not fully utilised.
From this review, it is clear that at this point in time improving staffing and staff training will be an effective way of increasing SLE capability and capacity. The review suggests teaching staff are required, followed by technical staff. Prior to recruitment, planers should investigate the relationship between their technical and teaching staff. Currently, many teaching staff perform both roles. As such, it may be more cost- and time-effective to hire and/or train technical staff compared to teaching staff. This will be an important consideration if time or money is limited (staff roles and training are discussed in Section 9.1.1 Staff recruitment and development, starting on page 56).

vii
3 Executive Summary Current and projected health workforce shortages will place increasing strain on the health service system to both deliver health care and educate future health care practitioners. Health care stakeholders – education providers, health services and the Department of Health (DH) – now face the challenge of identifying and implementing innovative solutions to address these shortages. One such solution is the use of simulation and simulated learning environments (SLEs). Each stakeholder, therefore, has an important role to play in supporting the use of simulation to improve efficiency of available clinical education and training, and to ensure recognition and support of all of the roles responsible for guaranteeing a health system with capacity to meet demand.
In 2005, the Department of Human Services , now DH, supported the development or enhancement of over 30 clinical skills SLEs across Victoria as well as the development of clinical skills Train-the-Trainer programmes. This was followed by the release of a strategy aimed at enhancing the capacity and quality of clinical placements in health services. The strategy promoted an integrated approach to the use and allocation of new and existing resources including SLEs. It has witnessed the implementation of Clinical Placement Networks, that will soon be responsible for the coordination of many clinical training activities, including development of simulation facilities and learning via simulation.
At a national level, Health Workforce Australia (HWA) (replacing the National Health Workforce Taskforce) is proposing to establish a similar clinical placement management model. HWA has also initiated investigations into the role of simulation within healthcare curricula, with funding for further simulation equipment and infrastructure developments likely to be available in early 2011.
The strong support for the development of simulation facilities has led to a rapid growth in their number across the state. The aim of the Victorian Clinical Skills SLE Infrastructure Review was to focus on the type, capability and deployment of SLE equipment, their current utilisation rates and patterns, and by whom the resources are being used. The project also explored the resourcing required to increase or extend utilisation or access to simulation and SLEs.
This report details the findings of the project conducted from May to September 2010. The first phase involved the summary of clinical skills infrastructure data previously collected by the DH. The second phase involved identifying key informants and stakeholders to develop a comprehensive contact list of people/organisations known to have SLEs and to identify others interested in partaking in the review. Phase 3 utilised the information identified from Phases 1 and 2 to collect data, via a survey, on current SLE infrastructure and associated activities. Finally, Phase 4 sought the views of stakeholders and key informants about how SLEs and SLE infrastructure could be improved, with a major focus on capacity and capability improvement.
From the activity survey, it was evident staffing was a major issue. Respondents cited lack of staffing as a factor in completing the survey on time and dedicated staff numbers were very low – on average less than one FTE per simulation facility. Furthermore, although almost all staff listed had some form of simulation training, in most cases this was on-the-job and only 30% had another form of training. The activity survey also highlighted the potential for increasing SLE capacity, as the vast majority of equipment (across all responses received) was used for less than half of the time it was reported as being available for use.
These findings were confirmed in the Improvement Survey – only 10% of respondents indicated their SLE was used to its full capacity and only 5% indicated their SLE was used to its full capability. Not surprisingly, the number of staff and skills/training of staff were identified as the major factors affecting both capacity and capability. Other important factors included time pressures, lack of

viii
potential partners and support systems, and a need for increased buy-in from management. Staffing numbers were also identified as an issue, preventing the delivery of clinically important/relevant courses. More than half of the respondents noted that they potentially could provide professional development and joint educational sessions to others outside their own institution but that staff availability was the biggest barrier to this happening. Interestingly, simulation equipment was less of a factor affecting SLE usage; however, this could be related to a lack of storage space within SLEs also being identified as a major barrier to increasing capacity and capability.
The overwhelming theme across this entire project is the need to improve staffing – so much so that difficulties completing the survey were identified as an example of this. The complex role of “Simulation Professional” is emerging as a challenging factor when staffing requirements are being considered and work is required to better define the roles of staff and staff structures within SLEs. Provision of funding for role development, recruitment and training of staff, development of staff training packages and funding to complete existing courses is required. Other staff support such as development of support networks, sharing of educational resources and software is required and could be supported by the DH and coordinated through Clinical Placement Networks. A central planning agency has a key role to play in the development of a long-term, supported and structured plan to provide initial stability and ongoing sustainability to an emerging workforce involved in delivering and being educated by simulated learning activities.
As a result of the findings of project, seven actions are suggested (summarised below) and a plan is provided for staff recruitment and development as well as the creation of a simulation support network.
Summary of suggested actions: Suggested Action 1 – Consider the creation of a statewide SLE plan and explore the feasibility and shape of a statewide SLE plan with stakeholders.
Suggested Action 2 – Encourage stakeholders that did not participate in this SLE project, to participate in the next (and subsequent) ones.
Suggested Action 3 – Liaise with SLEs about the requirements for additional staff and building dedicated staffing resources into SLE business plans and forward planning.
Suggested Action 4 – Liaise with SLEs to better define the roles of staff and the staffing structure within SLEs.
Suggested Action 5 - Explore options and partnerships to support the development of training for SLE staff with consideration of emerging roles.
Suggested Action 6 – Encourage SLEs to help identify solutions to the space issues, particularly for those locations where building or expanding is not an option.
Suggested Action 7 – Encourage SLEs and their parent organisation(s) to increase the likelihood/frequency of registrants attending entire training sessions – no matter what their craft group/discipline.
Suggested Action 8 – This report should be publicly available to inform future SLE investment and directions.

1
4 Introduction As noted in Better Skills Best Care, annual national workforce growth is predicted to be lower in the entire decade from 2020-2030 than the current annual rate. This is attributed to a range of factors, including insufficient take-up of current training places, a more mobile workforce and recruitment pressure (competition) from other jurisdictions and industries. As can be expected, the reduced growth in workforce will likely lead to workforce shortages and will come at a time when the ageing Victorian population will place an increased demand on the Victorian health system[1]. In turn, the workforce shortage and increased demand for health care will negatively affect the ability of health services to train staff and maintain staff skills – particularly if current approaches to training continue to be used. Thus, it is necessary to consider and implement innovative approaches to workforce recruitment, growth and development. Within this context, simulation and simulated learning environments (SLEs) are considered useful tools. For example, they may be used to increase interest in health care practice (through tours by high school students), reduce the burden of clinical placements (by replacing some clinical placement hours and/or complementing the clinical placement experience) and increase productivity (by providing training opportunities that maintain or advance skills or promote the use of new technology).
4.1 Health care practitioner training in Victoria Within Victoria, universities, Technical and Further Education institutes (TAFEs) and Registered Training Organisations (RTOs), primarily drive the training of health care practitionersa. The majority of courses include clinical training as an essential component of their curricula, with the need for clinical training extending beyond the initial years and well into professional practice, particularly if further specialisation is undertaken. A significant share of responsibility for training future health care practitioners lies with health services, with registered practitioners delivering most of the education in health care settings.
In recent years, Victoria has successfully campaigned to secure a significant number of additional Commonwealth-supported entry-level places (CSPs) in university-based health care practitioner courses[2]. The increase in CPS is in response to the current and projected shortages in the national health workforce (described above). As more learners enter the system, there has been a proportional increase in the required number of clinical placements, further impacting the (already over-burdened) health service sector. Added to this, education providers are broadening their offerings, providing educational services in many health disciplines, and this has further increased the competition for clinical placements.
More recently, the implementation of the Victorian Training Guarantee has meant that there is an unlimited number of government subsidised VET places available to eligible applicants – essentially Australian residents under 24 years studying a higher qualification than they already hold[3]. The guarantee has the potential to dramatically increase enrolments in health care practitioner courses and thus the requirement for clinical placements.
The growth in clinical placements has created an interesting paradox, whereby workforce shortages have necessitated a dramatic increase in trainees (and therefore clinical placements) that may be difficult to deliver because of workforce shortages. Thus, although clinical placements represent the future viability of the health system, it is important to find the balance that allows clinical training to meet the needs of the system within the resourcing capacity of the health services that comprise the system – and simulation and SLEs may represent part of the solution.
a Throughout this report, the term health care practitioner is used to describe all workers within the health
care system from support staff, to surgeons to allied health and everything in between.

2
Clinical placement difficulties are not unique to Victoria (or Australia), and academic literature from around the world indicates shortages exist in North America, Europe and Asia[4]. The shortages relate to many factors including more learners, fewer patients in traditional clinical placement settings, changes to treatment modalities and complexity, shortage of educators and an ageing workforce[4-5].
4.2 Simulated learning environments One solution to the difficulty of finding clinical placements is to reduce, replace or compliment them through greater use of simulation. Simulation is a very powerful methodology for the teaching of specific procedural skills as well as clinical management, teamwork, decision making and communication skills. This has resulted in an increase in the use of simulation to teach health care practitioners a range of skills[6].
The use of simulation and simulated environments (also called simulated learning environments, SLEs) as a workforce training or development tool is not a new concept. Pilots in training have been making use of flight simulators since 1929 (or even earlier). These simulators have varied in sophistication from providing an orientation to the controls and their effect on the plane, to actual aircraft cockpits linked to wide-field audio, visual and software systems, providing a fully immersive experience[7].
The use of SLEs in training health care practitioners, however, is a relatively new phenomenon. Despite the precedence in similar high-pressure, high-risk and high-complexity environments, many medical experts suggest countless health care practitioner activities are too complex to simulate accurately[8]. As technology and our understanding of biophysical processes have improved, SLEs have become an accepted part of health care practitioner education, including within Victoria[6, 9]. However, there is still a strong desire (probably stemming from a culture of evidence-based practice) to demonstrate the effectiveness of SLEs relative to a clinical placement[6, 9] and as an educational technique more broadly (e.g. for professional development activities such as maintaining skills currency, improving practice and introducing new technologies or methodologies).
4.2.1 Supporting the growth of SLEs Since 2005, stemming from the release of the Postgraduate Medical Council of Victoria (PMCV) report on Clinical Skills Education Requirements of the Health Professions in Victoria[10], the Department of Health (DH) has supported the development or enhancement of over 30 clinical skills SLEs across Victoria. These infrastructure investments have been further supported through the development of clinical skills train-the-trainer (TtT) programmes. Concurrently, there have been investments by individual health services, universities, TAFE institutes and other RTOs, in similar infrastructure. These developments have often been in partnership with Skills Victoria, state and federal government departments or through infrastructure funding programmes and grants.
In 2007, in response to the shortage in Victorian clinical placements mentioned above, the DH published a comprehensive strategy aimed at enhancing the capacity and quality of clinical placements in medicine, nursing and allied health in Victoria – Clinical Placements in Victoria: Establishing a Statewide Approach[2]. This strategy proposed a more integrated approach to the use and allocation of new and existing resources, including planning and funding for SLEs. Activities in place to support the clinical placements strategy are grouped under five main categories, of which clinical skills simulation is specifically mentioned in one – Promoting innovation – and activities forming part of this project also fall into the category of Planning and evidence.
Within the Planning and evidence category, improved organisational structures such as a statewide clinical placement agency were also proposed. In 2008, the DH released a discussion paper on the concepts and values of establishing such an agency – Clinical Placements in Victoria: Considering a

3
Clinical Placement Agency[11] – and the outcomes of consultations were documented in a second report - Clinical Placement Agency: Report on Consultation Workshops[12]. The report on consultation workshops highlighted the need to maintain the current investment in simulation. Furthermore, stakeholders felt greater use of simulation represented an opportunity to improve the efficiency of available clinical education and training and that a central planning agency had a role to play in disseminating information about available simulation facilities[12].
Following on from these reports and consultation sessions, the DH (in partnership with the Victorian Council of Health Deans) commissioned a project to provide advice on statewide governance arrangements for improving clinical placements in Victoria (including the management of simulation). The final report (A New Model of Clinical Placement Governance in Victoria[13]) proposed a multi-level regionally-based governance model. Within the report, it is suggested Regional Clinical Academies could play a role in maintaining and managing data on clinical placement activities within a region, including information about simulation facilities such as location, access, infrastructure and usage[14].
The role of the Regional Clinical Academy (now called Clinical Placement Network, CPN) has since been refined, covering assisting health services and education providers in[14]:
Local partnership building, Facilitating placement coordination, Research, Supporting organisations to record and analyse clinical placement planning data, Innovation, and Quality improvement.
It is expected simulation, SLEs, and SLE infrastructure will be covered under several CPN functions including innovation. In total 11 CPNs were proposed and accepted; five are rurally based (Barwon South-Western, Grampians, Loddon-Mallee, Hume and Gippsland) and six are metro based (Central, Western, Northern, Eastern, South and Peninsula). The full list of networks and the area they cover is described in A New Model of Clinical Placement Governance in Victoria[13].
In early 2010, a pathfinder project began in the Loddon-Mallee region, with the aim of leading and informing the establishment of CPNs across the state[14]. More recently, the search has begun for project officers to lead and manage the establishment of other CPNs across Victoria.
At the national level, the National Health Workforce Taskforce (NHWT) (formed by the Council of Australian Governments (COAG) in 2006 to oversee three key national areas of health workforce reform – Research, Planning and Data, Education and Training, and Innovation and Reform[15]) released a paper titled Clinical training – governance and organisation[16]. Stemming from reforms announced by COAG on 29 November 2008, the paper highlights the need for (and possible models of) a new national agency to manage $1.1 billion worth of health workforce initiatives (including over $90 million for SLE infrastructure and on-going operational costs)[17] to be spent over four years (starting in 2009). The newly created, Health Workforce Australia (HWA) has now subsumed the activities of the NHWT[18]. Within simulation, HWA have described their role as:
Increasing the use of simulated learning modalities. Optimising clinical training experiences through the use of learning programmes using
simulation techniques. Increasing equity of access for students to simulation techniques. Improving quality and consistency of clinical training[19].
Thus, via two separate processes (one state and one federal) central management/oversight arrangements for clinical placement activities, including simulation, have been proposed. Although

4
these two processes are now aligned, the national priority for the CPNs is largely limited to training within universities, whereas the Victorian CPNs will also included activities that occur within TAFEs and other RTOs.
4.3 The need to review Victorian SLE infrastructure The increased use of simulation in health and medical education, coupled with state and federal support for the development of infrastructure has allowed a rapid and large growth of SLEs across Victoria. The variability in funding sources and arrangements, coupled with the number and diversity of stakeholders who have implemented (or are seeking to implement) clinical skills SLEs has meant there are a large number of facilities in existence operating below their intended usage rates. Furthermore, the variety of governance, utilisation and funding models has made access by some universities, TAFEs and health services and other RTOs difficult. There is also anecdotal evidence of inappropriate doubling up and/or underutilisation of expensive equipment, expertise and infrastructure.
In their paper, A New Model of Clinical Placement Governance in Victoria[14] and the stakeholder consultation thereafter (Consultation Outcomes - A New Model of Clinical Placement Governance in Victoria)[20], Darcy Associates Consulting Services noted there is no statewide plan for SLEs[20]. This project will provide the DH with an opportunity to develop a statewide plan.
Since their establishment in early 2010, HWA has been busy announcing programmes and managing projects concerning increasing student training numbers and as well as clinical placements[21]. Recently, HWA announced several discipline-based projects aimed at investigating the role of simulation within a limited number of disciplines and how some skills could be safely and consistently taught through SLEs[19].
This set of circumstances (rapid growth of the sector, discipline-based SLE projects, imminent funding from HWA and the lack of a plan for SLEs within Victoria) highlights the need for a review of Victorian clinical skills SLEs. Furthermore, the creation of a plan for SLEs (following on from this review) will place Victoria in the best position to make use of the SLE funding announced by COAG (and likely made available through HWA) over the next three years[17].
4.4 Methodology The consultants (Dr Richard Huysmansb and Ms Jennifer Keastc) divided the activities of the project into four phases:
1. Desktop audit – review and summary of clinical skills SLE infrastructure data previously collected by the DH.
2. Creating contact lists – identification of key informants (those people/organisations known to have SLE infrastructure of relevance to this review) and stakeholders (those people/organisations that might have an interest in participating in the review).
3. Activity survey – at an organisational level, survey of key informants (and to a lesser extent, stakeholders) on their current SLE infrastructure and associated activities.
4. Improvement survey – at an individual level, survey of key informants and stakeholders on views on how SLEs and SLE infrastructure could be improved.
4.4.1 Desktop Audit Summary information of DH funding and audit data and were provided to the consultants in hard copy and subsequently electronically. These documents were reviewed, and data of interest (such as
b Dr Huysmans is from Raven Consulting Group
c Ms Keast is from Keast Simulation Consulting
5
funding amount, equipment purchased, usage information and contact details) were noted in a series of spreadsheets. These data informed future phases of the project.
4.4.2 Stakeholder Identification As part of the desktop audit, a contact list was created. The consultants, in consultation with DH staff, and using their knowledge of SLEs across Victoria, created a list of organisations and contact people. The people/organisations on this list were referred to as key informants.
Each key informant was contacted (via phone) to confirm that their organisation had an SLE and/or simulation infrastructure and to seek their willingness to participate in the SLE infrastructure review. Once confirmed, each key informant was sent (on 24 May 2010) a contact list to review and update (and return by 28 May 2010). In particular, they were asked to ensure contact people listed for their organisation were correct and to add organisations with SLE infrastructure that were not on the list.
4.4.3 Activity Survey In consultation with DH staff, a proforma was developed using MS Excel (see SLE Infrastructure Review - Activity Survey.xlsx). Other survey methodologies were considered (in particular a web-based survey created in Survey Monkey), however the large amount of data and desire for one response from each organisation, suggested the need for a survey that could be easily distributed amongst potential contributors. Furthermore, not all information being collected lent itself to the Survey Monkey format. Finally, by using MS Excel it was felt respondents would have more flexibility when providing responses.
The survey was provided as one excel file with multiple worksheets. Each worksheet included very brief instructions on how to complete that worksheet and covered a different aspect of SLE activity:
Organisation – An overview of the SLE covering name, location and type of SLE. It also asked broad questions about staff, operating hours, partner organisations, space and rooms occupied, booking processes and facility establishment date. Respondents were also asked to complete a table listing all of the people that contributed to the response.
Equipment – The major part of the survey. It listed the vast majority of simulation equipment a SLE might have and the education sessions they might run. It asked questions such as number of each item, training to use the item (as a teacher), usage and availability rates, resources required to use the item, set-up and pack-up times, and booking processes.
Education – Focused on educational activities the equipment is used for. Although a list of educational activities was provided in the Equipment worksheet, this worksheet covered more detail about each activity, such as disciplines taught, disciplines delivering the education, educators required to deliver the course, time taken to set-up and pack-up the course, level of the learner taught, frequency of offering and student fees.
Training – Was aimed at understanding the training level of staff delivering simulation-based education. It covered on-the-job, college fellowship, Level 1 and 2 TtT, Graduate certificate in Clinical Simulation, Graduate Certificate in Health Professional Education, Harvard University Simulation course and Masters in Simulation (respondents were also allowed to add their own).
Staffing – Asked questions about dedicated teaching and maintenance staff (full-time equivalent and head count) and those that contribute to the SLE but are not dedicated to it.
Budget – The worksheet listed a series of items in Cost and Income categories, with space to allocate dollar amounts. Other options were also presented in both costs and income. The cost categories provided included staff, equipment running and usage, consumables, learning aids, catering, maintenance and training. The income categories included internal and external users, sponsorship, grants, bequests, consultancy and off-site training.
About – provided a small amount of information about the project, the due date and submission email address for the file and where to get more information.

6
On 24 May 2010, key informants were emailed the activity survey. This email confirmed their earlier discussion with the consultants (as part of Stakeholder Identification) and agreement to participate. The email also included a letter from the DH (SLEI review Letter from DH.pdf), information about the project (SLEI Review Information Sheet.pdf) and indicated the closing date for responses was 7 June 2010. A similar email, including the survey, letter and information sheet, was also sent to the department’s clinical placement mailing list (all of the people on this list are referred to as stakeholders). The intent behind sending the documents to stakeholders was two-fold. Firstly, it was thought that if Stakeholder Identification missed an SLE, the clinical placement mailing list would include that organisation/person. Secondly, this mail-out was seen as an opportunity to inform the broader health workforce education sector about the project and how they might participate in future phases (in particular the Improvement Survey).
On 2 June 2010, a reminder email was sent to key informants noted as not submitting or contributing to a returned activity survey. Due to a low response rate, the deadline for responses was extended from 7 June 2010 to 21 June 2010. In addition to extending the deadline for responses, a new approach was suggested - call and conduct phone interviews with each of the organisations/locations yet to respond to the activity survey. Several key informants required more than one follow-up phone call. Due to the time required to make the phone calls and conduct interviews coupled with the low response rate, the deadline for response was finally set a 30 July 2010.
4.4.4 Improvement Survey Data on SLE improvement were collected using a web-based survey tool (Survey Monkey[22]). Based on results from the Desktop Audit, the responses received (to that point) on the activity survey and their own understanding of SLEs, the consultants created a list of potential questions for inclusion in the improvement survey. Using Survey Monkey, an electronic web-based survey was developed and DH staff were provided with a PDF version to review and were also encouraged to complete the on-line version of the survey. Following approval by the department, (see SLE Improvement Survey v02.pdf) the survey link was emailed (on 12 July 2010) to all people in the Key Informants list and the Stakeholder list (over 500 people in total). A reminder email was sent on 27 July 2010 and the survey closed on 1 August 2010.

7
5 Desktop Audit The Desktop Audit was undertaken to review the information provided by the DH on all SLEs funded between 2004 and 2006. Key elements such as location, proposed partners, funding, usage rates and demographics were explored. Four documents informed the basis of the audit:
self-reported health service-based clinical skills SLE usage data for 2005-06; a summary of funding for health service-based SLEs in 2004-05; a report on clinical skills inventory conducted in 2005; and 2004-06 Department of Health, Health Service Clinical Skills Labs report.
Data collected related to three broad categories; contact details, funding and usage.
5.1 Contact details Within the documents, the contact details of 30 clinical skills labs were reported.These contact details were used as the starting point for Stakeholder Identification. The consultants noted that given the age of the data (the most recent being 2006), it was likely some people may have changed their role or even organisation.
5.2 Funding Funding details were only reported for the period 2004-06. This information was broken down into funding provided in 2004-05 and 2005-06. According to the documents, 29 health services (15 metropolitan, 14 rural) were funded $1.57 million for clinical skills SLEs. Of that, approximately $712,000 was provided in 2004-05 (representing 45%) and $862,000 was provided in 2005-06 (55%). When broken down by region $746,000 (47%) was provided to rural locations and $828,000 (53%) to metropolitan locations (Table 1). Funding ranged from $39,452 to $59,461 with 23 institutions receiving $56,100.
Table 1: Department of Health funding allocated to SLEs in 2004-06 CPN Number of sites Funding received Proportion of total
Central 3 $ 168,300.00 11%
Eastern 2 $ 112,200.00 7%
Northern 4 $ 221,714.00 14%
Peninsula 1 $ 56,100.00 4%
Southern 3 $ 168,300.00 11%
Western 2 $ 101,405.00 6%
Metro sub-total 15 $ 828,019.00 53%
Barwon South-Western 3 $ 171,661.00 11%
Gippsland 3 $ 159,492.00 10%
Grampians 2 $ 112,200.00 7%
Hume 3 $ 151,910.00 10%
Loddon-Mallee 3 $ 151,742.00 10%
Rural sub-total 14 $ 747,005.00 47%
Total 29 $ 1,575,024.00
5.2.1 Equipment purchased In many cases, the funding received was used to purchase low to medium techd simulator trainers and mannequins. Of the mannequins (60 in total), 28 were paediatric, obstetric or neonatal mannequins (46%). They were either whole or part body mannequins such as Resus Annie, Sophie Full Birth Obstetric Trainer or Resus Annie Torso. Task specific mannequins such as Chester Chest
d Throughout the report tech or technology is use to refer to the complexity of simulation equipment. Fidelity
it is used to indicate complexity of learning/teaching scenarios.

8
Drain torso, or part-task trainers (PTT) such as intravenous (IV) arms were also purchased. Other purchases included clinical equipment such as defibrillators and trolleys, as well as consumables (such as dressing trays, ECG paper). No high-tech mannequins (e.g. SimMan), were purchased, probably because they would have cost more than $56,100 – the maximum amount allocated to any one site.
5.3 Usage Over the period 2004-06, 16 (of the 29 funded) health services responded to a request to self-report usage data. Of those, ten were rural and six metropolitan. Although the department provided a proforma, not all data were reported in the same way or to the same level of detail. In some cases within the summary tables, subtotals were greater than totals (e.g., hours of medical simulation training were greater than total hours of simulation-based training). When the source data were reviewed, further discrepancies were noted. As the desktop audit was intended to establish a starting point for the review, these issues were noted (to avoid similar mistakes), but were not further investigated or rectified. It was unclear how usage data related to the purchases of SLE equipment (i.e. if it was before, or after receipt of state government funding and therefore purchase of new equipment).
The 16 SLEs reported a total of 13,079 hours of use per annum. When broken down by profession, nurses (69.1%) had the highest use, followed by doctors (26.7%) and then allied health (2.6%) (Figure 1). Rural SLEs reported more hours (7,244, 55% of total) than metro SLEs (5,835, 45% of total) (Figure 2 page 9 and Table 2, page 9).
Figure 1: Self reported SLE usage by discipline (2004-06)

9
Figure 2: SLE usage by geographic location and discipline (2004-06)
Table 2: SLE usage (self reported hours in 2006) CPN Hours Proportion of total
Central none reported -
Eastern none reported -
Northern 1062.5 8%
Peninsula 3 0%
Southern 3360 26%
Western 1409.5 11%
Metro sub-total 5835 45%
Barwon South-Western 958 7%
Gippsland 926 7%
Grampians 272 2%
Hume 1526 12%
Loddon-Mallee 3562 27%
Rural sub-total 7244 55%
Total 13079
Clinical skills teaching (including but not limited to IV cannulation, in dwelling catheter (IDC), naso-gastric insertion) was taught to the most learners (2498 learners, 38.2% of total), followed by basic life support (BLS, 1893 learners, 30% of total) and advanced life support (ALS, 919, 14%). Occupational Health and Safety (e.g. manual handing and no-lift) was taught to 942 learners (14.4%). Many other teaching activities were also reported including paediatric and neonatal care (1.76%), obstetric care (1.1%), orientation (0.6%) and TtT (0.7%) (see Figure 3, page 10).
It is interesting to note that nearly half of the mannequins purchased as part of the SLE funding were paediatric, obstetric or neonatal mannequins, yet only 2.86% of learners undertook courses relating to paediatric, obstetric or neonatal care. This may be due to the timing of reporting versus funding or that paediatric, obstetric or neonatal mannequins are more versatile than other mannequins. For

10
example, they might perform just as well as standard mannequins in activities such as BLS, ALS and/or clinical skills teaching.
Figure 3: Training undertaken using SLEs (2004-06)

11
6 Identifying Stakeholders Using the data obtained in the Desktop Audit as a starting point, and with further input from department staff and consultant knowledge, the list of key informants was created. When initially contacted via phone, all key informants indicated their organisation had an SLE or significant simulation infrastructure. In total, 50 separate organisations (health services and education providers) were identified as having SLE infrastructure and thus included on the key informants list. This list covered 82 separate geographic locations across all CPNs. The list included 39 health service locations, 35 university locations, five TAFE locations and three Other RTO locations (Table 3). However, following distribution of the activity survey and subsequent follow-up phone calls, seven key informants indicated they did not have an SLE, simulation infrastructure or similar – including one organisation that received DH funding for simulation equipment!
Table 3: Location of key informants CPN Health service University TAFE Other RTO Total
Central 6 3 1 10
Eastern 4 2 4 1 11
Northern 7 4 1 12
Peninsula 1 2 3
Southern 3 3 6
Western 1 1 2
Metro sub-total 22 15 4 3 44
Barwon South Western 3 5 1 9
Gippsland 4 5 9
Grampians 1 2 3
Hume 5 5 10
Loddon-Mallee 4 3 7
Rural sub-total 17 20 1 0 38
Total 39 35 5 3 82

12
7 Activity Survey Findings The Activity Survey was designed to capture location and usage of SLEs and SLE equipment, staff numbers and training, types, numbers and duration of courses and sessions, disciplines and numbers of participants, budget details, hours of opening, equipment requirements and level of SLE tech.
In order to analyse the data, copies of each file were made and responses were broken up into their component worksheets – Organisation, Equipment, Education, Training, Staffing and Budget – creating a series of workbooks containing all responses to a particular section (e.g. all Organisation worksheets received). Original files were renamed to ensure a consistent nomenclature and facilitate ease of referral, but were otherwise unaltered.
As the Activity Survey allowed respondents to be very flexible in their responses (i.e. there were no restrictions on what could be entered into any cell and all cells could be modified), responses varied making analysis difficult. Thus, prior to analysis, responses were cleaned (e.g. all yes or other similar responses converted to y) and coded (e.g. text responses categorised into common/recurring themes) to facilitate analysis.
7.1 Response rate As noted in the Methodology Section 4.4.3 Activity Survey, potential participants needed several reminders to complete the survey. Although the reasons for this difficulty were not explored, several respondents apologised for the delay and cited limited staffing as the major factor. Indicating that they had no-dedicated staff for their facility, or not enough dedicated staff.
In total, 51 activity surveys were returned. These responses covered 56 of the 82 key informants (68%). A further seven (9%) self-determined they did not have an SLE or appropriate infrastructure after they viewed the survey and 19 (23%) key informants did not respond at all (in some cases they remained un-contactable throughout the entire project). Of those who provided a response, not all worksheets were necessarily completed. Table 4 summarises the participation by key informants, summarised by CPN.
Table 4: Participation by key informants in an Activity Survey (summarise by CPN) Response received Percentage CPN No No Lab Yes Total No No Lab Yes
Central 4 2 4 10 40% 20% 40% Eastern 3 2 6 11 27% 18% 55%
Northern 4 8 12 33% 0% 67%
Peninsula 3 3 0% 0% 100%
Southern 1 5 6 17% 0% 83%
Western 2 2 0% 0% 100%
Metro sub-total 12 4 28 44 27% 9% 64%
Barwon South Western 2 1 6 9 22% 11% 67%
Gippsland 3 1 5 9 33% 11% 56%
Grampians 3 3 0% 0% 100%
Hume 1 1 8 10 10% 10% 80%
Loddon-Mallee 1 6 7 14% 0% 86%
Rural sub-total 7 3 28 38 18% 8% 74%
Total 19 7 56 82 23% 9% 68%
Of the 51 Activity Surveys returned, not all were from the key informants list; nine were identified as stakeholders. Of those nine, four indicated they had a dedicated simulation-based teaching space and seven provided responses in the Equipment worksheet of the survey. Activity Surveys were

13
received from organisations in each of the CPNs (Table 5). It is interesting to note that a higher proportion of responses were received from rurally based SLEs than metropolitan based SLEs. This is in contrast to the breakdown of key informants (Table 3, page 11).
Table 5: All responses received (summarised by CPN) CPN Responses received Proportion of total
Central 3 5%
Eastern 5 9%
Northern 4 7%
Peninsula 2 4%
Southern 8 14%
Western 4 7%
Metro sub-total 26 46%
Barwon South Western 6 11%
Gippsland 6 11%
Grampians 2 4%
Hume 5 9%
Loddon-Mallee 12 21% Rural sub-total 31 54%
Total 57e 100%
7.2 Organisation All responses received included information within the Organisation worksheet. The aim of the Organisation worksheet was to provide a summary of the SLE’s operations, including access, staffing, size and age.
A total of 54 responses were provided to the question Is there a dedicated simulation-based teaching space? Respondents were asked to indicate what type of SLE they had – Skills Centre, Simulation Lab, In-situ Lab, Other (please describe). No definition of SLE type was provided (it was presumed the audience would understand the differences) and responses were received in each category. Where respondents provided descriptions of their lab under other, the descriptions were reviewed and (in some cases) the responses were re-categorised as it was clear they fit into a defined category (e.g. the description read, “Our skills centre …”). Simulation Lab was the most popular; 25 respondents indicated they had one, representing 46% of responses received to this question. The next most reported SLE was a Skills Centre (15, 28%), then In-situ Lab (8, 15%) and finally Other (6, 11%). Thirteen respondents indicated they had more than one SLE type.
Operating hours varied from “on an as needs basis” to “24 hours per week”. Of those who responded (47), most indicated their simulation facility is open Monday to Friday from 8am to 6pm.
e As noted, 51 responses were received, however some respondents indicated their responses covered
multiple geographic locations. For the purposes of Table 5, all locations were recorded.

14
Table 6: Opening hours of SLEs (summarised by proportion of respondents and SLE type) Type of SLE Open 9
hours per day
Open > 9 hours per day
Open < 9 hours per day
Also open when required
Only open when required
Simulation Lab 63.60% 31.80% 4.50% 27.27% -
Clinical Skills Lab
53.80% 46.10% 30.76% 15.38% -
In-situ simulation lab
33.30% 22.90% 11.11% - 33.33%
Other 100% - - - -
As expected, the majority of respondents indicated they were the lead organisation for the simulation space. Not all respondents indicated they had partner organisations, although many did (29). It is not clear from the data what the partnership arrangement is –financial, co-location, contractual, philosophical, educational or some other arrangement. The consultant’s experience is that these relationships are predominantly user pays sharing of space and equipment as opposed to a formal partnership.
Facility size and number of rooms varied considerably. Facility size was poorly reported, with only 28 respondents providing data (compared to 41 for number of rooms). Simulation Labs tended to have more rooms (average of five from those who responded), and were larger (average of 175.8 square metres for those who responded). The highest number of rooms reported was 13 (for a Skills Centre). The largest space reported was 660 square metres (for a Simulation Lab); the lowest was six square metres (also for a Simulation Lab). The consultants note that six square metres is a relatively small space and probably represents the size of a standard hospital treatment bay, and does not include storage space. On average, In-situ Labs tended to be smaller than other lab types, probably reflecting the fact they are located on/within wards and Level 3 SLEs tended to be larger than the other levels (probably reflecting the size of the high-tech equipment) (Table 7).
Table 7: SLE average size (in square metres) summarised by tech and type Simulation lab Skills Centre In-situ Lab Other Total
Level 1 SLE - 116.5 - - 116.5
Level 2 SLE 138.0 39.2 27.5 66.0 90.7
Level 3 SLE 234.3 134.0 9.0 9.0 166.0
Total 175.8 94.1 21.3 47.0 125.7
Forty-three positive responses were received to the question Is there a booking process for its [SLE] use? Presuming all 43 responses have a dedicated simulation-based teaching space, 80% have booking processes. The existence of a booking process varied depending on the type of simulation facility; with Simulation Lab being the highest (96%), followed by Skills Centre (67%), Other (67%) and In-situ Lab (63%). The most common method for initiating a booking was a telephone call (10 out of the 28 descriptions received), then email (eight of the 28 descriptions received). Bookings were commonly recorded into an electronic system/diary (22 of the 27 descriptions received), although the complexity of the diary varied from an MS Outlook calendar to dedicated facility booking systems. Bookings were commonly recorded by simulation staff members (27 of the 35 descriptions received).
Staffing varied greatly. Many locations indicated they have no dedicated staff (15 of 42 responses received), and the highest reported number of staff was 13 (for a Simulation Lab). For all locations that reported a number of staff (including those who reported zero staff), the average number of staff per location was 1.3. The average number of staff varied depending on the type of location with

15
Simulation Lab being the highest (3), followed by Skills Centre (1.1), then Other (0.9) and In-situ Lab (0.3).
Simulation facilities varied in age. Of those who responded, the oldest simulation facility was established in 1985 (a Simulation Lab), (although the consultants note that the first high-tech SLE opened in 1997) the most recently established facility was established earlier in 2010, and one respondent even indicated their facility will not be established until 2011! On average facilities were 3.9 years old; with Simulation Labs having the oldest average age (4.3 years); followed by Other (4.2 years), then Skills Centre (3 years) and In-situ Lab (2.6 years).
Forty-seven of the responses received provided a list of contributors. The greatest number provided was 23 and the lowest was one. Most commonly (24 times) only one person was listed as a contributor.
7.3 Equipment The major part of the SLE Activity Review, and therefore the review of clinical skills SLE Infrastructure, was the Equipment worksheet. In summary, it was intended to:
Collate a statewide inventory of SLE equipment; Identify frequently used equipment and nominate used-by timeframes with a view to informing
potential replacement requirements; Establish the type of training required to utilise SLE equipment in teaching programmes; Assess availability of equipment for use; Estimate time required to set-up and pack-up equipment; Assess what type of equipment is required to deliver a variety of SLE-based sessions/courses.
Of the 51 responses received, seven did not contain data in the equipment worksheet, thus only 44 responses were received relating to equipment. This represents a completion rate of 86% for this part of the survey. Although the data presented in this section provides a picture of SLE equipment within Victoria, it is not the entire picture. As noted earlier, several sites with SLEs did not participate in this survey (Table 4, page 12), and there may be others the consultants are not aware of. Furthermore, some SLE equipment may be housed in areas away from the SLE (unbeknown to the respondent) and therefore may not be accounted for in responses.
As part of the data-cleaning and -coding process, all pieces of equipment were given a tech rating of 1 (low – PTT, e.g. IV cannulation arm), 2 (medium - full body mannequin, not including SimMan, METTI or similar), or 3 (high – full body simulation mannequin, e.g. SimMan). Each response was then given a tech rating, equivalent to the highest rated piece of simulation equipment reported in the particular response. A rating of 0 indicates no equipment was reported. As Table 8 shows, eight of the eleven CPNs have an SLE rated at Level 3 and three regions have three SLEs with a rating of Level 3.

16
Table 8: Tech rating of responses received (summarised by CPN) CPN Equipment not provided Level 1 SLE Level 2 SLE Level 3 SLE Total
Central 2 1 3
Eastern 1 3 4
Northern 1 2 1 4
Peninsula 1 1 2
Southern 1 3 3 7
Western 1 3 4
Metro sub-total 2 3 10 9 24
Barwon South Western 1 3 2 6
Gippsland 2 4 6
Grampians 2 2
Hume 1 2 3
Loddon Mallee 1 6 3 10
Rural sub-total 5 0 15 7 27
Total 7 3 25 16 51
Of the 59 pieces of equipment listed (or added to the list), the most popular (i.e. most responding organisations have one) was the IV cannulation arm (42 respondents noted at least one, 95% of responses received). IV cannulation arms are actually used to teach three separate but similar skills – IV cannulation, venepuncture and blood culture collection. The second most popular piece of simulation equipment was the Adult Airway trainer (34, 77%) and then Resus Annie (31, 70%). This correlates well with the data on purchases made with DH funding in 2004-2006, where the majority of SLE equipment purchased was low to medium tech simulation equipment (see Section 5.2.1 Equipment purchased, page 7). Conversely, only two organisations noted they had a Laparoscope trainer, Joint injection trainer or Simbaby; only one organisation noted they had a Paed arterial trainer or Harvey and no organisations indicated they had an Ultrasound trainer or a METTI baby.
The most common piece of equipment (i.e. the most units across the state) was the injection trainer (275 units reported across all surveys received). IV cannulation arms were second most common (192), followed by BLS/ALS chest torso (136). The ultrasound trainer (0) and METTI baby (0) were least common, followed by Harvey (1) and the Paed arterial trainer (2).
Obstetric training devices were well represented with 35 birthing mannequins, 11 episiotomy trainers and 83 other obstetric PTTs. There were 55 neonatal/paediatric PTTs including airway management models, IV arms and hip exam models. In the area of women’s health, there were 49 breast lump trainers and 25 uterus models, with men’s health represented by 16 prostate trainers. This listing correlates well with the purchasing data reviewed in the Desktop Audit (see Section 5.2.1 Equipment purchased, page 7).
Apart from paediatrics and obstetrics there are 973 PTTs used for generic skills training across more than one discipline e.g. IV cannulation. More specific skills training within disciplines e.g. surgical skills trainers accounted for a further 369 items. A further 338 mannequins or torsos were available for BLS and ALS training. Mannequins other than resuscitation mannequins e.g. nursing skills or trauma mannequins, totalled 91. There are also 44 high-tech adult and paediatric mannequins – 18 at the one institution! This data correlates well with the data provided in the Education worksheet (Section 7.4 Education, page 19).
Having listed how many items they had, respondents were then asked to note if training was required to use the piece of equipment. Only 13 organisations suggested training was required to use the IV cannulation arm (the highest of any piece of equipment). The next highest was Other BLS/ASL adult mannequin (12) and the Paed/neonate BLS/ALS mannequin and Resus Annie (both with 11). These results probably represent the number of organisations with these pieces of

17
equipment, rather than the requirement for training. When viewed by tech, the data present a different (and more expected) story, indicating high-tech equipment (those pieces ranked as 3), is more often noted as requiring training than low tech equipment. Furthermore, the training was more often reported as being formal (Table 9).
Table 9: How training in use of the equipment was reported (by equipment tech) Formality of training
Equipment tech
Instances a piece of equipment at the particular tech was reported
Number of respondents noting training is required
Proportion of respondents noting training is required
Not indicated
Informal training (e.g. learning from the manual, other staff or by having a go)
Formal training (e.g. course or specialist trainer)
1 524 134 26% 25 19% 97 72% 11 8%
2 136 62 46% 19 31% 28 45% 15 24%
3 24 16 67% 6 38% 0 0% 10 63%
All equipment was available for use for 42 or more weeks of 2009. However, actual use varied from as much as 49 weeks, to as little as two weeks and only 13 pieces of equipment were used for more than 21 weeks of 2009. The best-used piece of equipment was METTI; that was used for 49 weeks of the 49 it was available – although only three organisations reported having a METTI. The next best was other BLS/ALS adult mannequin (used for 31 weeks of 50, 19 unused weeks) and then SimMan (31 of 51, 20 unused weeks) and other birthing mannequin (24 of 44, 20 unused weeks).
Respondents were asked if their simulation equipment needed consumables; 100% of respondents with Intercostal drainage trainers, Cric stick trainers, Infant IV arms, METTIs, Sim Newbies, SimMan 3G, Simbabies, Joint injection trainers, Other surgical trainers, or Paed arterial trainers indicated the equipment needs consumables for use. Of the more common/popular pieces of equipment 95% percent of respondents said the IV cannulation arm required consumables for use, compared to 85% for the Adult airway trainer and 71% for Resus Annie.
One hundred percent of respondents with Infant IV arms, Noelle birthing mannequins, METTIs, Sim Newbies, SimMan 3G, Simbabies, Paed arterial trainers or Harveys indicated the equipment requires specialist training for use. Of the more common/popular pieces of equipment 74% of organisations with IV cannulation arms suggested specialist training was required, compared with 71% for Adult airway trainer and 61% for Resus Annie.
Respondents indicated that METTI required the longest setup time (3.7 hours; average calculated from three responses). This extended time is probably due to its sophisticated pharmacological and physiological modelling. SimMan reportedly took the second longest to set up (2.1 hours; average calculated from eleven responses). In the consultants’ experience, a lot of time can be spent connecting and removing the cables for SimMan when its location is changed. Most cables are housed in sub-floor conduits making setup onerous and time consuming. Secondly, much of SimMan’s associated paraphernalia is now housed within SimMan 3G, thus setup (and pack-up times) times may reduce as SimMan is replaced by SimMan 3G (from 2.1 hours to 0.6 hours – the average reported for SimMan 3G).
Despite the lengthy setup time for SimMan and METTI, most other equipment required less than an hour for set-up. METTI was the most time consuming to pack-up (4.2 hours), followed by SimMan (1.6 hours) and Injection trainer (1.2 hours), the remaining equipment all required less than an hour to pack-up. According to respondents, the IV cannulation arm takes 0.7 hours to set-up and 0.7 hours to pack-up (average calculated from 38 responses). Both the Adult airway trainer and Resus

18
Annie take 0.6 hours to set-up and 0.6 hours pack-up (average calculated from 30 and 27 responses respectively).
The consultants note that this question was intended to ascertain the amount of time setting-up and packing-up each piece of equipment – on their own not in association with a specific education session. However, what was intended might not have been achieved, as some responses may include setting-up and packing-up of all the associated paraphernalia required for an education session. For example, it is our experience that an Injection Trainer is a simple foam square, and as indicated by several respondents, does not take any time to set-up.
When compared to booking the SLE facility, booking individual pieces of equipment was less organised. For all pieces of equipment besides Sim Newby, SimMan 3G and Harvey, ad hoc request (as a description of booking processes) was more frequently noted than formal on-line booking system, or formal paper-based booking system.
Respondents were asked to note what courses/training scenarios (from a list of over 80 or add their own) simulation equipment was used in. SimMan was listed as used in the majority of courses (60 out of a total of 86), followed by Adult Airway trainer (52) and SimMan 3G (51). The IV cannulation arm was listed as used in 47 courses. Data were collated to give the total number of times a piece of equipment was listed as used in a particular course/training scenario. These numbers were then ranked to find the piece of equipment most commonly listed for each course/training scenario. The Adult Airway trainer was the most listed piece of equipment for 23 courses, the next highest was SimMan (13) and IV cannulation arm and Resus Annie (both on 12).
Respondents were not asked to rate the fidelity of the education using high-tech mannequins. For example, it could be that SimMan or METTI is used for IV cannulation training (as it has that type of arm) rather than for fully immersive simulated scenarios – its primary design purpose. So whether the equipment is used to its full capability is not identified from this survey.
On average, those who provided data in the Equipment worksheet had 13 different pieces of SLE equipment and 42 pieces of SLE equipment in total. Furthermore, Level 3 SLEs have (on average) more different pieces of equipment (Table 10) and more pieces of equipment in total (Table 11).

19
Table 10: Total number of different pieces of simulation equipment (averages shown, summarised by CPN and SLE tech)
CPN Level 1 SLE Level 2 SLE Level 3 SLE All respondents
Central 9 10 9
Eastern 14 26 22
Northern 14 18 12
Peninsula 15 17 16
Southern 4 9 15 11
Western 14 11
Metro sub-total 7 13 17 13
Barwon South Western 18 26 18
Gippsland 19 13
Grampians 16 28 19
Hume 11 7
Loddon Mallee 13 17 12
Rural sub-total 16 19 14
All respondents 7 15 18 13
Table 11: Total number of pieces of simulation equipment (averages shown, summarised by CPN and SLE tech)
CPN Level 1 SLE Level 2 SLE Level 3 SLE All respondents
Central 43 22 36
Eastern 22 64 50
Northern 127 44 68
Peninsula 72 26 49
Southern 5 43 61 45
Western 54 40
Metro sub-total 30 64 49 49
Barwon South Western 26 173 71
Gippsland 59 39
Grampians 32 79 44
Hume 15 10
Loddon Mallee 18 20 16
Rural sub-total 33 71 37
All respondents 30 45 59 42
7.4 Education The Education worksheet focused on the delivery of health care practitioner training using simulation equipment. For each course/session listed by respondents, the worksheet was intended to cover items such as participants taught, number of educators required, the discipline(s) of educators and learners, setup and pack-up times, frequency of offering and price (if applicable). Unfortunately, the instructions were not as clear as they could have been, and respondents interpreted the fields in many ways, resulting in a wide range of data being reported.
Six of the Activity Survey responses received did not include information in the Education worksheet. The remaining 45 responses (representing a response rate of 88% for this part of the survey) included varying levels of detail from an explanatory note about the education offered, to a detailed listing of all educational activities taking place within the organisation.
Following significant coding (ensuring similar courses were grouped) and cleaning (ensuring identical courses were referred to in exactly the same way) of the data, a total of 196 different courses and sessions were reported as being delivered across all Victorian SLEs. However, not all sites indicated

20
they used simulation equipment when delivering the listed course. For 54 separate courses, there was a least one site that delivered the course, but did not indicate simulation was used.
As could be expected, the majority of teaching was centred on psychomotor skills (78 sessions identified), resuscitation skills (26 different sessions identified) and team training simulations (21 sessions identified). Across all responses, there were 23 highly specific workshops (e.g. surgical training at Royal Australasian College of Surgeons) representing 11% of activities, six obstetric based sessions/courses (3%), 19 paediatric & neonatal sessions/courses (9.69%), three sessions specifically designed for rural training (1.5%), and five courses devoted to orientation/return to practice/professional development (2.5%). According to the responses received, 282 international medical graduates (IMGs) received specific training.
Despite the extensive data coding and cleaning, some information was still difficult to interpret. For example, some respondents listed all units within a course (e.g. Bachelor of Nursing) without noting what was specifically taught in an SLE with regards to that unit. Secondly, there may be some crossover of data due to poorly identified sessions e.g. Skills Training Session as opposed to IV cannulation session (e.g. 2585 learners partook in clinical skills sessions). Thirdly, compulsory training, such as basic and advanced life support was not reportedly delivered at all health service sites. This may mean some sites neglected to list it, that they did not report it because they do not use simulation to deliver it or they felt it was not necessary to list. Some organisations also outsource the provision of BLS and ALS training to other organisations and/ or incorporate it into other courses e.g. Anaesthesia Crisis Resource Management or intern training. Due to these factors, it is likely that many skills and courses have been under reported.
A further example of the difficulties faced, relates to the number of learners taught. Within the Education worksheet the number of learners taught in 2009 can be calculated from one of three fields– summing values in the disciplines taught responses, summing values in the levels taught responses and using the value in the how many people undertook the course in 2009?. Out of the 196 different courses and sessions listed, only 68 had total values for each field that were the same. Of those, 17 had zero attendees reported. For the purposes of this analysis, the highest number of the three was taken as correct.
Following the coding and cleaning, the educational sessions could be categorised into five broad themes:
1. Psychomotor skills taught on PTTs (equipment noted as Level 1 tech in this report). 2. Resuscitation skills taught mainly on low-tech mannequins (equipment noted as Level 2 tech in
this report). 3. Workshops utilising PTTs and low-tech mannequins. 4. Team training simulations utilising high-tech mannequins (equipment noted as Level 3 tech in
this report) – these sessions are mainly based on operating theatre and emergency department scenarios.
5. TtT activities – in BLS, ALS and simulation
Psychomotor skills taught on part-task trainers The largest number of sessions listed in the Education worksheet fall into this category, probably representing the vast majority of education sessions using simulation. The skills taught can be separated into those that are generic (required by all medical, nursing and midwifery staff) and those that are more specialised. Of the generic skills, IV cannulation was reported by 14 respondents and delivered to 807 learners (from undergraduate nursing (including division 2) and medicine through to post graduate professional development). The next most common session was venepuncture; reported by nine respondents and delivered to 780 learners. Thirteen respondents

21
reported in dwelling catheter training (700 learners) and airway management (389 learners). These data correlate well with the equipment data reported in Section 7.3 (starting on page 15).
Fewer specialised skills course were reported (as anticipated). The major courses listed were minor surgery skills taught to 96 general practitioners and laparoscopic suturing taught to 60 surgical trainees.
Resuscitation skills taught mainly on low tech mannequins Not surprisingly, adult, paediatric and neonatal resuscitation sessions were delivered to 769 learners throughout 2009. Adult BLS programmes were delivered to 4174 participants including nursing, medical and allied health personnel and 1,967 learners were taught Adult ALS programmes. 2064 participants attended other BLS/ALS sessions (combined). Paediatric resuscitation programmes were delivered to 309 nursing and medical personnel whilst only 41 attended neonatal resuscitation training. A total of 11,088 personnel attended resuscitation programmes of some kind. As noted earlier, sessions may have been embedded within other courses and have therefore gone unidentified/recorded.
Workshops utilising part-task trainers and low tech mannequins In our experience, many SLE workshops use a scaffolded learning approach with the psychomotor skill component being taught on a PTT and then embedded into a low fidelity simulationf to contextualise the skill. Generic situations captured in this style include sessions such as Epidural/ patient controlled analgesia (PCA) workshops which were attended by 104 nursing personnel and infusion pump workshops (attended by 203 personnel). Other more specialised workshops included obstetric emergency scenarios ; attended by 561 medical, nursing and midwifery personnel. Many other sessions were more vaguely defined such as Oxygen Therapy (585 participants), ECG (330 participants) and it is, therefore, difficult to categorise these activities.
Team training simulations utilising high tech mannequins Interprofessional, team-training, fully immersive simulations were delivered at eight sites on 81 occasions; in total 450 medical and 460 nursing staff attended. It is interesting to note the even distribution between doctors and nurses participating in these courses. It is our experience that most interprofessional courses are heavily weighted one way or the other depending on the subject focus. This appears to even out when the focus is “team training” rather than a specific clinical objective. Many of the courses are formally recognised by training colleges, in particular ANZCA and ACEM, (ACRM, ECRM) and are a mandatory component of vocational training (EMAC, ACME). Licences for these courses are issued to SLEs meeting college accreditation. One stipulation of this accreditation is that the high tech mannequin is a METTI and not a SImMan due to respiratory physiology capabilities. Other courses are focused on regional and rural training (RACRM, RECRM) and earn CPD points from colleges such as RACGP and ACRRM.
Two further sites reported delivering 18 mock code sessions using a SimMan, in a real clinical environment to 23 medical and 260 nursing personnel. In this type of training, the cardiac arrest is paged in the normal way within the hospital and participants are unaware until they arrive on the scene that the case is not a real person.
Simulation-based scenarios and team-training sessions were mainly confined to three high tech simulation centres with five other sites delivering a total of 34 simulation sessions (average 7.2 sessions per year). Interestingly, six other sites indicated they possess a SimMan or METTI high tech mannequin on the Equipment worksheet, yet no sessions are reported to have been delivered using it (on the Education worksheet).
f Note a distinction is being made between low fidelity simulation, and low tech simulation equipment.

22
Train-the-trainer activities – in BLS, ALS and simulation Ninety participants undertook Simulation TtT Basic courses at two sites. There was no indication of any ongoing or advanced simulation TtT courses although it is noted that some SLEs do have long-term fellowship positions that include this type of training.
Adult BLS TtT and BLS updates were undertaken by 106 participants . Six participants undertook Paediatric TtT programmes. There were not any ALS TtT sessions, nor any neonatal resuscitation TtT sessions. It is worth mentioning that accredited trainers are often outsourced to provide specialist ALS sessions e.g. APLS, PALS courses.
7.5 Training The Training Worksheet centred on identifying the disciplines and qualifications of SLE staff. Nine of the responses received did not include information in the Training worksheet. This represents a response rate of 82% for this part of the survey.
The disciplines of 428 staff members were provided. Not surprisingly, 359 of these had a nursing background, 50 had a medical background and 11 had a midwifery background. Most medical staff had either an anaesthesia or emergency medicine fellowship. Only three sites noted having administrative staff. Of note, 15 staff from four sites described themselves as Simulationists. The emerging roles of Simulationist, Simulation Coordinator and Simulation Technician within the healthcare industry are yet to be clearly defined or officially certified. The terms are creeping into the simulation arena and the Australian Society for Simulation in Healthcare (ASSH) and the Society for Simulation in Healthcare (SSiH – an international body) are currently exploring issues around training, qualifications, assessment, certification, accreditation, Professional Development, pay structures, career paths and registration of simulation professionals. In the meantime, SLE staff who consider themselves to be experienced (even leaders) in the field, and who have completed available training, are using the title Simulationist.
Training information was provided by 38 of the respondents. Assuming each entry in the Discipline of staff member column represents an individual, on average there are 11 staff members per SLE who operate the simulation equipment (as technicians or educators). In realty, however, the value is likely to be much higher as many respondents indicated many more staff operate the equipment than they were able to note in their response. These operators tended to be referred to as ad hoc users or engaged on an as-needs basis.
Of responses received, 283 listings had completed at least one form of training. Of those, 243 were noted has having on-the-job training (representing 57% of entries in the Discipline of Staff member column), but only 141 (32%) have another form of training. Seventy-four have completed a Level 1 Train-the-Trainer course (17%), 41 have completed a Level 2 Train-the-Trainer (10%) course and 30 have completed the Harvard Simulation course (7%). Twenty-six have completed a College accredited fellowship which is usually of six months duration and includes in-house train-the-trainer sessions and a structured apprenticeship model of development. In addition, 24 people have completed either a Graduate Certificate in Health Professional Education, which includes basic simulation concepts, or are undertaking the Graduate Certificate in Clinical Simulation (which commenced in 2010). Both of these are 12-month courses that articulate into a Masters degree in either Health Professional Education or Clinical Simulation. In our experience, people completing a fellowship usually return to their base institution to head up their embryonic simulation programmes.
In theory, the TtT data could be verified and attempts were made to collect the information from the relevant training providers. However, the necessary information to perform the checks (attendee name, date, organisation) has not been collected and/or kept. Of note, the training provider data do

23
suggest at least 180 people have undertaken the Level 1 TtT course and at least 97 have undertaken the Level 2 TtT course (totals for 2007 and 2008). The discrepancy in numbers could represent people completing the Activity Survey were not aware of the qualifications of the listed staff, that not all staff who have undertaken the course are still working within SLEs, or that organisations that did not respond to the Activity Survey have staff who have undertaken the courses.
7.6 Staffing The Staffing worksheet focused on identifying the number of staff dedicated to an SLE, the number of other staff who contribute to SLE activities and their discipline or background. Ten of the responses received did not include information in the Staffing worksheet, suggesting a response rate of 80% for this section of the survey. Unsurprisingly, nurses make up 85.75% of the SLE workforce, with medicine in second position with 12%. Only two people with a non-clinical background (one in science and one in education) are working in SLEs. This is in contrast to our understanding of SLEs within the USA, where many staff, particularly those with technical roles, come from engineering, computing, biomedicine and technical backgrounds.
Eighteen of the respondents suggested they have staff dedicated to the use of simulation equipment, with an average of 0.60 FTE (representing 24 hours or three days per week) per location (covering casual, part-time, full-time and other employees). Twenty-seven respondents suggested other staff contribute to the use of simulation equipment, with an average of 3.15 FTE per location (covering casual, part-time, full-time and other employees). This indicates that SLEs are being primarily operated by staff that have other roles within (or even outside) the organisation. The reasons for this were not explored in the Activity Survey.
Sixteen respondents indicated they have staff dedicated to the maintenance of simulation equipment (12 suggested other staff also contribute). In contrast to teaching, on average there are more dedicated maintenance staff (0.36 FTE) than other contributors (0.16 FTE). Although 16 sites have staff dedicated to SLE maintenance, this probably represents staff with SLE maintenance in their list of responsibilities as the average time (FTE) allocated amounts to just under two days per week.
It is interesting to note that although the staffing worksheet indicated an average of 4.27 FTE per SLE (covering dedicated and non-dedicated staff members) the training worksheet revealed an average of 11 staff members per SLE (Section 7.5 Training, starting on page 22).
7.7 Budget Sixteen of the responses received did not include information in the Budget worksheet, suggesting a response rate of 68% for this section of the survey.
Of the 35 who responded, only 26 provided a dollar value to indicate their facility has some kind of budget allocated to it. This budget could be in the form of a $3,000 donation (and that was all that was noted), list of student income (for the entire organisation) or a breakdown of expenses and income for the facility. Those who responded, but did not provide a budget, often indicated there was “no dedicated budget”, that it was too difficult to calculate or that the simulation facility did not have a “cost centre”.
Of the 26 respondents that provided dollar values, only five make a profit, the rest (21) make a loss. Of the 21 who make a loss, 15 do not charge a fee or have a cost centre transfer for internal training provided. Of the seven SLEs that have income from external users, four of those are university nursing schools where the entire student fee allocation may have been attributed to simulation. Only 11 SLEs earn income from external users averaging an income of $95,172.00.

24
The largest single loss was $750,000 which was at the most active SLE in terms of interprofessional, high fidelity simulation teaching. The largest single profit was $3.7 million.
Of the five who make a profit, three rely on grants or sponsorship in order to do so; one does not have any staff costs attributed to it, and only one is a Level 3 SLE. The nine sites making the largest losses are all Level 3 SLEs. It is unclear why the largest losses are made at Level 3 SLEs. It may be that recent expenditure on high tech mannequins may have been listed as a 2009-2010 cost rather than depreciated over the life (perhaps seven years) of the mannequin (only two respondents noted equipment depreciation in their costs). It may also be that these sites are expected to log and maintain their own budget – and thus were more able to accurately and completely respond to this section of the survey.
Staff Costs were the single biggest expense, costing an average of $170,000 (representing nearly 60% of expenses, Table 12) for those who provided a cost (21 respondents provided data). As noted in Section 7.6 Staffing (starting on page 23) a large number of staff provide teaching within SLEs that are not dedicated to that role. Indeed on average more teaching is undertaken by non-dedicated (3.15 FTE) than dedicated staff (0.60 FTE). Although the details of this discrepancy between funding for staff and number of staff was not explored, our experience suggests other staff are often unaccounted for in terms of the wages component of the budget and there is much reliance on goodwill and quid pro quo teaching as well as cost centre transfers interdepartmentally. For example, an Anaesthetic Department might provide an Anaesthetic Fellow for one day per week to teach in the SLE and in return, the Anaesthetic Department receives a proportionate number of hours of SLE education. Another example is a fellow on sabbatical from an external institution who is paid for by the home institution in return for an apprenticeship style training in simulation. This may mean that actual staff costs for SLEs are even higher than reported.
The next greatest expense (after Staff) was Other costs ($119,000 average per respondent; four respondents provided data) followed by Staff Training ($44,000 average per respondent; ten respondents provided data).
Table 12: SLE expenses summary Item Proportion of total
Staff costs 59.8%
Teaching/Learning aids 8.7%
Other 7.8%
Staff Training 7.2%
Equipment 6.3%
Consumables 5.1%
Facility maintenance 3.7%
Catering 1.0%

25
The single biggest income was internal users, raising an average of $1.18 million (85.2%) for those who provided a cost (seven respondents provided data) (Table 13). However, in several instances total income from students (for the entire health service) was listed as the income value. The second largest income source was external users, raising an average of $95,000 for those who provided data (11 respondents provided data).
Table 13: SLE Income summary Item Proportion of total
Internal users 85.2%
External users 10.8%
Grants 2.1%
Sponsorship 1.3%
Consulting fees 0.2%
Off-site training 0.2%
Other 0.0%
Bequests 0.001%

26
8 Improvement Survey Findings The web-address for the SLE Infrastructure Review Improvement Survey was sent to a mailing list with 501 email addresses (the web-address for the survey was not on a website, it was only provided in an email). The survey was broken up into four sections – demographic information, questions for those organisations with SLEs, questions for those organisations without SLEs and questions relating to simulated learning environments across Victoria. Skip logic (using the responses to one question to determine the next section for completion) was used to guide respondents between and within sections.
In total, 143 responses were received, suggesting a response rate of almost 30% (presuming only those receiving the email responded). Of those, 16 responses were removed from the data set because they were very incomplete. All responses removed lacked answers to some compulsory questions (suggesting these respondents did not make it to the end of the survey) and had one or fewer responses to optional questions. As well as being incomplete, some of the removed responses had incorrect information within the demographic section (e.g. “ww” as the respondent name, organisation name and organisation address) and others were the second response from the same person at the same organisation. Thus, 127 valid responses were received (suggesting a response rate of 25%). Of those, 80 (63%) indicated their organisation has simulated learning environment infrastructure, whereas 47 (37%) did not.
Responses were received from people representing 57 different organisations across 76 locations, covering all eleven CPNs. All CPNs included responses from two or more organisations and covered two or more geographic locations. It should be noted that each response does not represent one organisation, but an individual. Thus, several responses from one CPN may indicate one or more locations. Although the data could have been presented at an organisation (and location) level, this may allow identification of individual respondents and thus was not considered appropriate.
Table 14: CPN, organisation and location summary of improvement survey responses CPN Number of different organisations Number of different locations
Central 9 9
Eastern 3 5
Northern 9 11
Peninsula 2 2
Southern 6 7
Western 6 8
Metro sub-total 35 42
Barwon South-Western 7 8
Gippsland 6 7
Grampians 6 6
Hume 6 6
Loddon-Mallee 7 7
Rural sub-total 32 34
Total 67 76
The most responses received from one organisation was 10. Eighty-nine responses were received from health service representatives (70% of responses, all CPNs covered) and 28 responses were received from university representatives (22%, ten CPNs covered). The remaining responses were from Other RTOs (5.5%, 7 CPNs), TAFEs (1.5%, 2 CPNs) and other (1%, 1 CPN) (Table 15).

27
Table 15: Improvement survey responses summarised by CPN and organisation type Organisation type
CPN Health Service University TAFE Other RTO Other Total
Central 8 6 1 1 16
Eastern 3 2 1 6
Northern 20 3 1 24
Peninsula 4 2 6
Southern 8 3 2 13
Western 7 1 8
Metro sub-total 50 15 2 5 1 73
Barwon South-Western 7 5 2 14
Gippsland 9 1 10
Grampians 8 3 11
Hume 7 1 8
Loddon-Mallee 8 3 11
Rural sub-total 39 13 0 2 0 54
Total 89 28 2 7 1 127
Of the 127 responses received to the improvement survey, 80 (63%) indicated their organisation had simulated learning environment infrastructure (summarised by CPN in Table 16). The remaining 48 respondents (38%) indicated they did not (summarised by CPN in Table 17). Only one CPN (Peninsula) only had “yes” responses, the rest received both.
Table 16: Respondents who indicated their organisation had SLE infrastructure CPN Health Service University TAFE Other RTO Other Total Yes Total responses
Central 3 3 1 7 16
Eastern 3 2 5 6
Northern 10 2 12 24
Peninsula 4 2 6 6
Southern 4 1 2 7 12
Western 4 1 5 9
Metro sub-total 28 9 2 3 0 42 73
Barwon South-Western 6 5 11 14
Gippsland 5 1 6 10
Grampians 6 3 9 11
Hume 4 1 5 8
Loddon-Mallee 4 3 7 11
Rural sub-total 25 13 0 0 0 38 54 Total 53 22 2 3 0 80
Total responses 89 28 2 4 0 127 127

28
Table 17: Respondents who indicated their organisation did not have SLE infrastructure CPN Health Service University TAFE Other RTO Other Total No Total responses
Central 5 3 1 9 16
Eastern 1 1 6
Northern 10 1 1 12 24
Peninsula 6
Southern 3 2 5 12
Western 4 4 9
Metro sub-total 22 6 0 2 1 31 73
Barwon South-Western 1 2 3 14
Gippsland 4 4 10
Grampians 2 2 11
Hume 3 3 8
Loddon-Mallee 4 4 11
Rural sub-total 14 0 0 2 0 16 54
Total 36 6 0 4 1 47
Total responses 89 28 2 4 0 127 127
In some instances, respondents from the same organisation and location had differing responses to whether their organisation had SLE infrastructure.
8.1 Organisations with simulated learning environment infrastructure As noted above, respondents were guided through the survey using skip logic. Thus, only those respondents who indicated they had SLE infrastructure (80) were presented with questions relating to how it is used. When asked about the highest tech infrastructure within their SLE, almost half of the respondents (38, 47.5%), indicated SimMan/METTI or equivalent – representing 20 different organisations and 24 different locations. A slightly smaller number (31, 39%) indicated full body mannequins (but not SimMan or METTI) and nine (11%) indicated part task trainers. Two respondents (2.5%) did not provide an answer. When compared to the responses from the activity survey, the improvement survey responses indicate more organisations (and locations) have equipment at each tech level.
8.1.1 Improving Capacity A major focus of this review is identification of factors that have a negative impact on SLE capacity or capability. When asked if their organisation’s SLE is used to its full capacity, the majority (52 responses, representing 65% of responses received) indicated their simulation infrastructure was not used to its full capacity, a further 20 (25%) were unsure, whereas only eight (10%) felt their infrastructure was utilised to its full capacity. As can be seen in Table 18, more full capacity responses were received from metro than rural locations, but there was an even split between Level 2 and Level 3 tech labs.

29
Table 18: Location and tech of responses indicating their SLE is used to full capacity CPN Level 2 SLE Level 3 SLE Total
Northern 1 1
Peninsula 1 1
Southern 2 1 3
Western 1 1
Metro sub-total 3 3 6
Barwon South-Western 1 1
Loddon-Mallee 1 1
Rural sub-total 1 1 2
Total 4 4 8
Respondents indicated labs of all types and locations were not used to full capacity (see Table 19).
Table 19: Location and tech of responses not indicating their SLE is used to full capacity CPN Level 1 SLE Level 2 SLE Level 3 SLE Not answered Total
Central 1 4 2 7
Eastern 2 3 5
Northern 1 9 1 11
Peninsula 1 1 3 5
Southern 2 1 1 4
Western 1 2 1 4
Metro sub-total 6 10 19 1 36
Barwon South-Western 1 5 3 1 10
Gippsland 1 3 2 6
Grampians 5 4 9
Hume 2 3 5
Loddon-Mallee 1 2 3 6
Rural sub-total 3 17 15 1 36
Total 9 27 34 2 72
Those respondents indicating their SLE was used to full capacity, were directed to questions relating to capability (see section 8.1.2 Improving Capability, starting on page 35), those who answered no or unsure were asked about barriers to increasing capacity.
Respondents were provided with a list of potential barriers and asked to rank them in priority order (with one being the biggest barrier). Sixty-eight (94%) of respondents provided at least one barrier. Sixteen people indicated number of staff was the number one barrier to increasing capacity and a total of 51 (out of 72) indicated it was a barrier. Skills/Training of Staff was the second biggest barrier with 11 indicating it was the number one barrier and 55 including it as a barrier to increasing capacity. It was also most frequently chosen as the second (12 respondents) and third (13 respondents) biggest barrier to increasing capacity. No single barrier was unanimously selected by all respondents; however, several barriers were selected by all respondents from particular CPNs. For example, all respondents from the Northern CPN selected increased awareness of potential partners as a barrier (see Table 20 for further detail).

30
Table 20: Percentage of responses to barriers to increased capacity (summarised by CPN)
CPN Sk
ills/
Trai
nin
g o
f St
aff
Equ
ipm
en
t st
orag
e sp
ace
Nu
mb
er o
f St
aff
Sim
ula
tio
n s
pac
e
De
ma
nd
fro
m in
tern
al
use
rs
Incr
ease
d "
bu
y in
" fr
om
m
an
agem
en
t
Incr
ease
d a
war
enes
s o
f p
ote
nti
al p
artn
ers
e.g.
n
earb
y ed
uca
tio
n p
rovi
der
s M
ore
Sim
ula
tio
n
Equ
ipm
en
t
De
ma
nd
fro
m e
xter
nal
use
rs
Mo
re n
on
-Sim
ula
tio
n
Equ
ipm
en
t
Oth
er (
ple
ase
typ
e it
em(s
) in
bo
x)
Central 71% 71% 86% 71% 43% 43% 43% 71% 29% 71% 29%
Eastern 80% 60% 80% 60% 60% 60% 60% 60% 60% 40% 40%
Northern 73% 91% 64% 91% 64% 82% 100% 64% 100% 73% 9%
Peninsula 80% 40% 20% 20% 40% 60% 60% 40% 20% 0% 20%
Southern 75% 75% 75% 50% 100% 100% 75% 75% 75% 75% 50%
Western 100% 75% 75% 100% 75% 75% 75% 75% 50% 50% 0%
Barwon South-Western
70% 60% 70% 60% 60% 60% 50% 60% 60% 60% 30%
Gippsland 83% 67% 50% 67% 67% 67% 50% 33% 50% 33% 33%
Grampians 78% 78% 78% 56% 78% 67% 67% 56% 67% 44% 11%
Hume 40% 60% 80% 80% 80% 60% 40% 80% 20% 20% 20%
Loddon-Mallee 100% 100% 100% 100% 100% 83% 100% 83% 100% 83% 33%
Total 76% 72% 71% 69% 68% 68% 67% 63% 61% 53% 24%

31
When broken down by SLE tech, several barriers were selected by all who responded to this question from Level 1 SLEs. Furthermore, barriers were proportionally more reported by respondents from Level 1 SLEs compared to Level 2 and 3 SLEs (Figure 4).
Figure 4: Barriers to increasing SLE capacity (summarised by tech)
Respondents were then presented with a series of questions exploring some of the potential barriers – staffing, staff training, equipment, access, space – in more detail. In all instances, respondents were allowed to select more than one response and provided with an option to indicate the particular topic under consideration was not a barrier.

32
In relation to staffing, only two respondents indicated it was not a problem. Conversely, 52 respondents (72%) indicated teaching staff and clinical staff (30 respondents, 42%) could increase the capacity of the SLE. When broken down by SLE tech, the trend was similar for Level 3 SLEs; however proportionally more respondents from Level 2 SLEs suggested a Dedicated Manager could increase capacity (Figure 5).
Figure 5: Staffing as a barrier to increasing SLE capacity (summarised by SLE tech)

33
With respect to staff training, respondents suggested scenario design was a barrier to increasing SLE capacity (indicated by 45 respondents, 63%), closely followed by support to attend staff training (indicated by 43 respondents 60%). When broken down proportionally by SLE tech, the trend was similar for Level 3 SLEs, but not for Level 1 and 2 SLEs. Proportionally, more respondents from Level 2 SLEs indicated the need for scenario design (20 respondents, 74% of Level 2 SLE respondents) and support to attend staff training (18 respondents, 67%). Not surprisingly, proportionally more respondents from Level 1 SLEs selected support to attend staff training (67%), compared with scenario design (44%) (Figure 6).
Figure 6: Staff training as a barrier to increasing SLE capacity (summarised by SLE tech)

34
When asked about equipment that could increase capacity, 39 respondents indicated Simulation related software, closely followed by Consumables (35 respondents) and Clinical support equipment (33 respondents). Somewhat surprisingly, proportionally more respondents from Level 2 SLEs indicated simulation related software would improve capacity (18 respondents, 67% of respondents who indicated they their organisation has a Level 2 SLE) compared to Level 3 SLEs (15 respondents, 44%). Respondents from Level 1 SLEs indicated low-medium tech mannequins (7 respondents, 78% of respondents) and high tech mannequins (6 responses, 67%) would increase capacity (Figure 7).
Figure 7: Equipment as a barrier to increasing SLE capacity (summarised by SLE tech)
When considering access issues that affect capacity, protected time for participants was, by far, the greatest barrier – indicated by 38 respondents (53%) – and did not vary with SLE tech.

35
Lack of storage space was the biggest space related issue (44 respondents, 61%), followed by the need for teaching space (33, 46%) and dedicated simulation space (27, 38%). When broken down by SLE tech, the trend was similar, but the magnitude was different. Most notably, 81% of respondents who indicated their organisation had a Level 2 SLE suggested more storage space was needed to increase capacity. Furthermore, in all but one response category (none) Level 2 SLEs had the highest proportional response rate (Figure 8).
Figure 8: Space as a barrier to increasing SLE capacity (summarised by SLE tech)
8.1.2 Improving Capability Following the section on capacity, respondents were asked a series of questions relating to capability – the quality and diversity of courses/sessions ideally delivered within the SLE. Of the 80 respondents indicating their organisation had an SLE, four (5%), indicated their SLE was used to its full capability and none were from Level 1 SLEs (Table 21). These respondents also indicated their SLE was used to its full capacity (see Section 8.1.1 Improving Capacity, page 28). Of the remaining 76 respondents, 69 (86%) said their SLE was not used to its full capability (58, 72.5%) or were unsure (11, 13%) (Table 22); seven did not answer the question.
Table 21: Location and SLE tech of respondents indicating their SLE was used to its full capability CPN Level 2 SLE Level 3 SLE Total
Peninsula 1 1
Southern 1 1 2
Metro Sub-total 1 2 3
Barwon South-Western 1 1
Total 1 3 4

36
Table 22: Location and SLE tech of respondents not indicating their SLE was used to its full capability
CPN Level 1 SLE Level 2 SLE Level 3 SLE Tech not provided Total
Central 1 4 1 6
Eastern 1 3 4
Northern 1 9 1 11
Peninsula 1 1 2 4
Southern 2 2 1 5
Western 1 3 1 5
Metro sub-total 6 11 17 1 35
Barwon South-Western 1 5 2 1 9
Gippsland 1 3 2 6
Grampians 4 4 8
Hume 2 3 5
Loddon-Mallee 3 3 6
Rural sub-total 2 17 14 1 34
Total 8 28 31 2 69
Similarly to capacity, respondents indicating their SLE was used to its full capability were directed to the next section of the survey – general improvements – all other respondents (i.e. those answering no or unsure), were asked a series of questions about barriers to improving capability. When asked about the biggest barriers to increasing capability, Number of staff was most frequently ranked number one (19 respondents) and it was also the most selected barrier (selected by 50 respondents,72%). Skills/Training of Staff was selected as the number one barrier by nine respondents (18 respondents ranked it number one or two, and 43 indicated it was a barrier). Increased buy in from management was also common, with 43 respondents indicating it was a barrier and 16 putting it in their top three barriers to improving capability. Although no single barrier was selected by all respondents, several barriers were selected by all respondents from particular CPNs. For example, all respondents from the Central CPN selected Number of staff as a barrier to increasing capability (see Table 23 for further detail).

37
Table 23: Percentage of responses to barriers to increased capability (summarised by CPN)
CPN
Nu
mb
er o
f St
aff
Skill
s/Tr
ain
ing
of
Staf
f
Incr
ease
d "
bu
y in
" fr
om
m
an
agem
en
t
Mo
re S
imu
lati
on
Eq
uip
me
nt
Clin
ical
exp
erti
se o
f St
aff
Sim
ula
tio
n s
pac
e
Equ
ipm
en
t st
orag
e sp
ace
Mo
re n
on
-Sim
ula
tio
n
Equ
ipm
en
t
Incr
ease
d a
war
enes
s o
f tr
ain
ing/
curr
icu
lum
nee
ds
De
ma
nd
fro
m in
tern
al
use
rs
Incr
ease
d a
war
enes
s o
f p
ote
nti
al p
artn
ers
eg
nea
rby
SLE
infr
astr
uct
ure
De
ma
nd
fro
m e
xter
nal
use
rs
Oth
er b
arri
ers
to
incr
easi
ng
cap
abili
ty
Central 100% 100% 67% 100% 83% 83% 83% 83% 33% 33% 33% 50% 0%
Eastern 50% 25% 50% 25% 25% 25% 50% 25% 75% 50% 25% 50% 25%
Northern 73% 45% 64% 45% 55% 45% 45% 45% 73% 45% 64% 45% 0%
Peninsula 50% 50% 100% 50% 25% 25% 25% 25% 0% 25% 0% 0% 25%
Southern 60% 60% 100% 40% 60% 80% 80% 60% 60% 60% 60% 40% 0%
Western 60% 40% 60% 60% 60% 80% 20% 60% 40% 40% 20% 20% 0%
Metro sub-total
69% 54% 71% 54% 54% 57% 51% 51% 51% 43% 40% 37% 6%
Barwon South-Western
67% 67% 56% 44% 33% 33% 44% 44% 33% 33% 44% 33% 11%
Gippsland 83% 50% 33% 50% 33% 50% 50% 17% 17% 33% 0% 17% 17%
Grampians 88% 88% 50% 75% 63% 38% 50% 50% 38% 75% 50% 63% 13%
Hume 60% 40% 60% 40% 20% 60% 40% 20% 40% 40% 20% 40% 0%
Loddon-Mallee
83% 100% 67% 100% 100% 67% 83% 83% 100% 50% 100% 50% 33%
Rural sub-total
76% 71% 53% 62% 50% 47% 53% 44% 44% 47% 44% 41% 15%
Total 72% 62% 62% 58% 52% 52% 52% 48% 48% 45% 42% 39% 10%

38
When broken down by SLE tech, barriers to increasing capability were proportionally more reported by respondents indicating Level 1 SLEs than respondents from Level 2 or 3 SLEs (Figure 9).
Figure 9: Barriers to increasing SLE capability (summarised by tech)

39
When asked What aspects of staffing could increase capability of your SLE? 47 (68% of respondents) indicated Teaching staff, with Technical Staff and Clinical Staff receiving 33 responses (47%) each. When broken down by SLE tech, a dedicated manager was selected by proportionally more respondents from Level 2 SLEs than other levels (being the second most selected staffing barrier for respondents from Level 2 SLEs). Proportionally, respondents from Level 1 SLEs, had less reliance on “good will” as their equal highest barrier with teaching staff (Figure 10)
Figure 10: Staffing as a barrier to increasing SLE capability (summarised by SLE tech)

40
Both Scenario Design and Support to attend staff training (both selected by 41 respondents representing 59% of respondents) were most commonly selected as aspects of staff training that could increase SLE capability. The next closest staff training related barriers to capability were debriefing techniques and general access to training (both selected by 30 respondents, representing 43%). When broken down by SLE tech, respondents from Level 2 SLEs showed proportionally higher response rates for all staffing barriers besides Other (Figure 11).
Figure 11: Staff training as a barrier to capability (summarised by SLE tech)

41
With respect to equipment, clinical support equipment (35 respondents, 49% of those indicating their SLE was not at its full capability) was most commonly selected as being able to increase capability, followed by Simulation related software (31, 43%) and Consumables (30, 42%). Compared to the group as a whole, respondents from Level 2 SLEs were more interested in simulation related software (18, 67% of Level 2 SLE respondents). Not surprisingly, respondents from Level 1 SLEs indicated high tech mannequins (6, 67%) and low-med tech mannequins (5, 56%) more frequently than the group as a whole (Figure 12).
Figure 12: Equipment as a barrier to increasing SLE capability (summarised by SLE tech)
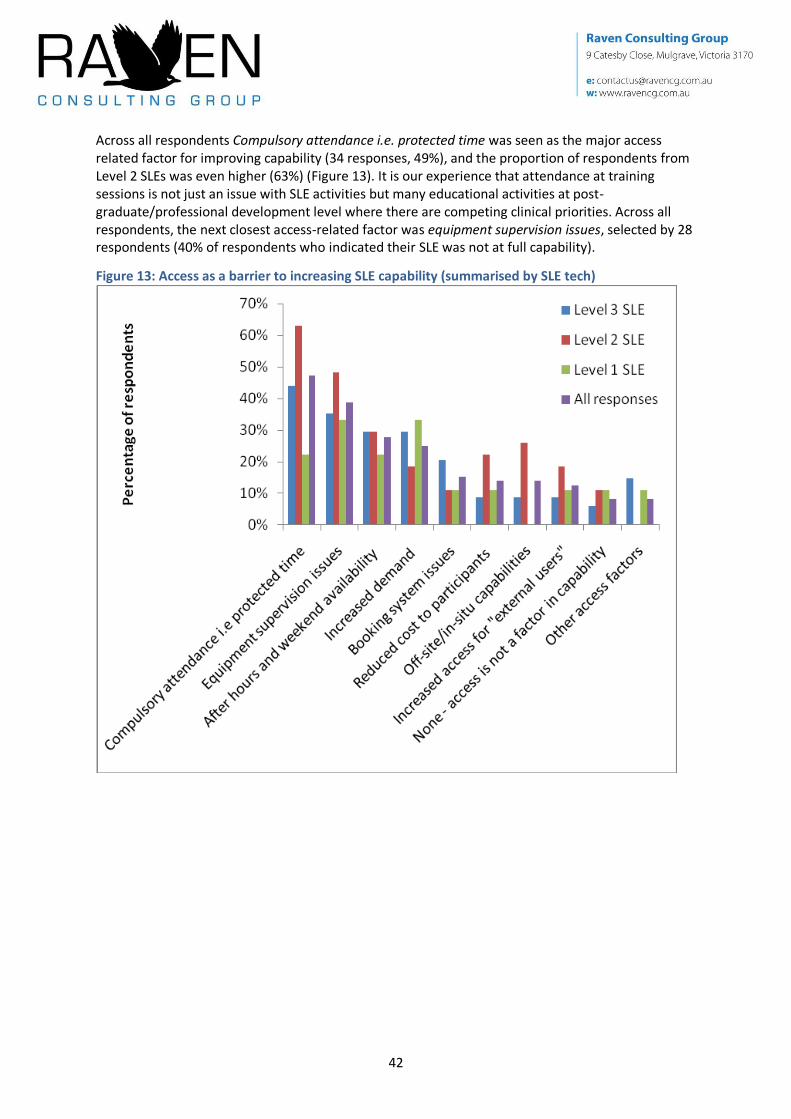
42
Across all respondents Compulsory attendance i.e. protected time was seen as the major access related factor for improving capability (34 responses, 49%), and the proportion of respondents from Level 2 SLEs was even higher (63%) (Figure 13). It is our experience that attendance at training sessions is not just an issue with SLE activities but many educational activities at post-graduate/professional development level where there are competing clinical priorities. Across all respondents, the next closest access-related factor was equipment supervision issues, selected by 28 respondents (40% of respondents who indicated their SLE was not at full capability).
Figure 13: Access as a barrier to increasing SLE capability (summarised by SLE tech)

43
In relation to space, storage space was the biggest factor affecting capability (selected by 35 respondents, representing 49% ) followed by the need for more teaching space (29 respondents, 40%). Respondents from Level 2 SLEs appeared to have more issues with space, with proportionally higher responses against every option (Figure 14).
Figure 14: Space as a barrier to increasing SLE capability (summarised by SLE tech)
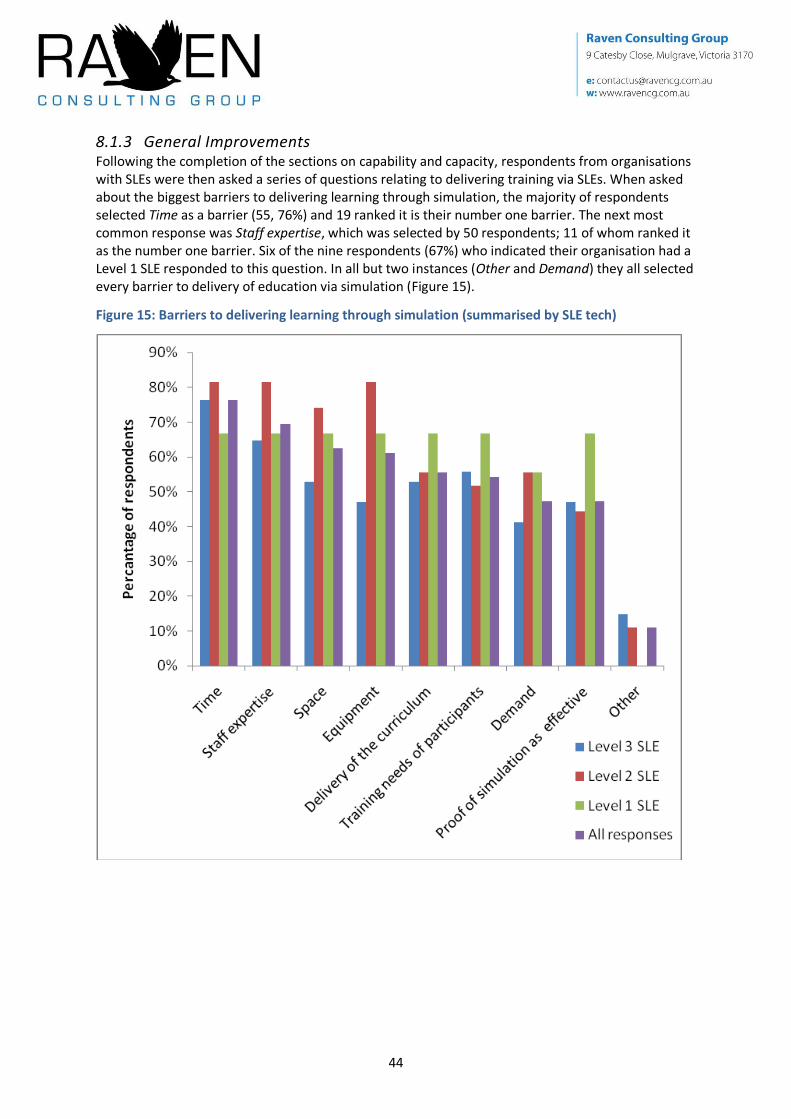
44
8.1.3 General Improvements Following the completion of the sections on capability and capacity, respondents from organisations with SLEs were then asked a series of questions relating to delivering training via SLEs. When asked about the biggest barriers to delivering learning through simulation, the majority of respondents selected Time as a barrier (55, 76%) and 19 ranked it is their number one barrier. The next most common response was Staff expertise, which was selected by 50 respondents; 11 of whom ranked it as the number one barrier. Six of the nine respondents (67%) who indicated their organisation had a Level 1 SLE responded to this question. In all but two instances (Other and Demand) they all selected every barrier to delivery of education via simulation (Figure 15).
Figure 15: Barriers to delivering learning through simulation (summarised by SLE tech)

45
Staff Issues were the most frequently selected barrier to delivering the clinically important/relevant courses/sessions you [respondents] would like to, receiving 44 responses (61% of respondents). Relative to other respondents, those from Level 2 SLEs more frequently noted equipment issues as a barrier to course delivery (Figure 16).
Figure 16: Barriers to delivering clinically important/relevant courses/sessions (summarised by SLE tech)

46
When asked about services SLEs could offer to organisations outside their own, the responses were relative evenly spread between Professional Development (44 responses, 61% of respondents) and Joint educational sessions (42, 58%). Sharing of Education scenarios (37, 51%), staff training (to use simulation) (36, 50%) were also commonly selected. Respondents from Level 3 SLEs were the most keen to offer joint education sessions (68% of all respondents from Level 3 SLEs), whereas respondents from Level 2 SLEs were keen on professional development (67%) and respondents from Level 1 SLEs were keen on access to equipment on site (67%) (Figure 17).
Figure 17: Services SLEs could deliver to others outside their own (summarised by SLE tech)
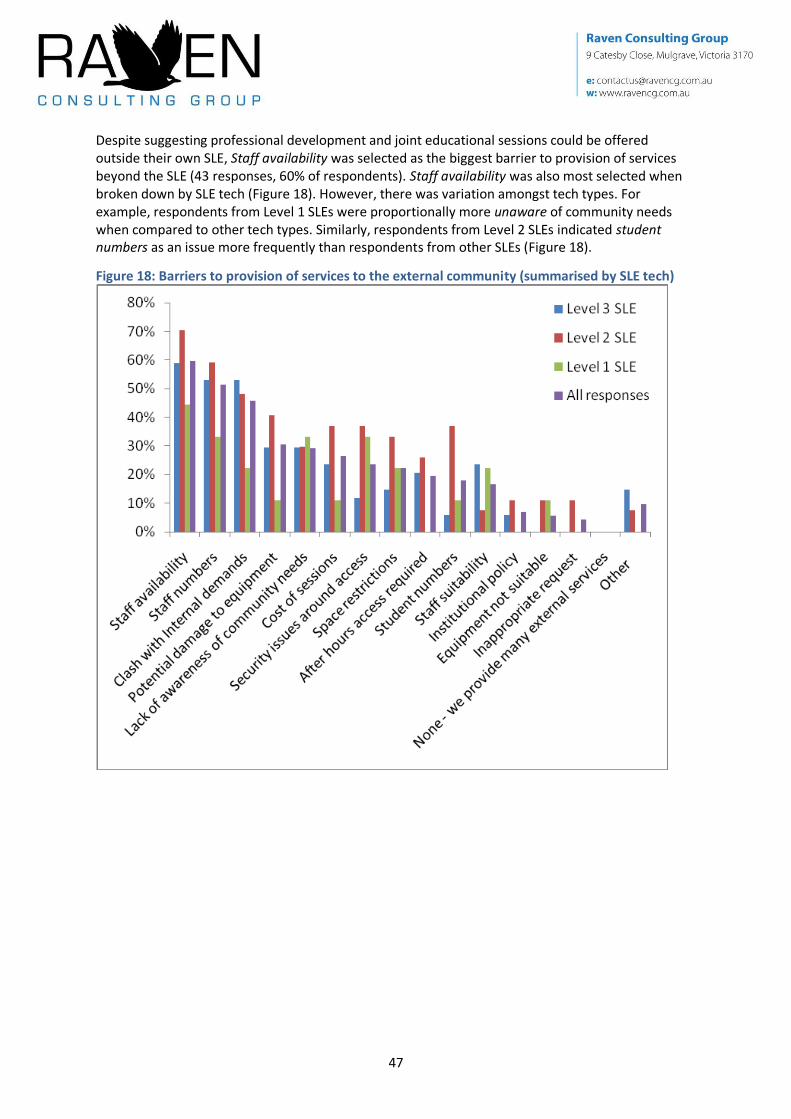
47
Despite suggesting professional development and joint educational sessions could be offered outside their own SLE, Staff availability was selected as the biggest barrier to provision of services beyond the SLE (43 responses, 60% of respondents). Staff availability was also most selected when broken down by SLE tech (Figure 18). However, there was variation amongst tech types. For example, respondents from Level 1 SLEs were proportionally more unaware of community needs when compared to other tech types. Similarly, respondents from Level 2 SLEs indicated student numbers as an issue more frequently than respondents from other SLEs (Figure 18).
Figure 18: Barriers to provision of services to the external community (summarised by SLE tech)

48
The final question asked only of respondents with SLEs covered managing equipment replacement and repairs. Sixty-five people provided a response, of those only 28 (43%) indicated a strategy or plan exists. When broken down by SLE tech, more respondents from Level 3 SLEs indicated they had a strategy or plan to manage equipment repairs and replacement (47% of all Level 3 SLE respondents). Despite the hardware remaining in working order, the software and mannequin technology becomes superseded after five to seven years, which restricts using the mannequin to its full potential, capacity and capability (Figure 19).
Figure 19: Existence of a strategy to manage SLE equipment (summarised by SLE tech)
8.2 Organisations without SLEs Forty-seven respondents indicated their organisation did not have an SLE (Table 17, page 28), and it is noteworthy that several respondents list organisation details that matched those of respondents indicating their organisation has SLE infrastructure. However, as we are not able to tell (with any certainty) which of the two respondents are correct, no data has been modified or removed.
When asked to rank the reasons why their organisation does not have SLE infrastructure, 22 respondents (47%, the most for any reason) noted their organisation has an SLE in planning, of those, six provided that as the number one reason why their organisation does not have SLE infrastructure (Table 24). Twenty respondents noted a lack of funding (11 indicated it was the number one reason) and 20 suggested it was due to lack of space/land (12 respondents placed it in their top three).

49
Table 24: Reasons for not having SLE infrastructure (summarised by CPN)
CPN
Pla
nn
ing
in p
rogr
ess
Lack
of
spac
e/la
nd
Lack
of
fun
din
g
Aw
aiti
ng
fun
din
g
Lack
of
staf
f/ex
per
tise
Lack
of
equ
ipm
en
t
A n
earb
y fa
cilit
y gi
ves
us
acce
ss t
o t
hei
r SL
E
Ther
e is
litt
le n
eed
for
sim
ula
ted
lear
nin
g
No
hea
lth
pro
fess
ion
al e
du
cati
on
req
uir
ed
wit
hin
th
e o
rgan
isat
ion
Lack
of
suit
able
par
tner
s
We
use
a m
ob
ile s
imu
lati
on
ser
vice
Sim
ula
ted
lear
nin
g w
ou
ld n
ot
add
valu
e to
ou
r ed
uca
tio
nal
act
ivit
ies
No
sim
ula
tio
n t
rain
ing
req
uir
ed b
y o
ur
staf
f
Lack
of
enth
usi
asm
No
t su
re
Oth
er
Tota
l "n
o"
resp
on
ses
Central 4 4 5 5 3 4 3 3 3 3 2 2 2 1 2 1 9
Eastern 1 1 1 1 1 1 1
Northern 9 6 3 6 4 4 2 3 4 3 2 3 4 3 2 2 12
Peninsula - - - - - - - - - - - - - - - 0 0
Southern 2 2 3 2 3 1 3 1 1 2 2 1 1 1 3 2 5
Western 3 2 2 2 2 2 2 2 2 1 2 2 2 2 2 1 4
Metro sub-total
18 14 14 16 13 11 11 9 11 10 8 8 9 7 9 6 31
Barwon South-Western
2 3 3 2 3 3 2 2 1 2 2 2 1 2 1 3
Gippsland 1 4
Grampians 1 2
Hume 3
Loddon-Mallee
2 3 2 1 1 2 1 1 1 1 1 1 1 2 4
Rural sub-total
2 3 3 1 1 2 1 2 1 1 1 1 1 2 0 0 16
Total 22 20 20 19 17 16 14 13 13 13 11 11 11 11 10 6 47
Those responses indicating planning [is] in progress for a new SLE were broken down by organisation type and location it appears as though at least 14 unique organisations have SLEs in planning covering 17 unique sites (Table 25).
Table 25: Number of organisations and locations where new SLEs are planned Health Service University TAFE Other RTO Other Total
Number of organisations 9 3 - 2 - 14
Number of locations 10 5 - 2 - 17

50
When asked the preferred tech of simulation equipment, 21 respondents (45% of those indicting they do not have SLE infrastructure) selected high tech mannequins. It is interesting to note that not all respondents selected the highest level of infrastructure, nor did all respondents select all levels of infrastructure (Table 26).
Table 26: Infrastructure preferred by respondents who indicated their organisation did not have SLE infrastructure
High tech human patient mannequin
Low-med tech full body mannequins
Part task trainers
None required
Other
Response count
21 16 11 4
Approximately 36% (17) of respondents have not tried accessing SLEs within other organisations, the same number (17) have tried and 13 did not provide a response. Of those who have not tried accessing SLEs within other organisations, five (31%) indicated there are no SLEs close enough and five also indicated Other – there were no similarities in the responses.
Table 27: Reasons for not accessing SLEs within other organisations There are
none close enough
Not sure
I am not aware of any SLEs that allow external users
Too expensive
We do not need simulation-based learning
Not enough demand for that kind of education
Other
Response count
5 3 3 2 1 1 5
For those who indicated they do make use of other SLEs, four receive the level of access they require, whereas eight suggest they do not; with many citing price as a barrier to continued use. Indeed, nine respondents provided a comment and five of those comments noted price restricted extended or continued use.
When considering the specific simulation sessions, only six respondents (out of 17 that indicted they use other simulation facilities and 14 who responded to the question) suggest they can run the programmes they would like to but there are always compromises. A further six provided comments about their use including three indicating they “make do” or “need to provide their own equipment”.

51
8.3 Improving Victoria When considering how SLEs could be improved across Victoria, all respondents were asked What support services outside of your SLE/organisation would assist you in the management and/or use of simulation infrastructure? Sixty-nine respondents (54% of respondents, 75% of the 91 who answered the question) indicated a Bank of education scenarios. The second most popular support service was a Simulation support network (60 respondents, 47% of respondents 66% of those answering the question). The provision/availability of a Pool of casual, SLE trained, staff was also popular (50 respondents, 39% of respondents, 55% of those answering the question) (Table 28).
Table 28: Response to what support services would assist management and/or use of simulation infrastructure (summarised by CPN)
CPN Ban
k o
f ed
uca
tio
n s
cen
ario
s
Sim
ula
tio
n s
up
po
rt n
etw
ork
Po
ol o
f ca
sual
, SLE
tra
ined
, sta
ff
SLE
equ
ipm
en
t/in
fras
tru
ctur
e re
gist
er (
Vic
tori
a-w
ide)
Eq
uip
me
nt
ren
tal s
ervi
ce
Au
tom
ate
d (e
lect
ron
ic)
bo
oki
ng
serv
ice
Equ
ipm
en
t re
gist
er (
Vic
tori
a-w
ide)
List
of
po
ten
tial
cu
sto
mer
s/cl
ien
ts
Oth
er s
ervi
ces
No
thin
g -
we
have
all
we
nee
d
Totals
Central 8 7 3 5 5 1 3 3 3 16
Eastern 3 3 2 2 1 2 2 1 6
Northern 13 10 8 6 3 3 4 3 1 1 24
Peninsula 2 2 2 1 1 1 1 6
Southern 7 10 7 6 4 5 7 2 12
Western 6 6 6 3 1 2 3 2 9
Metro sub-total 39 38 28 23 15 14 19 11 5 1 73
Barwon South-Western 10 8 6 6 6 4 3 1 1 14
Gippsland 5 3 5 3 2 1 2 2 1 10
Grampians 5 3 2 1 3 3 1 1 11
Hume 5 2 5 1 2 1 1 1 8
Loddon-Mallee 5 6 4 2 2 5 1 3 11
Rural sub-total 30 22 22 13 15 14 8 8 2 0 54
Total 69 60 50 36 30 28 27 19 7 1 127

52
Interestingly, when broken down by SLE tech (including those without SLEs), the rank order (by responses received) did not change. That is, amongst respondents that indicated their organisation did not have an SLE, bank of education scenarios was most popular, followed by simulation support network etc (Table 29). The same was also found when the data was broken down by organisation type (data not shown).
Table 29: Response to what support services would assist management and/or use of simulation infrastructure (summarised by SLE tech)
SLE Tech Ban
k o
f ed
uca
tio
n s
cen
ario
s
Sim
ula
tio
n s
up
po
rt n
etw
ork
Po
ol o
f ca
sual
, SLE
tra
ined
, sta
ff
SLE
equ
ipm
en
t/in
fras
tru
ctur
e re
gist
er
(Vic
tori
a-w
ide)
Eq
uip
me
nt
ren
tal s
ervi
ce
Au
tom
ate
d (e
lect
ron
ic)
bo
oki
ng
serv
ice
Equ
ipm
en
t re
gist
er (
Vic
tori
a-w
ide)
List
of
po
ten
tial
cu
sto
mer
s/cl
ien
ts
Oth
er s
ervi
ces
No
thin
g -
we
have
all
we
nee
d
Totals
Level 1 SLE 4 5 4 4 3 3 4 3 9
Level 2 SLE 21 16 17 11 11 7 10 6 1 31
Level 3 SLE 22 19 17 8 7 9 4 7 2 38
Tech not indicated 1 2
No SLE 22 20 12 13 9 9 9 3 3 1 47
Total 69 60 50 36 30 28 27 19 7 1 127
53
9 Discussion and Suggested Actions Clinical skills simulation activities have been around since 1985 (according to the establishment data collected as part of this project), but the past few years have seen an exponential growth in activities associated with simulated learning (as also indicated by the establishment data, with the average age of facilities being only 3.9 years). As noted in the introduction, this probably reflects a number of factors including a shortage of clinical placements and an acceptance of simulation as a suitable alternative (but not necessarily one for one).
Overall, participation in the project was good, and (for the most part) the reception received from stakeholders was one of enthusiasm at the prospect of a more coordinated clinical skills simulation sector within Victoria. However, there were notable absentees from parts of the process and these stakeholders will need to be encouraged to participate in future efforts, particularly if a statewide simulation plan is the ultimate goal. Indeed, a small number of stakeholders were cynical about the project leading to a statewide plan, as (in their view) previous processes had been started but not finished.
Suggested Action 1
Consider the creation of a statewide SLE plan and explore the feasibility and shape of a statewide SLE plan with stakeholders.
Suggested Action 2
Encourage stakeholders that did not participate in this SLE project, to participate in the next (and subsequent) ones.
The overwhelming theme across the entire project (not only from the data but also with interactions with stakeholders) was the need to improve staffing. As noted in Section 4.4 Methodology (page 4), participants were sluggish in responding to the activity survey and it was not uncommon for participants to note a lack of staff in their SLE making completing the survey difficult. Indeed, once analysis of the Activity Survey data was complete, it was evident most SLEs had very few dedicated staff (if any). This was further supported by data from the improvement survey, with the number one barrier to increasing capability and capacity being number of staff, staff issues also prevented the delivery of clinically important/relevant courses/sessions and staff expertise was the second biggest barrier (after time) to delivering learning through simulation.
Suggested Action 3
Liaise with SLEs about the requirements for additional staff and building dedicated staffing resources into SLE business plans and forward planning.
Many factors affect staff numbers. In our experience, the (emerging) role of SLE Clinical Teacher differs greatly from the more traditional role of Clinical Teacher and this often goes unrecognised by decision makers higher up in the organisation. Although on paper it may appear that there are adequate Clinical Teachers within the simulation environment, the role of SLE Clinical Teacher is often much broader than teaching, covering:
Initial establishment of the SLE – in our experience, one person is usually nominated to take responsibility of the development of an SLE (usually in addition to their other roles/clinical duties).
Scenario design – from idea to reality can take weeks of preparation. Indeed, when asked about the staff training factors that could improve capability and capacity, in both cases scenario design received the most number of responses of all options.

54
Console operation and technology management – In addition to a clinical teacher, Level 3 SLE equipment requires a console operator to drive the mannequin and the software. Sessions are often recorded, edited and played back in a debriefing process that requires active management. This is a highly specialised skill – and more so for particular brands of equipment.
Debriefing/facilitation skills – one of the most important parts of any simulation learning experience and differentiates simulation-based courses from other clinical teaching. It requires lots of guided practice to develop expertise and is considered the most difficult/challenging aspect of the simulation.
Upkeep of equipment – especially onerous if more than one organisation has access to the SLE. Managing space – space has a major impact on the time it takes to setup and pack-up simulation
equipment and therefore the number of sessions that can be offered. Limited storage space can necessitate the complete dismantling of certain equipment in order to store it or facilitate use of the simulation space for other activities. In some cases, this dismantling can add hours or days to the time it takes to prepare for and run a course.
Management of bookings and equipment loans Business management – with tight budgets, health services and education services require
tighter scrutiny of departments, their spending and income. As SLEs become more sophisticated (through the purchase of high tech equipment) they are being increasingly expected to operate on a cost-recovery (or even for-profit) basis. This has the effect of restricting access for those unable to pay, but adds another layer of stress and responsibility to the SLE staff.
Training of new staff – most simulation training is on-the-job with very few opportunities for staff to attend formal training. Responses to the improvement survey noted staff skills/training as a barrier to increasing capacity and capability. This barrier was supported by the responses to the Activity Survey that indicate almost 70% of staff members that use SLEs as educators do not have formal SLE training (see Section 7.5 Training, page 22). Although the reasons for this are not entirely clear, the authors note that there are only a small number of simulation training courses, many of which are priced beyond the training budget of most SLE staff.
Suggested Action 4
Liaise with SLEs to better define the roles of staff and the staffing structure within SLEs.
Suggested Action 5
Explore options and partnerships to support the development of training for SLE staff with consideration of emerging roles.
Beyond staffing (and staff training), there were other themes within parts of the project. Within the Improvement Survey, space was noted as a barrier to increasing capacity and capability. In both instances, space was in the top four barriers noted by respondents. When specifically asked about space as a barrier to capacity or capability, equipment storage space received the most number of responses. Storage space is often a challenging aspect of SLE design as most equipment and mannequins are used periodically (rather than all the time), they are also big and bulky, and have associated clinical and consumable equipment (particularly Level 3 equipment). Although creating more space is the obvious solution, it is not entirely practical, particularly at established locations. Instead, the focus should be on smarter packing, unpacking and storage. This could be through working with equipment manufacturers and facilities staff to implement innovative storage solutions, or through greater use of technical staff to manage storage, equipment upkeep, setting-up and packing-up. Greater use of technical staff would also allow SLE teachers to increase their focus on teaching.

55
Suggested Action 6
Encourage SLEs to help identify solutions to the space issues, particularly for those locations where building or expanding is not an option.
Although simulation equipment was highly ranked as a barrier to increasing both capacity and capability, simulation software (capacity) and clinical support equipment (capability) were the most selected responses to increasing activity. For both capacity and capability, simulation equipment (i.e. PTTs, mannequins etc.) was outside the top three. This may reflect the limited space and/or that most facilities have most of what they want/need. Further evidence that simulation equipment is currently not a barrier to increasing capacity or capability lies in results of the Activity Survey, where the vast majority of equipment was used for less than half the number of weeks it was available for use in 2009. However, equipment was a highly ranked barrier to delivering learning through simulation as well as delivering clinically important/relevant courses/sessions.
The reason for having an SLE is to deliver education to health workforce trainees and practitioners, thus in order to get value for money it is important sessions are attended – indeed facilitated. It is therefore interesting to note that protected time for participation was the number one access issue affecting capacity and capability (and probably solely relates to access by practitioners rather than trainees). However, factors that could relate to protected time for participation, such as “buy in” from management, and demand from internal users, did not rate highly as barriers to increasing capacity and were third or lower as barriers to increasing capability. Within the Activity Survey, the average cancellation/no-show rate for courses/sessions, (across all courses and respondents) was only ten percent.
However, the consultants acknowledge that (anecdotally at least) the need for provision of protected time is an issue with most post-graduate education/professional development – especially medical education. The competing clinical workload often affects participant availability and or length of stay at a course/session. Arguably, nurses are more able to attend sessions during their handover time when staff numbers are doubled, whereas similar staff increases do not occur for other disciplines. Solutions to this are often considered at the SLEs planning stage, but the interests of the educator and learner are often at odds. Learners (particularly practitioners) prefer on-site SLEs that allow a quick return to duty if required. Whereas, off-site SLEs require participants to physically leave work and stay for the duration of the session – much preferred by educators.
Suggested Action 7
Encourage SLEs and their parent organisation(s) to increase the likelihood/frequency of registrants attending entire training sessions – no matter what their craft group/discipline.
Off-site SLEs can create their own problems for educators – potentially creating a sense of isolation – particularly if staffing numbers are small and they are located away from other educational and/or clinical activities. Although this issue was not specifically explored within this project, many respondents to the Improvement Survey indicated that a simulation support network would assist the management and/or use of simulation infrastructure. The details of such a network were not asked for (or provided), but the consultants note several organisations (particularly in rural Victoria) have started creating their own networks and Holmesglen Institute have began a nursing specific network (based on the California based Bay Area Simulation Collaborative[23])
Beyond reducing the sense of isolation, the creation of a network may also facilitate the sharing of scenarios or staff and exchange of programmes, training, websites and maintenance/best practice standards. Depending on size and membership, a network may also be able to coordinate SLE activities across CPNs and the continuum of education (from entry-level to specialisation,

56
professional development and beyond). It should be noted that, in commissioning this work, the DH’s main objective was to understand the support and resourcing SLEs require to improve current utilisation and access rates. The data collected may also be used to create a strategy for SLE development across the state and inform work within CPNs. By making this report widely available, individual organisations will be able to put their activities into the context of SLEs in Victoria. Furthermore, participants will be able to see how their time and effort (by completing and returning surveys) contributed to the project and final report.
Suggested Action 8
This report should be publicly available to inform future SLE investment and directions.
9.1 Suggested Plan As stated in Section 4 Introduction (page 1), a central planning agency has a role to play in using simulation to improve efficiency of available clinical education and training, including simulation. A long-term, structured and supported plan is required to provide initial stability and ongoing sustainability to an emerging workforce involved in delivering simulated learning activities. Financial support for simulation equipment has been provided in the past – to the extent that simulation equipment was ranked lower down the priority list for increasing capacity or capability of SLEs. A commitment is now required to increase the number of trained staff and offer access to a greater range of craft groups/disciplines (and therefore increase the capacity and capability of Victoria’s SLEs) from all stakeholders (government, health services and education providers) both with and without SLEs.
9.1.1 Staff recruitment and development As the major theme across the Activity and Improvement Surveys, it is important the identified staff recruitment issues are addressed. As also highlighted by the data, these staff will need to be appropriately skilled/trained in the delivery of education using simulation. Based on our experiences, two new professional roles may need to be formally recognised including the provision of training, setting of standards and awarding of credentials. The first of these roles is the Simulation Facilitator (also called the Simulationist). Facilitators would be qualified to deliver SLE education and to subsequently supervise and train ad hoc/casual simulation educators (such as expert clinicians) in the most effective use of simulation as an education tool. It is expected Facilitators will have a qualification in an appropriate health profession in addition to their SLE Facilitator qualification. The second of these roles would be the Simulation Technician. Technicians would mainly focus on operating consoles (in the case of Level 3 equipment) as well as manage poorly designed or small storage spaces, and maintain mannequins and equipment to the highest standards, thus reducing replacement costs. It is intended the Technician would reduce the workload and responsibilities of the Facilitators, allowing them to focus on educating. Beyond their simulation technician qualification, it is not envisaged that people in this role will require other qualifications.
It is noted the need for these two roles (and support for them), were discussed at the 2010 SimTect conference, in the context of addressing the issue of certification and professional standards.
The department’s role may be in the provision of financial support for candidates to attend existing courses and/or to identify the need for and/or develop of new courses. The consultants note that beyond Level 1 and 2 TtT (two days duration for each), the only other Simulation Facilitator qualification currently available is a Graduate Certificate in Clinical Simulation, a 12 month postgraduate qualification with its associated fees of approx $8,000. Thus, there may be a need to provide learning packages to bridge the gap between these courses. Furthermore, only equipment

57
specific courses exist for the training of console operators and no courses exist to train Simulation Technicians.
9.1.2 Support Network The SLE support network could have a range of functions, primarily based on the idea of connecting SLEs with each other for the sharing of education sessions as well as expertise and ideas on simulation. For example, the Improvement Survey highlighted the need for simulation related software as well as a bank of education scenarios (in many instances these may be the same thing). An activity for the support network could be to work with SLEs to create and maintain a bank of education scenarios and/or tools to help build scenarios. The support network may take on other activities, such as maintaining a list of casual instructors (to support the delivery of educational sessions and provide an emergency teaching role) or lists of equipment or expertise. The network may also play a role in disseminating information, setting standards and policies and identifying funding opportunities. It may even provide solutions to the space problems highlighted in the Improvement Survey.
The challenges Victoria faces concerning SLEs are not new, or unique and there are several examples of established alliances, networks, and collaborations, that attempt to provide a regional umbrella under which SLEs can function in a more formalised, organised, validated and standardised manner. The role of the DH may be to liaise with existing networks, here and overseas, about the most appropriate model and support the implementation of that model across CPNs. As noted, there are several models of simulation networks in operation around the world. Indeed Holmesglen Institute has began forming the Victorian Simulation Alliance – a nursing-based simulation network part of (and based on) the California Bay Area Simulation Collaborative[23].

58
10 Acknowledgements The consultants (Dr Huysmans and Ms Keast) would like to thank the department for the opportunity to undertake this project. The participants are also thanked for their involvement, particularly those who gave up personal time to complete the various surveys or to proof read draft documents.

59
11 References 1. Department of Health, Workforce Innovation Team, Better Skills, Best Care. Cited 6 Apr,
2010. Web address: http://www.health.vic.gov.au/__data/assets/pdf_file/0006/306699/bsbc_oview_poster.pdf.
2. Department of Human Services, Clinical Placements in Victoria: Establishing a Statewide Approach, 2007. (Report prepared by Department of Human Services).
3. Skills Victoria, Get-Funding. Cited 29 Sep, 2010. Web address: http://www.skills.vic.gov.au/get-training/get-funding.
4. Rodger, S., Webb, G., Devitt, L., Gilbert, J., Wrightson, P. and McMeeken, J., Clinical education and practice placements in the allied health professions: an international perspective. J Allied Health, 2008. 37(1): p. 53-62.
5. McAllister, L., Issues and innovations in clinical education. Advances in Speech-Language Pathology, 2005. 7(3): p. 138-148.
6. Efficacy and effectiveness of simulation based training for learning and assessment in health care, 2007. (Report prepared by Department of Health). Cited 22 Feb, 2010. Report available from: http://www.health.vic.gov.au/__data/assets/pdf_file/0015/372120/DHS-REPORT_sim-efficacy_150807.pdf.
7. Wikipedia, Flight Simulator. Cited 22 Feb, 2010. Web address: http://en.wikipedia.org/wiki/Flight_simulator.
8. Wikipedia, Medical Simulation. Cited 22 Feb, 2010. Web address: http://en.wikipedia.org/wiki/Medical_simulation.
9. Medical Simulation in EM Training and Beyond. (Report prepared by Academic Resident). Cited 22 Feb, 2010. Report available from: http://www.saem.org/SAEMDNN/Portals/0/Medical%20Simulation%20in%20EM%20Training%20and%20Beyond.pdf.
10. Department of Human Services, Clinical Skills Education Requirements of the Health Professions in Victoria, 2003. (Report prepared by Postgraduate Medical Council of Victoria). Cited 10 Jan 09. Report available from: http://www.dhs.vic.gov.au/pdpd/workforce/downloads/clinical_skills.pdf.
11. Clinical Placements in Victoria: Considering a Clinical Placement Agency, 2008. (Report prepared by Department of Human Services). Cited 23 Feb, 2010. Report available from: http://www.health.vic.gov.au/__data/assets/pdf_file/0003/307317/clinical_placements_in_victoria_agency_discussion-08.pdf.
12. Department of Human Services, Clinical placement agency – report on consultation workshops, 2008. (Report prepared by DLA Phillips Fox). Cited 7 Jun, 2009. Report available from: http://www.health.vic.gov.au/workforce/agency-concept.
13. A New Model of Clinical Placement Governance in Victoria. Final Report to Council of Victorian Health Deans and the Department of Human Services, 2009. (Report prepared by Darcy Associates Consulting Services). Cited 17 Feb, 2010. Report available from: http://www.health.vic.gov.au/__data/assets/pdf_file/0015/350430/Clinical-Placement-Governance---Final-Report.pdf.
14. Department of Health, A New Model of Clinical Placement Governance for Victoria. Cited 23 Feb, 2010. Web address: http://www.health.vic.gov.au/workforce/placements/governance/placement-governance.
15. National Health Workforce Taskforce. Cited 17 Feb, 2010. Web address: http://www.nhwt.gov.au/nhwt.asp.
16. Health Education and Training: Clinical Training - Governance and Organisation, 2009. (Report prepared by the National Health Workforce Taskforce). Cited 17 Feb, 2010. Report
60
available from: http://www.nhwt.gov.au/documents/Education%20and%20Training/Clinical%20training%20-%20governance%20and%20organisation%20discussion%20paper.pdf
17. National Partnership Agreement on Hospital and Health Workforce Reform, 2009. (Report prepared by Committee of Australian Governments). Cited 23 Feb, 2010. Report available from: http://www.nhwt.gov.au/documents/COAG/National%20Partnership%20Agreement%20on%20Hospital%20and%20Health%20Workforce%20Reform.pdf
18. Health Workforce Australia, About HWA. Cited 12 Aug, 2010. Web address: http://hwa.gov.au/about.
19. Health Workforce Australia, Simulated Learning Environments. Cited 12 Aug, 2010. Web address: http://hwa.gov.au/programs/clinical-training/simulated-learning-environments-sles.
20. Department of Human Services, Consultation Outcomes - A New Model of Clinical Placement Governance for Victoria, 2009. (Report prepared by Darcy Associates Consulting Services). Cited 23 Feb, 2010. Report available from: http://www.health.vic.gov.au/__data/assets/pdf_file/0008/359495/Final-report-Phase-II---revised-for-web.pdf.
21. Health Workforce Australia, HWA Progams. Cited 12 Aug, 2010. Web address: http://hwa.gov.au/programs.
22. Survey Monkey. Cited 15 Feb, 2010. Web address: http://www.surveymonkey.com/Default.aspx.
23. Bay Area Nursing Resource Centre, Bay Area Simulation Collaborative. Cited 20 Aug, 2010. Web address: http://www.bayareanrc.org/Default.aspx?alias=www.bayareanrc.org/RSC.