Embed Size (px)
Citation preview

Engineering Structures 130 (2017) 83–98
Contents lists available at ScienceDirect
Engineering Structures
journal homepage: www.elsevier .com/ locate /engstruct
Simplified reliability analysis of punching in reinforced concrete flat slabbuildings under accidental actions
http://dx.doi.org/10.1016/j.engstruct.2016.09.0610141-0296/Crown Copyright � 2016 Published by Elsevier Ltd.This is an open access article under the CC BY license (http://creativecommons.org/licenses/by/4.0/).
⇑ Corresponding author at: Faculty of Engineering and Physical Sciences, CivilEngineering C5, Guildford, Surrey GU2 7XH, UK.
E-mail address: [email protected] (J. Sagaseta).1 Current address: Tokyo Polytechnic University, Kanagawa, Japan.2 Formerly postdoc.
P. Olmati a,1, J. Sagaseta b,⇑, D. Cormie c, A.E.K. Jones c
aUniversity of Surrey, UK2
bDepartment of Civil and Environmental Engineering, University of Surrey, Guildford GU2 7XH, UKcArup, London W1T 4BQ, UK
a r t i c l e i n f o
Article history:Received 13 January 2016Revised 10 June 2016Accepted 27 September 2016
Keywords:PunchingFlat slabsReliability analysisProgressive collapseDynamic amplification factorFinite element analysisColumn failureFloor impactExplosion load
a b s t r a c t
Flat slab concrete buildings are widely found in infrastructure such as office and residential buildings orindustrial facilities. The susceptibility of progressive collapse of such structures due to accidental loads ishighly dependent on the structural performance of the slab-column connections. This paper presents aframework for a simplified reliability analysis and derivation of safety factors for computing the proba-bility of punching of flat slab concrete buildings subjected to accidental loads such as column removal,slab falling from above or blast load. The main advantage of the proposed approach is that it considersin a simple manner, the uncertainty in the gravity load applied in the slab before the accidental event,which affects the inertial effects and demand/capacity ratio in the slab-column connections. Eurocode2 and the Critical Shear Crack Theory for punching are used and extended to dynamic cases for the assess-ment of the demand/capacity ratio using computer-based time history finite element simulations. Theproposed reliability method is applied to a case study of an existing building showing that the columnremoval situation is not always critical whereas the slab falling from above is much more detrimental.Crown Copyright � 2016 Published by Elsevier Ltd. This is an open access article under the CC BY license
(http://creativecommons.org/licenses/by/4.0/).
1. Introduction
1.1. Progressive collapse of flat slab buildings
Concrete flat slab structures is a common form of structuralreinforced concrete (RC) construction in buildings, especially inmedium-rise offices due to their efficient span/depth ratios andthe economies gained by reducing the storey heights. A governingaspect in the design of RC flat slabs is the detailing of the slab-column connections in order to provide sufficient deformationand punching shear capacity of the slab at the connection. Struc-tural failures of flat slab buildings due to punching have beenreported in the past in America, Asia and Europe; some examplesare the Skyline Plaza Complex collapse in Virginia (1973), the Har-bour Cay building in Florida (1981), the Sampoong DepartmentStore collapse in South Korea (1995) and the Gretzenbach under-ground parking garage collapse in Switzerland (2004). The reasonsbehind these failures include deficiencies in design, errors during
execution and unforeseen actions; some of the causes mentionedare not unique to flat slab construction.
The main concern with flat slabs is that unless special measuresare adopted, the shear capacity at the column-slab connection islow after punching failure which can contribute to a horizontalpropagation of failure and subsequently the slab can fall onto thenext lower floor [1]. Moreover, the propagation of failure(horizontally and vertically) is influenced by dynamic effects whichcan significantly increase the shear demand in the slab-columnconnections. As pointed out by Vlassis et al. [2], modelling theconnection behaviour accurately is critical towards providingalternative load paths and achieving continuity and ductility inthe structure.
1.2. Design considerations
Commercial and residential buildings are generally notdesigned to withstand extreme loads since the occurrence of suchextreme events does not concern the life-cycle of the building dueto the low probability of occurrence. However, exceptional loadsdue to extreme events could lead to severe consequences in termsof structural integrity and socio-economic impact on the commu-nity [3]. The term ‘‘disproportionate collapse” is often used to refer

84 P. Olmati et al. / Engineering Structures 130 (2017) 83–98
to the disproportion between the scale of the event and the sever-ity of the consequences, although this term is subjective and it hasseveral definitions [4]. Extreme events can be caused by naturalhazards (hurricanes, tsunamis, flooding, earthquakes), accidents(vehicle impact, event during construction, industrial accidentand unexpected local failure due to fire or poor design) and mali-cious actions (terrorist attack).
The perception from the general public and stakeholders of therisk of having disproportional collapse of buildings has increasedsignificantly over the last two decades [5] and therefore robustness(insensitivity of the structure to local failure) must be verified inpractice according to most designing codes (e.g. CEN [6]; DoD[7]; GSA [8]); guidelines are also available for example Ellingwoodet al. [9], FEMA [10] or HSE [11]. In order to design against progres-sive collapse, prescriptive rules (indirect approaches) have beenavailable since soon after the Ronan Point failure in 1968. Directapproaches are becoming more easily accessible to designersalthough the behaviour of buildings subjected to exceptional loadsis still an under-researched area in structural engineering [12]. Thealternate load path method as described in DoD [7] is widely usedin practice to design buildings to withstand accidental loads. How-ever, the applicability of this approach depends on the form of con-struction used affecting the behaviour of the connections,alternative load path mechanisms and energy dissipation of thesystem.
1.3. Literature review and research significance
Different progressive collapse analyses have been suggested inthe past for steel frame buildings covering column removal andfalling debris cases (e.g. Vlassis et al. [2]; Szyniszewski andKrauthammer [13]). Similarly, research on RC structures has beencarried out predominately looking at beam-column frame struc-tures [14,15] under column removal and impact scenarios. Beam-column-slab concrete buildings were also investigated numericallyand experimentally by Helmy et al. [16] showing that the slabneeds to be considered in the analysis to obtain accurate results.
Research on progressive collapse of flat slab buildings (withoutbeams) is rather limited (e.g. Mitchell and Cook [17]; Utagawaet al. [18]; Qian and Bing [19]; Liu et al. [20,21]). Flat slabs provideenhanced structural continuity compared to frame structures.Moreover, the slabs are effective in providing alternative loadpaths due to the two-way bending and membrane actions[17,22–24]. However, flat slabs are prone to punching which is abrittle type of failure that should be controlled to arrest the pro-gressive collapse of the structure. Relevant studies of the residualshear strength of the connection after failure (post-punching beha-viour) were carried out by Melo and Regan [25] and FernándezRuiz et al. [26] amongst others. The residual strength of the slab-column connection can vary between 25% and 50% [1] and theresults are influenced by many factors such as anchorage or thepresence of integrity reinforcement in the compressive zone.
The progressive collapse of flat slab buildings is highly influ-enced by the inertial effects of the slab. This paper presents a sim-ple reliability approach for flat slab buildings which takes intoaccount the inertial effects and considers the uncertainty in thegravity load applied in the slab and the dynamic response of theslab-column connection. The proposed approach requirescomputer-based dynamic structural analyses (time history analy-sis for punching) to estimate the variation of punching demandand capacity at the connections. The punching capacity is esti-mated based on EN 1992 [27] and the Critical Shear Crack Theory(CSCT) by Muttoni [28] and Fernández Ruiz and Muttoni [29], withspecial considerations for dynamic loading (see Section 2). Threeextreme events are investigated in a case study, viz. columnremoval, falling slab from above and blast load. The proposed
approach focuses on the prediction of failure of the connectionsduring extreme events. The analysis of the propagation of the col-lapse is outside the scope of this paper; in such cases, system-based analyses are generally required considering the mechanismsthat develop before and after punching (e.g. [20,21,24]).
2. Punching shear time history analysis
In this work, time history analyses are carried out for theassessment of punching shear in flat slab buildings subjected todifferent damage scenarios. In these analyses, the punching sheardemand around the column is calculated numerically by meansof finite element (FE) models (non-linear dynamic). Both punchingshear demand and capacity are estimated at different time stepsusing design formulae for punching in EN 1992 [27] and the CSCT[28] which is the basis of the Model Code 2010 formulae for punch-ing [30]. The main difference between the two approaches indynamic situations is that the former assumes that the capacityis constant with time whereas the latter assumes that the capacityis a function of the slab rotation outside the column region w(t)which varies with time. In both approaches, the punching sheardemand VD(t) varies with time due to variations in the axial forcesand moments developed in the columns and slab during the forcedand free vibration phases.
2.1. Dynamic punching shear demand
Local damage in flat slab buildings can result in an increase inthe moment transfer in the column-slab connections (increase ineccentricity of the reaction at the column). An increase in momenttransfer will result in a higher concentration of shear forces in cer-tain segments of the control perimeter adopted in the punchingshear calculations which in turn results in a higher shear demand.This is taken into account in EN 1992 [27] by means of the eccen-tricity coefficient b(t) given by Eqs. (1) and (2) for internal andedge/corner columns respectively.
bðtÞ ¼ 1þ 1:8
ffiffiffiffiffiffiffiffiffiffiffiffiffiffiffiffiffiffiffiffiffiffiffiffiffiffiffiffiffiffiffiffiffiffiffiffiffiffiffiffiffiffiffiffieyðtÞbx
� �2
þ exðtÞby
� �2s
ð1Þ
bðtÞ ¼ uured
þ kauW1
eparðtÞ ð2Þ
where u is the basic control perimeter defined in EN 1992 [27] at adistance 2d from the column face, ex(t) and ey(t) are the eccentrici-ties in the two orthogonal directions of the slab, bx and by are thedimensions of the control perimeter corresponding to each direc-tion. Eq. (2) is for edge columns and it is reduced to its first termin case of corner columns; ured is the reduced control perimeteraccording to geometric conditions given in [27], ka and W1 are coef-ficients which depend on the dimensions of the column and of theeffective depth of the slab, and epar(t) is the eccentricity withrespect to the bending of the slab along the edge. The punchingshear stress demand vD(t) according to EN 1992 [27] is given byEq. (3).
vDðtÞ ¼ bðtÞVDðtÞud
ð3Þ
In the CSCT, the eccentricity effect is taken into account simi-larly using a reduction factor ke(t) given by Eq. (4) which multiplesthe basic control perimeter b0 to calculate the punching shearstress in Eq. (5). The basic control perimeter b0 in the CSCT is takenat a distance equal to 0.5d from the column face.
keðtÞ ¼ 11þ euðtÞ=bu
ð4Þ

P. Olmati et al. / Engineering Structures 130 (2017) 83–98 85
vDðtÞ ¼ VDðtÞkeðtÞb0d
ð5Þ
where bu is the diameter of the circle with the same surface as thesupport region inside the basic control perimeter and eu(t) is theload eccentricity with respect to the centroid of the basic controlperimeter. In Eqs. (1)–(5), the eccentricities are obtained from thebending moments at the columns given by the FE analysis justabove and below the slab-column connection in both orthogonaldirections; the punching shear demand around the column isobtained as the difference between the axial force in the columnabove and below the slab.
2.2. Dynamic punching shear capacity
2.2.1. EN 1992 formulae for punching capacityThe punching shear capacity VC,cs(t) is calculated at each time
step by adding the concrete contribution VC,c(t) and the steel con-tribution from the shear reinforcement VC,s(t). Eqs. (6) and (7) fromEN 1992 [27] were derived empirically from quasi-static loadingslab tests and therefore they are time independent.
VC;c ¼ CC;ckffiffiffiffiffiffiffiffiffiffiffiffiffiffiffiffi100qf c
3q
� ðudÞ ð6Þ
VC;cs ¼ 0:75VC;c þ VC;s ¼ 0:75VC;c þ 1:5dSr
� �Aswf yw;eff ð7Þ
in SI units, where CC,c = 0.18, k ¼ 1þffiffiffiffiffiffiffiffiffiffiffiffiffiffi200=d
p6 2 with d in mm, Sr is
the radial spacing between perimeters of shear reinforcement, Asw
is the area of one perimeter of shear reinforcement around the col-umn, and fyw,eff is the effective strength of the punching shear rein-forcement which is calculated as f yw;ef ¼ 250þ 0:25d 6 f yw. Partialfactors cc and cs were taken as 1. In Eq. (6), an additional term couldbe added according to EN 1992 which is a function of the normalstresses rcp (in-plane stress); favourable term (enhanced capacity)if in compression. This term could be used to consider potentialcapacity enhancement due to compressive membrane action. How-ever, up to date there is no accurate method available to estimatercp and in absence of a better approach, rcp is taken as zero in sub-sequent analysis. The effect of high strain-rates on material strengthis also neglected in EN 1992 formulae.
2.2.2. Critical Shear Crack Theory (CSCT)The main assumption in the CSCT is that the capacity is related
to the crack width and roughness of the critical shear crack. Thecrack width is proportional to the slab rotation outside the columnregion which varies over time w(t). The concrete VC,c(t) and steelcontributions VC,s(t) are expressed as a function of the slab rotationand therefore they vary over time. The method is given by the fol-lowing expressions
VC;cðtÞkeðtÞb0d
ffiffiffiffif c
p ¼ 0:751þ 15wðtÞ d
ðdg0þdgÞð8Þ
VC;sðtÞ ¼X
Asw � keðtÞrswðtÞ ð9Þ
rswðtÞ ¼ EswðtÞ6
1þ 3f yw
dUw
!6 f yw ð10Þ
VC;csðtÞ ¼ VC;cðtÞ þ VC;sðtÞ ð11Þwhere the shear and slab rotation w(t) are normally expressed asnormalized values: normalized shear V ¼ V=ðkeb0d
ffiffiffiffiffiffif cÞ
p(in
ffiffiffiffiffiffiffiffiffiffiMPa
p)
and the normalized slab rotation �w ¼ wd=ðdg þ dg0Þ. Parameter dgrefers to the maximum aggregate size where dg0 = 16 mm is the ref-erence size. Parameter
PAsw is the total area of shear reinforce-
ment within a conical surface with angle 45� from the support(zone limited by 0.35dv and dv from the face of the column). rsw
is the effective stress of the shear reinforcement (limited to theyield stress) which depends on the bond strength as shown in Eq.(10) which is written in terms of the Young’s modulus Es, bar diam-eter Uw and yield strength fyw.
The slab rotation outside the column region w(t) is estimatedfrom a flexural analysis. In this work, w(t) is estimated using FEanalysis due to the complexity of the problems investigated (i.e.irregular geometry and dynamic conditions). Analytical formulaeexist for w(t) for simple cases such as quasi-static loading withunrestraint internal/edge/corner columns [28]. In this work, theslab rotation obtained from FE models correspond to the directionof the maximum rotations (e.g. span of removed column). Morerefined approaches are available for non-symmetric cases consid-ering the slab rotations along both orthogonal directions [31],however considering the maximum rotation is more suitable fordesign purposes.
Eqs. (8)–(11) can be applied to dynamic situations as demon-strated by Micallef et al. [32] for impact loading. In such cases, highstrain-rates _e can result in a slight increase in punching shearcapacity; unless a more sophisticated analysis is carried out, it isdemonstrated that coefficient 0.75 in Eq. (8) can be replaced by0.8 for _e ¼ 10=s, 1.0 for _e ¼ 100=s and 1.3 for _e ¼ 300=s with lin-early interpolated values for intermediate cases. Numerical predic-tions of strain rates in this work suggest that the strain-rate,governing the velocity of the opening of the shear crack, were wellbelow 10/s; _e was around 0.02/s for the column removal, 0.04/s forfalling slab scenario and 0.06/s for blast load case. This suggeststhat the quasi-static capacity in Eq. (8) can be adopted in subse-quent analysis; furthermore this assumption is conservative andconsistent with [7] recommendations for column removal analysis.
2.3. Calculation of performance function and demand ratio at eachtime step
The performance function [33] or limit state equation Z(t) isintroduced to assess at each time step whether punching shearoccurs (i.e. Z(t) < 0). The demand and capacity are expressed asshear stresses in Eq. (12) using EN 1992 formulae whereas the nor-malized shear is used in the CSCT as shown in Eq. (13)
ZðtÞ ¼ vC;cs � vDðtÞ ð12Þ
ZðtÞ ¼ VC;csðtÞ � VDðtÞ ð13ÞIn order to compare both approaches with each other, the
demand ratio DR(t) is introduced which is the coefficient betweenthe demand and capacity as shown in Eqs. (14) and (15).
DREN 1992ðtÞ ¼ vDðtÞvC;cs
ð14Þ
DRCSCTðtÞ ¼ VDðtÞVC;csðtÞ
ð15Þ
Fig. 1 summarizes the flowcharts for the assessment of punch-ing shear at each time step using EN 1992 and CSCT approaches.The structural analyses in this work neglect any post-failure effectsin connections (post-punching behaviour) and therefore the algo-rithm shown in Fig. 1 is only valid for times t when DR is loweror equal to 1. For times after DR > 1, the stiffness of the slab-column connection would have to be re-assessed after failure toupdate the structural analysis. Such type of analysis would onlybe needed if the propagation of failure through the structure isto be assessed (e.g. [20,21,24]), which is not the main focus of thiswork. This work is primarily concerned with the probability of fail-
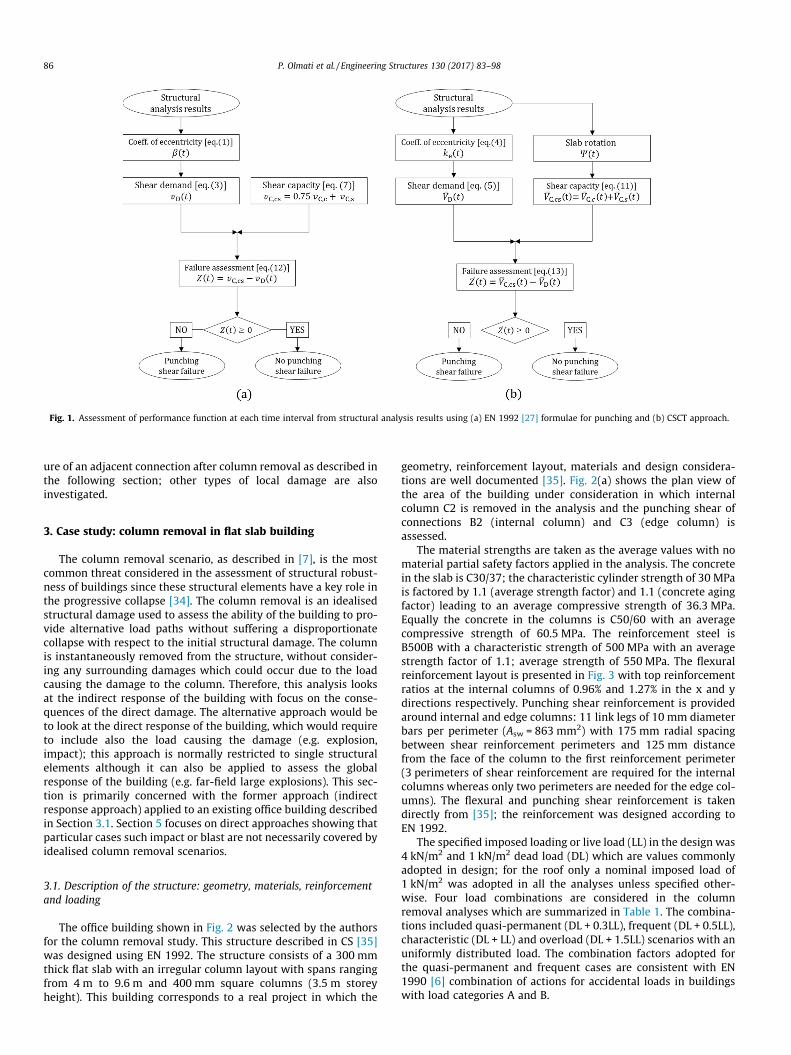
Fig. 1. Assessment of performance function at each time interval from structural analysis results using (a) EN 1992 [27] formulae for punching and (b) CSCT approach.
86 P. Olmati et al. / Engineering Structures 130 (2017) 83–98
ure of an adjacent connection after column removal as described inthe following section; other types of local damage are alsoinvestigated.
3. Case study: column removal in flat slab building
The column removal scenario, as described in [7], is the mostcommon threat considered in the assessment of structural robust-ness of buildings since these structural elements have a key role inthe progressive collapse [34]. The column removal is an idealisedstructural damage used to assess the ability of the building to pro-vide alternative load paths without suffering a disproportionatecollapse with respect to the initial structural damage. The columnis instantaneously removed from the structure, without consider-ing any surrounding damages which could occur due to the loadcausing the damage to the column. Therefore, this analysis looksat the indirect response of the building with focus on the conse-quences of the direct damage. The alternative approach would beto look at the direct response of the building, which would requireto include also the load causing the damage (e.g. explosion,impact); this approach is normally restricted to single structuralelements although it can also be applied to assess the globalresponse of the building (e.g. far-field large explosions). This sec-tion is primarily concerned with the former approach (indirectresponse approach) applied to an existing office building describedin Section 3.1. Section 5 focuses on direct approaches showing thatparticular cases such impact or blast are not necessarily covered byidealised column removal scenarios.
3.1. Description of the structure: geometry, materials, reinforcementand loading
The office building shown in Fig. 2 was selected by the authorsfor the column removal study. This structure described in CS [35]was designed using EN 1992. The structure consists of a 300 mmthick flat slab with an irregular column layout with spans rangingfrom 4 m to 9.6 m and 400 mm square columns (3.5 m storeyheight). This building corresponds to a real project in which the
geometry, reinforcement layout, materials and design considera-tions are well documented [35]. Fig. 2(a) shows the plan view ofthe area of the building under consideration in which internalcolumn C2 is removed in the analysis and the punching shear ofconnections B2 (internal column) and C3 (edge column) isassessed.
The material strengths are taken as the average values with nomaterial partial safety factors applied in the analysis. The concretein the slab is C30/37; the characteristic cylinder strength of 30 MPais factored by 1.1 (average strength factor) and 1.1 (concrete agingfactor) leading to an average compressive strength of 36.3 MPa.Equally the concrete in the columns is C50/60 with an averagecompressive strength of 60.5 MPa. The reinforcement steel isB500B with a characteristic strength of 500 MPa with an averagestrength factor of 1.1; average strength of 550 MPa. The flexuralreinforcement layout is presented in Fig. 3 with top reinforcementratios at the internal columns of 0.96% and 1.27% in the x and ydirections respectively. Punching shear reinforcement is providedaround internal and edge columns: 11 link legs of 10 mm diameterbars per perimeter (Asw = 863 mm2) with 175 mm radial spacingbetween shear reinforcement perimeters and 125 mm distancefrom the face of the column to the first reinforcement perimeter(3 perimeters of shear reinforcement are required for the internalcolumns whereas only two perimeters are needed for the edge col-umns). The flexural and punching shear reinforcement is takendirectly from [35]; the reinforcement was designed according toEN 1992.
The specified imposed loading or live load (LL) in the design was4 kN/m2 and 1 kN/m2 dead load (DL) which are values commonlyadopted in design; for the roof only a nominal imposed load of1 kN/m2 was adopted in all the analyses unless specified other-wise. Four load combinations are considered in the columnremoval analyses which are summarized in Table 1. The combina-tions included quasi-permanent (DL + 0.3LL), frequent (DL + 0.5LL),characteristic (DL + LL) and overload (DL + 1.5LL) scenarios with anuniformly distributed load. The combination factors adopted forthe quasi-permanent and frequent cases are consistent with EN1990 [6] combination of actions for accidental loads in buildingswith load categories A and B.

Fig. 2. Flat slab concrete building case study, adapted from CS [35]: (a) plan view of the office building (shaded area corresponds to area of study), (b) span layout of themodelled part of the structure.
Fig. 3. Layout of the flexural reinforcement, adapted from CS [35].
Table 1Considered load combinations.
Combination Loads Load value (kN/m2)
Quasi-permanent Dead + 0.3 Live 2.2Frequent Dead + 0.5 Live 3Characteristic Dead + Live 5Overload Dead + 1.5 Live 7
P. Olmati et al. / Engineering Structures 130 (2017) 83–98 87
3.2. FE modelling of the structure
A finite element model is developed for the area of study in theflat slab building described in Section 3.1. FE software package LS-Dyna� [36] is applied in which the structural analyses are carriedout in the time domain using an explicit algorithm to solve themotion equations considering material and geometric non-linearities. The flat slabs are modelled using Hughes-Liu shell ele-ments [36], as shown in Fig. 4. The shell finite elements used areessentially composite layered elements with concrete and steelreinforcement layers similar to that used by [13]. The columnsare modelled using a Belytschko-Schwer resultant beam elements[36] which are fully clamped at the foundation level and rigidly
connected to each floor taking into account the size of the column.In the analysis, the columns are assumed to be non-critical; theassessment of flexural mechanisms is focused to the slabs. Edges1 and 3 shown in Fig. 4(a) are free, whereas sides D and A representpoints of contra-flexure. Fig. 4(b) shows the different reinforce-ment areas in the FE model of the slab and the FE mesh in the col-umn and mid-span.
The constitutive material models adopted in the FE models takeinto account cracking and crushing of the concrete, as well as yield-ing, hardening and fracture of the reinforcement steel. The materialmodels are based on the uniaxial behaviour with plastic-strainrelationships. The concrete model adopted has a linear tensionsoftening based on the fracture energy Gf and the Mander et al.[37] model for compression. The concrete model also takes intoaccount the stiffness degradation due to cyclic loads (Young’s mod-ulus reduction).
The dead and live loads are applied in the FE model as massesuniformly distributed on the slab. In addition, concentrated massesare provided at the end edges (A and D in Fig. 4(a)). The gravityacceleration is introduced gradually over time using a ramp func-tion ending at 0.8 s. This is followed by the column removal in asingle time step (Dt � 10�6 s).
3.3. Numerical results obtained in the column removal scenario
3.3.1. Predictions of slab rotation & dynamic amplification factors(DAFs)
Firstly, a quasi-static FE analysis was carried out for the columnremoval scenario with the frequent load combination. The quasi-static analysis was used to check the FE model in the elastic rangebefore the column removal against the FE results obtained by [35].Both FE models provide similar values for the column reactions andbending moments in the slab. Moreover, in the non-linear range,the quasi-static FE analysis provided consistent results with sheardemand to rotation predictions from Model Code 2010 [30] usinglevel of approximation II (LoA II) with rs = 0.22Lx as shown inFig. 5(a); where rs is the distance from the column axis to the zeroradial moment and Lx is the span length. The reduction in slopeafter the column removal in the shear demand to rotation curveshown in Fig. 5(a) which is due to the residual spans, is capturedadequately by the LoA II expression by considering the change inspan Lx, i.e. rs = 0.22(2Lx).
Fig. 5(b) shows the slab rotation vs. shear demand obtained inthe FE dynamic analyses for the frequent and characteristic loadcombinations; the comparison with the FE quasi-static curve illus-

(a) (b)
1
2
3
AB
BbC
D
X YBA
2
H20 - 125 T1 (Y)H25 - 150 T2 (X)
X
Y
H20 - 125 T1 (Y)H16 - 150 T2 (X)H16 – 200 B1 (Y)H12 – 200 B2 (X)
H16 - 200 T1 (Y)H16 – 200 B1 (Y)H12 – 200 B2 (X)
H20 - 125 T1 (Y)H16 – 150 T2 (X)H16 – 200 B1 (Y)H12 – 200 B2 (X)
H20 - 150 T1 (Y)H16 – 150 T2 (X)H16 – 200 B1 (Y)H12 – 200 B2 (X)
Fig. 4. Finite element model of the building considered in the case study: (a) perspective view of the 3D model and (b) local mesh and reinforced areas of the slab betweentwo columns.
Fig. 5. Shear demand vs. slab rotation in column removal cases (a) quasi-static loading (effect of residual spans) and (b) dynamic FE analysis (influence of inertial effects).
88 P. Olmati et al. / Engineering Structures 130 (2017) 83–98
trates the dynamic amplification of the slab rotation and sheardemand. It is noteworthy in Fig. 5(b) that for high gravity loads(e.g. characteristic load), the inertial effects can result in a sheardemand to rotation relationship which is not too different fromthe quasi-static one prior to the column removal with originalspans (LoA II with rs = 0.22Lx).
The dynamic amplification factor (DAF = Xdynamic/Xstatic) is usedwhere X is the general structural response parameter. Fig. 6 showsthe DAF obtained corresponding to three parameters: (a) thedeflection at the removed column, (b) the slab rotation outsidethe column region and (c) the punching shear demand in the con-nection (DAFload). Fig. 6 shows the results for the internal columnB2 where the maximum DAF were 1.8 (slab rotation) and 1.36(DAFload). For the edge column C3, the maximum DAF were 1.64(slab rotation) and 1.33 (DAFload); all the results are summarizedin Table 2. The DAF for the maximum deformation at mid-spanwas 1.9 as shown in Fig. 6(a).
The DAFload obtained in this work was significantly lower thanthe theoretical value of 2.0 used in design which corresponds tothe worst case scenario derived from a linear elastic system withinstant removal and no damping. These differences are due to
the influence in the inertial effects of material non-linear beha-viour and damping. The values obtained for the DAFload are consis-tent with those obtained experimentally in slab tests with columnremoval with similar levels of loading [19,23]. In Fig. 6(c), theresidual DAFload is 1.0 as expected with a total increase of sheardemand of 70% between the quasi-static loading cases before andafter the column removal. This increase in loading is justified dueto the unequal spans in the slab and considerably larger con-tributable area of the removed column C2 compared to columnsB2 and C3.
3.3.2. Punching shear assessment: EN 1992 vs. CSCTThis section shows the results from the assessment of the per-
formance function and demand ratio in the column removal timehistory analysis following the approach in Fig. 1. The results arepresented for the characteristic load combination (Table 1). Firstly,the variation of the coefficient of eccentricity is obtained for inter-nal (B2) and edge (C3) columns. Fig. 7 shows the variation of coef-ficients b and ke over time obtained according to Section 2.1; thehorizontal dashed line represents the constant values recom-mended in EN 1992 and Model Code 2010 for internal and edge

(a) (b) (c)
0
10
20
30
40
50
0 1 2 3 4
Def
lect
ion
[mm
]
Time [sec]
DynamicStatic
DAF max. = 1.91DAF res. = 1.61
0
2
4
6
8
10
12
14
0 1 2 3 4Time [sec]
DynamicStatic
DAF max. = 1.80DAF res. = 1.43
Rot
atio
n [1
03ra
d]
0
200
400
600
800
1000
1200
1400
0 1 2 3 4
Shea
r [kN
]
Time [sec]
DynamicStatic
DAF max. = 1.36DAF res. = 1.00
Fig. 6. Dynamic amplification factors obtained (frequent load combination): (a) DAF for deflection at the removed column (C2), (b) DAF for the maximum slab rotationoutside internal column (B2), and (c) DAFload for column (B2).
Table 2DAFs obtained using the frequent slab load combination – internal and edge slab-column connections.
Deflection Connection Slab rotation Punching shear demand
Max. Res. Max. Res. Max. Res.
1.91 1.61 Internal (B2) 1.80 1.43 1.36 1Edge (C3) 1.64 1.36 1.33 1
(a) (b)
(c) (d)
0.95
1.05
1.15
1.25
1.35
0.5 1 1.5 2
β [-
]
time [sec]
β(t)β const.
column removal
1
1.1
1.2
1.3
1.4
1.5
0.5 1 1.5 2
β [-
]
time [sec]
β(t)β const.
column removal
0.8
0.85
0.9
0.95
1
1.05
0.5 1 1.5 2
Ke
[-]
time [sec]
Ke(t)Ke const.
column removal
0.5
0.55
0.6
0.65
0.7
0.75
0.5 1 1.5 2
Ke
[-]
time [sec]
Ke(t)Ke const.
column removal
Fig. 7. Eccentricity coefficients (characteristic load): (a) and (b) EN 1992 approach for internal and edge connection respectively; (c) and (d) CSCT approach for internal andedge connection respectively.
P. Olmati et al. / Engineering Structures 130 (2017) 83–98 89
columns with regular spans, which is only applicable prior to thecolumn removal. The column removal results in a sudden increaseof b (reduction of ke), reaching a peak value at around 1 s. This isfollowed by fluctuations during the free vibration phase. The
results for the internal column B2 show a larger variation in thecoefficient of eccentricity compared to edge columns.
The eccentricities obtained in the analysis are considerable butthey are within reasonable limits which are covered by existing
90 P. Olmati et al. / Engineering Structures 130 (2017) 83–98
experimental testing of isolated punching shear tests (e/bubetween 0 and 2 according to database from Tassinari [38]). There-fore the formulae adopted in this work are applicable to the caseinvestigated. For instance, internal column B2 develops eccentrici-ties of 75 mmwith e/bu = 0.05 (prior to column removal, due to thegeometry) and up to 240 mm with e/bu = 0.2 (after columnremoval, due to residual spans and dynamic effects).
Fig. 8 shows the punching shear demand and capacity for thecharacteristic load combination during the time history accordingto EN 1992 and CSCT; solid lines represent the total values whereasdashed lines represent the concrete and reinforcement contribu-tions separately. Points of intersection between VD and VC,cs curvesrepresent cases where punching shear is predicted to occur Z(t) = 0.Fig. 8 shows that according to both approaches, the internal col-umn B2 would fail due to punching soon after the column removal(0.2 s). A similar conclusion is obtained for edge column C3.
The comparison between both approaches is carried out usingthe DR factor. Fig. 9 shows the DR obtained using both approachesfor internal and edge columns B2 and C3 respectively. In all cases,DR reaches (or almost reaches) the value of 1.0 (i.e. punching fail-ure is predicted to occur). In addition, just before the columnremoval both EN 1992 and CSCT approaches give very similar val-ues of the DR for both internal and edge columns. For the internalcolumn, the results given by both approaches after the column fail-ure are also similar which suggests that for the levels of slab defor-mations achieved, the different assumptions made in eachapproach result in similar predictions. For edge columns, the CSCT
(a)
0.2
0.5
0.8
1.1
1.4
1.7
0.5 1 1.5 2
time [sec]
column removal
Fig. 8. Punching shear capacity and demand (characteristic load combination): (a) EN 19
Fig. 9. Demand ratio in time history analysis (characteristic load co
gives slightly larger values of DR. The slight differences in theresults for edge columns are somewhat expected since the beha-viour of edge connections is less understood than for internal col-umns and therefore larger differences exist between capacitymodels.
The results shown in Fig. 9 indicate that punching is likely tooccur after the column removal for the characteristic load combi-nation. However, the maximum demand capacity ratio is very closeto 1 in this case so the load and model uncertainties need to betaken into account to reach a more conclusive outcome. The max-imum demand capacity ratio is different for each load combinationconsidered, as shown in Fig. 10, where the maximum value of theDR is presented versus the total slab load. Fig. 10(a) and (b) showsthat prior to the column removal punching will not occur (DR < 1)even for overload combination (DL + 1.5LL). Fig. 10(c) and (d)shows the predictions after the column removal where punchingwould only occur (internal/edge columns) according to both meth-ods for loads greater than the frequent load combination. This sug-gests that the design of the structure is acceptable for accidentalloading according to EN 1990 [6] in which only quasi-permanentand frequent load combinations are considered. In order to refinethis assessment, a simplified reliability analysis is proposed in Sec-tion 4 considering the load uncertainty. Such analysis provides thereliability index and safety factor for different values of the proba-bility of failure which could be used by the designer. For the fol-lowing reliability analyses in this paper, only internal columnswill be discussed.
(b)
92 approach (constant capacity) and (b) CSCT approach (capacity varies with time).
mbination): (a) internal column (B2) and (b) edge column (C3).

Fig. 10. Max demand ratio DR vs. slab load – (a) prior-column removal (internal column), (b) prior-column removal (edge column), (c) post-column removal (internalcolumn) and (d) post-column removal (edge column).
P. Olmati et al. / Engineering Structures 130 (2017) 83–98 91
4. Proposed simplified reliability analysis for punching shear
4.1. Fundamental assumptions
The assessment of the performance function of structures sub-jected to extreme loads can be problematic using a probabilisticframework unless some assumptions are made. Probabilisticperformance-based design approaches have been proposed in thepast by Val et al. [39], Ciampoli et al. [40] and Olmati et al. [41].
In case of severe structural damages simulated by the alternateload path method [7], the cause leading the column failure isneglected and the structural response of the building is assessedlooking at the capacity of the structural elements to carry the over-load due to the column removal. In the alternate load path analysisof buildings, the epistemic uncertainties related to the capacitymodel used are small compared to the uncertainties in the loadconditions [41–43]. Therefore, the proposed simplified reliabilityanalysis of structures subjected to exceptional loads considersmainly the variability of the gravity load on the slab; uncertaintiesin the spatial load distribution are not taken into account. More-over, it is assumed that the occurrence of the load on the slab isnot correlated with the occurrence of the structural damage. Theobtained probability that the performance function is lower thanzero is conditioned to the occurrence of the exceptional load. Thealternate load path analysis is performed in a deterministic man-ner, as recommended by DoD [7]. In this context, Monte Carlo sim-ulations involving structural analysis are not required and only afew structural analyses are needed. This advantage is particularlyuseful in the analysis of building structures since the numericalmodels needed have a high CPU demand. This is a novel probabilis-tic design procedure that is suitable with the alternate load pathmethod that can be applied in the risk analysis of buildings at riskdue to severe structural damages. The proposed simplified reliabil-
ity method is a compromise in terms of complexity which can beuseful for design purposes; more sophisticated probabilisticapproaches (with added complexity) could be adopted in subse-quent analysis to obtain a more refined answer.
4.2. Proposed methodology
The proposed methodology consists of three main steps: (a) tocarry out a time history analysis of at least three load combinations(e.g. quasi-permanent, frequent and characteristic) to obtain theminimum value of Z for each case, (b) to estimate the probabilitydensity function PDF of the punching shear demand DPDF byperforming one Monte Carlo simulation and (c) to estimate theprobability of Z 6 0 by performing an additional Monte Carlo sim-ulation. The two Monte Carlo simulations do not involve any addi-tional structural analysis to those needed in step (a).
Fig. 11(a) summarizes all the intermediate steps requiredwithin the main steps (a, b, c). In step (a), the relationship betweenZ and D is assessed as well as the relationship between D and theslab load. In step (b), the slab load is assumed to follow a normaldistribution and therefore DPDF can be obtained from a Monte Carlosimulation. The response parameters (C, D, Z) can be linearizedwith respect to the slab load (see Section 4.4) and therefore itcan be assumed that they also follow a normal distribution. In step(c), two alternative approaches are available to obtain the probabil-ity of failure P½Z 6 0�, viz. directly from the PDF of Z according toEq. (16) and from the reliability index b obtained from the PDF ofC and D according to Eq. (17). Both approaches, which are summa-rized in Fig. 11(b), provide similar results.
P½Z 6 0� ¼Z 0
�1pðzÞdz ¼ Uð�bÞ ð16Þ
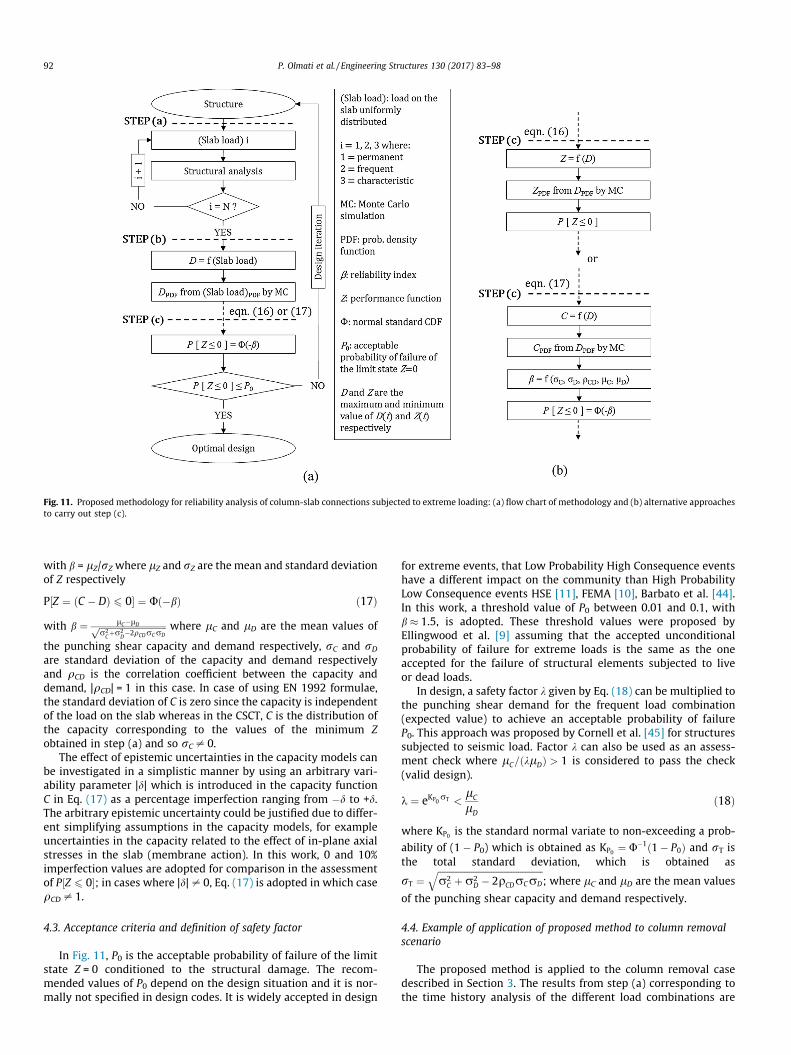
Fig. 11. Proposed methodology for reliability analysis of column-slab connections subjected to extreme loading: (a) flow chart of methodology and (b) alternative approachesto carry out step (c).
92 P. Olmati et al. / Engineering Structures 130 (2017) 83–98
with b = lZ/rZ where lZ and rZ are the mean and standard deviationof Z respectively
P½Z ¼ ðC � DÞ 6 0� ¼ Uð�bÞ ð17Þ
with b ¼ lC�lDffiffiffiffiffiffiffiffiffiffiffiffiffiffiffiffiffiffiffiffiffiffiffiffiffiffiffiffiffiffir2
Cþr2D�2qCDrCrD
p where lC and lD are the mean values of
the punching shear capacity and demand respectively, rC and rD
are standard deviation of the capacity and demand respectivelyand qCD is the correlation coefficient between the capacity anddemand, |qCD| = 1 in this case. In case of using EN 1992 formulae,the standard deviation of C is zero since the capacity is independentof the load on the slab whereas in the CSCT, C is the distribution ofthe capacity corresponding to the values of the minimum Zobtained in step (a) and so rC – 0.
The effect of epistemic uncertainties in the capacity models canbe investigated in a simplistic manner by using an arbitrary vari-ability parameter |d| which is introduced in the capacity functionC in Eq. (17) as a percentage imperfection ranging from �d to +d.The arbitrary epistemic uncertainty could be justified due to differ-ent simplifying assumptions in the capacity models, for exampleuncertainties in the capacity related to the effect of in-plane axialstresses in the slab (membrane action). In this work, 0 and 10%imperfection values are adopted for comparison in the assessmentof P½Z 6 0�; in cases where |d|– 0, Eq. (17) is adopted in which caseqCD – 1.
4.3. Acceptance criteria and definition of safety factor
In Fig. 11, P0 is the acceptable probability of failure of the limitstate Z = 0 conditioned to the structural damage. The recom-mended values of P0 depend on the design situation and it is nor-mally not specified in design codes. It is widely accepted in design
for extreme events, that Low Probability High Consequence eventshave a different impact on the community than High ProbabilityLow Consequence events HSE [11], FEMA [10], Barbato et al. [44].In this work, a threshold value of P0 between 0.01 and 0.1, withb � 1.5, is adopted. These threshold values were proposed byEllingwood et al. [9] assuming that the accepted unconditionalprobability of failure for extreme loads is the same as the oneaccepted for the failure of structural elements subjected to liveor dead loads.
In design, a safety factor k given by Eq. (18) can be multiplied tothe punching shear demand for the frequent load combination(expected value) to achieve an acceptable probability of failureP0. This approach was proposed by Cornell et al. [45] for structuressubjected to seismic load. Factor k can also be used as an assess-ment check where lC=ðklDÞ > 1 is considered to pass the check(valid design).
k ¼ eKP0rT <
lC
lDð18Þ
where KP0 is the standard normal variate to non-exceeding a prob-
ability of (1 � P0) which is obtained as KP0 ¼ U�1ð1� P0Þ and rT isthe total standard deviation, which is obtained as
rT ¼ffiffiffiffiffiffiffiffiffiffiffiffiffiffiffiffiffiffiffiffiffiffiffiffiffiffiffiffiffiffiffiffiffiffiffiffiffiffiffiffiffiffiffiffiffiffiffir2
C þr2D � 2qCDrCrD
q; where lC and lD are the mean values
of the punching shear capacity and demand respectively.
4.4. Example of application of proposed method to column removalscenario
The proposed method is applied to the column removal casedescribed in Section 3. The results from step (a) corresponding tothe time history analysis of the different load combinations are
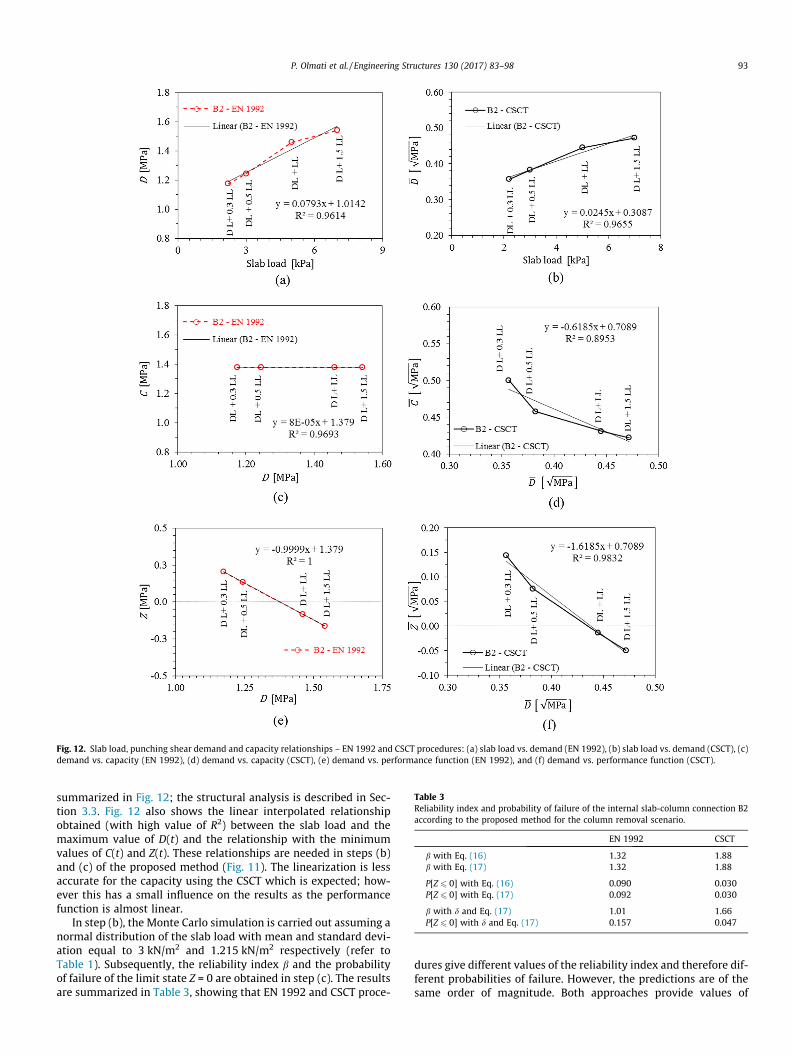
Fig. 12. Slab load, punching shear demand and capacity relationships – EN 1992 and CSCT procedures: (a) slab load vs. demand (EN 1992), (b) slab load vs. demand (CSCT), (c)demand vs. capacity (EN 1992), (d) demand vs. capacity (CSCT), (e) demand vs. performance function (EN 1992), and (f) demand vs. performance function (CSCT).
Table 3Reliability index and probability of failure of the internal slab-column connection B2according to the proposed method for the column removal scenario.
EN 1992 CSCT
b with Eq. (16) 1.32 1.88b with Eq. (17) 1.32 1.88
P[Z 6 0] with Eq. (16) 0.090 0.030P[Z 6 0] with Eq. (17) 0.092 0.030
b with d and Eq. (17) 1.01 1.66P[Z 6 0] with d and Eq. (17) 0.157 0.047
P. Olmati et al. / Engineering Structures 130 (2017) 83–98 93
summarized in Fig. 12; the structural analysis is described in Sec-tion 3.3. Fig. 12 also shows the linear interpolated relationshipobtained (with high value of R2) between the slab load and themaximum value of D(t) and the relationship with the minimumvalues of C(t) and Z(t). These relationships are needed in steps (b)and (c) of the proposed method (Fig. 11). The linearization is lessaccurate for the capacity using the CSCT which is expected; how-ever this has a small influence on the results as the performancefunction is almost linear.
In step (b), the Monte Carlo simulation is carried out assuming anormal distribution of the slab load with mean and standard devi-ation equal to 3 kN/m2 and 1.215 kN/m2 respectively (refer toTable 1). Subsequently, the reliability index b and the probabilityof failure of the limit state Z = 0 are obtained in step (c). The resultsare summarized in Table 3, showing that EN 1992 and CSCT proce-
dures give different values of the reliability index and therefore dif-ferent probabilities of failure. However, the predictions are of thesame order of magnitude. Both approaches provide values of

Contour of the falling slab
I
II
IIIIV
94 P. Olmati et al. / Engineering Structures 130 (2017) 83–98
P½Z 6 0� within the acceptable threshold range of P0 (0.01–0.1),although in the EN 1992, b is lower than 1.5.
Introducing the epistemic uncertainty in the capacity model dresults in a decrease in the reliability index (i.e. increaseP½Z 6 0�). Table 3 shows that considering an arbitrary value of10% in the capacity model uncertainty, gives an increased valueof P½Z 6 0� in the CSCT which is still below the threshold value.However, using the EN 1992 approach, P½Z 6 0� falls outside thethreshold range and further analysis would be required consider-ing the epistemic uncertainties in the capacity model.
Fig. 13 shows the safety factor k obtained for different values ofP0 using the EN 1992 and CSCT approaches. The results shown inFig. 13 are consistent with Table 3; k is larger for the EN 1992approach which reflects a larger dispersion in the capacity anddemand distributions leading to lower values of the reliabilityindex compared to the CSCT approach. Fig. 13(b) shows the valuesof lC=ðklDÞ used in the assessment check; it is shown that for therange of acceptable probabilities of failure 0.01–0.1, the designwould only be valid for the CSCT.
Fig. 14. Contour of falling slab (2nd floor), image adapted from CS [35].
Falling slab
Over 100 mm deflec�on
5. Further applications of proposed approach to alternativedamage scenarios
Alternative structural damage based scenarios can be consid-ered to the column removal scenario. Two scenarios are investi-gated in this section, viz. falling slab scenario and a detonationclose to the roof slab-column connection. The cause of theseextreme events is not of relevance in this study; the results fromthe time history analysis are summarized for both cases as wellas the results using the proposed reliability analysis.
D C Bb B A1
23
Fig. 15. FE model, portion of the second floor slab impacts the first floor slab(approximately 0.02 s after the first contact).
5.1. Falling slab scenario
The study of progressive collapse of floor systems in multi-storey buildings subject to impact from debris or falling slab fromabove have been investigated in the past by researchers such asVlassis et al. [2] for steel frame buildings. The shear demand inthe slab-column connections is expected to be severe due to thisevent, considering the relative mass of the falling slab. For exam-ple, considering a 3.5 m storey height, the falling slab reaches avelocity of 8.3 m/s before the impact and therefore for every squaremetre of a 300 mm thick slab would transmit a kinetic energy of25 kJ to the impacted slab. This energy estimation assumes a com-plete freefall which is an extreme case; in reality, a slower descentmight take place.
In this work, an arbitrary portion of the second floor slab isdropped (complete freefall) into the first floor slab as shown in
(a)
1.00
1.08
1.16
1.24
1.32
1.40
0 0.1 0.2 0.3 0.4
λ [-
]
B2 - CSCT
B2 - EC2
P0
Fig. 13. Safety factor k vs. P0 obtained using the EN 1992 and CSCT in internal column Bassessment check of structure.
Figs. 14 and 15. The occurrence of punching of the slab-columnconnections B2 is assessed for this extreme event for comparisonwith the other damage scenarios; column C2 has a similar sheardemand in this case. The arbitrary portion of the second floor slabis assumed to fail in three steps in order to induce some asymme-try in the impact. This assumption was adopted to obtain a morerealistic and critical damage scenario with higher load eccentrici-ties in the columns; assuming an idealised uniform vertical dropseems more suitable for design-based approaches. The variability
(b)
2: (a) factor k to be multiplied by the deterministic demand for design purposes, (b)

Fig. 16. Slab-column connection response for falling slab scenario (characteristicload combination).
P. Olmati et al. / Engineering Structures 130 (2017) 83–98 95
of the size of the falling slab was not taken into account in thisstudy. Fig. 14 shows the failing sequence of the falling slab; con-tour I fails initially around column C2 at the second floor whichis followed by the failure of sections II, III and IV at every 0.15 sintervals between each. The falling slab impacts the floor belowinitially around the centre of the bay defined by gridlines B-Cand 1–2 (Fig. 14).
Fig. 16 shows the development of the maximum slab rotationoutside column B2 against the shear demand in the connectionfor the characteristic load combination; the parabolic formulaLoA II in Model Code 2010 [30] provides reasonable predictionsof the shear demand to rotation relationship before the impact ataround V ¼ 0:2
ffiffiffiffiffiffiffiffiffiffiMPa
p. The predictions from the dynamic FE model
in Fig. 16 show a stiffer shear demand to rotation response afterthe impact due to inertial effects, which is consistent with impactbehaviour of RC slabs described by Micallef et al. [32]. Punching ispredicted to occur by the CSCT at a load near the flexural capacity
Table 4Maximum demand ratio for the falling slab and blast load scenarios.
Maximum DR Scenario and load combination Falling sl
EN 1992
Prior to the event (quasi-permanent load combination) 0.32After the event (quasi-permanent load combination) 1.26After the event (characteristic load combination) 1.28
(a)
0.2
0.5
0.8
1.1
1.4
1.7
2
1.7 1.8 1.9 2 2.1
time [sec]
slab impact
Fig. 17. Punching shear capacity and demand (characteristic load combination) for fallin
of the slab (Vflex) as shown in Fig. 16. The value of Vflex is estimatedusing the yield line method with a global mechanism in theimpacted bay in the y direction considering the top reinforcementin the column and mid-span sections and bottom reinforcement atmid-span.
Fig. 17 shows the demand vs. capacity curves obtained in thetime history analysis (characteristic load combination) for internalcolumn B2; a sudden reduction of the punching capacity isobtained according to the CSCT whereas the capacity is constantaccording to EN 1992. The demand clearly exceeds the capacitysoon after the slab impact according to both EN 1992 and CSCTapproaches; the results obtained show that this is the case forthe three main load combinations considered, even for the quasi-permanent load combination (Table 4). Similar results are obtainedfor internal column C2 which are not shown for conciseness.
The load variability is less relevant in this case due to the highdemand ratio obtained as punching is predicted to occur in mostcases of loading; DR reaches the value of 1 even in very unlikelyload scenarios of around 1 kN/m2 well below the quasi-permanent value. Therefore, in this case, the reliability analysisprovides very high values of P½Z 6 0� � 0:98 well above any accep-tance criteria; the assessment check for P0 = 0.1 would give valuesof lC=ðklDÞ equal to 0.67 well below 1.0. These results show thatthis damage scenario is critical and should be avoided in progres-sive collapses. This event can be mitigated to some extent by plac-ing integrity reinforcement in the slab-column connection to holdthe slab after punching failure [25].
5.2. Blast load scenario near column at the roof
A blast load scenario is considered in order to assess the suscep-tibility of slabs to punching around the connections in this case.This scenario consists of a detonation of 60 kg of TNT close to theroof slab-column connection B2 at 1 m stand-off distance abovethe slab; the exact position of the detonation is DX = 2.1 m,DY = 0 m and DZ = 1 m from column B2 (Fig. 2(b)). The stand-off
ab scenario Blast load scenario
CSCT EN 1992 CSCT
0.22 0.27 0.211.25 1.62 2.371.75 1.72 2.75
(b)
g slab scenario (internal column B2): (a) EN 1992 approach and (b) CSCT approach.

Fig. 18. Punching shear capacity and demand (characteristic load combination) for blast load scenario (internal roof connection B2): (a) EN 1992 approach and (b) CSCTapproach.
96 P. Olmati et al. / Engineering Structures 130 (2017) 83–98
distance is considered to be sufficient to avoid localized punchingin the slab below the detonation point. The nature and magnitudeof the close-in detonation considered is not relevant for the aim ofthis study.
The blast load is characterised as a pulse load with a suddenincrease of overpressure followed by an approximately lineardecay with time, until reaching a phase with negative pressureswhich is normally neglected for design purposes. The spatial distri-bution of the overpressures can be obtained numerically or usingsimplifying equations from the literature (e.g. Cormie et al. [46]).In this work, the blast demand was obtained using the numericaltool ConWep� in LS-Dyna� [36] which takes into account the timeand space variations of the load, as well as the radial blast propa-gation (angle of incidence and increasing stand-off distance). Con-Wep can provide reasonable values of the reflected blast pressuresfor close-in detonations with scale distances of around 0.25 m/kg1/3 as verified experimentally by Tyas et al. [47].
An additional dead and live load (distributed equivalent mass)were considered in the roof with an average value of 0.6 kN/m2
and standard deviation of 0.25 kN/m2. This imposed load repre-sents normal design values for roofs not accessible except for nor-mal maintenance and repair. The loads on the other floors areassumed to be equal to 5 kN/m2.
Fig. 18 shows the results from the time history analysis for thecharacteristic load combination using EN 1992 and CSCTapproaches. During the event, the punching shear demandincreases suddenly after the detonation which is then followedby a reduction to its initial values before the blast. The slab hasan impulsive behaviour in which the peak in the demand occurswell before the maximum deformations. The slab rotationincreases significantly after the blast with a reduction of the capac-ity according to CSCT (Fig. 18). The maximum normalized slabrotation �w is 0.16 at failure (Z ¼ 0) which is of similar magnitudeto the rotations obtained in other damage scenarios.
For the blast considered, the demand induced is high, even lar-ger than the falling slab case. The maximum demand ratio DRobtained for the given blast load is close to 2 using EN 1992 andCSCT (Table 4). DR is significantly higher than 1 even in thequasi-permanent load combination (i.e. the connection does notcomply with the load combinations defined by EN 1990 for acci-dental loading). Similarly to the falling slab case, the variabilityof the load in the slab seems less critical in terms of assessingP½Z 6 0�. In this case, step (c) in the reliability analysis (Fig. 11)seems unnecessary. It can be concluded that for the scale of theblast considered, emphasis should be made on the post-punchingresponse of the slab to prevent progressive collapse, rather thanpreventing local failure.
6. Conclusions
The susceptibility to progressive collapse of RC flat slab build-ings is highly dependent on the ability of slab-column connectionsto resist extreme loading. This paper investigates the structuralbehaviour of connections in flat slab buildings for three extremeevents: column removal, slab falling from above and blast load. Asimplified reliability approach is proposed to take into accountuncertainty in the gravity load in the slab. The main conclusionsare
1. The case study shows that prior to the extreme event, thedemand ratio obtained using EN 1992 and CSCT approachesare similar. After the extreme event, the capacity reduces signif-icantly with increasing slab rotation according to the CSCT,whereas the capacity remains constant using EN 1992 formulae.Despite this difference, both approaches provide similar valuesof the demand ratio after the column removal since the sheardemand to rotation response in the dynamic case, with highgravity loads and residual spans, can be similar to that in aquasi-static case with original span layout.
2. In the quasi-static column removal scenario with a frequentgravity load combination, an increase of 70% in the sheardemand was obtained in the adjacent column due to the irreg-ular geometry investigated. In addition, a load dynamic ampli-fication factor of 1.36 was obtained from the FE analysis. BothEN 1992 and CSCT confirmed that punching would only occurfor gravity loads larger than the frequent combination valuecloser to the characteristic value, which can be consideredacceptable according to EN 1990 design for accidental actions.This conclusion is consistent with the reliability studies.
3. In order to establish the probability of punching after columnremoval, the uncertainty in the gravity loads in the slab mustbe taken into account. The proposed reliability approach showsthat the column removal scenario is not always critical. In fact,the probability of punching after column removal consideringthe uncertainty in the gravity load is within acceptable limits(P½Z 6 0� 6 0:1Þ according to both EN 1992 and CSCT. It isshown that neglecting epistemic uncertainties of the capacitymodels is a reasonable assumption in most cases; further workis needed for edge columns.
4. Falling slab from above, which has been observed in flat slabfailures in the past, impose severe demand conditions to theslab-column connection. For the case investigated, the demandat the connection was near the flexural capacity for the charac-teristic load. The reliability analyses confirmed that the fallingslab case is more critical than the column removal case; the

P. Olmati et al. / Engineering Structures 130 (2017) 83–98 97
probability of punching due to this event is above threshold val-ues. This supports the use of integrity reinforcement and othertechniques to improve the post-punching behaviour of the con-nections to prevent progressive collapse.
5. The response of the slab in the blast load scenario is moreimpulsive compared to the column removal and falling slabscenarios, although the slab rotation outside the column atfailure is of similar magnitude. Similarly to the falling slabcase, the reliability approach showed that the connection isnot able to withstand the increase of shear demandand emphasis should be placed on the post-punchingresponse.
6. The falling slab and blast loading scenarios demonstrate thatanalyses considering the load causing the damage are alsoneeded in practice since the consequences might not be fullycovered using idealised column removal scenarios.
7. The variability in the gravity loads in the slab influences theinertial effects and demand capacity ratio of the slab-columnconnections after extreme events. The uncertainty in the loadapplied in the slab was found to have a less critical role in thefalling slab and blast load cases considered due to the highshear demand compared to the column removal scenario. How-ever, this might not be the case for other scenarios such as fall-ing debris with smaller mass or blasts with lower charges thanthe ones adopted herein.
Acknowledgments
This work is part of a research project financially supported bythe EPSRC Impact Acceleration Account held by the University ofSurrey (grant ref: EP/K503939); linked with a previous projectfunded by the Engineering and Physical Sciences Research Councilof the U.K. (grant ref: EP/K008153/1). Dr. Olmati is currently Inter-national Research Fellow (P-15786) of the Japan Society for thePromotion of Science (JSPS), Japan. Any opinions, findings, andconclusions or recommendations expressed in this article are thoseof the authors and do not necessarily reflect the views of the JSPS.The authors would also like to acknowledge project collaboratorsProf. Aurelio Muttoni and Miguel Fernández Ruiz from EPFL(Switzerland) for their feedback and technical discussions on thetopic.
References
[1] Regan PE. Behaviour of reinforced concrete flat slabs, Construction IndustryResearch and Information Association (CIRIA), Report 89; 1981. 89 pp.
[2] Vlassis AG, Izzudin BA, Nethercot DA. Progressive collapse of multi-storeybuildings due to failed floor impact. Eng Struct 2009;31:1522–34.
[3] Krauthammer T. Modern protective structures. New York: CRC Press, Taylor &Francis Group; 2008.
[4] Starossek U, Haberland M. Disproportionate collapse: terminology andprocedures. J Perform Constr Facil 2010;24(6):528. 528-519.
[5] Pidgeon N, O’Leary M. Man-made disasters: why technology and organizations(sometimes) fail. Saf Sci 2000;34:15–30.
[6] CEN Comité Européen de Normalisation. EN 1990: Eurocode – basis ofstructural design. Brussels, Belgium: CEN; 1990. p. 2002.
[7] DoD Department of Defense. Design of buildings to resist progressive collapse(UFC 4-023-03). Washington, DC: Unified Facilities Criteria; 2009.
[8] GSA General Services Administration. Progressive collapse analysis and designguidelines for new federal office buildings and major modernizationprojects. Washington, DC: Office of Chief Architect; 2000.
[9] Ellingwood BR, Smilowitz R, Dusenberry DO, Duthinh D, Carino NJ. Bestpractices for reducing the potential for progressive collapse inbuildings. Washington, DC: National Institute of Standards and Technology;2007.
[10] FEMA Federal Emergency Management Agency. Reference manual to mitigatepotential terrorist attacks against building. Risk management series.Washington, DC; 2003.
[11] HSE Health and Safety Executive. Reducing risks, protecting people, HSE’sdecision-making process. HSE Books; 2001.
[12] Mohamed OA. Progressive collapse of structures: annotated bibliography andcomparison of codes and standards. J Perform Constr Facil 2006;20(4):418–25.
[13] Szyniszewski S, Krauthammer T. Energy flow in progressive collapse of steelframed buildings. Eng Struct 2012;42:142–53.
[14] Abruzzo J, Matta A, Panariello G. Study of mitigation strategies for progressivecollapse of a reinforced concrete commercial building. J Perform Constr Facil2006;20(4):384–90.
[15] Kokot S, Anthoine A, Negro P, Solomos G. Static and dynamic analysis of areinforced concrete flat slab frame building for progressive collapse. Eng Struct2012;40:205–17.
[16] Helmy H, Salem H, Mourad S. Computer-aided assessment of progressivecollapse of reinforced concrete structures according to GSA code. J PerformConstr Facil 2013;27(5):529–39.
[17] Mitchell D, Cook WD. Preventing progressive collapse of slab structures. ASCE JStruct Eng 1984;110:1513–32.
[18] Utagawa N, Kondo I, Yoshida N, Itho N, Yoshida N. Simulation of demolition ofreinforced concrete buildings by controlled explosion. Comput-Aided CivInfrastruct Eng 1992;7(2):151–9.
[19] Qian K, Bing L. Experimental study of drop-panel effects on response ofreinforced concrete flat slabs after loss of corner column. ACI Struct J 2013;110(2):319–30.
[20] Liu J, Tian Y, Orton SL, Said AM. Resistance of flat-plate buildings againstprogressive collapse. I: Modelling of slab-column connections. J Struct Eng2015;141(12).
[21] Liu J, Tian Y, Orton SL, Said AM. Resistance of flat-plate buildings againstprogressive collapse. II: system response. J Struct Eng 2015;141(12).
[22] Dat PX, Hai TK. Membrane actions of RC slabs in mitigating progressivecollapse of building structures. Eng Struct 2013;55:107–15.
[23] Russell JM, Owen JS, Hajirasouliha I. Experimental investigation on thedynamic response of RC flat slabs after a sudden column loss. Eng Struct2015;99:28–41.
[24] Keyvani L, Sasani M, Mirzaei Y. Compressive membrane action in progressivecollapse resistance of RC plates. Eng Struct 2014;59:554–64.
[25] Melo GS, Regan PE. Post-punching resistance of connections between flat slabsand interior columns. Mag Concr Res 1998;50(4):319–27.
[26] Fernández Ruiz M, Mirzaei Y, Muttoni A. Post-punching behavior of flat slabs.ACI Struct J 2013;110(5):801–12.
[27] CEN Comité Européen de Normalisation. EN 1992-1-1: design of concretestructures – Part 1-1: general rules and rules for buildings. Brussels, Belgium:CEN; 2004.
[28] Muttoni A. Punching shear strength of reinforced concrete slabs withouttransverse reinforcement. ACI Struct J 2008;105(4):440–50.
[29] Fernández Ruiz M, Muttoni A. Applications of the critical shear crack theory topunching of R/C slabs with transverse reinforcement. ACI Struct J 2009;106(4):485–94.
[30] fib Fédération internationale du béton. fib Model code for concrete structures2010. Berlin: Ernst & Sohn; 2013. 434 p.
[31] Sagaseta J, Muttoni A, Fernández Ruiz M, Tassinari L. Non-axis-symmetricalpunching shear around internal columns of RC slabs without transversereinforcement. Mag Concr Res 2011;63(6):441–57.
[32] Micallef K, Sagaseta J, Fernández Ruiz M, Muttoni A. Assessing punching shearfailure in reinforced concrete flat slabs subjected to localised impact loading.Int J Impact Eng 2014;71:17–33.
[33] Schultz MT, Gouldby BP, Simm JD, Wibowo JL. Beyond the factor ofsafety: developing fragility curves to characterize system reliability ERDCSR-10-1, US. The United States Army Corps of Engineers: Engineer Researchand Development Center; 2010.
[34] Olmati P, Petrini F, Bontempi F. Numerical analyses for the structuralassessment of steel buildings under explosions. Struct Eng Mech 2013;45(6):803–19.
[35] CS Concrete Society. Guide to the design and construction of reinforcedconcrete flat slabs. Technical report 2007; no 64; 2007. 101 pp.
[36] LSTC Lawrence Software Technology Corporation. LS-DYNA theorymanual. Livermore, California: Livermore Software Technology Corporation;2012.
[37] Mander JB, Priestley MJN, Park R. Theoretical stress-strain model for confinedconcrete. J Struct Eng 1998;114:1804–26.
[38] Tassinari L. Poinçonnement non symétrique des dalles en béton armé. PhDthesis. École Polytechnique Fédérale de Lausanne, no 5030; 2011. 163 pp [inFrench].
[39] Val DV, Stewart MG, Melchers RE. Life-cycle performance of RC bridges:probabilistic approach. Comput-Aided Civ Infrastruct Eng 2000;15(1):14–25.
[40] Ciampoli M, Petrini F, Augusti G. Performance-based wind engineering:towards a general procedure. Struct Saf 2011;33(6):367–78.
[41] Olmati P, Petrini F, Gkoumas K. Fragility analysis for the performance-baseddesign of cladding wall panels subjected to blast load. Eng Struct2014;78:112–20.
[42] Fragiadakis M, Vamvatsikos D, Karlaftis MG, Lagaros ND, Papadrakakis M.Seismic assessment of structures and lifelines. J Sound Vib 2015;334:29–56.
[43] Olmati P, Trasborg P, Naito CJ, Bontempi F. Blast resistant design of precastreinforced concrete walls for strategic infrastructures under uncertainty. Int JCrit Infrastruct 2015;11(3):197–212.
[44] Barbato M, Petrini F, Unnikrishnan VU, Ciampoli M. Performance-basedhurricane engineering (PBHE) framework. Struct Saf 2013;45:24–35.

98 P. Olmati et al. / Engineering Structures 130 (2017) 83–98
[45] Cornell CA, Jalayer F, Hamburger RO, Foutch DA. Probabilistic basis for 2000sac federal emergency management agency steel moment frame guidelines. JStruct Eng 2008;128(4):526–33.
[46] Cormie D, Mays G, Smith P. Blast effects on buildings, 2nd ed.. London: ICEPublishing; 2012.
[47] Tyas A, Reay J, Warren JA, Rigby SE, Clarke SD, Fay SD, Pope DJ. Experimentalstudies of blast wave development and target loading from near-fieldspherical PETN explosive charges. In: 16th international symposium on 3the interaction of the effects of munitions with structures (ISIEMS), Florida,2015.