Embed Size (px)
Citation preview

HAL Id: hal-02094597https://hal.archives-ouvertes.fr/hal-02094597v2
Submitted on 25 Jun 2020
HAL is a multi-disciplinary open accessarchive for the deposit and dissemination of sci-entific research documents, whether they are pub-lished or not. The documents may come fromteaching and research institutions in France orabroad, or from public or private research centers.
L’archive ouverte pluridisciplinaire HAL, estdestinée au dépôt et à la diffusion de documentsscientifiques de niveau recherche, publiés ou non,émanant des établissements d’enseignement et derecherche français ou étrangers, des laboratoirespublics ou privés.
Simple ions control the elasticity of calcite gels viainterparticle forces
Teresa Liberto, Catherine Barentin, Jean Colombani, Anna Costa, DavideGardini, Maurizio Bellotto, Marie Le Merrer
To cite this version:Teresa Liberto, Catherine Barentin, Jean Colombani, Anna Costa, Davide Gardini, et al.. Simple ionscontrol the elasticity of calcite gels via interparticle forces. Journal of Colloid and Interface Science,Elsevier, 2019, 553, pp.280-288. �10.1016/j.jcis.2019.05.083�. �hal-02094597v2�

Simple ions control the elasticity of calcite gels via interparticle forces
Teresa Libertoa,b, Catherine Barentina,c,∗, Jean Colombania, Anna Costad, Davide Gardinid, Maurizio Bellottoe, MarieLe Merrera
aUniversité de Lyon, Université Claude Bernard Lyon 1, CNRS, Institut Lumière Matière, F-69622, VILLEURBANNE, FrancebCurrent address: Faculty of Civil Engineering, Vienna University of Technology, Adolf Blamauergasse 1-3, A-1030 Vienna, Austria.
cInstitut Universitaire de FrancedCNR-ISTEC, Institute of Science and Technology for Ceramics - National Research Council of Italy, Via Granarolo 64, I-48018 Faenza, RA, ItalyeDipartimento di Chimica, Materiali ed Ingegneria Chimica "G. Natta", Politecnico di Milano, Piazza Leonardo da Vinci 32, 20133 Milano, Italy
Abstract
Suspensions of calcite in water are employed in many industrial fields such as paper filling, pharmaceutics or heritageconservation. Whereas organics are generally used to tune the rheological properties of the paste, we also expectsimple ions to be able to control the suspension rheology via the interparticle forces. We have thus investigatedthe impact of calcium, sodium and hydroxide ions on the elasticity of a colloidal gel of nanocalcite. We confrontour macroscopic measurements to DLVO interaction potentials, based on chemical speciations and measurements ofthe zeta potential. Upon addition of calcium hydroxide, we observe a minimum in shear modulus, correlated to amaximum in the DLVO energy barrier, due to two competing effects: Calcium adsorption onto calcite surface risesthe zeta potential, while increasing salt concentration induces stronger electrostatic screening. We also demonstratethat the addition of sodium hydroxide completely screens the surface charge and leads to a more rigid paste. A secondimportant result is that carbonation of the calcite suspensions by the atmospheric CO2 leads to a convergent highelasticity of the colloidal gels, whatever their initial value, also well rationalized by DLVO theory and resulting froma decrease in zeta potential.
Keywords: Colloidal gel, Calcite, DLVO, Zeta potential
1. IntroductionCalcium carbonate, including its most stable poly-morph, calcite, is one of the most abundant mineral onEarth. It is found in limestone, chalk and marble, andhas been used for thousands of years as constructionmaterial. As a major constituent of rock reservoirs, itis also of crucial importance for oil recovery or CO2 se-questration [1]. Finally, ground or precipitated calciteparticles are used in various industries (cement, paper,etc.) as fillers or raw materials [2].
Related to these applications, rock-fracture [3], oildewetting [4] or flow of colloidal suspensions [5] aremacroscopic phenomena largely influenced by mineralsurfaces and their interactions through aqueous solu-tions. The solution physico-chemistry is influenced bythe solubility product of the solid phases, including cal-
∗Corresponding authorEmail address: [email protected]
(Catherine Barentin)
cium carbonate, which in turn modify surface proper-ties. For instance, calcium and carbonate sites present atthe calcite surface get hydrated respectively by the OH−
and H+ ions of the solution. They also form complexeswith, e.g. calcium and carbonate ions of the solution [6–8]. These so-called potential determining ions therebymodify the calcite surface charge and zeta potential [9].
To characterize surface forces between calcite planesimmersed in aqueous solutions, measurements based onatomic force microscopy [5, 10–12] and surface forceapparatus [13] have been undertaken in the recent years,but no consensus has emerged yet on the nature of dom-inant interactions between calcite surfaces. These in-teractions are for example not easily described by theclassical Derjaguin-Landau-Verwey-Overbeek (DLVO)model [14]. In particular, nanometric-range repulsionshave been evidenced [10, 11] and attributed to the so-called repulsive secondary hydration forces originat-ing from the compression and dehydration of hydratedcounterions in the vicinity of the solid surfaces [15].However, experimentally, the reactivity-induced rough-
Preprint submitted to Journal of Colloid and Interface Science May 24, 2019

ening of the calcite surface can also lead to an apparentrepulsion [13, 16] and discriminating between the twoeffects is challenging. Besides, additional non-DLVOattractive forces induced by ion-ion correlation are sus-pected to play a role in calcite surface interactions [12].
A different approach to investigate mineral interac-tions is to study the mechanical responses of mineralsuspensions as a function of the physico-chemical con-ditions. The link between microscopic interactions andrheological properties of dense suspensions has indeedbeen investigated both theoretically [17–20] and experi-mentally [21–29]. In particular, previous works focusedon the relation between the yield stress σy and the zetapotential ζ [17–20, 25–29] in the limit of small electro-static repulsion.
In this study, we investigate the interactions betweencalcium carbonate surfaces in aqueous solutions by per-forming macroscopic elasticity measurements of sus-pensions of calcite colloids, combined with zeta poten-tial measurements and chemical speciation calculations.Due to the specific shape and size of our calcite col-loids, the pure calcite paste behaves as a typical col-loidal fractal gel [30], revealing attractive interactionsbetween particles. By adding specific ions such as cal-cium, it is possible to increase efficiently the electro-static repulsion, beyond the small repulsion regime. Byvarying the solution physico-chemistry of this reactivesuspension (i.e. ionic strength and ions content), wego from strongly attractive to almost repulsive systems.Nevertheless, all suspensions have an elastic-like behav-ior, spanning two orders of magnitude in shear mod-ulus. We show a direct correlation between the pasteelastic modulus and the DLVO energy barrier, which isnot only tuned by the zeta potential but also by the De-bye length, hence the ionic strength which is here variedfrom 1 to 100 mM. We thereby obtain hints on the inter-action forces at play at the microscopic scale betweencalcium carbonate particles in an aqueous environment.
More precisely, we have investigated how the addi-tion of calcium hydroxide (Ca(OH)2) or sodium hydrox-ide (NaOH) to the calcite suspension modifies its me-chanical properties. Calcium hydroxide has been cho-sen because calcium is a potential-determining ion ofcalcium carbonate [5, 31–34] inducing an increase ofthe positive zeta potential. On the contrary, sodium hy-droxide lowers the ζ potential. Regarding rheologicalproperties, we have focused on elastic modulus mea-surements and followed continuously the evolution ofthe paste with time.
Our first main result is that carbonation of the pasteby the atmospheric CO2 leads to a convergent highrigidity of the pastes, whatever their initial value. Our
second main result is that the initial elasticity of thecalcite suspension exhibits a non-monotonous behav-ior with the concentration of calcium hydroxide, dueto a crossover between two competing effects: cal-cium adsorption rises the zeta potential while increasingsalt concentration induces higher electrostatic screen-ing. Oppositely, the addition of sodium hydroxidestrongly decreases the electrostatic repulsion and in-creases the elastic modulus.
2. Materials and Methods
2.1. Sample preparation
We use Socal 31 calcite powder (from Solvay, nowavailable from Imerys) with an average particle diam-eter of 70 nm, a density of 2710 kg/m3 and a specificsurface area of 17 m2/g. The calcite particles are facetedas shown on the TEM image (Fig.1). To obtain a calcitesuspension, the powder is homogeneously dispersed invarious solutions using a vortex stirrer (Ultra TurraxTD300) at a mixing rate of 5800 rpm for 5 minutes. Theinitial calcite volume concentration is fixed to φ = 10 %.To investigate the effects of simple ionic additives, wedisperse calcium hydroxide Ca(OH)2 (concentration cranging from 3 to 50 mM) or sodium hydroxide NaOH(concentration 94 mM) in deionized water. Both chem-icals are from Sigma Aldrich.
As we found that the addition of 3 mM of Ca(OH)2 todeionized water increases the pH of the initial solutionup to 8, avoiding an initial calcite dissolution, 3 mM isthe smallest studied concentration of Ca(OH)2. More-over, we added this quantity of Ca(OH)2 to the one con-taining NaOH.
For all the samples, pH values are measured with apH-meter (Mettler-Toledo or Hanna Edge), right afterthe beginning of the rheological test. The reproducibil-ity range of the pH values is ±0.2.
2.2. Rheological measurements
In order to investigate the role of ionic additives on theshear elastic modulus of the calcite pastes, we use thefollowing protocol. The measurements are performedwith a stress-controlled rotational rheometer (AntonPaar MCR 301) in a plate-plate geometry at room tem-perature. The upper and lower plate diameters are 36and 64 mm, respectively. The gap width is fixed at 1 mmand the plates are covered with sand paper (roughness46 µm) in the aim to make slippage at the wall negli-gible [30]. The measurements consist in two steps. A
2

Figure 1: TEM images of pure calcite powder showing plane surfaces(facets). The scale bar is equal to 20 nm. Image acquired at 120 kV.
first pre-shear step consists in a 1 minute imposed shearrate of γ = 10 s−1, in order to start from comparableinitial conditions for each sample. We then apply a con-stant deformation of γ = 0.01 % at frequency f = 1 Hzduring 10 h, for which we measure the temporal evolu-tion of the storage modulus G′(t) of the sample. Theimposed deformation is small enough to remain in thelinear regime [30]. In particular, we extract the initialvalue of the linear storage modulus G′(0). During allmeasurements, we maintain the sample in a moisturechamber. It prevents the calcite paste from drying butdoes not insulate it totally from the atmosphere.
2.3. DLVO calculation
To characterize the strength of inter-particle interac-tions, we use the classical Derjaguin-Landau-Verwey-Overbeek theory [14]. In this model, the interactionpotential is the combination of two contributions: Vander Waals attraction and repulsion arising from the elec-trical double layer. As the studied particles have ananometer-range size, they exhibit crystalline facets, asshown in Fig. 1. Therefore, the interaction betweenparticles is considered here to proceed between paral-lel planes.
In this geometry and in the Debye-Hückel approxi-mation, the DLVO potential per unit area reads:
W = −A
12πx2 +2ελDζ2 exp(−x/λD) (1)
with x the distance between surfaces, A the Hamakerconstant, ε the water permittivity, λD the Debye lengthand ζ the zeta potential. The Van der Waals attrac-tion is proportional to the Hamaker constant A, equalto 1.44 · 10−20 J ≈ 3.6 kBT for the calcite-water-calcite
system [35] and is inversely proportional to the distancesquared. The electrostatic repulsion has been calculatedin the Debye-Hückel limit corresponding to small elec-trical potentials compared to kBT/e = 25 mV. In thislimit, the repulsion varies as the square of the zeta po-tential ζ, its range being given by the Debye length λD.
The competition between these two terms can lead toa non-monotonic potential profile as shown in Fig. 5.Attraction will be observed if the energy barrier is ofthe order or smaller than thermal agitation: Wmax .kBT/a2.
In order to calculate the repulsive term we need toknow both ζ and λD. The zeta potential can be measureddirectly on the paste as detailed in the following section.The Debye length is given by:
λD =
√εkBT2e2I
(2)
where I is the ionic strength, defined as I =∑n
i=1 ciz2i /2
with ci and zi the concentration and valence of allspecies in solution. The ionic strength is calculatedfrom the chemical speciation of calcite suspensions, asexplained in Section 2.5.
2.4. ζ potential measurements
Zeta potential measurements are carried out directly onthe concentrated calcite suspensions at φ = 10% with anelectroacoustic technique [36, 37] by using a ZetaProbeinstrument (DT-310 Dispersion Technology). The ultra-sound wave generated by the ZetaProbe dipped in thesuspension creates a pressure gradient that, in turn, gen-erates an electrical current (Colloidal Vibration Current,CVI) detected by the probe itself. The electrical sig-nal is converted into electrophoretic mobility and thenin zeta potential according to the Smoluchowski model.Input parameters are the density (0.997 g/cm3), viscos-ity (0.890 mPa s) and relative permittivity (78.85) ofthe liquid medium (water) and the density of calciumcarbonate. The particle size was set below 300 nm.The measurements have been repeated three times foreach sample. The dispersion between these measure-ments is lower than 1%. For the pure calcite, andthe samples with concentrations of 30 and 50 mM ofcalcium hydroxide, two different samples were tested.The two measurements were reproducible with preci-sion less than 1.5 mV.
3

2.5. Chemical speciation
In order to quantify the ionic strength, the last unknownvalue in the DLVO calculation, the full ionic composi-tion of the suspending fluid is calculated with the speci-ation freeware Visual MINTEQ [38].
2.5.1. Calcite equilibrium reactions
The carbonate equilibria depend strongly on the pHand on the dissolved carbon dioxide. For pH above10, dissolved CO2 is mostly in the form of carbonateCO2−
3 and for pH below 10 in the form of bicarbonateHCO−3 . Moreover, calcite once dissolved in waterproduces several chemical species such as: H2CO3(carbonic acid), HCO−3 , CO2−
3 , Ca2+, CaHCO+3 , CaOH+,
Ca(OH)2(aq) and CaCO3(aq) involved in the followingreactions [39]:
(a) CaCO3(s) CaCO3(aq), Ka = 10−5.09
(b) CaCO3(aq) Ca2+ + CO2−3 , Kb = 10−3.25
(c) CO2−3 + H2O HCO−3 + OH−,
Kc = 10−3.67
(d) HCO−3 + H2O H2CO3 + OH−,Kd = 10−7.65
(e) H2CO3 CO2(g) + H2O, Ke = 101.47
( f ) Ca2+ + HCO−3 CaHCO+3 , K f = 100.82
(g) CaHCO+3 H+ + CaCO3(aq),
Kg = 10−7.90
(h) Ca2+ + OH− CaOH+, Kh = 101.40
(i) CaOH+ + OH− Ca(OH)2(aq),Ki = 101.37
( j) Ca(OH)2(aq) Ca(OH)2(s), K j = 102.45
In particular, the calcite dissolution is describedby reactions (a) and (b), the carbonate equilibria by re-actions (c) to (e) and the calcium hydroxide dissolutionby reactions (h) to ( j).
Note that in our experiments we add calcium hydrox-ide up to 50 mM. The solubility limit of solid calciumhydroxide is around 20 mM [40]. Above this value,there initially remains some solid calcium hydroxideCa(OH)2(s), also called portlandite.
The above reactions can be recast to describe thecarbonation of portlandite, i.e. its transformation intocalcite
(k) Ca(OH)2(s) + CO2(g) CaCO3(s) + H2O,Kk = 1013
This implies that the transformation of solid port-landite to solid calcite is thus favored as long as
the activity of CO2 in the air aCO2 is larger thanK−1
k = 10−13, which is the case for atmospheric carbondioxide (aCO2 = 0.00038).
Once portlandite is totally dissolved, further dissolu-tion of CO2 from the atmosphere leads to a pH decrease—reactions (c) to (e)— while the carbonate ions reactwith calcium to precipitate as calcite —reactions (a) and(b).
2.5.2. Procedure for chemical speciation
The chemical composition of our ionic solutions at equi-librium with calcite is calculated with the speciationsoftware Visual MINTEQ [38] using the following pro-cedure.
For all systems, calcite is imposed as an infinite solidphase. Calcium hydroxide is incorporated by one ofthe two following equivalent procedures. We can spec-ify the corresponding concentrations of calcium and hy-droxide ions, and add portlandite as possible solid phaseto allow Ca(OH)2 to precipitate. Equivalently, we canincorporate portlandite directly as finite solid phase.
Then CO2 is inserted as CO2−3 component (input) in
order to obtain the pH measured experimentally rangingfrom 9 to 13, signature of the degree of advancement ofthe carbonation reaction (k) in our sample. MINTEQthen calculates the ionic concentrations to satisfy theabove chemical equilibria (a) to ( j), water dissociationas well as charge balance. Imposing the CO2 pressureat an intermediate value between 0 and the atmosphericpressure is also possible and yields equivalent results.
3. Results
3.1. Time variation of shear elasticity
Fig. 2 shows the temporal evolution of the elastic stor-age modulus G′(t) for a sample containing c = 50 mMof calcium hydroxide. We observe that G′ increaseswith time by two orders of magnitude within a fewhours. Given the physico-chemistry of aqueous solu-tions containing calcite, we suspect that this temporalevolution is the consequence of the dissolution of at-mospheric CO2 (reaction (e)), which modifies the solu-tion physico-chemistry. To test this hypothesis, we per-formed the same experiment but surrounded the shearedsample with paraffin oil, as sketched in the inset of Fig.2, in order to limit the contact with air. We indeed ob-serve that the sample with paraffin oil exhibits a slowertime evolution of the storage modulus, with a final valueat least one order of magnitude lower than the one of the
4
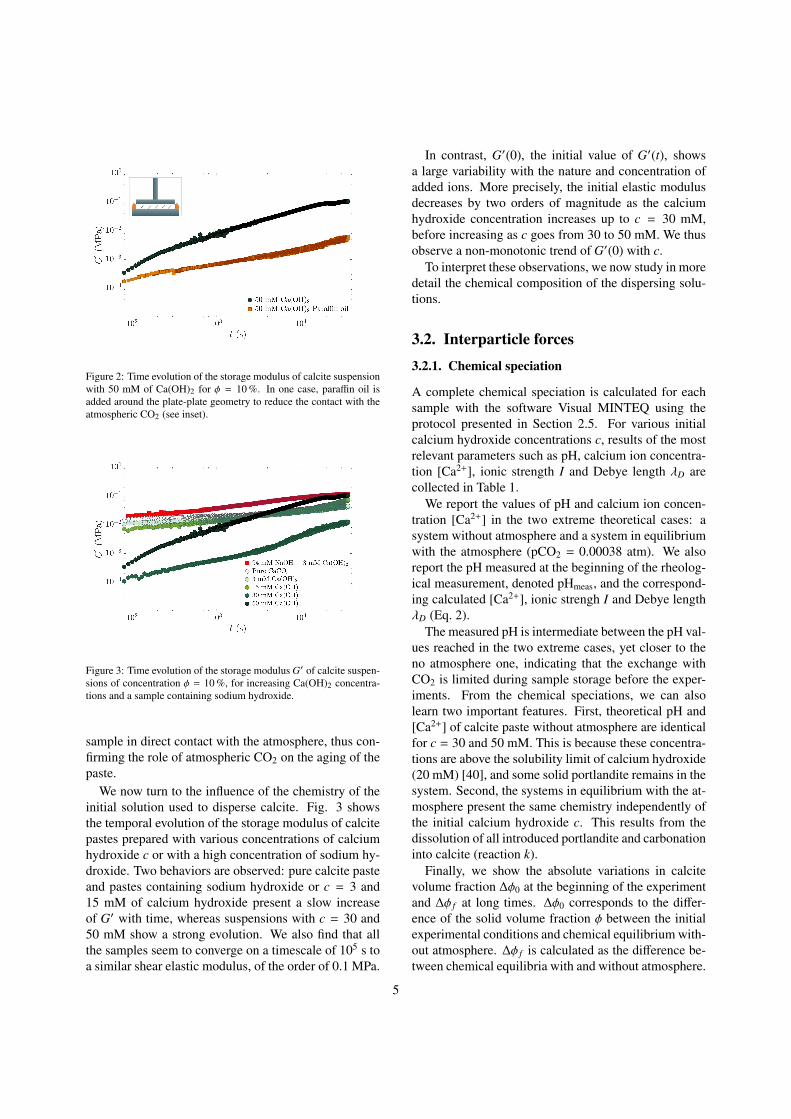
Figure 2: Time evolution of the storage modulus of calcite suspensionwith 50 mM of Ca(OH)2 for φ = 10 %. In one case, paraffin oil isadded around the plate-plate geometry to reduce the contact with theatmospheric CO2 (see inset).
Figure 3: Time evolution of the storage modulus G′ of calcite suspen-sions of concentration φ = 10 %, for increasing Ca(OH)2 concentra-tions and a sample containing sodium hydroxide.
sample in direct contact with the atmosphere, thus con-firming the role of atmospheric CO2 on the aging of thepaste.
We now turn to the influence of the chemistry of theinitial solution used to disperse calcite. Fig. 3 showsthe temporal evolution of the storage modulus of calcitepastes prepared with various concentrations of calciumhydroxide c or with a high concentration of sodium hy-droxide. Two behaviors are observed: pure calcite pasteand pastes containing sodium hydroxide or c = 3 and15 mM of calcium hydroxide present a slow increaseof G′ with time, whereas suspensions with c = 30 and50 mM show a strong evolution. We also find that allthe samples seem to converge on a timescale of 105 s toa similar shear elastic modulus, of the order of 0.1 MPa.
In contrast, G′(0), the initial value of G′(t), showsa large variability with the nature and concentration ofadded ions. More precisely, the initial elastic modulusdecreases by two orders of magnitude as the calciumhydroxide concentration increases up to c = 30 mM,before increasing as c goes from 30 to 50 mM. We thusobserve a non-monotonic trend of G′(0) with c.
To interpret these observations, we now study in moredetail the chemical composition of the dispersing solu-tions.
3.2. Interparticle forces
3.2.1. Chemical speciation
A complete chemical speciation is calculated for eachsample with the software Visual MINTEQ using theprotocol presented in Section 2.5. For various initialcalcium hydroxide concentrations c, results of the mostrelevant parameters such as pH, calcium ion concentra-tion [Ca2+], ionic strength I and Debye length λD arecollected in Table 1.
We report the values of pH and calcium ion concen-tration [Ca2+] in the two extreme theoretical cases: asystem without atmosphere and a system in equilibriumwith the atmosphere (pCO2 = 0.00038 atm). We alsoreport the pH measured at the beginning of the rheolog-ical measurement, denoted pHmeas, and the correspond-ing calculated [Ca2+], ionic strengh I and Debye lengthλD (Eq. 2).
The measured pH is intermediate between the pH val-ues reached in the two extreme cases, yet closer to theno atmosphere one, indicating that the exchange withCO2 is limited during sample storage before the exper-iments. From the chemical speciations, we can alsolearn two important features. First, theoretical pH and[Ca2+] of calcite paste without atmosphere are identicalfor c = 30 and 50 mM. This is because these concentra-tions are above the solubility limit of calcium hydroxide(20 mM) [40], and some solid portlandite remains in thesystem. Second, the systems in equilibrium with the at-mosphere present the same chemistry independently ofthe initial calcium hydroxide c. This results from thedissolution of all introduced portlandite and carbonationinto calcite (reaction k).
Finally, we show the absolute variations in calcitevolume fraction ∆φ0 at the beginning of the experimentand ∆φ f at long times. ∆φ0 corresponds to the differ-ence of the solid volume fraction φ between the initialexperimental conditions and chemical equilibrium with-out atmosphere. ∆φ f is calculated as the difference be-tween chemical equilibria with and without atmosphere.
5

No atmosphere Atmospheric pressure Initial experimental condition Calcite vol% changec (mM) pH [Ca2+] (mM) pH [Ca2+] (mM) pHmeas [Ca2+] (mM) I (mM) λD (nm) ∆φ0 (%) ∆φ f (%)
0 9.9 0.12 8.2 0.51 8.9 0.24 0.73 11.1 -0.01 0.93 11.7 2.8 8.2 0.51 10.3 0.15 0.47 13.8 0.1 1.0
15 12.4 11.8 8.2 0.51 11.0 0.55 1.7 7.3 0.5 1.430 12.4 14.2 8.2 0.51 11.8 3.3 10.2 3.0 1.0 1.850 12.4 14.2 8.2 0.51 12.4 13.0 43.2 1.4 1.1 2.4
Table 1: MINTEQ chemical speciation for φ = 10 % samples and increasing initial Ca(OH)2 concentration c. Values of pH and calcium ionconcentration [Ca2+] are reported for the two extreme theoretical cases (system without atmosphere and in equilibrium with the atmosphere) andfor our experimental conditions. ∆φ0 (resp. ∆φ f ) is the variation in calcite volume fraction between the system at the initial experimental condition(resp. at equilibrium with atmosphere) and without atmosphere. ∆φ < 0 correspond to dissolution and ∆φ > 0 to precipitation. The symbol pHmeas(respectively pH) corresponds to the measured (respectively calculated) pH.
∆φ < 0 (respectively ∆φ > 0) corresponds to a dis-solution (resp. precipitation) of calcite. We find thatcalcite precipitation occurs in all samples, except forthe pure calcite one, where limited dissolution initiallytakes place.
For the sample containing sodium hydroxide NaOH,the experimental chemical composition deduced frompHmeas = 12.7 is: [Ca2+] = 1.8 · 10−3 mM, I = 90 mMand λD = 1 nm.
3.2.2. Zeta potential measurements
In Fig. 4, zeta potential values are plotted as a functionof the corresponding Ca2+ concentration in the initialsuspending solution. The calcium concentration is de-duced from the speciation calculation knowing the ex-perimental pH and increases with the initial calcium hy-droxide concentration c.
We observe that the zeta potential, initially positive,increases, then saturates with the concentration ofcalcium ions. This confirms that calcium is a potentialdetermining ion for calcite [31, 32], as it adsorbspreferentially on the calcite surface [5].
3.2.3. DLVO calculations
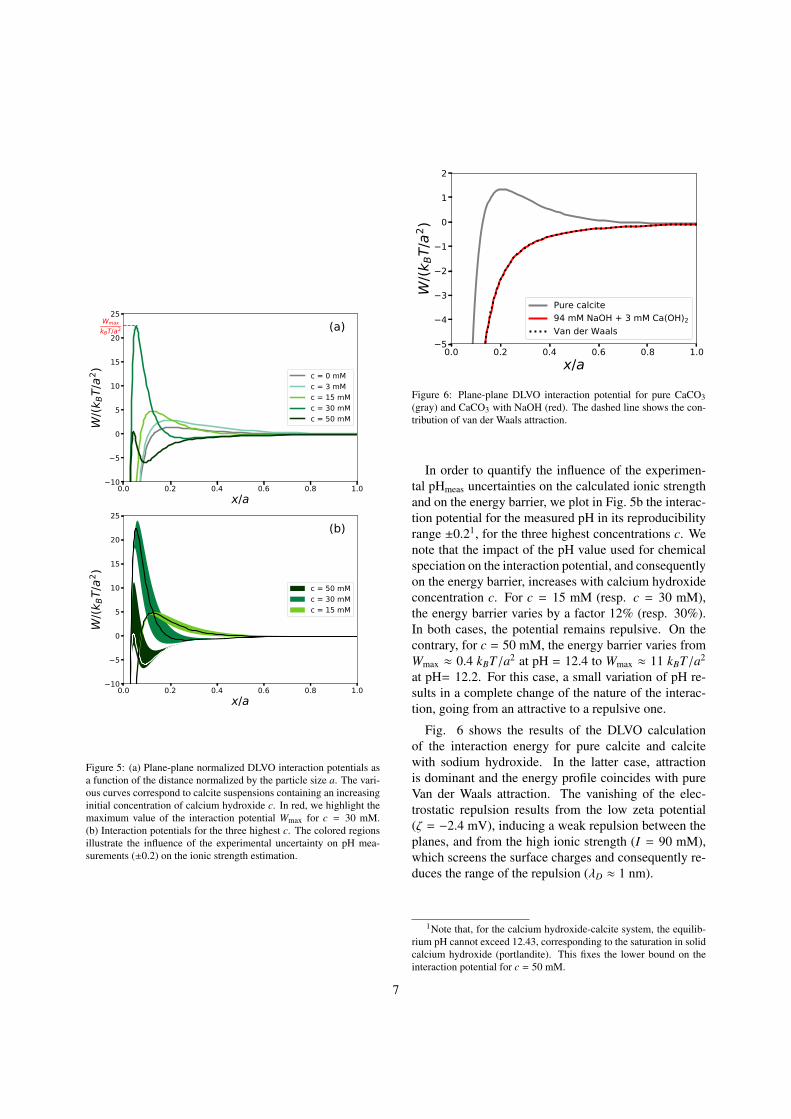
Once known the ionic strength, from the chemical spe-ciation, and the zeta potential, we calculate the DLVOinteraction potential between two infinite calcite planes.Fig. 5a shows the interaction potential per unit area asa function of the interparticle distance, calculated forvarious values of the initial calcium hydroxide concen-tration c.
For pure calcite the potential is weakly attractive witha barrier of the order of kBT/a2. Increasing c, the re-pulsion barrier increases to around 22 kBT/a2 for c =
30 mM, then drops down to 0.4 kBT/a2 for c = 50 mM,exhibiting a non-monotonic behavior.
10 1 100 101 102
[Ca2 + ] (mM)0.0
2.5
5.0
7.5
10.0
12.5
15.0
17.5
20.0
(mV)
CaCO3 + Ca(OH)2Pure CaCO3
10 1 100 101
[Ca2 + ] (mM)
100
101
102
I (m
M)
Figure 4: Zeta potential ζ as a function of the initial concentra-tion of calcium ions [Ca2+] deduced from the speciation calculation(Table 1). The calcium content is modified by changing the initialCa(OH)2 concentration c. Horizontal error bars result from the exper-imental uncertainty in pH measurements. Vertical error bars shownfor c = 0, 30 and 50 mM correspond to the reproducibility of ζ mea-surements. Inset: ionic strength I as a function of [Ca2+], calculatedfrom chemical speciation.
6
0.0 0.2 0.4 0.6 0.8 1.0x/a
10
5
0
5
10
15
20
25
W/(k
BT/
a2 )
Wmax
kBT/a2 (a)
c = 0 mMc = 3 mMc = 15 mMc = 30 mMc = 50 mM
0.0 0.2 0.4 0.6 0.8 1.0x/a
10
5
0
5
10
15
20
25
W/(k
BT/
a2 )
(b)
c = 50 mMc = 30 mMc = 15 mM
Figure 5: (a) Plane-plane normalized DLVO interaction potentials asa function of the distance normalized by the particle size a. The vari-ous curves correspond to calcite suspensions containing an increasinginitial concentration of calcium hydroxide c. In red, we highlight themaximum value of the interaction potential Wmax for c = 30 mM.(b) Interaction potentials for the three highest c. The colored regionsillustrate the influence of the experimental uncertainty on pH mea-surements (±0.2) on the ionic strength estimation.
0.0 0.2 0.4 0.6 0.8 1.0x/a
5
4
3
2
1
0
1
2
W/(k
BT/
a2 )
Pure calcite94 mM NaOH + 3 mM Ca(OH)2Van der Waals
Figure 6: Plane-plane DLVO interaction potential for pure CaCO3(gray) and CaCO3 with NaOH (red). The dashed line shows the con-tribution of van der Waals attraction.
In order to quantify the influence of the experimen-tal pHmeas uncertainties on the calculated ionic strengthand on the energy barrier, we plot in Fig. 5b the interac-tion potential for the measured pH in its reproducibilityrange ±0.21, for the three highest concentrations c. Wenote that the impact of the pH value used for chemicalspeciation on the interaction potential, and consequentlyon the energy barrier, increases with calcium hydroxideconcentration c. For c = 15 mM (resp. c = 30 mM),the energy barrier varies by a factor 12% (resp. 30%).In both cases, the potential remains repulsive. On thecontrary, for c = 50 mM, the energy barrier varies fromWmax ≈ 0.4 kBT/a2 at pH = 12.4 to Wmax ≈ 11 kBT/a2
at pH= 12.2. For this case, a small variation of pH re-sults in a complete change of the nature of the interac-tion, going from an attractive to a repulsive one.
Fig. 6 shows the results of the DLVO calculationof the interaction energy for pure calcite and calcitewith sodium hydroxide. In the latter case, attractionis dominant and the energy profile coincides with pureVan der Waals attraction. The vanishing of the elec-trostatic repulsion results from the low zeta potential(ζ = −2.4 mV), inducing a weak repulsion between theplanes, and from the high ionic strength (I = 90 mM),which screens the surface charges and consequently re-duces the range of the repulsion (λD ≈ 1 nm).
1Note that, for the calcium hydroxide-calcite system, the equilib-rium pH cannot exceed 12.43, corresponding to the saturation in solidcalcium hydroxide (portlandite). This fixes the lower bound on theinteraction potential for c = 50 mM.
7

c (mM) [Ca2+] (mM) [CO2−3 ] (mM) [HCO−3 ] (mM)
0 0.24 1.8 · 10−2 4.2 · 10−1
3 0.15 2.8 · 10−2 2.7 · 10−2
15 0.55 8.7 · 10−3 1.6 · 10−3
30 3.3 2.3 · 10−3 5.8 · 10−5
50 13.0 1.1 · 10−3 5.5 · 10−6
Table 2: Concentrations of potential determining ions obtained byMINTEQ chemical speciation at the experimental conditions, with in-creasing Ca(OH)2 concentration c.
4. Discussion
4.1. Zeta potential
Calcium Ca2+ and carbonate CO2−3 are known as poten-
tial determining ions of calcite [9]. Calcite surface sitesare predominantly in their hydrated forms >CaOH−(1−x)
and >CO3H+(1−x) with x ≈ 0.25 [8, 41]. Potential de-termining ions form complexes with these surface sites,and thereby modify the overall surface charge and po-tential. At high calcium concentrations, its surface com-plexation is expected to be favored, leading to a zeta po-tential increase. On the contrary, increasing carbonateconcentrations should lead to a decrease in zeta poten-tial.
We observe in Fig. 4 that ζ indeed increases with[Ca2+], as more positively charged calcium ions adsorbon the surface. For [Ca2+] > 3 mM, we observe thatζ saturates. This behavior and the order of magnitudeof the measured potentials are consistent with previousmeasurements on calcite particles [5].
We also observe that the zeta potential of pure cal-cite is slightly lower than the one measured with cal-cium hydroxide. This can be attributed to the role ofthe potential determining anions CO2−
3 and HCO−3 . Thecorresponding concentrations are presented in Table 2.For pure calcite, the main anion is HCO−3 , which com-plexes onto calcite (although more weakly than carbon-ate CO2−
3 [8, 41]) and thereby makes ζ decrease. In allthe solutions containing calcium hydroxide, the mainanion is no more bicarbonate but hydroxide, which isnot a potential determining ion, and therefore does notaffect the ζ potential.
Finally, in the sample with sodium hydroxide, thepositive charge of Na+ ions (86 mM) is balanced withthe negative ions: OH− (52 mM), CO2−
3 (13 mM)and NaCO−3 (8 mM). The negative potential determin-ing ion CO2−
3 is much more concentrated than calcium(1.8 · 10−3 mM). In the same time, sodium ions Na+
also (weakly) bind to negatively charged surface sites[8, 41]. This results in a slightly negative value of
ζ = −2.4 mV.
4.2. Validity of Poisson-Boltzmann ap-proach
The elastic behavior of our calcite paste, observed atsmall volume fraction, down to 5% [30], suggests thatattraction between calcite particles is significant andleads to the formation of a gel. The question we haveto answer is the origin of the attraction. For chemi-cally identical colloids, Van der Waals interaction in-duces attraction between colloids independently of theion concentration, ion valence or particle surface charge[14]. For highly charged colloids or polyelectrolytes inpresence of multivalent ions, correlations of ion fluctu-ations along the surfaces can lead to attraction [42–47].As it derives from fluctuations, this attraction cannotbe described by mean-field Poisson-Boltzmann theory.Moreover it is enhanced by ions valence and surfacecharge [44, 45]. The importance of these two quanti-ties on the validity of the Poisson-Boltzmann theory hasbeen quantitatively evaluated by Netz et al. using thenon-dimensional parameter Σ defined by [48, 49]:
Σ = 2πz3σs`2B
where z is the ion valence, lB the Bjerrum length definedas `B = e2/(4πεkBT ) and σs the charge number perunit area (called charge density in the following). ForΣ < 1, ion-ion correlations are negligible and Poisson-Boltzmann theory is valid [49]. However, for Σ = 2 orhigher values, ion-ion correlations start to be importantand it is necessary to go beyond the mean-field theory.In our calcite paste, the highest valence is z = 2 andthe Bjerrum length is `B = 0.7 nm. The most delicateparameter to estimate is the charge density σs of the cal-cite particle. We estimate it from the zeta potential as:
σs ' εζ/(eλD)
This relation between the potential and the charge den-sity is obtained using Poisson-Boltzmann theory. Forpure calcite paste, ζ = 10 mV, λD = 10 nm, sothat σs = 5 × 10⁻³ charges/nm2 corresponding to onecharge every 10 nm2. Note that this charge density isvery small compared to systems such as ADN or viruspolyelectrolites [42, 43] (typically 1 charge every nm2)where ion-ion correlations are the dominant phenom-ena at small distances. Using this value, we find thatthe non-dimensional parameter is Σ = 0.12, i.e., oneorder of magnitude smaller than the limit Σ = 1, un-derlying the relevance of the Poisson-Boltzmann the-
8

ory that we used in our study. However, estimating thesurface charge density from the zeta potential is ques-tionable due to ion condensation onto the surface [50].This approach can indeed underestimate the real sur-face charge [47, 51, 52]. Combining experimental re-sults and Monte-Carlo simulations, Labbez et al. [52]studied in detail the impact of ion condensation on thereal charge density of calcium silicate hydrates and theyshowed that the surface charge can be underestimated atmost by a factor 6. If we take this factor into account, wefind a non-dimensional parameter Σ = 0.7 still smallerthan 1. We therefore conclude that ion-ion correlationsare not the relevant phenomena in our calcite paste andthat van der Waals interactions are at the origin of the at-traction between calcite particle. This contrasts with re-cent AFM measurements suggesting a significant role ofion-ion correlations on interaction forces between cal-cite surfaces [12].
4.3. Elastic modulus versus DLVO poten-tial
4.3.1. Small repulsion regime
In Fig. 3, we observe that the initial storage modulus ofthe fresh paste G′(0) shows a minimum for the samplecontaining c = 30 mM of Ca(OH)2.
To interpret these data, we first turn to the celebratedmodels of Shih et al. [19] and Flatt & Bowen [20], bothrelating the interparticle force and suspension structureto the mechanical properties of the paste. These twomodels predict that the elastic modulus decreases lin-early with ζ2/λD. In our experiments, both ζ and λDchange with the concentration c of calcium hydroxide,and the combined changes of both factors could lead tothe non-monotonicity of G′(0) with c seen in Fig. 3.
Fig. 7 shows the evolution of G′(0) with ζ2/λD. Weimmediately see that these models are unable to explainthe behavior of our paste. As shown in the inset ofFig. 7, only the first three points —calcite with NaOH,pure calcite, calcite with 3 mM Ca(OH)2— decreaselinearly with ζ2/λD. For higher values of ζ2/λD, G′(0)shows a non-linear variation.
In fact, this linear relation is valid only for sys-tems showing small interparticle repulsion and logicallyfails for strongly repulsive systems —c = 15, 30 and50 mM— appealing for a more complete modelizationof the relation between rheological parameters and in-terparticle forces [53].
Figure 7: Initial storage modulus G′(0) as function of ζ2/λD. Allsuspensions are collected, in particular calcite with NaOH (square),pure calcite (diamond) and calcite with Ca(OH)2 (dots). In the insetis reported the linear fit of the first three points with the interactionmodel predictions by Shih et al. (1999) [19].
4.3.2. Energy barrier
In order to go beyond the linear regime of small elec-trostatic repulsion, we use the DLVO computations de-veloped in Section 3.2.3. These calculations make useof the zeta potential values of our suspensions, repre-sented as a function of [Ca2+] in Fig. 4, and of its ionicstrength I (inset), from which the Debye length is de-duced. Both ζ and I increase with the calcium ion con-centration but their effect on the DLVO potential is op-posite. The former enhances the electrostatic repulsionwhereas the latter increases the electrostatic screening.The consequent DLVO potential results from a trade-off
between both. To estimate the change of interaction na-ture with the calcium hydroxide concentration, we havecomputed the value of the DLVO potential maximumWmax against [Ca2+], as shown in Fig. 8b. Its evolu-tion is strongly non linear, with a sharp maximum at[Ca2+] ' 4 mM. The initial elastic modulus of the pastein the same [Ca2+] range is presented in Fig. 8a. Thesedata correspond to additional measurements at variousc in the range 0-50 mM.
The evolution of interaction potential and mechanicalproperty are seen to be strongly correlated: The weakerthe attraction, the softer the gel. The G′(0) minimumand Wmax maximum match perfectly at [Ca2+] ≈ 4 mM.Below this value, the ζ potential dominates, and makesthe repulsion increase with the calcium ion concentra-tion. Above this threshold, the surface charge screen-ing by the Debye layer preponderates and induces a de-crease of the repulsion with the calcium ion concen-
9

CO2 uptake
Figure 8: (a) Initial storage modulus G′(0) as a function of the initialcalcium ion concentration [Ca2+]. The different data points corre-spond to various c shown by the colorscale. (b) Wmax/(kBT/a2) as afunction of [Ca2+]. The dots correspond to actual measurements ofζ while the continuous line is interpolated (see Fig. 4). Error barsshow the influence of the measured pH uncertainty (±0.2) on bothWmax/(kBT/a2) and [Ca2+]. The dashed line is a guide for the eye.
tration. This strong agreement between the evolutionof the microscopic interactions and their macroscopiccounterpart demonstrates that simple ions added to acalcite paste with a millimolar concentration affect sub-stantially its inter-particle interaction, which modifiesits initial rigidity by orders of magnitude.
4.3.3. Role of particle geometry
We have computed the DLVO potential between par-ticles considering the interaction between plane sur-faces. However, the nanometric grains have rhomboe-dral shapes, therefore they may also interact in edge-facet or vertex-facet configurations. Using Derjaguinapproximation in cylinder-plane and sphere-plane ge-ometries, we have computed the corresponding DLVOpotentials. We find that, for the most repulsive sys-tem (c = 30 mM), the maximum repulsion, compared
to plane-plane, is 10 times smaller for edge-plane, and100 times smaller for vertex-plane. Therefore, whilefacets strongly repulse each other, particles can attachvia their vertices and form a percolated network, i.e. agel. As this attraction is very sensitive to the particle ori-entation, it could explain the very small value of criticalstrain that we have measured on calcite paste [30].
As shown in Table 1, the calcite grains experiencegrowth or, in the case of the pure suspension, dissolu-tion. Whereas these phenomena generally induce anincrease of the material roughness [54], which in turnis seen to enhance the repulsion between calcite grains[13, 16], this is not the case here, all the investigatedsystems converging toward a similar modulus (cf. Fig.3). We attribute this absence of effect to the fact thatthe size of our grains (70 nm) is below the longitudinallengthscale of the growth-induced roughening (∼ 1 µm)[55].
4.4. Paste aging
4.4.1. Long-term equilibration
Whatever the initial Ca(OH)2 concentration, the elasticmodulus of all the pastes converges toward the valueof the pure calcite paste in the long run. Therefore theuptake of atmospheric CO2 by the suspension cancelsprogressively the effect of the dissolved portlandite.
This neutralization can be understood via the equilib-rium equations introduced in Section 2.5. The CO2 ab-sorption induces pH decrease and calcite precipitation—reactions (a) to (e)—, which in turn leads to a [Ca2+]reduction.
The [Ca2+] decrease —as soon as its value goes be-low 4 mM— causes a stiffening of the paste, as illus-trated in Fig. 8a. As detailed in the previous section, thisgain in rigidity finds its origin in the fall of the interpar-ticle repulsion, originating in the ζ potential reduction,consequence of the lower amount of adsorbed calcium.
In the same time, the calcite solid volume fractionincreases due to precipitation. However, the observedevolution of G′ is not primarily due to this increase: Forpure calcite, G′ increases by a factor 5, while for c =
30 mM, G′ increases by two orders of magnitude. Forboth samples, the variation in solid volume fraction arecomparable (∆φ f − ∆φ0 ≈ 1%).
The steady state values of G′ for all initial portlanditeconcentration are expected to be very close, comparableto the elastic modulus of a pure calcite paste at pH 8.2,in equilibrium with the atmosphere. A small dispersionis expected due to differences in final solid volume frac-tion [30].
10

4.4.2. Kinetics for carbonation
The timescale for the paste stiffening is ruled by theinterplay of CO2 diffusion in air, dissolution of port-landite, precipitation of calcite, and diffusion of ionicspecies in solution, all other phenomena being faster orabsent in our conditions [56].
The geometry of the paste sample in the rheome-ter is a flat cylinder of height h = 1 mm and radiusR = 18 mm, in contact with the atmosphere at the edges.Diffusion in air is very fast, of the order of 105 m2/s, soa steady diffusive profile of CO2 sets in contact with thepaste outer surface after 0.1 s.
For c ≥ 20 mM, portlandite dissolves. Assum-ing its specific area as s = 20 m2/g, knowing theorder of magnitude of its dissolution rate k1 = 20 ·10−6 mol/m2/s [57], we estimate its timescale of disso-lution as 1/(k1Ms) ≈ 20 s (with M = 74 g/mol its molarmass).
Estimating the maximum amount of available cal-cium as cmax ≈ 20 mM, we evaluate the timescale ofcalcite precipitation from the order of magnitude of itsprecipitation rate k0 = 10−6 mol/m2/s [58] and fromits surface area per unit volume S = 5 · 103 m2/L ascmax/(k0S ) ≈ 4 s.
Finally, ions and molecules diffuse in the whole cylin-der on a timescale R2/D ∼ 3 ·105 s, with D = 10−9 m2/s.
Based on these orders of magnitude, we can assumethat the carbonation kinetics is limited by the diffusionof the species in the suspension. Indeed the observedtimescale for the paste stiffening is of the order of 105 s,similar to the timescale of the diffusion of moleculesand ions in the cylinder.
5. Conclusion
We have shown in this study how calcium hydroxidemodifies significantly the mechanical behavior of a cal-cite paste. Indeed, the initial elastic modulus of thesuspension exhibits a minimum with the calcium ionconcentration, resulting from the Ca(OH)2 introduction,two orders of magnitude lower than the modulus of thepure calcite paste. This non-monotonic behaviour stemsfrom the competition between two opposite effects ofthe dissolved hydrated lime, which we have evidencedby zeta potential measurements and speciation calcula-tions. On the one hand, calcium ions complex at thecalcite surface, increasing its surface charge and pro-moting thereby the inter-particle repulsion. On the otherhand, the added calcium hydroxide increases the ionicstrength, leading to an increased screening of the sur-
face charge, inhibiting inter-particle repulsion. We haveexemplified this competition by plotting the energy bar-rier of the interaction potential against [Ca2+], whichexhibits a maximum at the exact calcium ion concentra-tion where the elastic modulus is minimum.
In the long-term, the absorption of atmospheric CO2induces a carbonation of the lime that transforms intocalcite, so that all samples recover the mechanical prop-erties of pure calcite in roughly 1 day.
We have also tested the influence of the addition ofsodium hydroxide in the calcite suspension. NaOH hasbeen seen to inhibit the inter-particle repulsion, by bothreducing the absolute value of the zeta potential, andincreasing the ionic strength, which leads to a more rigidpaste compared to pure calcite.
Overall, we found a direct correlation between theelastic modulus of colloidal calcite pastes and the inter-particle energy barrier calculated using the classicalDLVO potential. This result contrasts with recent lo-cal force characterizations highlighting the non-DLVOnature of interaction forces between calcite surface inaqueous solutions [10–13], attributed to secondary hy-dration forces, ion-ion correlations or surface rough-ness [16]. This discrepancy could originate in thesmoothness of our calcite colloids at the nanometricscale, compared to micrometric or macroscopic calcite.
A practical consequence of our findings is that cal-cium hydroxide could be used as an admixture to getmore workable suspensions of calcite colloids. The in-duced extra-fluidity spontaneously disappears by simplecontact with air and the final mechanical properties areindependent of the quantity of added lime. This tun-ability of the paste elasticity —two orders of magnitudein elastic modulus— is due to the nanometric scale ofthe particles and could allow the paste to be injectedin porous minerals for consolidation, similarly to nano-lime binders that have been recently developed for therestoration of limestone and lime-based historical her-itage [59].
AcknowledgementsThis project has received funding from the EuropeanUnion Horizon 2020 research and innovation programunder the Marie Skłodowska-Curie grant agreementNo.642976-NanoHeal Project. The results of this arti-cle reflect only the authors’ view and the Commission isnot responsible for any use that may be made of the in-formation it contains. CB acknowledges support fromInstitut Universitaire de France. We thank FernandoBresme and Juan D. Olarte-Plata for stimulating discus-
11
sions, and Nicholas Blanchard for help with the TEMimages.
References[1] K. G. Knauss, J. W. Johnson, C. I. Steefel, Evaluation of the
impact of CO2, co-contaminant gas, aqueous fluid and reservoirrock interactions on the geologic sequestration of CO2, Chem.Geol. 217 (2005) 339–350.
[2] Y. Benachour, Davy, C. A., F. Skoczylas, H. Houari, Effect ofa high calcite filler addition upon microstructural, mechanical,shrinkage and transport properties of a mortar, Cem. Concr.Res. 38 (2008) 727–736.
[3] A. Røyne, J. Bisschop, D. K. Dysthe, Experimental investiga-tion of surface energy and subcritical crack growth in calcite,Journal of Geophysical Research: Solid Earth 116 (2011).
[4] K. A. Rezaei Gomari, A. A. Hamouda, Effect of fatty acids,water composition and pH on the wettability alteration of cal-cite surface, Journal of Petroleum Science and Engineering 50(2006) 140–150.
[5] S. Pourchet, I. Pochard, F. Brunel, D. Perrey, Chemistry ofthe calcite/water interface: Influence of sulfate ions and con-sequences in terms of cohesion forces, Cement and ConcreteResearch 52 (2013) 22–30.
[6] S. L. Stipp, M. F. Hochella, Structure and bonding environmentsat the calcite surface as observed with X-ray photoelectron spec-troscopy (XPS) and low energy electron diffraction (LEED),Geochimica et Cosmochimica Acta 55 (1991) 1723–1736.
[7] M. Wolthers, L. Charlet, P. Van Cappellen, The surface chem-istry of divalent metal carbonate minerals; a critical assessmentof surface charge and potential data using the charge distribu-tion multi-site ion complexation model, American Journal ofScience 308 (2008) 905–941.
[8] F. Heberling, T. P. Trainor, J. Lützenkirchen, P. Eng, M. A. De-necke, D. Bosbach, Structure and reactivity of the calcite–waterinterface, Journal of colloid and interface science 354 (2011)843–857.
[9] D. Al Mahrouqi, J. Vinogradov, M. D. Jackson, Zeta potentialof artificial and natural calcite in aqueous solution, Advances incolloid and interface science 240 (2017) 60–76.
[10] A. Røyne, K. N. Dalby, T. Hassenkam, Repulsive hydrationforces between calcite surfaces and their effect on the brittlestrength of calcite-bearing rocks: hydration force between cal-cite surfaces, Geophysical Research Letters 42 (2015) 4786–4794.
[11] Y. Diao, R. M. Espinosa-Marzal, Molecular insight into thenanoconfined calcite–solution interface, Proceedings of the Na-tional Academy of Sciences 113 (2016) 12047–12052.
[12] S. Javadi, A. Røyne, Adhesive forces between two cleaved cal-cite surfaces in NaCl solutions: The importance of ionic strengthand normal loading, Journal of Colloid and Interface Science532 (2018) 605–613.
[13] J. Dziadkowiec, S. Javadi, J. E. Bratvold, O. Nilsen, A. Røyne,Surface Forces Apparatus Measurements of Interactions be-tween Rough and Reactive Calcite Surfaces, Langmuir 34(2018) 7248–7263.
[14] J. Israelachvili, Intermolecular and surfaces forces, AcademicPress, London, 1992.
[15] S. H. Donaldson, A. Røyne, K. Kristiansen, M. V. Rapp, S. Das,M. A. Gebbie, D. W. Lee, P. Stock, M. Valtiner, J. Israelachvili,Developing a General Interaction Potential for Hydrophobic andHydrophilic Interactions, Langmuir 31 (2015) 2051–2064.
[16] J. D. Olarte-Plata, G. Brekke-Svaland, F. Bresme, The
role of surface roughness on the eïnAective interactionsand phase behaviour of calcium carbonate nanoparticles,https://arxiv.org/pdf/1905.07254.pdf (2019).
[17] R. J. Hunter, S. Nicol, The dependence of plastic flow behaviorof clay suspensions on surface properties, Journal of Colloidand Interface Science 28 (1968) 250–259.
[18] B. A. Firth, R. J. Hunter, Flow properties of coagulated colloidalsuspensions: III. The elastic floc model, Journal of Colloid andInterface Science 57 (1976) 266–275.
[19] W. Y. Shih, W.-H. Shih, I. A. Aksay, Elastic and yield behav-ior of strongly flocculated colloids, Journal of the AmericanCeramic Society 82 (1999) 616–624.
[20] R. J. Flatt, P. Bowen, Yodel: a yield stress model for sus-pensions, Journal of the American Ceramic Society 89 (2006)1244–1256.
[21] P. J. Scales, S. B. Johnson, T. W. Healy, P. C. Kapur, Shear yieldstress of partially flocculated colloidal suspensions, AIChEJournal 44 (1998) 538–544.
[22] S. Zhu, L. Avadiar, Y.-K. Leong, Yield stress-and zeta potential-ph behaviour of washed α-Al2O3 suspensions with relativelyhigh Ca (II) and Mg (II) concentrations: Hydrolysis productand bridging, International Journal of Mineral Processing 148(2016) 1–8.
[23] R. Castellani, A. Poulesquen, F. Goettmann, P. Marchal,L. Choplin, Ions effects on sol–gel transition and rheologicalbehavior in alumina slurries, Colloids and Surfaces A: Physico-chemical and Engineering Aspects 430 (2013) 39–45.
[24] A. Gossard, F. Frances, C. Aloin, Rheological properties of tio2suspensions varied by shifting the electrostatic inter-particle in-teractions with an organic co-solvent, Colloids and Surfaces A:Physicochemical and Engineering Aspects 522 (2017) 425–432.
[25] Y.-K. Leong, P.-J. Scales, T. W. Healy, D. V. Boger, R. Buscall,Rheological evidence of adsorbate-mediated short-range stericforces in concentrated dispersions, Journal of the Chemical So-ciety, Faraday Transactions 89 (1993) 2473–2478.
[26] J. P. Friend, R. J. Hunter, Plastic flow behavior of coagulatedsuspensions treated as a repeptization phenomenon, Journal ofColloid and Interface Science 37 (1971) 548–556.
[27] B. A. Firth, Flow properties of coagulated colloidal suspensions:II. experimental properties of the flow curve parameters, Journalof Colloid and Interface Science 57 (1976) 257–265.
[28] J. Gustafsson, P. Mikkola, M. Jokinen, J. B. Rosenholm, Theinfluence of pH and NaCl on the zeta potential and rheology ofanatase dispersions, Colloids and Surfaces A: Physicochemicaland Engineering Aspects 175 (2000) 349–359.
[29] M. Kosmulski, J. Gustafsson, J. B. Rosenholm, Correlation be-tween the zeta potential and rheological properties of anatasedispersions, Journal of colloid and interface science 209 (1999)200–206.
[30] T. Liberto, M. Le Merrer, C. Barentin, M. Bellotto, J. Colom-bani, Elasticity and yielding of a calcite paste: scaling laws in adense colloidal suspension, Soft Matter 13 (2017) 2014–2023.
[31] T. Foxall, G. C. Peterson, H. M. Rendall, A. L. Smith, Chargedetermination at calcium salt/aqueous solution interface, Jour-nal of the Chemical Society, Faraday Transactions 1: PhysicalChemistry in Condensed Phases 75 (1979) 1034–1039.
[32] A. Pierre, J. Lamarche, R. Mercier, A. Foissy, J. Persello, Cal-cium as potential determining ion in aqueous calcite suspen-sions, Journal of Dispersion Science and Technology 11 (1990)611–635.
[33] Y. C. Huang, F. M. Fowkes, T. B. Lloyd, N. D. Sanders, Ad-sorption of calcium ions from calcium chloride solutions ontocalcium carbonate particles, Langmuir 7 (1991) 1742–1748.
[34] R. Nyström, M. Lindén, J. B. Rosenholm, The influence of Na+,Ca2+, Ba2+, and La3+ on the ζ potential and the yield stress of
12

calcite dispersions, Journal of colloid and interface science 242(2001) 259–263.
[35] L. Bergström, Hamaker constants of inorganic materials, Ad-vances In Colloid and Interface Science 70 (1997) 125–179.
[36] A. Dukhin, V. Shilov, H. Ohshima, P. Goetz, Electroacousticphenomena in concentrated dispersions: New theory and CVIexperiment, Langmuir 15 (1999) 6692–6706.
[37] A. S. Dukhin, V. Shilov, Y. Borkovskaya, Dynamic elec-trophoretic mobility in concentrated dispersed systems. Cellmodel, Langmuir 15 (1999) 3452–3457.
[38] MINTEQ, Visual minteq version 3.1, https://vminteq.lwr.kth.se,2014.
[39] P. Somasundaran, G. Agar, The zero point of charge of calcite,Journal of Colloid and Interface Science 24 (1967) 433–440.
[40] D. Green, R. Perry, Perry’s Chemical Engineers’ Handbook,Eighth Edition, McGraw Hill professional, McGraw-Hill, 2007.
[41] J. Song, Y. Zeng, L. Wang, X. Duan, M. Puerto, W. G. Chap-man, S. L. Biswal, G. J. Hirasaki, Surface complexation model-ing of calcite zeta potential measurements in brines with mixedpotential determining ions (Ca2+, CO2−
3 , Mg2+, SO2−4 ) for char-
acterizing carbonate wettability, Journal of Colloid and InterfaceScience 506 (2017) 169–179.
[42] V. A. Bloomfield, Condensation of DNA by multivalent cations:considerations on mechanism, Biopolymers 31 (1991) 1471–1481.
[43] I. Rouzina, V. A. Bloomfield, Macroion attraction due to elec-trostatic correlation between screening counterions. 1. mobilesurface-adsorbed ions and diffuse ion cloud, The Journal ofPhysical Chemistry 100 (1996) 9977–9989.
[44] J. C. Butler, T. Angelini, J. X. Tang, G. C. Wong, Ion multiva-lence and like-charge polyelectrolyte attraction, Physical reviewletters 91 (2003) 028301.
[45] E. Allahyarov, G. Gompper, H. Löwen, Attraction betweenDNA molecules mediated by multivalent ions, Physical ReviewE 69 (2004) 041904.
[46] A. Delville, R.-M. Pellenq, J. Caillol, A monte carlo (n, v, t)study of the stability of charged interfaces: a simulation on ahypersphere, The Journal of chemical physics 106 (1997) 7275–7285.
[47] C. Labbez, I. Pochard, A. Nonat, B. Jönsson, Colloidal behav-ior of CSH nanohydrates in cement paste, in: Symposium onconcrete modelling (CONMOD 2010), 2010, pp. 1–4.
[48] P. Attard, D. J. Mitchell, B. W. Ninham, Beyond Poisson–Boltzmann: images and correlations in the electric double layer.I. Counterions only, The Journal of chemical physics 88 (1988)4987–4996.
[49] R. R. Netz, H. Orland, Beyond poisson-boltzmann: Fluctuationeffects and correlation functions, The European Physical JournalE 1 (2000) 203–214.
[50] G. S. Manning, Limiting laws and counterion condensation inpolyelectrolyte solutions I. Colligative properties, The journalof chemical Physics 51 (1969) 924–933.
[51] S. Stipp, Toward a conceptual model of the calcite surface: hy-dration, hydrolysis, and surface potential, Geochimica et Cos-mochimica Acta 63 (1999) 3121–3131.
[52] C. Labbez, B. Jönsson, I. Pochard, A. Nonat, B. Cabane, Surfacecharge density and electrokinetic potential of highly chargedminerals: experiments and Monte Carlo simulations on cal-cium silicate hydrate, The Journal of Physical Chemistry B 110(2006) 9219–9230.
[53] Z. Peng, E. Doroodchi, B. Moghtaderi, G. Evans, A dem-basedanalysis of the influence of aggregate structure on suspensionshear yield stress, Advanced Powder Technology 23 (2012)437–444.
[54] T. de Assis, F. Reis, Dissolution of minerals with rough surfaces,
Geochim. Cosmochim. Acta 228 (2018) 27–41.[55] B. Zareeipolgardani, A. Piednoir, J. Colombani, Tuning biotic
and abiotic calcite growth by stress, submitted (2019).[56] M. J. Mitchell, O. E. Jensen, K. A. Cliffe, M. M. Maroto-Valer,
A model of carbon dioxide dissolution and mineral carbonationkinetics, Proceedings of the Royal Society A: Mathematical,Physical and Engineering Sciences 466 (2010) 1265–1290.
[57] H. Gay, T. Meynet, J. Colombani, Local study of the corrosionkinetics of hardened Portland cement under acid attack, Cementand Concrete Research 90 (2016) 36–42.
[58] L. Z. Lakshtanov, N. Bovet, S. L. S. Stipp, Inhibition of cal-cite growth by alginate, Geochimica et Cosmochimica Acta 75(2011) 3945–3955.
[59] A. Daehne, C. Herm, Calcium hydroxide nanosols for theconsolidation of porous building materials-results from EU-STONECORE, Heritage Science 1 (2013) 11.
13