Embed Size (px)
Citation preview

SIM Fund 2014
MBA Presentation - December 5, 2014

James Lyle Noel HillNic KostmanAishwarya Srinivasan
Eugene Lee Jeremy Mortensen Rob Bayless Tyler Blue
2

Agenda Team Intro Objectives Quantitative Strategy
Intro Approach Today’s Portfolio
REITs Intro Today’s Portfolio
3

SIM Fund Objectives
Apply range of course principles to fund management
Utilize resources to maximize learning Manage scope
Portfolio Model 85% - Quantitative Strategy (core) 15% - REITs (diversification)
4

Dividend Premium Strategy
5

Dividend Stock Pricing Anomaly “…Companies have positive
abnormal returns in months when they are predicted to issue a dividend”
(Hartzmark & Solomon 2012)
6
Div-ExDiv Declared
Buy(Div Declared -1)
Sell(Div-Ex)

Dividend Stock Pricing Anomaly
Why does it exist?
Mutual fund demand to pass through dividends (Harris, Hartzmark, and Solomon 2014)
Cash guarantee
7

Constraints
Limited Human Capital Solution: Cap holdings
Trading Rules Solution: Weekly trades on schedule
Uneven distribution of declared dividends Solution: Adjust weights
8

Exclusionary Rules
Traded in the Russell 1000 Index Domiciled in the US Market Cap over $10 billion Exclude the sectors: Insurance, Banks, Utilities, REIT Had Quarterly Dividends over the past year
Universe: 191 securities Team plans to cap holdings with a maximum of 80
9

Div-Ex B
Div Declared A
Buy A, B
Weekly trade schedule
Div Declared B Div Declared C
Div-Ex CDiv-Ex A
Buy CSell A, B
Sell C
10

Strategy comparison
Day trading Weekly trading
Closer to the true dividend model:
Less holding period prior to undeclared
Capture the pure declared-to-ex holding period
Cash drag with scalability As number of holdings increase,
timing differences between stocks cause cash drag
Scheduled activities Timed buy and sell handoff on a
weekly basis; less cash drag Easier to manage scale
Less “efficient” Longer holding period outside of
declaration alpha (up to 6 days), and holding period is only 22 days on average.
Missed ex-date alpha
11

Investment Universe
12
Gantt Chart

Initial Selection – Pure Strategy
13

Initial Selection – Pure + Lead Time
14

Initial Selection – Pure + Lead Time, Weekly
15
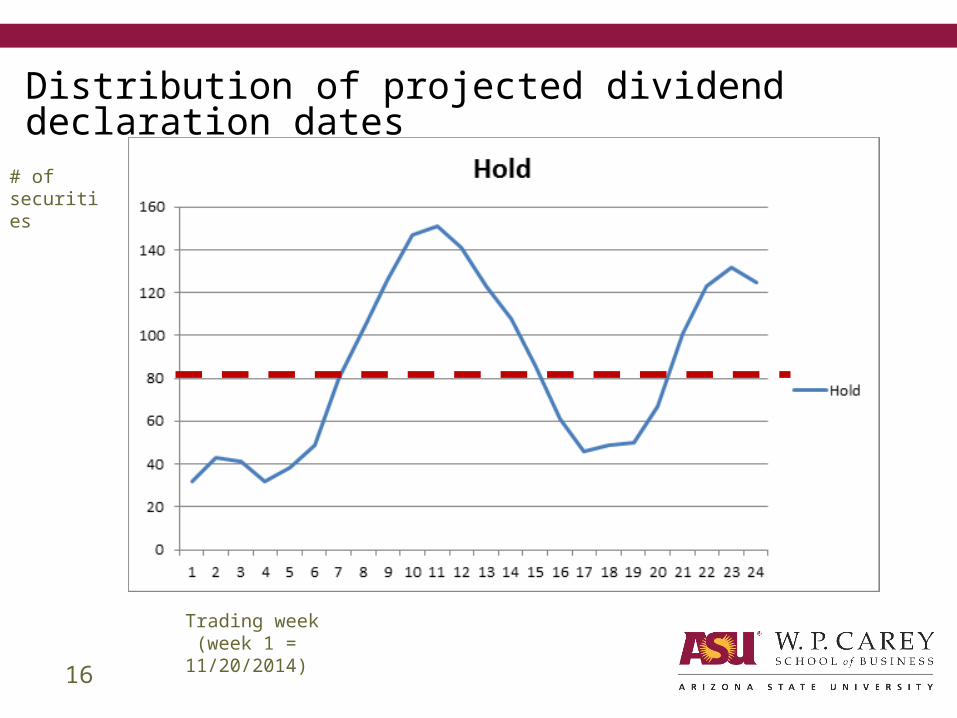
Distribution of projected dividend declaration dates
16
# of securities
Trading week (week 1 = 11/20/2014)

Weighting strategy
17

Issues going forward
Need to maintain diverse holdings (>30) Limited human resources
Cap total holdings to ensure oversight and adequate trade volume
Securities assigned to individual team members for monitoring
Avoid Closet Indexing
18

Portfolio Today – Seeding
Initial seeding on November 20 32 Securities
3 securities eliminated due to deviation from forecast Approximately $18,000 per position
19

Portfolio Today – Industry Mix
20

REITsStrategy
22

REITs – Overall strategy
Approximately 15% of total portfolio Primary purpose (for us) is diversification Focused on ETFs with low expense ratios,
high trading volumes, and high assets under management Also filtered out REIT ETFs from non-reputable
companies
22

REITs – Holdings
23
REITExpense
RatioYTD Ret 3Y Ret 5Y Ret Yield Holdings
Std Dev
AUM (Mil) Vol.
Age (Years)
Vanguard REIT ETF
0.10% 14.11% 16.54% 15.92% 3.51% 139 4.76% 25969.1 5.6 mil
10.19
SPDR Dow Jones REIT ETF
0.25% 14.52% 15.85% 15.50% 3.22% 92 5.47% 2902.9 180k 13.62
Vanguard Global ex-U.S. Real Estate Index Fund
0.27% 4.09% 14.33% n/a 4.28% 632 2.25% 2156.4 293k 4.08

REITs – ETFs: Why we chose them Pros:
Strong performance across most REIT sectors
Highly liquid Diversification Not correlated with rest
of strategy Can hedge against
inflation
Cons: Sensitive to increases
in interest rates Falling occupancy rates
hurt profitability Differentiation
24

Thank you
Questions?
27

Appendix
26

Weighting strategy - traps
27

Anticipated attrition of Week 1 purchase over 14 weeks
28