Embed Size (px)
Citation preview

ANRITSU CORPORATION
Signal Analyzer MS2830A series
3.6 GHz Signal Analyzer MS2830A-040
6 GHz Signal Analyzer MS2830A-041
13.5 GHz Signal Analyzer MS2830A-043
Product Introduction
Version 16.00
MS2830A-040: 9 kHz to 3.6 GHz
MS2830A-041: 9 kHz to 6 GHz
MS2830A-043: 9 kHz to 13.5 GHz
<MS2830A-044: 9 kHz to 26.5 GHz*>
<MS2830A-045: 9 kHz to 43 GHz*>
*: See MS2830A-044/045 Product Introduction.
2
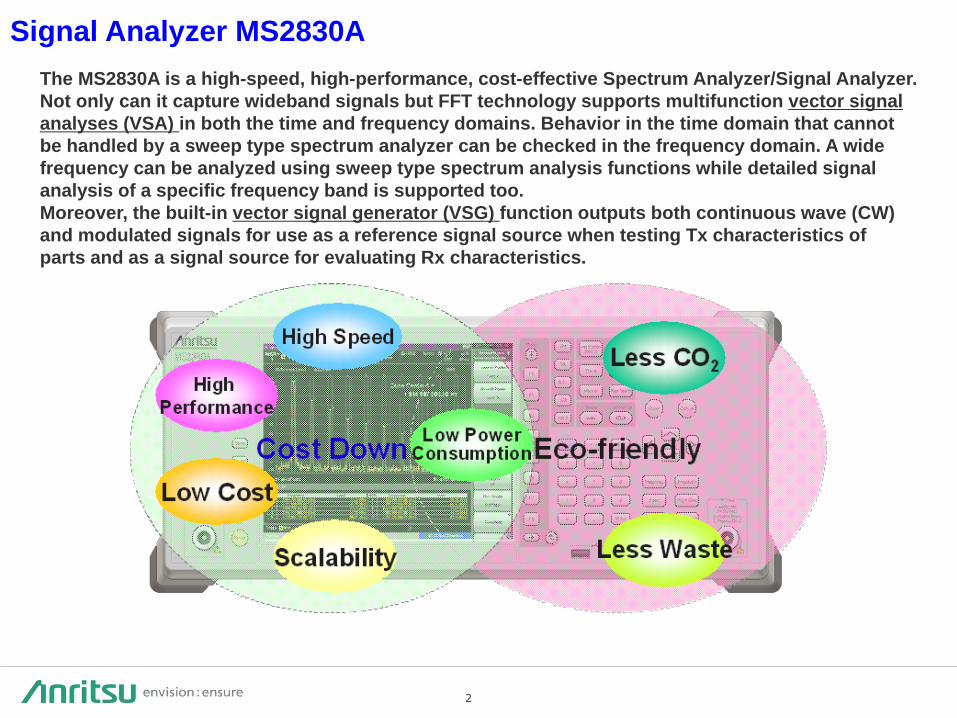
The MS2830A is a high-speed, high-performance, cost-effective Spectrum Analyzer/Signal Analyzer.
Not only can it capture wideband signals but FFT technology supports multifunction vector signal
analyses (VSA) in both the time and frequency domains. Behavior in the time domain that cannot
be handled by a sweep type spectrum analyzer can be checked in the frequency domain. A wide
frequency can be analyzed using sweep type spectrum analysis functions while detailed signal
analysis of a specific frequency band is supported too.
Moreover, the built-in vector signal generator (VSG) function outputs both continuous wave (CW)
and modulated signals for use as a reference signal source when testing Tx characteristics of
parts and as a signal source for evaluating Rx characteristics.
Signal Analyzer MS2830A
3
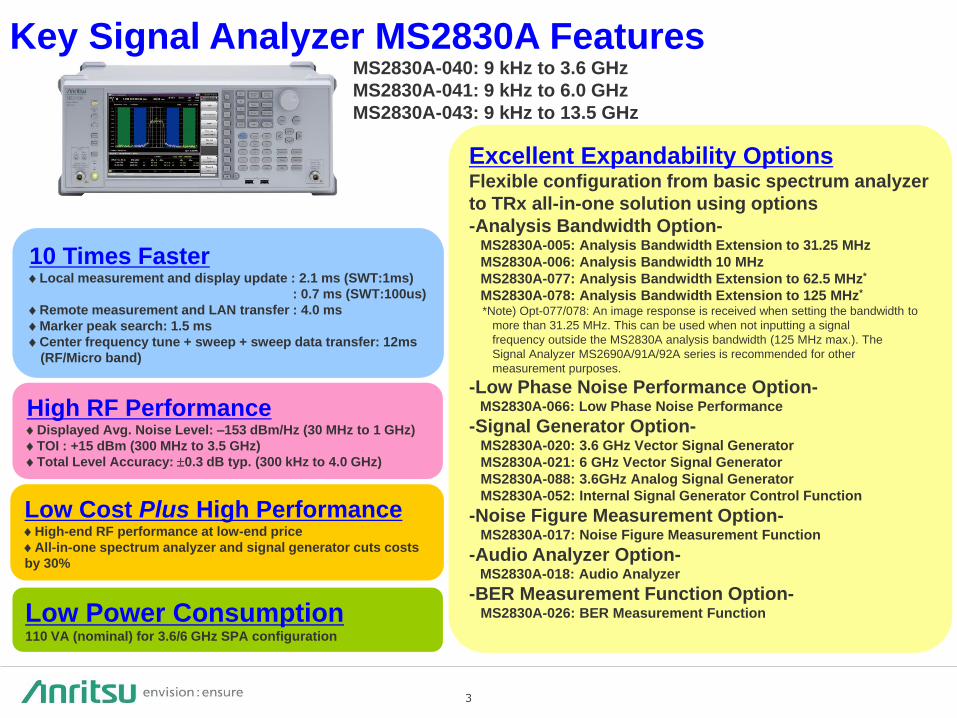
Key Signal Analyzer MS2830A Features
Low Cost Plus High Performance High-end RF performance at low-end price
All-in-one spectrum analyzer and signal generator cuts costs
by 30%
High RF Performance Displayed Avg. Noise Level: –153 dBm/Hz (30 MHz to 1 GHz)
TOI : +15 dBm (300 MHz to 3.5 GHz)
Total Level Accuracy: 0.3 dB typ. (300 kHz to 4.0 GHz)
10 Times Faster Local measurement and display update : 2.1 ms (SWT:1ms)
: 0.7 ms (SWT:100us)
Remote measurement and LAN transfer : 4.0 ms
Marker peak search: 1.5 ms
Center frequency tune + sweep + sweep data transfer: 12ms
(RF/Micro band)
MS2830A-040: 9 kHz to 3.6 GHz
MS2830A-041: 9 kHz to 6.0 GHz
MS2830A-043: 9 kHz to 13.5 GHz
Low Power Consumption 110 VA (nominal) for 3.6/6 GHz SPA configuration
Excellent Expandability Options Flexible configuration from basic spectrum analyzer
to TRx all-in-one solution using options
-Analysis Bandwidth Option- MS2830A-005: Analysis Bandwidth Extension to 31.25 MHz
MS2830A-006: Analysis Bandwidth 10 MHz
MS2830A-077: Analysis Bandwidth Extension to 62.5 MHz*
MS2830A-078: Analysis Bandwidth Extension to 125 MHz*
*Note) Opt-077/078: An image response is received when setting the bandwidth to
more than 31.25 MHz. This can be used when not inputting a signal
frequency outside the MS2830A analysis bandwidth (125 MHz max.). The
Signal Analyzer MS2690A/91A/92A series is recommended for other
measurement purposes.
-Low Phase Noise Performance Option- MS2830A-066: Low Phase Noise Performance
-Signal Generator Option- MS2830A-020: 3.6 GHz Vector Signal Generator
MS2830A-021: 6 GHz Vector Signal Generator
MS2830A-088: 3.6GHz Analog Signal Generator
MS2830A-052: Internal Signal Generator Control Function
-Noise Figure Measurement Option- MS2830A-017: Noise Figure Measurement Function
-Audio Analyzer Option- MS2830A-018: Audio Analyzer
-BER Measurement Function Option- MS2830A-026: BER Measurement Function

4
High Speed Supporting 10 Times Faster Throughput
The Signal Analyzer MS2830A supports very high-speed spectrum analyzer functions,
such as sweeping and frequency switching time. Using the VSA mode with advanced
DSP and FFT technologies cuts in-band and out-of-band spurious measurement times
by 90% (cf previous Anritsu instruments) to greatly improve manufacturing and
adjustment throughput.
Best-of-class measurement speed (SPA Mode)
Local measurement and display update : 2.1 ms (SWT: 1 ms)
: 0.7 ms (SWT: 100 us)
Remote measurement and LAN transfer : 4.0 ms
Marker peak search: 1.5 ms
Center frequency tune + sweep + sweep data transfer: 12ms
(RF/Micro band)
Faster speed (VSA Mode)
High-speed, in-band
measurements up to
125 MHz bandwidth
Cuts tact time and improves adjustment efficiency
The MS2830A performs in-band measurements,
such as ACP, OBW and Channel Power, many
times faster than sweep spectrum analyzers by
using FFT batch capture and analysis over a 125
MHz bandwidth and measurement interval.
High Speed
The above times are for real measurements based on Anritsu measurement
conditions. They are not guaranteed specifications.
Actual measurement times vary with the PC and measurement conditions.
5
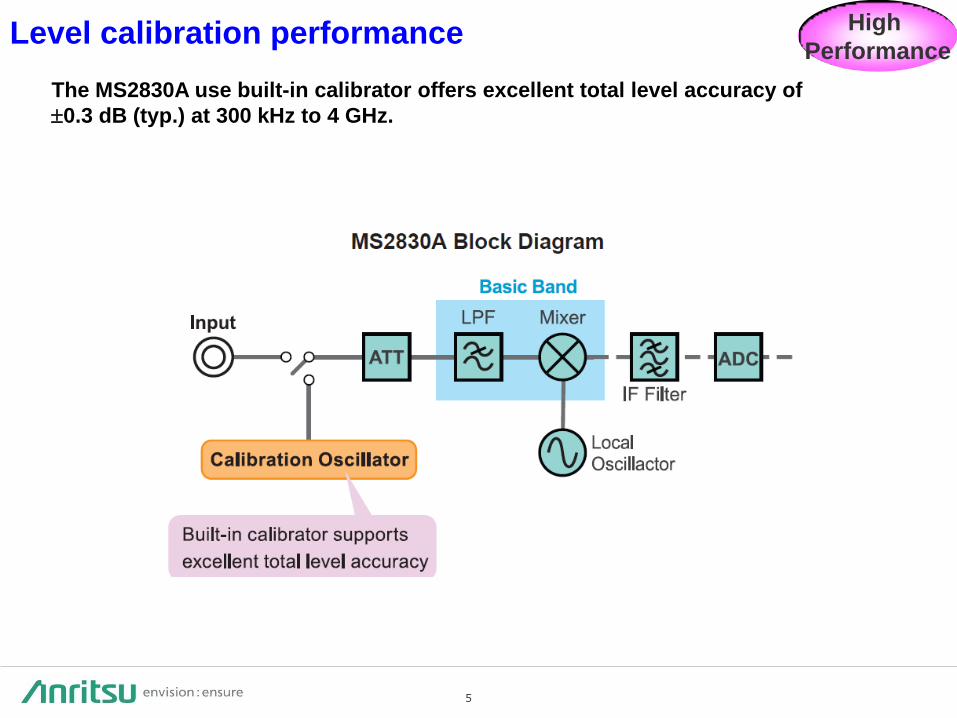
Level calibration performance
The MS2830A use built-in calibrator offers excellent total level accuracy of
0.3 dB (typ.) at 300 kHz to 4 GHz.
High
Performance

6
High RF Performance Improves Yield
Excellent 0.3 dB (typ.) absolute level accuracy and high 168 dB dynamic range
improve yield by eliminating false-negative evaluation errors at distortion and
spurious measurements.
High
Performance

7
Low-Cost Plus High-Performance
The all-in-one SA + SG configuration costs 30% less than combining a standalone SA
and SG.
Supports easy configuration of measurement systems
and saves bench space, initial investment, and running
costs (calibration and power consumption)
Low Cost
30% Lower Cost
Signal Generator (SG)
Spectrum Analyzer (SA)
MS2830A
OBT TRx Measurements

8
Optimum Current and Future Capital Investment Scalability
Spectrum
Analyzer
Signal
Analyzer
(10 MHz BW)
Signal
Analyzer
(125 MHz BW)
Analysis Bandwidth:
31.25/62.5/125 MHz (Opt-005/077*/078*)
Wide variety of
communications
Communications
bandwidths
up to 10 MHz
(GSM, WCDMA, etc.)
Communications
bandwidths
up to 125 MHz
(LTE, WLAN, etc.)
Configuration
Measurement
targets
Measurement
items
All-in-One
Tester
Vector Signal
Generator
3.6 GHz/6 GHz
(Opt-020/021)
(Opt-022)
MS2830A
The MS2830A has various options to support continuously evolving wireless
systems. It supports expansion from the base configuration with the spectrum
analyzer to an all-in-one TRx tester as needed. Functions required now and sometime
in the future are supported at minimum cost.
Power ACP Spurious etc.
Power ACP Spurious EVM etc.
Power ACP Spurious EVM etc.
Power ACP Spurious EVM Rx test etc.
Analysis Bandwidth: 10 MHz (Opt-006)
Spectrum Analyzer 3.6/6/13.5 GHz
(Opt-040/041/043: Mandatory)
*Note) Opt.077/078:
An image response is received when setting the bandwidth to more than 31.25 MHz. This can be used when not
inputting a signal frequency outside the MS2830A analysis bandwidth (125 MHz max.). The Signal Analyzer
MS2690A/91A/92A series is recommended for other measurement purposes.

9
Optimum Current and Future Capital Investment
Phase noise performance is increasingly important at carrier offsets of 1 kHz to 100 kHz.
Spectrum analyzer phase noise performance affects ACLR/MASK measurements at
narrowband communications. (Channel bandwidth : <100 kHz)
Add Option 066 when required by the specifications.
Scalability
MS2830A-066 Low Phase Noise Performance Option
Frequency Range:
9 kHz to 3.7 GHz
(Frequency band mode:∗ Normal)
9 kHz to 3.5 GHz
(Frequency band mode:∗ Spurious) ∗: Requires MS2830A-041/043 for setting.
Span:
300 Hz to 1 MHz (Spectrum Analyzer)
1 kHz to 31.25 MHz (Signal Analyzer)
MS2830A-066 cannot be retrofitted
MS2830A-066 sometimes cannot be installed
depending on options.
*This is an example and
values are not guaranteed.

10
Low Power Consumption
The MS2830A consumes just 110 W, cutting power by 45% compared to current
models and reducing electricity consumption directly and indirectly through lower
air conditioning costs. CO2 emissions are reduced too.
Low Power Consumption

11
Various Measurement Functions and Software
Measurement software (MX2690xxA)
Covers modulation analysis of various
communication systems from cellular
systems, such as GSM, WCDMA, and
LTE to GP analysis software.
Digitize function (Opt.005/006/077/078)
Saves and input signals as IQ data files
for re-analysis with VSA function
VSA function (Opt.005/006/077/078)
Seamless signal capture and analysis in
multiple domains
Vector Signal Generator (Opt.020/021 and
others)
Covers frequency range from 250 kHz to 3.6 GHz/
6 GHz with 120-MHz wideband vector modulation
bandwidth.
Other useful functions Measure function
(SPA as standard, VSA function via Opt.005/006/077/078)
Phase Noise Measurement function (Opt.010)
Noise Figure Measurement function (Opt.017)
Audio Analyzer function (Opt.018)
BER Measurement function (Opt.026)
Internal Signal Generator Control Function (Opt.052)
Options -Analysis Bandwidth Option-
MS2830A-005 Analysis Bandwidth Extension to 31.25 MHz
MS2830A-006 Analysis Bandwidth 10 MHz
MS2830A-077 Analysis Bandwidth Extension to 62.5 MHz*
MS2830A-078 Analysis Bandwidth Extension to 125 MHz*
*Note) Opt-077/078: An image response is received when setting the bandwidth to more
than 31.25 MHz. This can be used when not inputting a signal frequency outside the
MS2830A analysis bandwidth (125 MHz max.). The Signal Analyzer MS2690A/91A/92A
series is recommended for other measurement purposes.
-Signal Generator Option- MS2830A-020 3.6 GHz Vector Signal Generator
MS2830A-021 6 GHz Vector Signal Generator
MS2830A-088 3.6GHz Analog Signal Generator

12
∗1: Requires Opt. 006. ∗2: Requires Opt. 005 and Opt. 006. ∗3: Requires Opt. 005, Opt. 006 and Opt. 077. ∗4: 300 kHz ≤ f < 4 GHz, Frequency band mode Normal. ∗5: Excluding Guard Band.
*: With Opt. 006: 1 kHz to 10 MHz With Opt. 005/006: 1 kHz to 31.25 MHz With Opt. 005/006/077: 1 kHz to 62.5 MHz With Opt. 005/006/077/078: 1 kHz to 125 MHz
Digitize: Wideband and High Accuracy Waveform Capture
Captures wideband waveforms up to 125 MHz with accuracy of 0.3 dB
Based on the excellent level accuracy and wide dynamic range of the MS2830A, a signal with an FFT analysis bandwidth of up to 125 MHz can be captured with a level accuracy of 0.3 dB typ.
Opt. 006: 10 MHz max. (20 MHz max. sampling rate = 50 ns resolution, ADC resolution 16 bits)
Opt. 005∗1: 31.25 MHz max. (50 MHz max. sampling rate = 20 ns resolution, ADC resolution 16 bits)
Opt. 077∗2: 62.5 MHz max. (100 MHz max. sampling rate = 10 ns resolution, ADC resolution 14 bits)
Opt. 078∗3: 125 MHz max. (200 MHz max. sampling rate = 5 ns resolution, ADC resolution 14 bits) Note) Opt-077/078: An image response is received when setting the bandwidth to more than 31.25 MHz. This can be used when not inputting a signal frequency outside the MS2830A analysis bandwidth (125 MHz max.). The Signal Analyzer MS2690A/91A/92A series is recommended for other measurement purposes.
Max. Capture Time: 0.5 s to 2000 s Max. Number of Samples: 100 Msamples

13
Digitize: Calibration-Free Waveform Capture
No need for calibration block at analysis tool side
The MS2830A has built-in amplitude/phase calibration circuits to automatically calibrate
internal errors.
Captured waveform data are saved to the built-in hard disk and can be output to an external PC
via 1000BASE-T.
Analyze with commercially
available tool
RAM
Drive
Built-in
HDD
High-speed transfer
using 1000BASE-T
Waveform
Memory
Digitize RF signals Re-analyze with
VSA function

14
VSA: Multi-domain Analysis of Captured Signals
Display captured waveforms in various domains
Measures FSK and
GMSK modulation
wave frequency
variation, and VCO
frequency switching
time
Frequency vs. Time
Spectrum Power vs. Time
Supports wideband CCDF analysis up
to 31.25 MHz; useful for evaluating
power amplifiers in wideband
communications systems
Displays waveform of wideband
SPAN up to 125 MHz without
interruption
Supports wideband
CCDF analysis up to
125 MHz and ideal
for evaluating power
amps for wideband
communication
systems
CCDF/APD
Spectrogram Displays spectrum
variations with time;
useful for
understanding
waveform transients
because supports
visual monitoring of
frequency and level
time variations Frequency
Power Time
Phase vs. Time
Monitors time
fluctuations of phase
to check sudden
phase shift

15
VSA: Intuitive Split-Screen Display
Various VSA analyses can be performed on the main trace by specifying analysis segments on
the sub-trace. Intuitive analysis focusing on signal-on/rising/falling, etc., parts is made easy by
observing signal distributions on the sub-trace.
Specifying Analysis Segment
Main Trace
Sub-Trace Sub-trace
Power vs. Time
Spectrogram
Main Trace
Spectrum
Power vs. Time
Frequency vs. Time
Phase vs. time
CCDF/APD
Spectrogram
16
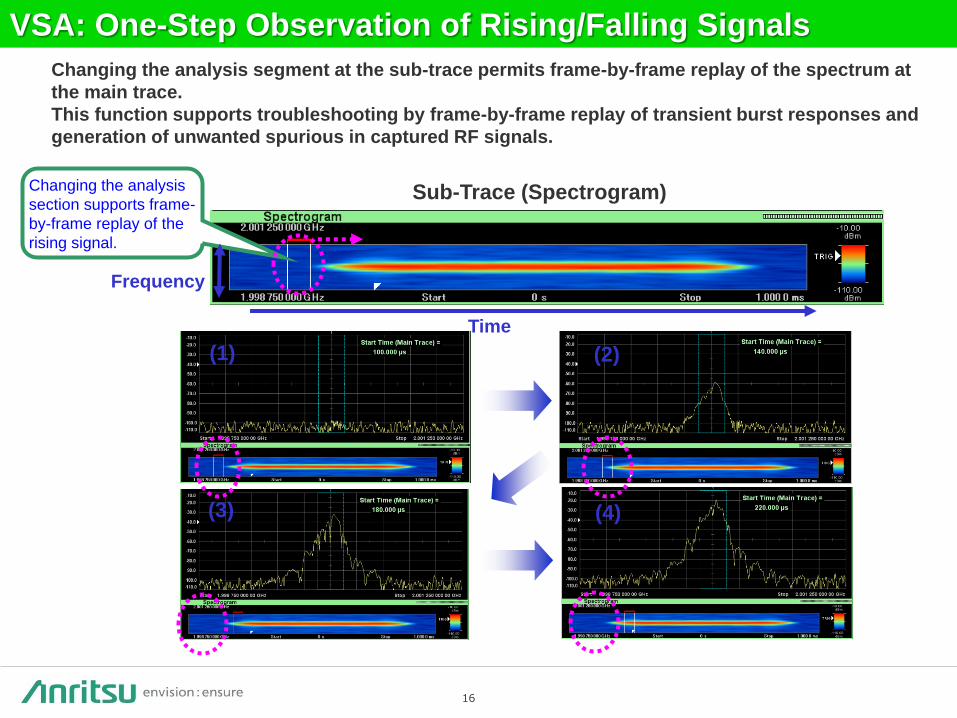
VSA: One-Step Observation of Rising/Falling Signals
Changing the analysis segment at the sub-trace permits frame-by-frame replay of the spectrum at
the main trace.
This function supports troubleshooting by frame-by-frame replay of transient burst responses and
generation of unwanted spurious in captured RF signals.
Changing the analysis
section supports frame-
by-frame replay of the
rising signal.
Sub-Trace (Spectrogram)
(1) (2)
(3) (4)
Time
Frequency
17
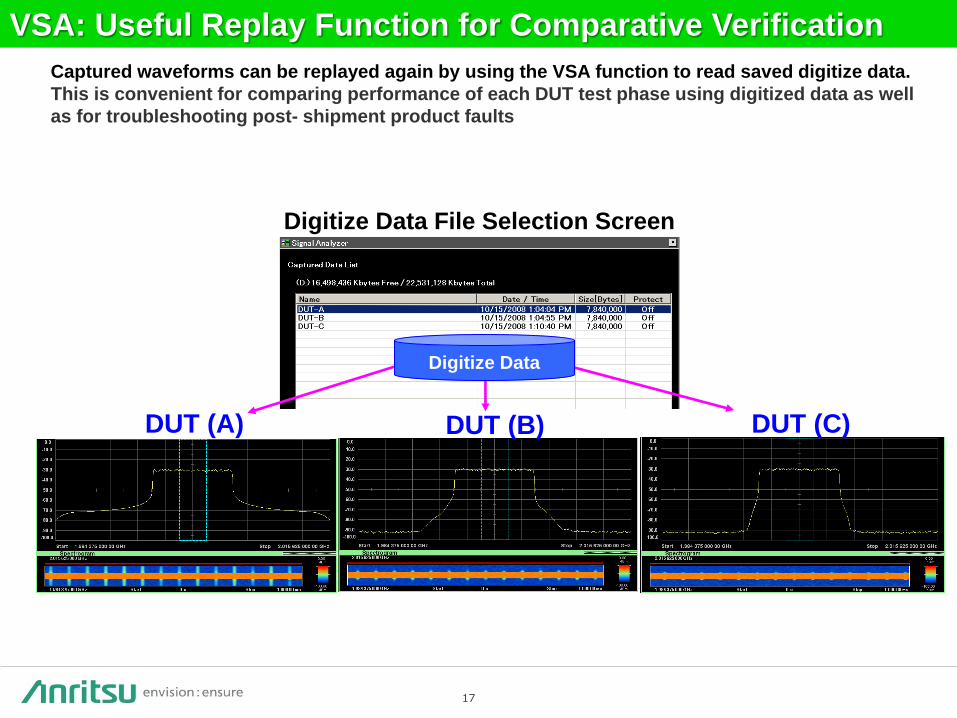
VSA: Useful Replay Function for Comparative Verification
DUT (A) DUT (B) DUT (C)
Digitize Data
Captured waveforms can be replayed again by using the VSA function to read saved digitize data.
This is convenient for comparing performance of each DUT test phase using digitized data as well
as for troubleshooting post- shipment product faults
Digitize Data File Selection Screen

18
VSA: Flexible File Save Function
Captured data can be saved to a file by specifying the Analysis Time range (display range of main
trace) or any time. The amount of saved data and later workload are cut because only required
segments are captured and saved to a file.
Example: Capture 20 ms and save only
one burst (600 µs) of GSM signal to file.
Capture time: 20 ms
Analysis Time: 600 s
Analysis Time: 600 s
Save required
segment to file.
Save total
capture time.
Save data
specified by
Analysis Time.
Save time-
specified
data.

19
*: Spectrum Analyzer measurement times
measured with the MS269xA.
VSA: FFT Analysis for Ultra-High-Speed Advantage
SPAN 25 MHz
RBW 30 kHz
SWT 95 ms
SPAN 25 MHz
RBW 30 kHz
Analysis Length 95 s
SPAN 25 MHz
RBW 30 kHz
Analysis Length 1900 s
Supports measurements many times faster than a sweep spectrum analyzer by using the signal
analyzer mode, which performs FFT analysis.
Spectrum Analyzer Signal Analyzer
20 Averagings
Measurement Time 0.3 s 8 Times Faster
65 Times Ultra Fast
20 Averagings
Measurement Time 2.6 s*
Batch Capture 20 Times
Measurement Time 0.04 s

20
VSA Function: No Trace Mode
No Trace mode does not execute signal analysis. Therefore, “IQ data output”
and “IQ data readout using remote commands” can be executed quickly
without the need to wait for completion of analysis.
(1)
(1)
Analysis Start Time
Analysis Time Length
Displays “Analysis Start
Time” and “Analysis Time
Length”.
*: As analysis is not executed, Save Waveform
function for saving waveform data cannot be used.

21
Modulation analysis of various communication systems from cellular system, such as GSM, WCDMA,
and LTE to GP analysis software is all supported. See each measurement software catalog for more details.
Measurement
Software
Measurement Software: Various Communications Systems

22
SG: Vector Signal Generator
Features Frequency range 250 kHz to 3.6 GHz (Opt-020)
250 kHz to 6.0 GHz (Opt-021)
Output level range –40 to +20 dBm (Standard)
–136 to +15 dBm (Opt-022)
Vector modulation band: 120 MHz
Waveform memory 64 Msa (Standard), 256 Msa (Opt-027)
High level accuracy
Absolute Level Accuracy: 0.5 dB, Linearity: 0.2 dB (typ.)
Excellent ACLR performance –64 dBc @ 5 MHz offset
–67 dBc @ 10 MHz offset
AWGN function (Opt-028)
The MS2830A incorporates a Vector Signal Generator option with frequency range
from 250 kHz to 3.6 GHz/6.0 GHz, and a 120 MHz vector modulation band. Due to the excellent level accuracy and ACLR performance, it is ideal for using with
the spectrum analyzer and signal generator functions to measure amplifiers, filters,
and antennas.
-Vector Signal Generator Option- MS2830A-020 3.6 GHz Vector Signal Generator
MS2830A-021 6 GHz Vector Signal Generator
23
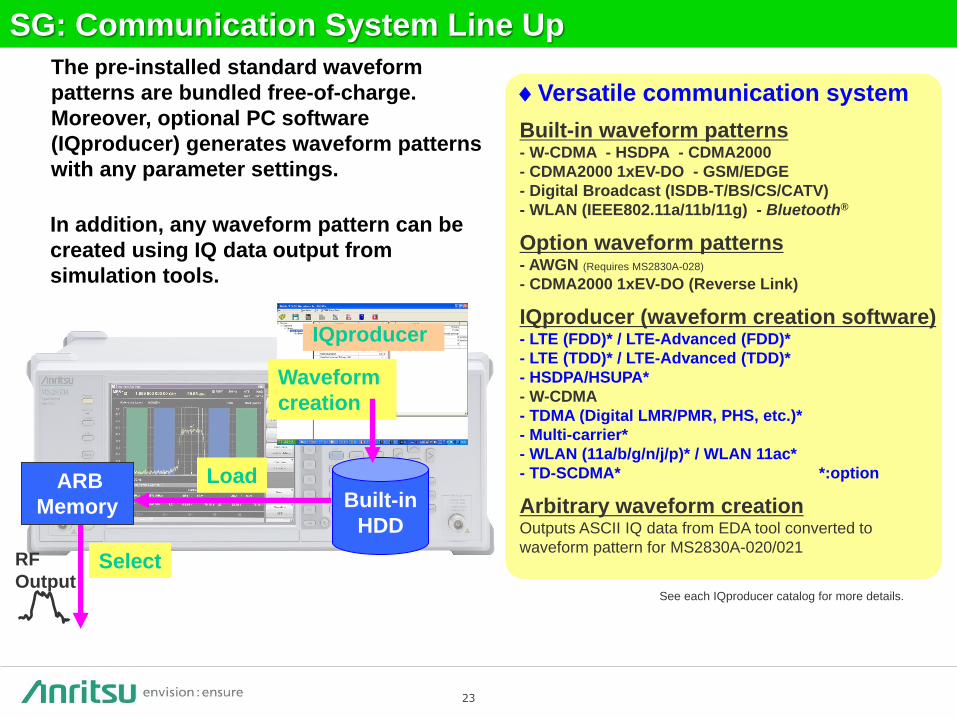
SG: Communication System Line Up
The pre-installed standard waveform
patterns are bundled free-of-charge.
Moreover, optional PC software
(IQproducer) generates waveform patterns
with any parameter settings.
Waveform
creation
IQproducer
Built-in
HDD
ARB
Memory
RF
Output
Load
Select
In addition, any waveform pattern can be
created using IQ data output from
simulation tools.
ARBメモリ
See each IQproducer catalog for more details.
Versatile communication system
Built-in waveform patterns - W-CDMA - HSDPA - CDMA2000
- CDMA2000 1xEV-DO - GSM/EDGE
- Digital Broadcast (ISDB-T/BS/CS/CATV)
- WLAN (IEEE802.11a/11b/11g) - Bluetooth®
Option waveform patterns - AWGN (Requires MS2830A-028)
- CDMA2000 1xEV-DO (Reverse Link)
IQproducer (waveform creation software) - LTE (FDD)* / LTE-Advanced (FDD)*
- LTE (TDD)* / LTE-Advanced (TDD)*
- HSDPA/HSUPA*
- W-CDMA
- TDMA (Digital LMR/PMR, PHS, etc.)*
- Multi-carrier*
- WLAN (11a/b/g/n/j/p)* / WLAN 11ac*
- TD-SCDMA* *:option
Arbitrary waveform creation Outputs ASCII IQ data from EDA tool converted to
waveform pattern for MS2830A-020/021
24
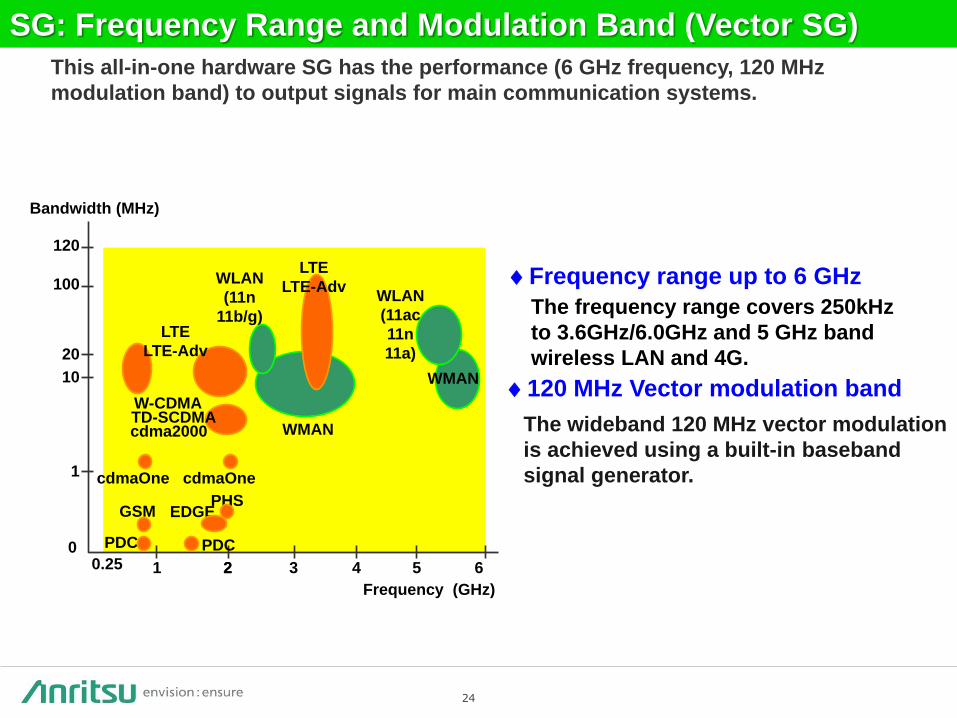
SG: Frequency Range and Modulation Band (Vector SG)
The wideband 120 MHz vector modulation
is achieved using a built-in baseband
signal generator.
This all-in-one hardware SG has the performance (6 GHz frequency, 120 MHz
modulation band) to output signals for main communication systems.
120 MHz Vector modulation band
The frequency range covers 250kHz
to 3.6GHz/6.0GHz and 5 GHz band
wireless LAN and 4G.
Frequency range up to 6 GHz
1 2 3 4 5 6 2
1
10
100
Bandwidth (MHz)
Frequency (GHz)
PDC
GSM EDGE
PDC
PHS
cdmaOne cdmaOne
0
120
20
cdma2000 TD-SCDMA W-CDMA
WMAN
WMAN
0.25
WLAN
(11ac
11n
11a)
LTE
LTE-Adv
WLAN
(11n
11b/g)
LTE
LTE-Adv

25
SG: Output Level Range (Vector SG)
The Vector Signal Generator standard option supports high outputs of +20 dBm max.
Installing the MS2830A-022 Low Power Extension for Vector Signal Generator
supports low-power outputs up to –136 dBm. It is ideal for Rx sensitivity tests.
Output level range (Standard) 40 to 20 dBm
AMP Tx
Rx
DUT
Analysis
MS2830A
SA SG
Wanted Signal
+ AWGN
Analysis
SG SA
MS2830A
Output level range (Opt-022)
136 to 15 dBm
Wanted Signal
+ AWGN
Supports simple design of Tx/Rx
test system All-in-one instrument for
amplifier tests

26
SG: ACLR Performance (Vector SG)
5 MHz –67.14 dBc*
10 MHz –68.97 dBc*
ACLR (measured value)
(W-CDMA, TestModel1 64DPCH, 2 GHz, SG output –10 dBm)
Superior ACLR Performance The superior ACLR performance is useful for device Tx tests of amplifiers, etc. The
MX269904A Multi-Carrier IQproducer software generates multiple carrier waveform
patterns.
*: Value only data selected at random, and not guaranteed performance

27
SG: AWGN (Vector SG) (Opt.028)
Built-in AWGN Generator for Dynamic Range Tests This can add AWGN (Additive White Gaussian Noise) to the wanted wave in the
arbitrary waveform memory. It is useful for Tx dynamic range tests.
Waveform memory
(64/256 Msa)
AWGN Generator
(Opt-028)
MS2830A-020/021 Vector Signal Generator
Signal output
Wanted signal
AWGN
AWGN band set automatically to sampling clock of wanted signal
Example: Wanted signal conditions
-WCDMA
-Bandwidth = 3.84 MHz
-Oversampling = 4 times
AWGN bandwidth
= 3.84 MHz x 4
= 15.36 MHz

28
Captured waveforms are converted to Vector SG waveform patterns using the built-in
PC software. These patterns are read by the Vector SG to replay the signal.
The field environment is easily reproduced at the bench top to use captured device
signals with a stable golden DUT for debugging and higher reliability testing.
Digitizer Function + Vector SG Option
Merits of All-in-One SA + SG (1/3) Easy reproduction of field environment
Reproduce captured waveforms from SG
Sampling
波形データA 波形データA Waveform Data
Digitized Data Digitized Data Waveform
Memory
(SA)
RF signal
output
RF Input
Convert Internal
HDD
Same signal reproduced by
using Vector SG option
-Field Environment
-Golden DUT Output
ARB
Memory
(SG)

29
Digitizer Function + Vector SG Option
Capture & Playback Function
Merits of All-in-One SA + SG (2/3) Easy reproduction of field environment
The MS2830A provides Capture & Playback functionality that enables laboratory-
grade testing of transceiver systems using real world signals. Using the optional
integrated Vector Signal Analyzer and Vector Signal Generator of the MS2830A,
Capture & Playback allows users to conveniently capture up to 100 MHz of spectrum
and play it back at any designated frequency and amplitude, making it easy to
determine device performance margins.
● Bandwidth and Time Limits
Minimum 10 kHz Bandwidth (2000 s maximum duration)*
Maximum 100 MHz Bandwidth (500 ms maximum duration)*
*: Maximum bandwidth depends upon vector signal analyzer options
installed (Opt. 006/005/077/078). Maximum playback duration
depends upon whether vector signal generator memory upgrade
(Opt. 027) is installed.
● Captured signal may be freely tuned to any output frequency
and amplitude supported by the vector signal generator.
● Any section of the captured waveform record may be
selected and played back.
Enables user to isolate and reproduce specific signal
bursts
Enables user to change duty cycle of pulsed waveforms

30
Internal Signal Generator Control Function Option (Opt.052)
Merits of All-in-One SA + SG (3/3) Evaluation of Filter and Amplifier
The Internal signal generator control function operates in conjunction with the
spectrum analyzer (SPA) function and built-in signal generator (SG) option to measure
the transmission characteristics of filters, amplifiers, etc.
DUT SG
(Output)
SPA
(Input)
Filters
Attenuators
Amplifiers
Isolators
Switches
:
Devices
Under
Test
Measure Both Passive and Active Devices
The DUT input signal source has a frequency range of 100 kHz to 6 GHz, an output level range of
-136 to +15 dBm, a step resolution of 0.01 dB, and a level accuracy of ±0.5 dB to measure both
passive and active devices using the built-in high-performance SG.
Accurate Frequency Characteristics
The SPA function displays the measured frequency characteristics results with an excellent linearity
error of just ±0.07 dB to display the frequency characteristics of bandpass filters, etc., accurately.
N dB Bandwidth Measurement Function
31
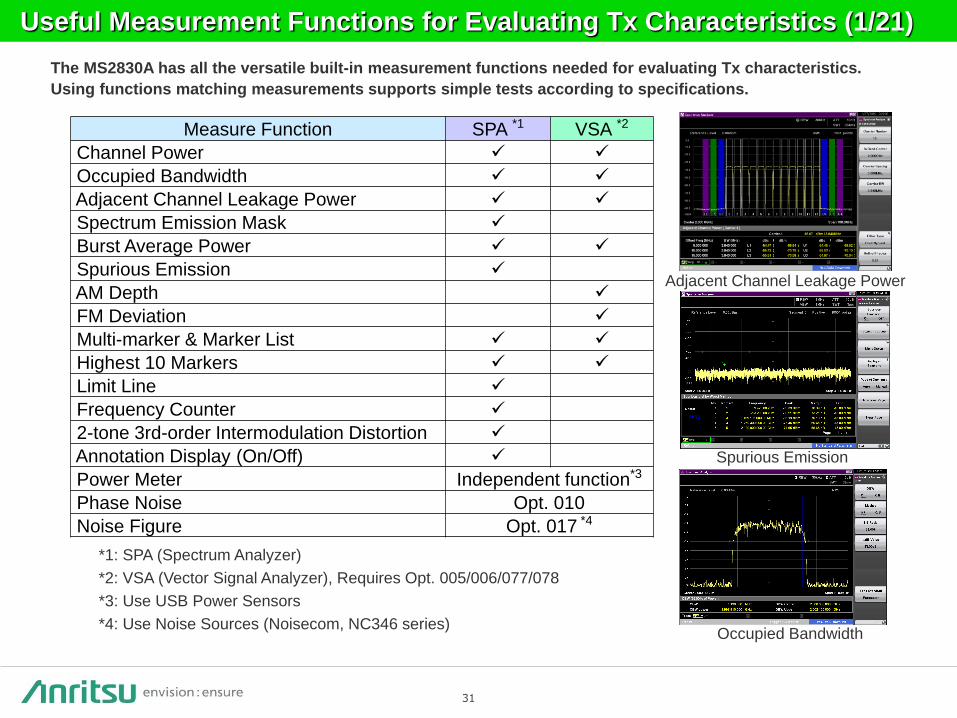
Useful Measurement Functions for Evaluating Tx Characteristics (1/21)
The MS2830A has all the versatile built-in measurement functions needed for evaluating Tx characteristics.
Using functions matching measurements supports simple tests according to specifications.
Adjacent Channel Leakage Power
Spurious Emission
Occupied Bandwidth
Measure Function SPA *1 VSA *2
Channel Power
Occupied Bandwidth
Adjacent Channel Leakage Power
Spectrum Emission Mask
Burst Average Power
Spurious Emission
AM Depth
FM Deviation
Multi-marker & Marker List
Highest 10 Markers
Limit Line
Frequency Counter
2-tone 3rd-order Intermodulation Distortion
Annotation Display (On/Off)
Power Meter Independent function*3
Phase Noise Opt. 010
Noise Figure Opt. 017 *4
*1: SPA (Spectrum Analyzer)
*2: VSA (Vector Signal Analyzer), Requires Opt. 005/006/077/078
*3: Use USB Power Sensors
*4: Use Noise Sources (Noisecom, NC346 series)

32
Channel Power Measurement
Channel power measurement using three types of filter (Rectangular, Nyquist, Root Nyquist) is supported.
Channel Power
Bandwidth
Results display
Measurement function ON/OFF
Channel center frequency
Channel bandwidth
Filter:
Rectangular, Nyquist, Root
Nyquist
Channel Center: Set value for channel center frequency
Channel Width: Set value for channel bandwidth
Absolute Power: Power per Hz (Density)
In-zone power (Integration)
SPA VSA
Useful Measurement Functions for Evaluating Tx Characteristics (2/21)

33
Useful Measurement Functions for Evaluating Tx Characteristics (3/21)
Occupied Bandwidth Measurement
Results display
N% mode:
Bandwidth containing N% power with
total power in display as 100%
X dB mode:
Bandwidth X dB down from peak value
Occupied bandwidth is measured in two modes—N% and X dB.
Measurement mode selection: (See below)
% setting for <N%> mode
Power setting for <X dB> mode
OBW: Occupied bandwidth
OBW Center: Center frequency of occupied bandwidth
OBW Lower: Occupied bandwidth left-side frequency
OBW Upper: Occupied bandwidth right-side frequency
SPA VSA Occupied Bandwidth
Bandwidth
Measurement function ON/OFF

34
Useful Measurement Functions for Evaluating Tx Characteristics (4/21)
This function measures adjacent channel leakage power.
Reference power setting:
- SPAN TOTAL: Integral power for overall display
- Carrier Total: Total of all carrier power
- Both Sides of Carriers: Out-of-band carrier power
- Carrier Select: Specified carrier power
In-band setting
Offset Channel setting
Result display switching
Carrier: In-band, Ofs: Offset Channel,
All: Both In-band and Offset Channel
Noise cancellation function ON/OFF
(subtracts main-frame noise from measurement result)
Reference Power setting: (See below)
In-band
Offset Offset
Results display
SPA VSA
Relative power for Offset 1 to 3 [dBc] vs. reference
power selected with ACP Reference
( ) indicates absolute power [dBm].
Adjacent Channel Leakage Power (ACLR)
Measurement function ON/OFF
Adjacent Channel Leakage Power Measurement

35
In Band can be set from 1 to 12 carriers and switched instantaneously on the screen. Moreover, true ACLR performance
is measured using the noise cancellation function to subtract main-frame noise from the measurement result.
In Band Offset Offset
Carrier number switched
instantaneously! ACLR Measurement (12 carriers)
SPA VSA Adjacent Channel Leakage Power (ACLR)
Useful Measurement Functions for Evaluating Tx Characteristics (5/21)

36
Offset channel can be set from 1 to 8 and switched instantaneously on the screen.
Offset number switched
instantaneously! ACLR Measurement (12 carriers / 8 offsets)
SPA Adjacent Channel Leakage Power (ACLR)
Useful Measurement Functions for Evaluating Tx Characteristics (6/21)
In Band Offset Offset

37
Useful Measurement Functions for Evaluating Tx Characteristics (7/21)
Reference carrier bandwidth and sweeping method
setting
Offset limit lines can be set for up to 12 segments. The peak frequency and level in each segment are displayed and
parts exceeding the limit line are indicated in red. Also, when a limit line is exceeded at just one part, Fail is displayed
in red at the Result displays at the bottom left of the screen.
Spectrum Emission Mask Measurement
Result display
Reference
carrier Offset Offset
Limit line Offset position and sweeping method setting
Limit line setting (orange line)
Measurement target setting: (See below)
Result display switching
-Peak: Absolute power
- Margin: Margin for limit line
Measurement Target Setting
- Both: Measures both Lower and Upper
- Lower: Measures Lower
- Upper: Measures Upper
SPA
Level (Peak/Margin) and frequency of point
closest to limit line per offset.
Spectrum Emission Mask (SEM)
Measurement function ON/OFF

38
Up to six types of Limit line can be set on the spectrum display (frequency domain). In addition to setting the frequency
and level of crossover points manually in sequence from the low frequency, after creating the right half of a line, the left
half can be created by reversing and copying the right half, to set a symmetric limit line. Additionally, a Limit line that
traces the measured waveform can be created using the Limit Envelope function. A margin can be set on the Limit line
in the amplitude direction.
When the waveform is above or below the Limit line, it is evaluated automatically as PASS or FAIL. Evaluation is also
possible with an added margin. The target evaluation line can be chosen from any of six types.
Line: Limit 1, Limit 2, Limit 3, Limit 4, Limit 5, Limit 6
Evaluation Type: Upper Limit, Lower Limit
Crossover (Point): 1 to 100
Margin: Set Margin line for each Limit 1, 2, 3, 4, 5, 6
Evaluation Result: PASS, FAIL
Result Save: Auto-save as csv format file. (Save on Event Function)
PASS/FAIL evaluation is performed by
changing the input signal level. The
evaluation results for the five line types can
be displayed simultaneously on one screen.
Useful Measurement Functions for Evaluating Tx Characteristics (8/21)
When the waveform matches the evaluation conditions (Event), it can be saved
automatically as a csv format file. Any one of the following five Event types can be
selected. (Save on Event Function)
(1) Limit Fail: Saves waveform file when evaluation result is Fail
(2) Limit Pass: Saves waveform file when evaluation result is Pass
(3) Margin Fail: Saves waveform file when evaluation result including Margin is Fail
(4) Margin Pass: Saves waveform file when evaluation result including Margin is Pass
(5) Sweep Complete: Saves waveform file at every measurement regardless of evaluation
result
Results
Display
SPA Limit Lines
39
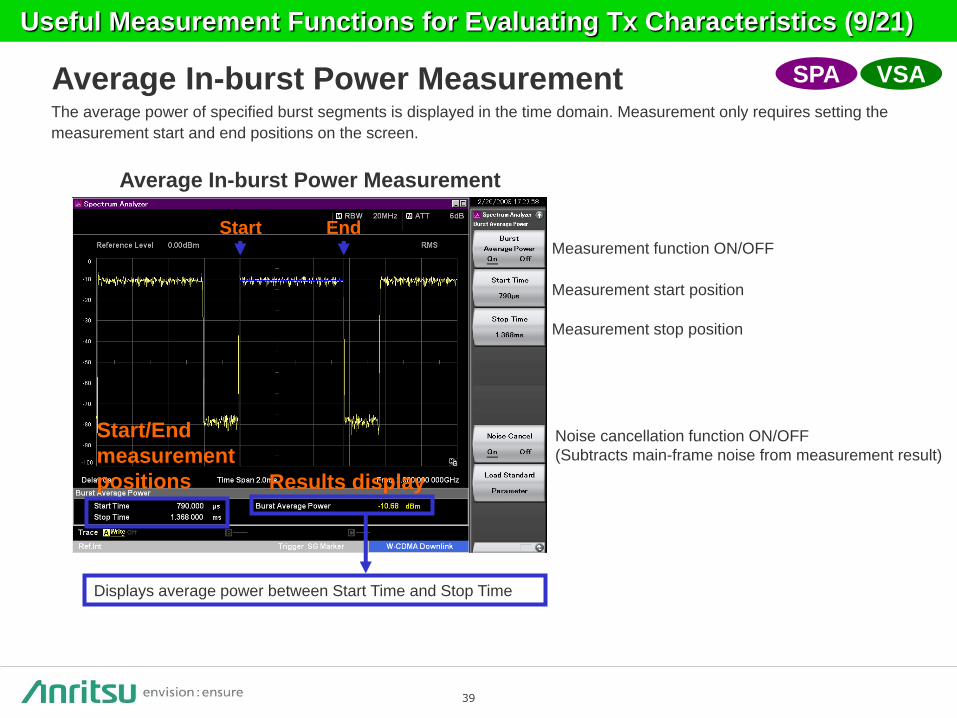
Useful Measurement Functions for Evaluating Tx Characteristics (9/21)
The average power of specified burst segments is displayed in the time domain. Measurement only requires setting the
measurement start and end positions on the screen.
Average In-burst Power Measurement
Start End
Start/End
measurement
positions Results display
SPA VSA
Measurement function ON/OFF
Measurement start position
Measurement stop position
Noise cancellation function ON/OFF
(Subtracts main-frame noise from measurement result)
Displays average power between Start Time and Stop Time
Average In-burst Power Measurement
40
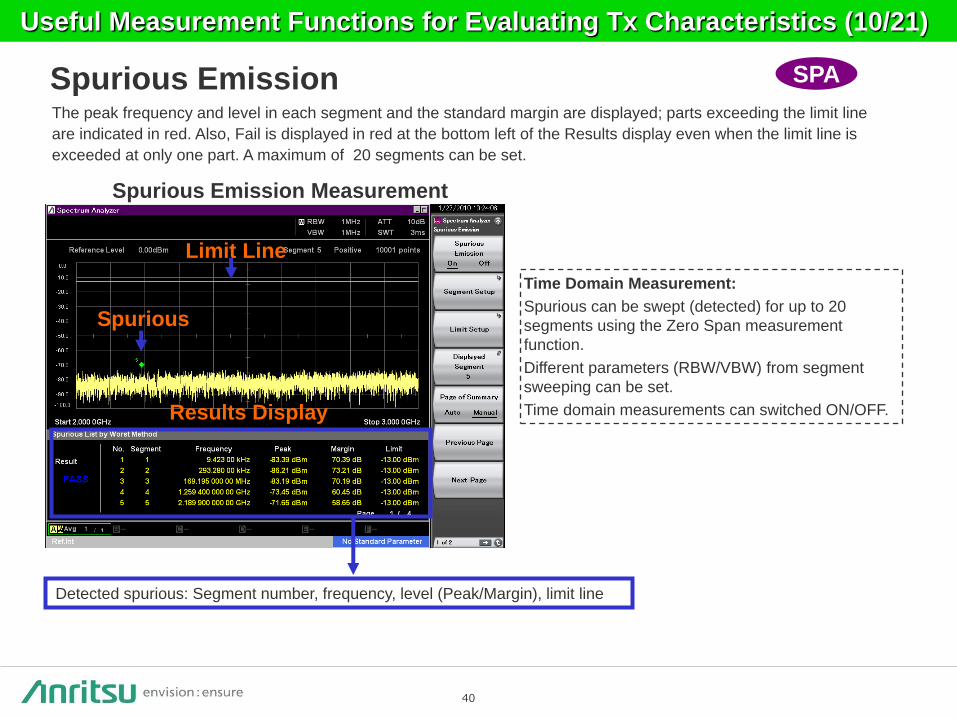
Useful Measurement Functions for Evaluating Tx Characteristics (10/21)
The peak frequency and level in each segment and the standard margin are displayed; parts exceeding the limit line
are indicated in red. Also, Fail is displayed in red at the bottom left of the Results display even when the limit line is
exceeded at only one part. A maximum of 20 segments can be set.
Results Display
Limit Line
Spurious
SPA
Detected spurious: Segment number, frequency, level (Peak/Margin), limit line
Time Domain Measurement:
Spurious can be swept (detected) for up to 20
segments using the Zero Span measurement
function.
Different parameters (RBW/VBW) from segment
sweeping can be set.
Time domain measurements can switched ON/OFF.
Spurious Emission
Spurious Emission Measurement
41
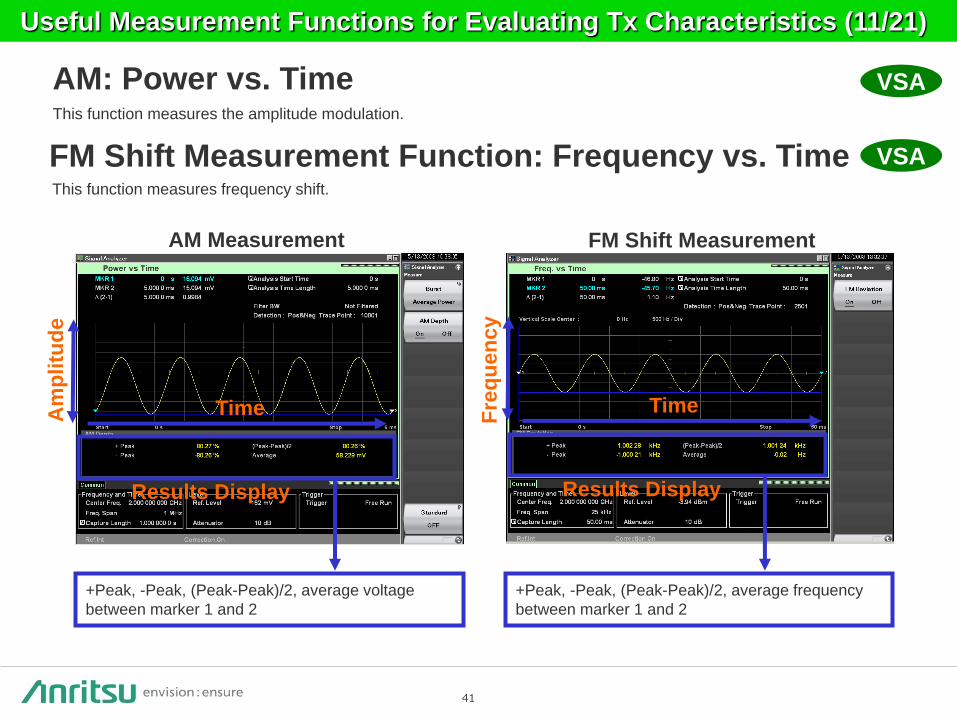
Useful Measurement Functions for Evaluating Tx Characteristics (11/21)
This function measures frequency shift.
This function measures the amplitude modulation.
Time Fre
qu
en
cy
Time Am
pli
tud
e
Results Display Results Display
VSA
+Peak, -Peak, (Peak-Peak)/2, average voltage
between marker 1 and 2
VSA
+Peak, -Peak, (Peak-Peak)/2, average frequency
between marker 1 and 2
AM: Power vs. Time
FM Shift Measurement Function: Frequency vs. Time
AM Measurement FM Shift Measurement

42
Useful Measurement Functions for Evaluating Tx Characteristics (12/21)
This function displays phase time fluctuations.
VSA
Phase Fluctuation Display
Ph
ase
Time
Phase Fluctuation:
Phenomena that are hard to spot using
a spectrum analyzer, such as phase
drift due to switching and transients,
can be evaluated.
Phase Fluctuation Display Function: Phase vs. Time

43
This displays the Peak value within the specified range. It is useful for measuring unstable signals with fluctuating
frequency and noise.
Sort Y Sort X
Threshold
This automatically searches for the ten highest peaks sorted from highest level (Sort Y) or lowest frequency (Sort X).
In addition, setting a threshold eliminates unnecessary searching.
This can be used for IM and harmonic, etc., measurements.
SPA VSA
SPA VSA
Zone Marker Function
Multi-Marker/Highest 10 Function
IM Measurement Harmonic Measurement
Useful Measurement Functions for Evaluating Tx Characteristics (13/21)

44
Useful Measurement Functions for Evaluating Tx Characteristics (14/21)
This function performs sweeping at the specified gate timing. The spectrum of the burst-on signal is easily displayed,
etc., because sub-screens can be displayed simultaneously in the time domain.
SPA Gate Sweeping
Set [Freq. Count] to ON to use the frequency counter function. [Gate Time] sets the frequency counter measurement
time.
SPA Frequency Counter
Specified gate
time
Results
Display
Gate Time:
Sets frequency counter measurement time
45
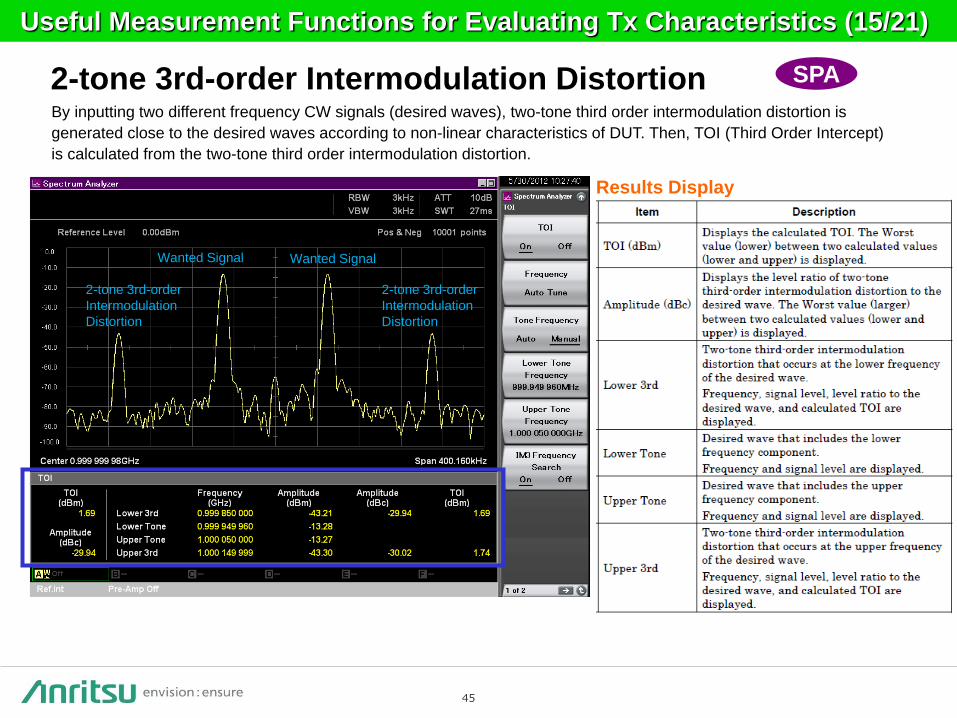
Useful Measurement Functions for Evaluating Tx Characteristics (15/21)
By inputting two different frequency CW signals (desired waves), two-tone third order intermodulation distortion is
generated close to the desired waves according to non-linear characteristics of DUT. Then, TOI (Third Order Intercept)
is calculated from the two-tone third order intermodulation distortion.
2-tone 3rd-order Intermodulation Distortion
Results Display
Wanted Signal Wanted Signal
2-tone 3rd-order
Intermodulation
Distortion
2-tone 3rd-order
Intermodulation
Distortion
SPA

46
No annotations
about frequency
and amplitude
Useful Measurement Functions for Evaluating Tx Characteristics (16/21)
Annotation Display (On/Off)
Screen annotations can be set to On or Off. Annotations about frequency,
amplitude, etc., are not displayed at the Off setting.
SPA

47
Useful Measurement Functions for Evaluating Tx Characteristics (17/21)
Power meter function can connect a USB power sensor to the MS269xA and read the measurement values.
Power Meter Function
Compatible USB power sensors
Model Frequency Dynamic Range
MA24104A* 600 MHz to 4 GHz +3 to +51.76 dBm
MA24105A 350 MHz to 4GHz +3 to +51.76 dBm
MA24106A 50 MHz to 6 GHz –40 to +23 dBm
MA24108A 10 MHz to 8 GHz –40 to +20 dBm
MA24118A 10 MHz to 18 GHz –40 to +20 dBm
MA24126A 10 MHz to 26 GHz –40 to +20 dBm
*: MA24104A has been discontinued.
Measurement Results
■ Power: [dBm], [W]
■ Relative power: [dB]
■Installing the Anritsu PowerXpertTM
Installing the Anritsu PowerXpertTM PC application software for the Anritsu USB Power Sensor in the MS2830A supports
various measurement functions offered by Anritsu PowerXpertTM, as well as use of other USB power sensors by the MS2830A.
Anritsu PowerXpertTM for the MS2830A can be downloaded from the MS2830A and MS2830A Microwave product pages at the
Anritsu website. When using the Anritsu PowerXpertTM software with a PC, download the latest version from the USB Power
Sensor product page at the Anritsu website.

48
This function measures the phase noise over a frequency offset range of 10 Hz to 10 MHz.
Offset 10 Hz 10 MHz
Normal:
Normal marker. Displays phase noise
level at specified frequency offset.
Integral Noise:
Calculates Integral Noise for specified
integrated bandwidth
RMS Noise:
Calculates RMS Noise for specified
integrated bandwidth
Jitter:
Calculates Jitter for specified
integrated bandwidth
Residual FM:
Calculates Residual FM for specified
integrated bandwidth
Carrier Frequency:
10 MHz to main frame upper limit
Start Offset (lower limit frequency): 10 Hz to 1 kHz
Stop Offset (upper limit frequency): 100 kHz to 10 MHz
Log Scale Line(10/16):
Sets number of Log scale lines to 10 or 16
Reference Value: Sets upper limit of vertical axis
–140 to –50 dBc/Hz (Log Scale Line: 10)
–170 to –20 dBc/Hz (Log Scale Line: 16)
Phase Noise Measurement Function [Opt-010]
Useful Measurement Functions for Evaluating Tx Characteristics (18/21)

49
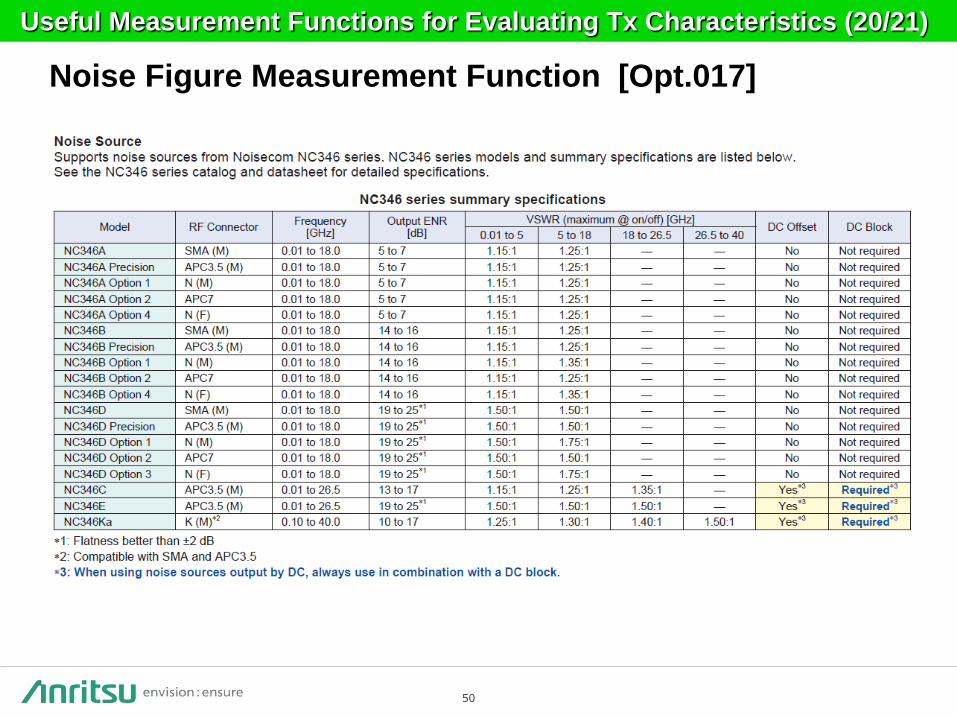
Useful Measurement Functions for Evaluating Tx Characteristics (19/21)
Noise Figure is measured with the measurement method of Y-factor
method which uses a Noise Source. Frequency Mode: Fixed/List/Sweep
DUT Mode: Amplifier
Screen Layout: Graph/Table
Measurement Results Display
■ Graph/List/Spot
Displays measurement results for each trace (Trace 1/Trace 2).
♦ Noise Figure (NF) [dB]
♦ Noise Factor (F) [Linear]
♦ Gain
♦ Y-Factor: Power ratio when Noise Source is turned ON/OFF
♦ T effective: Effective noise temperature
♦ P Hot: Power measured when Noise Source is On.
♦ P Cold: Power measured when Noise Source is Off.
Measurement Result: Example of Graph display
(Frequency Mode: Sweep, Screen Layout: Graph)
Measurement Result: Example of Spot display
(Frequency Mode: Fixed)
Measurement Result: Example of List display
(Frequency Mode: List, Screen Layout: List)
Noise Figure Measurement Function [Opt.017]
50
Useful Measurement Functions for Evaluating Tx Characteristics (20/21)
Noise Figure Measurement Function [Opt.017]

51
Useful Measurement Functions for Evaluating Tx Characteristics (21/21)
Noise Figure Measurement Function [Opt.017]
52
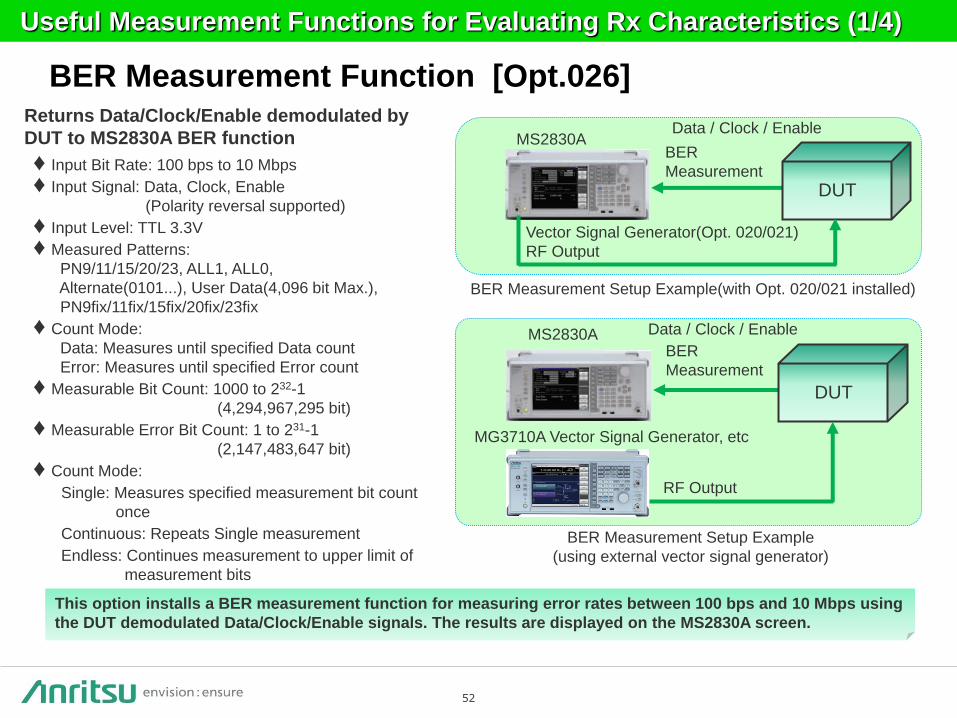
Vector Signal Generator(Opt. 020/021)
RF Output
BER
Measurement
Data / Clock / Enable
DUT
MS2830A
BER Measurement Setup Example(with Opt. 020/021 installed)
This option installs a BER measurement function for measuring error rates between 100 bps and 10 Mbps using
the DUT demodulated Data/Clock/Enable signals. The results are displayed on the MS2830A screen.
Returns Data/Clock/Enable demodulated by
DUT to MS2830A BER function
♦ Input Bit Rate: 100 bps to 10 Mbps
♦ Input Signal: Data, Clock, Enable
(Polarity reversal supported)
♦ Input Level: TTL 3.3V
♦ Measured Patterns:
PN9/11/15/20/23, ALL1, ALL0,
Alternate(0101...), User Data(4,096 bit Max.),
PN9fix/11fix/15fix/20fix/23fix
♦ Count Mode:
Data: Measures until specified Data count
Error: Measures until specified Error count
♦ Measurable Bit Count: 1000 to 232-1
(4,294,967,295 bit)
♦ Measurable Error Bit Count: 1 to 231-1
(2,147,483,647 bit)
♦ Count Mode:
Single: Measures specified measurement bit count
once
Continuous: Repeats Single measurement
Endless: Continues measurement to upper limit of
measurement bits
Useful Measurement Functions for Evaluating Rx Characteristics (1/4)
RF Output
DUT
MG3710A Vector Signal Generator, etc
MS2830A
BER Measurement Setup Example
(using external vector signal generator)
BER
Measurement
Data / Clock / Enable
BER Measurement Function [Opt.026]

53
Clears measurement result
Error Rate
Error Bit
BER Measurement Example
Measure Mode
Count Mode
Data Type
BER Test Start or Stop
Data: Specifies number of measurement bits (default)
Error: Specifies number of measurement error bits
PN9/11/15/20/23, ALL1, ALL0,
Alternate(0101...), User Data,
PN9fix/11fix/15fix/20fix/23fix
Single: Measures selected data patterns until result
reaches specified number of bits or specified
number of error bits
Continuous: Repeats single measurements (default)
Endless: Measures data until result reaches upper limit
of measurement count bit
Measured Bit
Measure Mode Count Mode
Useful Measurement Functions for Evaluating Rx Characteristics (2/4)
BER Measurement Function [Opt.026]

54
Useful Measurement Functions for Evaluating Rx Characteristics (3/4)
At BER measurement, special PN patterns
called PN_Fix patterns can be used. A PN Fix
pattern consists of repeated parts of PN
patterns, and PN patterns with a shorter
length than 1 cycle.
Even when the PN data part of the waveform
pattern output from vector signal generator
has no periodicity, BER measurement is
supported by selecting PN Fix at the BER
measurement function.
[PN Fix pattern]
Setting Range:
96 to 134217728 bit (0 x 8000000)
Resolution: 1 bit
Initial Pattern Pattern Length
BER Measurement Function [Opt.026]

55
BER Measurement Function [Opt.026]
Example of User-Defined Pattern User-Defined Pattern function menu
Loads user-defined patterns from
the USB memory or the internal
hard disk of the MS2830A.
Selects the media among the
USB memory and internal hard
disk from which user-defined
patterns are to be loaded.
Useful Measurement Functions for Evaluating Rx Characteristics (4/4)
The BER measurement can use a user-defined pattern, which is an arbitrary binary string that is 8 to
4096 bits long and consists of a data bit string to determine whether synchronization is established plus
a data bit string used as measurement data. A PC can be used to create a user-defined pattern in text
file format. Load the file from USB memory or MS2830A internal hard disk.
Length: 8 to 4096 (Binary)
Extension: ******.bpn
Saved Folder: the root directory of the USB memory or internal hard disk (Example: D:¥)
[User Defined Pattern]

56
Useful Measurement Functions for Analog Radio (FM, ΦM, AM)
Combining the 3.6 GHz Analog Signal Generator MS2830A-088, MS2830A-018 Audio Analyzer
MS2830A-018 and Analog Measurement Software MX269018A options in the all-in-one
MS2830A main frame supports the simultaneous RF and AF signals required for implementing
key TRx tests of analog(FM, ΦM,AM) radio equipment.
Key Measurement Test Items (FM Radio Equipment)
Tx Test : Tx Power, Tx Frequency, FM Deviation, Microphone input sensitivity, Modulation frequency
characteristics, Distortion, S/N, Tone frequency, Occupied bandwidth (OBW)/Spurious emission or
Unwanted emission strength (White noise (ITU-T G.227) output supported)
Rx Test : Receiving sensitivity (SINAD and NQ method), Bandwidth, AF level, Demodulation frequency
characteristics, Distortion, S/N, Squelch sensitivity
RF Rx test
AF Output
PTT Control
AF
Input
RF Tx test
AF Input
PTT Control
AF
Output
Rx Test Tx Test
By using the spectrum analyzer display
it is possible to measure the spurious
and occupied bandwidth (OBW) while
outputting an AF signal such as white
noise (ITU-T G.227) from the Audio
Analyzer option.
See MX269018A Product Introduction for more details.

57
Software Download Service Software download service This service, which provides updated versions of firmware and software for downloading by product
customers, is available on Anritsu’s website.
User registration can be performed on the Anritsu website:
https://my.anritsu.com/home
User registration is required for using the software download service.
Firmware / Software Contents Available version
MS2830A Software
Installer
MX269000A Standard Software
This software is installed as standard when shipping the
main frame.
Spectrum Analyzer function, Signal Analyzer function, etc.
MX2690xxA series Measurement Software
Measurement software for various communication systems.
The latest version is
available on the website.
MX370100A IQproducer
Installer
MX2699xxA series IQproducer
PC application software used for generating waveform pattern
for various communication systems
The latest version is
available on the website.
Standard waveform
patterns
MX269099A Standard waveform pattern
This waveform pattern is installed as standard when shipping
the MS2830A-020/021 or MS2830A-189.
The latest version is installed when shipping.
Only the updated
waveform pattern is
available on the website.
Download software list

2020-4 MJM No. MS2830A-E-L-1-(16.00)