Embed Size (px)
Citation preview

1
SIGMA
NEWSLETTER An Initiative of
Christ University Institute of Management
By
Lean Operations and Systems Management
In the business world, everyone is paid in two coins: cash and experience.
Take the experience first; the cash will come later.
–Harold Geneen
Volume: 04 Issue: 28 April 2013

2
INSIDE THIS ISSUE
Guru of the Month 03
News 05
Index of industrial production 07
Comparison of supply chain and logistics 09
Mapping the value stream 11
The activity box 14
Thinking cap 15
Crossword 16
3
GURU OF THE MONTH
Sebin Antony
3 MBA N
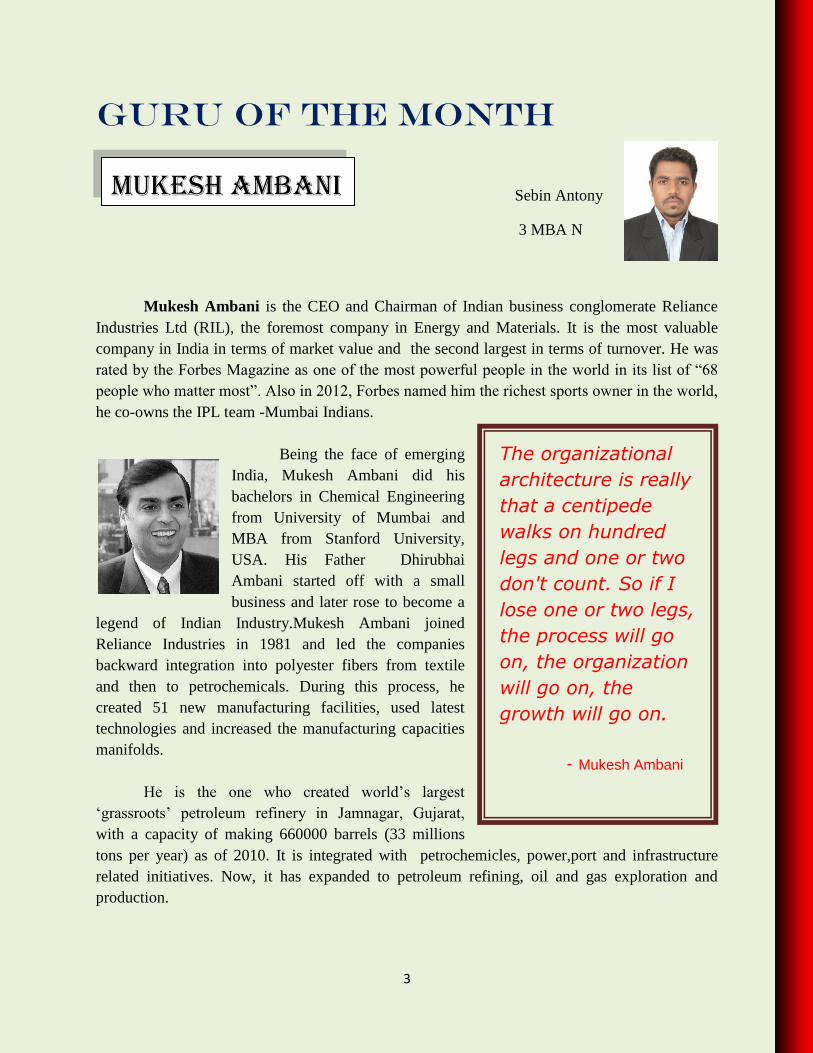
Mukesh Ambani is the CEO and Chairman of Indian business conglomerate Reliance
Industries Ltd (RIL), the foremost company in Energy and Materials. It is the most valuable
company in India in terms of market value and the second largest in terms of turnover. He was
rated by the Forbes Magazine as one of the most powerful people in the world in its list of “68
people who matter most”. Also in 2012, Forbes named him the richest sports owner in the world,
he co-owns the IPL team -Mumbai Indians.
Being the face of emerging
India, Mukesh Ambani did his
bachelors in Chemical Engineering
from University of Mumbai and
MBA from Stanford University,
USA. His Father Dhirubhai
Ambani started off with a small
business and later rose to become a
legend of Indian Industry.Mukesh Ambani joined
Reliance Industries in 1981 and led the companies
backward integration into polyester fibers from textile
and then to petrochemicals. During this process, he
created 51 new manufacturing facilities, used latest
technologies and increased the manufacturing capacities
manifolds.
He is the one who created world’s largest
‘grassroots’ petroleum refinery in Jamnagar, Gujarat,
with a capacity of making 660000 barrels (33 millions
tons per year) as of 2010. It is integrated with petrochemicles, power,port and infrastructure
related initiatives. Now, it has expanded to petroleum refining, oil and gas exploration and
production.
MUKESH AMBANI
The organizational
architecture is really
that a centipede
walks on hundred
legs and one or two
don't count. So if I
lose one or two legs,
the process will go
on, the organization
will go on, the
growth will go on.
- Mukesh Ambani

4
Mukesh Ambani also created his fathers dream
project India’s largest private telecom company Reliance
Infocom ( Reliance communications) with his brother Anil
Ambani. It is now under Anil after the reliance empire
split. He also started Reliance Retail stores and entered into
the emerging retail market of the country with his brand of
Reliance Trends and Reliance Fresh. Recently he was in
talks with the Harayana government for setting up SEZ (
Special economic zone) with an investment running into
thousands of crores of rupees.
Mukesh Ambani is the chairman of Indian Institute of Management, Bangalore;
Managing Director, Chairman of Finance Committee and Member of Employees Stock
Compensation Committee of Reliance Industries Limited; Chairman of the Board, Reliance
Petroleum; Chairman of Audit Committee, Reliance Retail Limited; Chairman, Reliance
Exploration and Production DMCC ; Director, Member of Credit Committee and Member of
Compensation & Benefits Committee, Bank of America Corporation and also the President of
Pandit Deendayal Petroleum University, Gandhinagar, Gujarat.
He has been awarded with many accolade. He was chosen as the business leader of the
year 2010 by NDTV India; Business man of the year 2010 by financial chronicles and ET
business leader of the year 2006. Mukesh Ambani was also conferred the Asia Society
Leadership Award by the Asia Society, Washington D.C., USA and Global leadership award by
Business Council for international understanding in the year 2010.
As of 2013 he is the richest man in India, and he retained the position of world’s richest
Indian for sixth year in a row. He is also listed as world’s 22nd richest man in the world with a
personal wealth of $21.6 Billion.
Mukesh Ambani is married to Nita Ambani and has three children. He has the world’s
most expensive home called Antilla, which is a 27 storey home worth $2 billion, built in South
Mumbai.

5
NEWs
Kunal Singh 3MBA K
New Energy Storage method developed
by Canadian Researchers
Energy is present in the form of Kinetic energy and Potential energy
which can be stored by a device or physical media, sometimes called as an accumulator.
Canadian researchers, at university of Calgary have developed a Ground Breaking Method to
store energy which is created by wind turbines and solar panels to perform useful operations at a
later time. This is an inexpensive method of storing and reusing electricity produced by wind
turbine. It is developed to realize clean energy economy and opens new field of catalytic
materials. This method uses electrolysers for storage purpose. Electrolysers use catalysts to
create a chemical reaction that converts electricity into energy by splitting water into hydrogen
and oxygen, which can then be stored and reconverted to electricity for use whenever needed.
One of the catalysts used is rust that captures energy through electrolysis of water.
Source: http://www.thehindubusinessline.com/news/science/canadian-researchers-develop-energy-storage-
system/article4564282.ece
Scientists unlock key genetics codes of wheat
China is the largest wheat producer in the world followed by India and US. A
research has been conducted by a team from Institute of Genetics and Development Biology
(under the Chinese Academy of Sciences), and the University of California to map key genetic
code for bread wheat that helps in improving crop’s productivity and ability to sustain in extreme
conditions. Bread wheat is one of the most widely consumed crops in the world which feeds
around 40% of the world population. State-run Xinhua news agency has reported that around
38,000 wheat genes is expected to help provide a valuable resource for accelerating deeper
genomic breeding studies and offer a new foundation for the study of wheat evolution,
domestication and genetic improvement. This development of genetic diversity will encourage
the efforts made to increase crops yield, improve quality and provide resistance to cold, drought
and disease. However, the extremely large size and polyploidy complexity of the wheat genome
have so far posed substantial barriers for researchers to gain insight into its biology and
evolution.
Source: http://www.thehindubusinessline.com/news/international/scientists-unlock-key-genetic-code-of-
wheat/article4547021.ece

6
HP Launches ‘Project Moonshot’ Low-power server
HP has launched a new low-power server called Project Moonshot — terminology
that should conjure images of Google Glass and a self-driving car — and it's said to be the result
of more than ten years of research. Having a server size of a hardcover book, Moonshot uses 89
percent less energy than traditional servers that are currently being used while taking up 80
percent less space and costing 77 percent less. Moonshot is build with graphics processors
available in customizable ARM-based designs to use flash or hard-drive storage. HP’s target
market is social media, cloud, and mobile services from data centers. Though, companies like
Google and Facebook have already opted to build their own servers. Project Moonshot may be a
cold play for them. Moonshot is a company’s attempt to overcome its mistakes of a decrease of
15 percent in revenues year-over-year, highlighted by four different CEOs, a mishandled
purchase of Palm and an $8.8 billion write down on its acquisition of Autonomy.
Source: http://www.theverge.com/2013/4/8/4196598/hp-turnaround-focused-on-project-moonshot-low-power-
server
Biofuels are unethical and harm the environment
according to report
An independent study conducted by Nuffield Council of Bioethics, Headquarter in UK
reveals that production of biofuel violates human rights, increases deforestation and is a threat to
endangered species because of which legal requirements to put biofuels in petrol and diesel are
unethical. Biofuels should be environmentally sustainable and contribute to a reduction of
greenhouse gas emissions. Costs and benefits should be distributed in an equitable way thereby
adhering to fair trade principles. Inquiry also demonstrates that European Renewable Energy
policy is particularly weak when it comes to protecting the environment, reducing greenhouse
gas emissions and avoiding human rights violations in developing countries. Researchers are on
the verge to develop new types of biofuels which require less land and produce fewer greenhouse
gases. The two main transport biofuels currently in use are bio-ethanol, made from maize and
sugar cane, and biodiesel, made from palm and rape seed oil.
Source: http://www.manufacturingdigital.com/people_skills/biofuels-are-unethical-and-harm-the-environment-
according-to-report
7
Ravi Krishna Srihasam
3MBA – M
IN DEX OF INDUSTRIAL
PRODUCTION
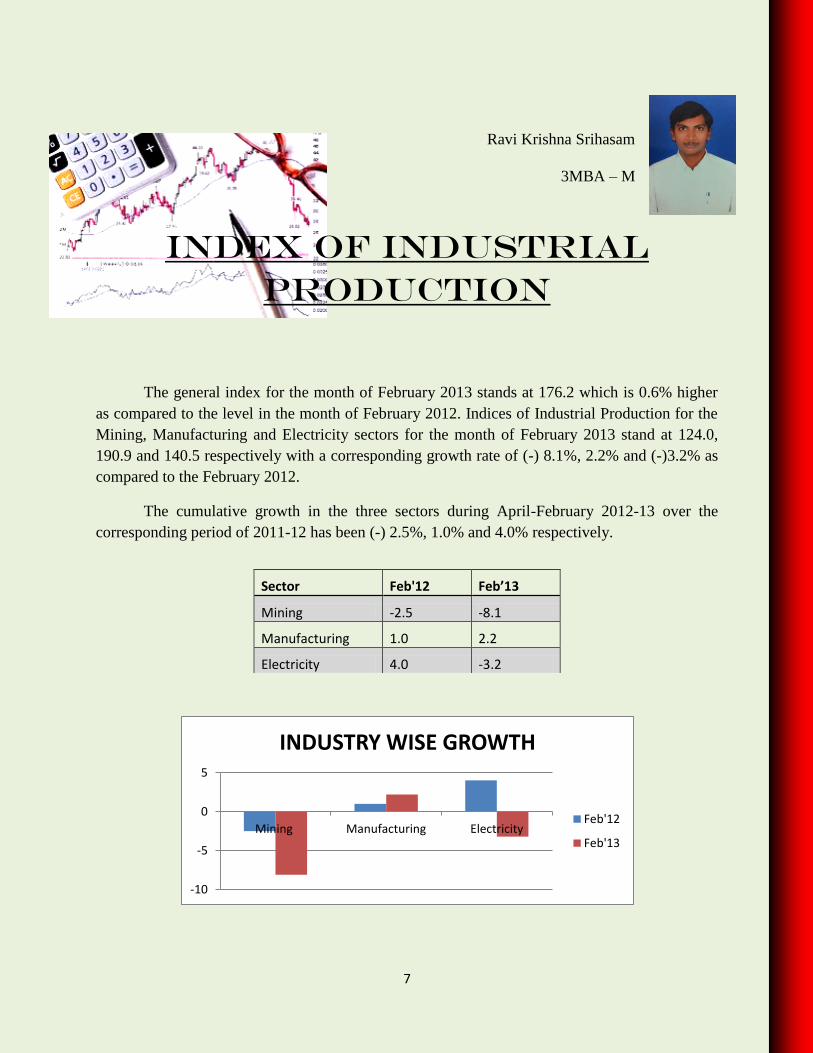
The general index for the month of February 2013 stands at 176.2 which is 0.6% higher
as compared to the level in the month of February 2012. Indices of Industrial Production for the
Mining, Manufacturing and Electricity sectors for the month of February 2013 stand at 124.0,
190.9 and 140.5 respectively with a corresponding growth rate of (-) 8.1%, 2.2% and (-)3.2% as
compared to the February 2012.
The cumulative growth in the three sectors during April-February 2012-13 over the
corresponding period of 2011-12 has been (-) 2.5%, 1.0% and 4.0% respectively.
-10
-5
0
5
Mining Manufacturing Electricity
INDUSTRY WISE GROWTH
Feb'12
Feb'13
Sector Feb'12 Feb’13
Mining -2.5 -8.1
Manufacturing 1.0 2.2
Electricity 4.0 -3.2

8
The growth rates in February 2013 over February 2012 are (-)1.8% in Basic goods, 9.5%
in Capital goods and (-)0.7% in Intermediate goods. The Consumer durables and Consumer non-
durables have recorded growth of (-) 2.7% and 2.9% respectively, with the overall growth in
Consumer goods being 0.5%.
Sector Feb’13
Basic Goods -1.8
Capital Goods 9.5
Intermediaries -0.7
Consumer Durables -2.7
-10
-8
-6
-4
-2
0
2
4
6
8
10
12
Basic Goods Captial Goods Intermediaries Consumer Durables
SECTOR WISE GROWTH
Feb'13

9
COMPARISON OF SUPPLY CHAIN AND
LOGISTICS
HEMANTH R
1221013
The terms "supply chain" and "logistics" are often used interchangeably within the
transportation industry. They are, however, distinct areas, each involving specific processes,
duties and responsibilities. The confusion in distinguishing between supply chain and logistics
might stem from the fact that logistics is considered by many people to be a subcategory of
supply chain management. The main difference between supply chain and logistics is that
logistics is merely a specialized part of the entire supply chain process.
Generally, logistics focuses on the actual transportation and storage of goods. It deals
with things such as inbound and outbound freight; reverse shipping, communications during
transit, storage and warehousing. Logistics also deals with the delivery of goods and freight,
coordination among third-party carriers, fleet management and other activities directly related to
the actual transportation of goods from one point to another. Depending on the needs of a
particular company, logistics management might also encompass manufacture and packaging,
price negotiation for different aspects of transportation, third-party integration and procurement,
technology, communications and customer service.
For the most part, supply chain encompasses a bigger picture. Supply chain management
is the umbrella that covers all aspects of the sourcing and procurement of goods. Basically,
supply chain management forms and manages the business-to-business links that allow for the
ultimate sale of goods to consumers. Logistics, basically getting the freight from one place to the
other, is a function that falls under the wide umbrella of supply chain management, but is only
one part of the entire process.
Supply chain management is a broad, integrating process that entails many other aspects
aside from logistics. Those aspects include finding and obtaining the goods to sell, negotiating
pricing, manufacturing, storage, packaging and inventory control. Supply chain management also

10
includes distribution, cost allocation and control, third-party negotiation and collaboration as
well as management of supply and demand. The broad territory covered by supply chain
management is why some of these processes have splintered off into another subcategory of
supply chain management known as demand planning, which, like logistics, can be viewed as a
separate but related area of expertise.
The details and precise definitions for both the process of supply chain and logistics will
vary from company to company and will overlap to certain degrees. By necessity, many of the
duties and responsibilities pertaining to logistics management will cross over into supply chain
management, and vice versa. Depending on the size and specialization of a particular company,
the two areas might be lumped together as one, and the same individual might manage both
the supply chain and logistics. Any person seeking to become involved in either
supply chain management or logistics management within a company should ensure that the
parameters of his or her responsibilities are clearly defined.
COMIC: Dilbert

11
MAPPING THE VALUE STREAM
ABHISHEK SINGH
MBA J
EXECUTIVE SUMMARY
This article outlines a tool – value stream mapping (VSM) – that will help industrial
engineers enlighten managers, who still support obese manufacturing techniques and allow them
to see the light of lean manufacturing. VSM is a map that outlines the current and future state of
a production system, allowing users to understand where they are and what wasteful acts need to
be eliminated. The user then applies lean manufacturing principles for transition to the future
state. VSM is an outline of a product's manufacturing life cycle that identifies each step
throughout the production process. This will help to design and introduce a lean value stream
that optimizes the flow of the entire system - from information, to material, to finished goods
arriving at the customer's door.
LEARNINGS
The value stream includes the value-adding and non value-adding activities that are required
to bring a product from raw material through delivery to the customer. In other words, VSM
is an outline of a products manufacturing life cycle that identifies each step throughout the
production process.
Mapping the value stream is a big-picture technique that takes into consideration all
processes and seeks to improve the enterprise as a whole.
The overall goal of VSM is to move from batch and push to one-piece flow and pull through
the entire value stream. The ultimate goal is to design and introduce a lean value stream that
optimizes the flow of the entire system - from information, to material, to finished goods
arriving at the customer's door. Lead-time, inventory, and over-production are therefore
reduced; throughput, efficiency, and quality are improved.
The importance of takt time lies in the goal of producing one unit just in time to replace a
unit used by the customer - in other words, a cycle time based on one-piece flow. If cycle
time exceeds takt time, the process will generate WIP, waiting, excess motion, damage, and
other waste.

12
CURRENT STATE
1. The basis of lean manufacturing is product families. Everything in a lean organization
(machines, R&D, marketing, engineering, and even maintenance) is organized around
specific product families.
2. Fill in the data box with a list of customer requirements (value stream is based upon product
families) such as units per day, number of shifts, complexity breakout, and other production
information.
3. Outlining the basic supplier production process. Use a process box on the left side of the map
to represent suppliers.
4. Connect all the icons with information flow icons. Draw the appropriate icon based on the
type of information flow.
5. Internal mapping, the best place to start is in the shipping department. The team should break
into small groups and document the process in reverse order. Working in reverse allows a
better understanding of the flow and build of a product. Information needed from the
production floor includes all machines, processes, WIP, inventory (raw and finished), and all
cycle times within each process.
6. Identify waste.
7. Now that the current state of the value stream has been mapped, waste throughout the stream
must be identified and eliminated to shorten lead-time and improve the value-added
percentage - in other words, to transform the production system from a batch and push into a
one-piece flow and pull. VSM allows the user to see the waste throughout the stream and
imagine a future state that more closely resembles lean. However, the only way to identify
the waste is to understand the seven elements that do not contribute to the value of the
product: Overproduction, Inventory, Transportation, Waiting, Motion, Over-processing, and
Correction (re-work).
FUTURE STATE
1. The first step requires the calculation of takt time. Takt time is the number of units required
by the customer per unit of time. To calculate takt time, use the following formula: takt time
= (net operating time / period) / (customer requirements / period). Note that takt time is not
cycle time. However, for a lean process, cycle time plus a small efficiency standard should
equal takt time.
13
2. The continuous flow can proceed at a pace that guarantees takt time to be met. WIP, excess
waiting, material handling, and over-processing are eliminated with continuous flow.
3. Once the future state is drawn, analyze the waste throughout the process and re-evaluate the
map. Repeat this process as necessary during the event and over time after the event.
4. The extended value stream plan involves kaizen and re-evaluation of the future state once it
has been implemented. The extended plan will also involve redefining the metrics used to
evaluate the production system. This plan involves expanding the mapping events to all
product families within an organization. Once this is accomplished, start working on VSM
with suppliers. Huge amounts of waste can be eliminated through collaboration or joint
ventures.
REFERENCE:
Jared Lovelle. IIE Solutions
COMIC: Dilbert

14
Six Sigma: When ‘Green’ became more than just a
colour to us
Abhishek Vatsa
3MBA I
It’s only the dedication of our esteemed faculty members of the department, under the
able guidance of HOD G. Ramachandran sir that we were able to pull off a 3-day “six sigma
green belt ready workshop” amidst our already packed schedule of endless activities ranging
from business analysis classes, live projects to our final exams scheduled to begin just 10 days
after the conclusion of the workshop. The workshop started on 7th
March 2013 which got
concluded on 10th
March 2013.
The workshop from the very start was focussed on getting
the practical understanding of the concepts right. The most
widespread misconception of six sigma being a “silver bullet” was
thrashed in the first few hours itself. It’s a universally accepted fact
that change is the only thing which is constant, the six sigma
implementation works towards making that change inclusive &
sustainable via delivery of desired outcomes at every level of the process. We were clear by the
first day that six sigma focuses on taking the quantum leap.
The second day, we were introduced to various jargons & way to handle a project of six
sigma, right from the planning & putting that plan on a project charter. The clear definition of
what can be achieved & what cannot be achieved through the project is very critical to the
success of the project. All this comes under the first of the five step process of DMAIC (Define,
Measure, Analyse, Improve, and Control) i.e. define phase.
The measure phase focussed on the correct method & accuracy of the data collection,
with the answers of the basic questions like what, when, where, Why, How data collection plan
is to be executed, we were a little more confident of our skills on handling of a project. Analyse
phase mainly aimed at develop & design alternatives with the help of spectrum of tools.
Improve phase aims at optimization of the current process in place again using a number
of optimization techniques, which is not only limited to the theoretical paradigm but also
includes running a pilot to establish process capability.
Finally, control phase ensures that the established process results in zero defect & the
process itself becomes robust enough to eliminate any deviations before it results in a defect.
Upon the completion of the workshop, we all were subjected to a small test to judge our
conceptual understanding of six sigma, which seemed like a cakewalk after the wonderful
illustration by our trainers.
THE
ACTIVITY
BOX

15
THINKING CAP
Mayank Kumar Gupta
3 MBA-M
1. India has concluded a $6 billion missile deal with which country on 14th
Feb’13?
2. What is called as the average of errors made by the forecast over a period of time without
considering the direction of error?
3. Which manufacturing company is likely to have the most complex inventory decisions?
4. Cost minimization is an appropriate strategy in __________ stage of the product life
cycle.
5. What all are the major categories of costs associated with quality?
6. Gujarat has been ranked on top for attracting investment across the country -- cornering
about 14 per cent of total outstanding private sector investment worth over Rs 75 lakh
crore as of December 2012. Which Indian state was ranked 2nd after Gujarat?
7. 9 states and 1 union territory have signed tripartite agreements with the Centre and Bharat
Broadband Network to lay “optical fibre network” for providing broadband services at
gram panchayat level. Which are those states & union territory?
8. Infosys Ltd. has marked its biggest percentage loss since April 2003 as investor sentiment
turned bearish on lower-than-expected dollar revenue growth forecast for the current
fiscal. By what percentage has Infosys Ltd. plunged?
9. In the use of relationship charts for office layouts, the code "U" meaning the closeness
between two departments is ______________.
10. The process of deciding how to assign tasks to work stations in a product layout is
referred as _________________.

16
S.Ravi Krishna 3 MBA M
Across 3. When the quantity at hand of an item drops to this amount, the items are ordered.
7. A document that holds the information regarding the stock level in the stock room.
8. Also called as 80-20 chart.
9. ____ Ohno identified the 7 mudas.
Down
1. One of the 5S.
2. A routing of supply or delivery vehicle to make multiple pickups or drops at different
locations on a regular basis.
4. A system in which two containers are maintained and reordering is done when the first is
empty.
5. A tool to identify, estimate, prioritize and evaluate the risk of possible failures in a process.
6. Japanese word for continuous improvement.
8. US Navy first used this tool to evaluate its Polaris missile.
1 2
3 4
5
6
7
8
9
Ec lipseCrossword.com

17
Answers for Thinking Cap:
1. France
2. Mean Absolute Deviation
3. Computer manufacturing company
4. Decline
5. Prevention costs, appraisal costs, internal failure costs & external failure costs.
6. Odisha
7. Assam, Bihar, Gujarat, Himachal Pradesh, Jammu & Kashmir, Maharashtra,
Nagaland, Odisha, Punjab & Andaman and Nicobar islands.
8. 20 %
9. Unimportant
10. Line balancing.
Solution for Crossword
Across 3. REORDER POINT—When the quantity at hand of an item drops to this amount, the items
are ordered
7. BIN CARD—A document that holds the information regarding the stock level in the stock
room
8. PARETO CHART—Also called as 80-20 chart.
9. TAIICHI—--- Ohno identified the 7 mudas
Down
1. SEIRU—One of the 5S
2. MILK RUN—A routing of supply or delivery vehicle to make multiple pickups or drops at
different locations on a regular basis
4. TWO BIN SYSTEM—A system in which two containers are maintained and reordering is
done when the first is empty.
5. FMEA—A tool to identify, estimate, prioritize and evaluate the risk of possible failures in a
process
6. KAIZEN—Japanese word for continuous improvement
8. PERT—US Navy first used this tool to evaluate its Polaris missile

18
SIGMA NEWSLETTER TEAM
Designer: Jerry Joseph
Coordinator: Apurvaa V.S
Editor: Remy a Balakrishnan
Article: Ajay Mihani
Feedback and Suggestions: [email protected]
Contact Us: Christ University Institute of Management
Hosur Road
Bangalore-560029
www.christuniversity.in
FOR INTERNAL CIRCULATION ONLY