Embed Size (px)
Citation preview

Corporate Profile
April 2011
ShriramCity Union Finance Limited
SHRIRAM CITY UNION FINANCE LIMITED

Corporate profile
1 Corporate History and Company Overview
2 Financial performance over the years
3 Unique positioning and analysis
4 Competitive positioning
5 Shriram Group Eco-System
6 Future Growth

Company Overview

ShriramCity – Company Overview
ShriramCity is a major organized lender in
the Retail and Micro & small enterprises
credit space with leading market share in the
southern region.
Strategically present in multiple products,
with expertise in loan origination, valuation
and collection.
Unique access on Shriram Eco-system, viz.
Shriram Chits and Shriram Transport, which
provide a massive infrastructure, built over
time to ensure better financial productivity.
Large customer base of 3.55 million and
growing everyday.
Eminent Board and experienced management
team.
Listed on National Stock Exchange and
Bombay Stock Exchange with a market cap of
Rs. 25 Billion
Capital infusion by pedigree investors – ICICI
Ventures, Bessemer and Chrys Capital and
TPG
Large distribution network and AUM
Pan India presence through a network of over
1000 branches (includes 350 locations
offering only loan against gold)
Over 10000+ dedicated workforce
Total AUM of Rs. 71.29 billion as at Dec
2010
Company overview
Last twelve months share price performance
300
350
400
450
500
550
600
650
700
750
31-Mar-10 30-Jun-10 29-Sep-10 29-Dec-10 31-Mar-11
Shar
e p
rice
in R
up
ee
s(r
eb
ase
d to
SC
UF)
Shriram City Union SENSEX
CMP – Rs. 503 (31-Mar-11)Mcap – 2,491 crores

Corporate History
ShriramCitywas established
2005
1st preferential Allotment of equity shares to PE Investors @ Rs. 160/- per share
1986
Focus on Retail Financing
Listed on National Stock Exchange
2006
2nd preferential Allotment of equityshares to Private Equity Investors @ Rs.400/- per share. TPG invests in theholding Company
2008
2010
ShriramCity’s Net Worth touchesRs. 1000 Crore
2007
Launches – Small Business Loans
Launches Loan Against gold
2003 Listed on Bombay Stock Exchange

Vision platform
Our Mission “Striving to serve the largest number of common people”
Brand Promise “Trusted brand built over four decades”
Values Trustworthy
We are one of the
most trusted brands
in India
Responsive
We deliver
thoughtful, timely
and high quality
solutions to empower
common man
Creative
We continuously
improve the way
we work
Bold
We are not afraid
of venturing into
uncharted
territories
Competitive
Positioning
Delivery
Collaborating to combine
our group‟s network and
capabilities to provide
innovative & cost
effective solutions
Customers
We build long term
personal relationship with
our customers… Striving
to bring prosperity to their
lives
Discipline
Disciplined approach
towards wealth creation,
for all our stakeholders
balancing risk and rewards
Commitment to
stakeholders
Our people
Dedicated
workforce with an
extra ordinary
employee retention
Communities
Trusted and
caring.. Growth
through inclusion
Investors
Proven track
record, delivering
consistently
superior returns
Regulators
Demonstrating
exemplary ethical
and governance
standards

Strong Business Model
Retail and Small Business Loans financing Model
Small Business Loans Retail Loans
Personal LoansTwo wheeler
LoansAuto Loans
Localized
Presence
Field force drawn locally
Advantage of domain knowledge & personal knowledge of the customers
Quick Credit
Approvals
Centralized broad policy formulation; Decentralized decision making authority
Speedy approvals - superior turn around time in loan processing
Collection /
Recovery skills
Credit team responsible for monitoring early warning signals
Deal originators being responsible for the portfolio quality
No outsourcing
Focus Market 80% of the branch network focuses on rural and semi - urban areas
Pan India presence with an existing concentration in South India; expanding into other geographies
Origination & credit evaluation through own team
Loan against gold
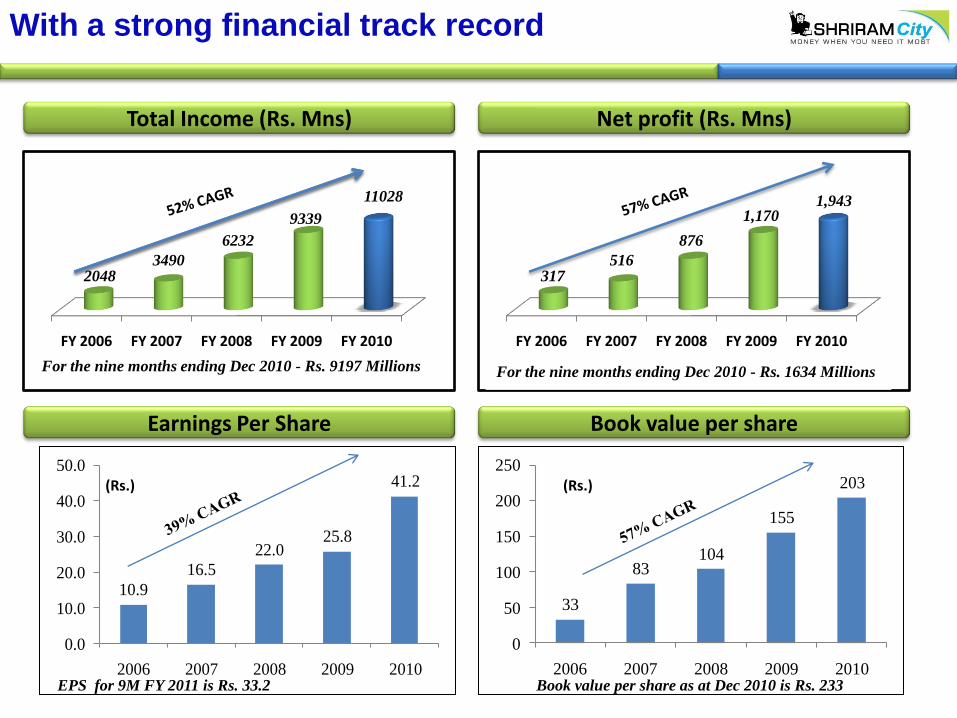
With a strong financial track record
Total Income (Rs. Mns) Net profit (Rs. Mns)
Earnings Per Share Book value per share
10.9
16.5
22.025.8
41.2
0.0
10.0
20.0
30.0
40.0
50.0
2006 2007 2008 2009 2010
33
83104
155
203
0
50
100
150
200
250
2006 2007 2008 2009 2010EPS for 9M FY 2011 is Rs. 33.2 Book value per share as at Dec 2010 is Rs. 233
(Rs. Mns)
(Rs.) (Rs.)
FY 2006 FY 2007 FY 2008 FY 2009 FY 2010
2048 3490
6232
9339
11028
For the nine months ending Dec 2010 - Rs. 9197 Millions
FY 2006 FY 2007 FY 2008 FY 2009 FY 2010
317516
876
1,1701,943
As at Half year ending SeptFor the nine months ending Dec 2010 - Rs. 1634 Millions
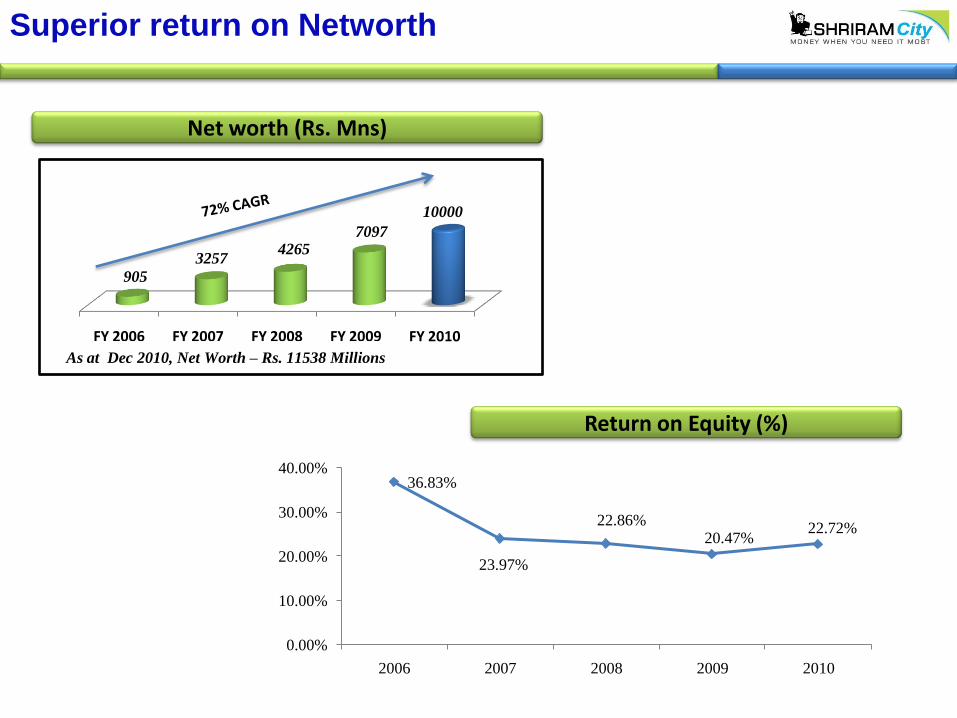
Superior return on Networth
Net worth (Rs. Mns)
Return on Equity (%)
36.83%
23.97%
22.86%20.47%
22.72%
0.00%
10.00%
20.00%
30.00%
40.00%
2006 2007 2008 2009 2010
FY 2006 FY 2007 FY 2008 FY 2009 FY 2010
905
3257 4265
7097
10000
As at Dec 2010, Net Worth – Rs. 11538 Millions
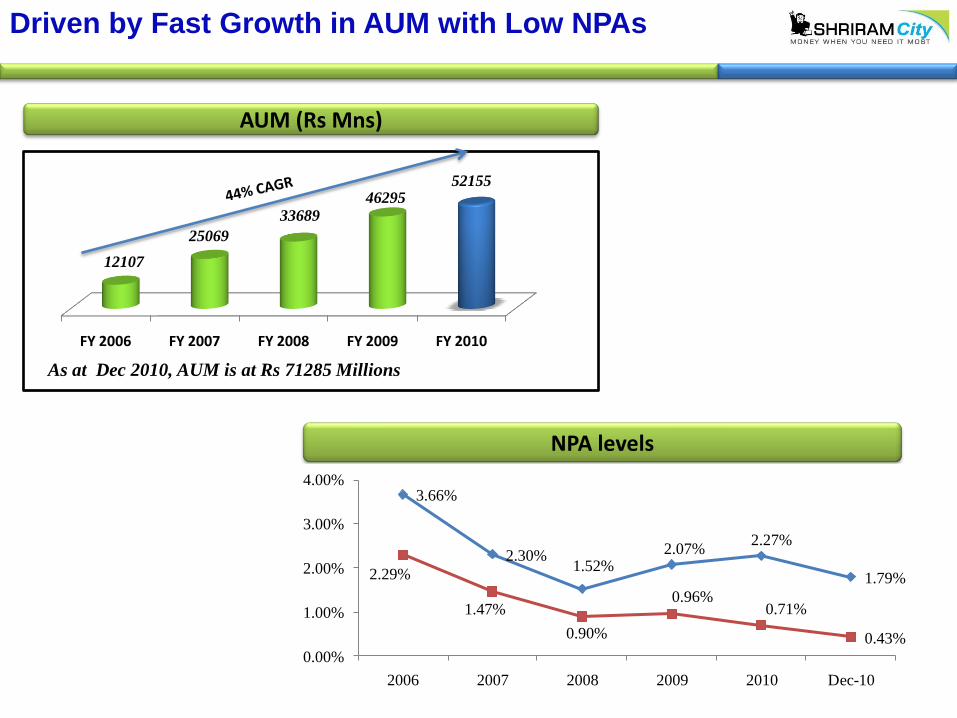
Driven by Fast Growth in AUM with Low NPAs
AUM (Rs Mns)
NPA levels
3.66%
2.30%1.52%
2.07%2.27%
1.79%2.29%
1.47%
0.90%
0.96%0.71%
0.43%
0.00%
1.00%
2.00%
3.00%
4.00%
2006 2007 2008 2009 2010 Dec-10
FY 2006 FY 2007 FY 2008 FY 2009 FY 2010
12107
25069
33689
46295 52155
As at Dec 2010, AUM is at Rs 71285 Millions

Strengths of ShriramCity

Why ShriramCity
Diversified Product Portfolio
Seasoned Credit Policy & Process
Well developed & large infrastructure and Pan India Presence
Healthy Asset Quality & strong profitability
Best in Class – Corporate Governance
1
3
2
4
7
Strong management backed by eminent board 8
Has attracted Quality Investors5
Optimum borrowing mix6
Sound risk management systems9

1. Diversified Product Portfolio
A Balanced Mix of High Yield and Low Risk Portfolio
Split of AUM – Rs 71.29 billion
Loans to Small Business Units
Key financials (9M FY 2011)
Average Tenor: 36 Months
Average Yield: 22 – 24%
Disbursement: 9809 Mn
Retail Loans
Personal Loans
Key financials (9M FY 2011)
Average Tenor : 30 Months
Average Yield: 24 – 27%
Disbursement: 3832 Mn
Two Wheelers
Key financials (9M FY 2011)
Average Tenor: 24 Months
Average Yield: 24 – 26%
Disbursement: 9973 Mn
Auto Loans
Key financials (9M FY 2011)
Average Tenor : 30 months
Average Yield: 22 – 24%
Disbursement: 7873 Mns
29% 15% 10%
21%
Gold Loans
Key financials (9M FY 2011)
Average Tenor : 4 Months
Average Yield: 18- 20%
Disbursement: 22778 Mn
25%

Seasoning of Product Portfolio
Note: CAGR calculated on the disbursement in the month of launch and disbursement for the month of March 2010
Dec 2002Two
wheeler
Oct 2005Auto Loans
Dec 2005Small
Business Loans
Jan 2006Personal
Loans
Oct 2006Loan
Against Gold
CAGR 71%
CAGR 399%
CAGR 97%
CAGR 399%
CAGR 525%
Avg Tenor-
24 Months
Avg Tenor-
30 Months
Avg Tenor-
35 Months
Avg Tenor-
24 Months
Avg Tenor- 4 Months

Business concentration has been to Southern India, however now the Company is expanding into other geographies
The Company slowly introduces all its products after a thorough study of the location and demand for products
As a policy, every business location has to offer the entire range of the Company‟s product in due course
Around 200 business outlets are yet to introduce the complete range of products.
The Company plans to extend all the products to 650 outlets by March 2012.
2 Pan India Presence
Branch Network is Adequately Capturing Growth Corridors of the Country
Presence (1-10 branches)
Deep penetration (>50 branches)
18
4
650 branches
112
6
1
1
1
19
25
12
9 11
205
166
91
68
No Presence
Some presence (10-50 branches)
Points of Business of Company State wise GDP Growth FY05-09*State wise FY09 GDP contribution*
7.5%
Contributes: 1-2%
Contributes > 5%
Contributes: <1%
Contributes 2-5%
0.1%
1.6%3.1%
1.6%
0.4%
6.8%
3.3%
0.8%
0.7%
1.6%
5.4%
4.0%
13.3%
3.3%
0.1%0.2%
0.1%
2.5%
3.1%
4.3%0.1%
6.8%
0.3%
8.1%
0.8%
7.1%
0.1%
0.3%
3.5%
0.2%
9.3%
Growth: 4 - 6%
Growth: >9%
Growth: 0-4%
Growth: 6-9%
5.2%
12.2%
10.7%
11.8%
10.0%
8.4%
6.2%
9.7%
9.6%
5.5% 5.0%
9.4%
6.3%
9.0%
8.0%
5.2%
6.5%
7.4%
8.8%
11.5%
12.9%
19.0%
6.7%
7.9%
5.4%
5.6%
8.4%
10.9%
7.8%
*Source: MOSPI; GDP split and growth at constant prices 1999-2000

3 Seasoned Credit Policy & Process
Credit team responsible for monitoring early warning signals
Proprietary integrated ERP – Linking business from the origination point to the final accounts
Average LTV lower/ equal to the industry average
Immovable assets & personal guarantees as collateral for personal & small business loans
Centralized broad policy formulation
Decentralized decision making authority
Speedy approvals -superior turn around time in loan processing
Pre lending Field Investigation (FI) & the post lending appraisal by dedicated teams
Origination & credit evaluation through own team
Deal originators being responsible for the portfolio quality
Systematized Controls Loan to
Value (LTV)
Quick Credit Approvals
FI & Post Lending Verification
“No Outsourcing
” Policy
Credit policy & process
Assigning Responsibility

4 Healthy Asset Quality
Enables decentralized decision making
Ensures quick turn around time
Systematized controls
Well defined incentive plan for field
officers to ensure low default rates
50% of the compensation is by way of
performance based incentives.
3.66%
2.30%1.52%
2.07%2.27%
1.79%2.29%
1.47%
0.90%
0.96%0.71%
0.43%
2006 2007 2008 2009 2010 Dec-10
38%
37%
41%
54%
69% 74%
2006 2007 2008 2009 2010 Dec-10
Deal originators being responsible for
monitoring early warning signals
Customized repayment structures
Localized presence – field force being
drawn locally.
Prudent Credit norms
Reasons for Low Delinquency
Incentive Schemes
Asset Quality
Asset Coverage Ratio

…and Strong Profitability
Spread Analysis FY 2006 FY 2007 FY 2008 FY 2009 FY 2010 Dec-10
Interest from Financing Operations /
Average AUM 18.0% 18.0% 20.8% 23.1% 21.8% 20.11%
Interest Expenses / Average AUM 8.9% 7.1% 8.5% 10.8% 9.4% 7.78%
Gross Spread 9.1% 10.9% 12.3% 12.3% 12.4% 12.33%
OPEX / Average AUM 4.0% 6.1% 6.6% 6.2% 4.8% 5.31%
Provisions & Write offs **/ Average
AUM 1.5% 1.3% 1.7% 1.9% 2.4% 1.99%
Net Spread 3.6% 3.5% 3.9% 4.2% 5.2% 5.03%
** Provisions include the standard assets provisioning @ 0.25%
4

…Has attracted Strong Interest from Quality Investors
Directly & Indirectly PE Investors hold 64% in ShriramCity
Key Shareholder*
Shareholding
(millions) % of o/s
Shriram Enterprise Holdings* 17.92 36.2
Shriram Retail Holdings* 8.56 17.3
Van Gogh Ltd (Chrys Capital) 6.63 13.4
Norwest Venture Partners 4.34 8.8
IDBI Trusteeship (ICICI Ventures) 3.70 7.5
Bessemer Venture Partners 2.50 5.1
Acacia Partners LP 1.56 3.1
Asiabridge Fund LLC 1.18 2.4
Acacia Institutional 0.54 1.1
Others 2.54 5.2
Total 49.46 100.0
Consistent track record and high
growth potential has attracted reputed
institutional and Private Equity
investors to infuse growth capital
Details of Shares capital issues
Asia Bridge - Invested in May „08 @ Rs. 400/- per share [0.58 mn shares]
Bessemer Venture partners - Invested in May „08 @ Rs. 400/- per share [1.25 mn shares]
Chrys Capital - Dec ‟06 @ Rs.160/-and May „08 @ Rs. 400/- per share. [6.625 mn shares in total]
ICICI Ventures - Invested in May „08 –Rs. 400/- per share [0.75 mn shares]
Norwest Venture Partners - July „09 –Secondary Market Purchase
Capital Adequacy ratio as of December
31, 2010: 21.01%
* TPG has stake in Shriram Enterprise Holdings and Shriram Retail Holdings
5
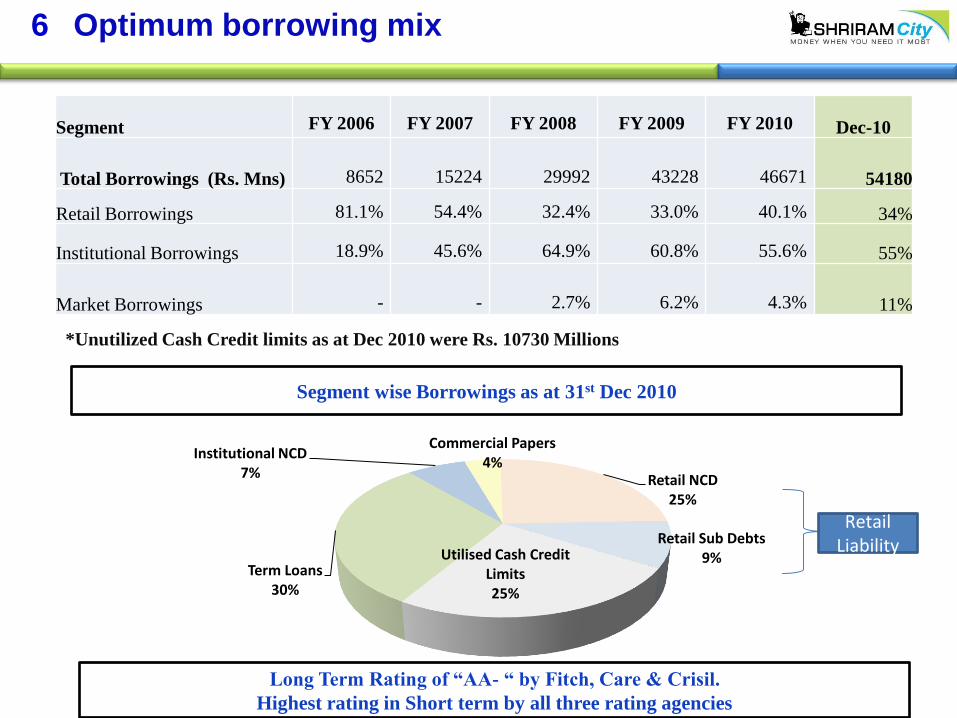
Optimum borrowing mix
Segment wise Borrowings as at 31st Dec 2010
Segment FY 2006 FY 2007 FY 2008 FY 2009 FY 2010 Dec-10
Total Borrowings (Rs. Mns) 8652 15224 29992 43228 46671 54180
Retail Borrowings 81.1% 54.4% 32.4% 33.0% 40.1% 34%
Institutional Borrowings 18.9% 45.6% 64.9% 60.8% 55.6% 55%
Market Borrowings - - 2.7% 6.2% 4.3% 11%
Retail NCD25%
Retail Sub Debts9%Utilised Cash Credit
Limits25%
Term Loans30%
Institutional NCD7%
Commercial Papers4%
Retail Liability
Long Term Rating of “AA- “ by Fitch, Care & Crisil.
Highest rating in Short term by all three rating agencies
*Unutilized Cash Credit limits as at Dec 2010 were Rs. 10730 Millions
6

7.Best in Class Corporate Governance & Accounting
Standards
Compliance with the statutory requirements:
ShriramCity being a deposit – accepting NBFC is regulated
by the Reserve Bank of India through regular & periodic
audits. All statutory requirements are complied with and there
are no instances of default on date
Income recognition
• Company defers income on all
securitized assets including bilateral
transactions over the life of the contracts.
• The Company recognizes the delayed
payment charges only on actual receipt
of such money from the customers
Expenditure recognition
• Operating costs to be incurred on
portfolio maintenance are paid and
recognized on day zero.
• Mobilization expenses incurred on retail
liability is paid and provided for in the
Year one, though liability mobilized is
for periods ranging between one to
seven years.
Corporate Governance
Conservative Accounting Policies
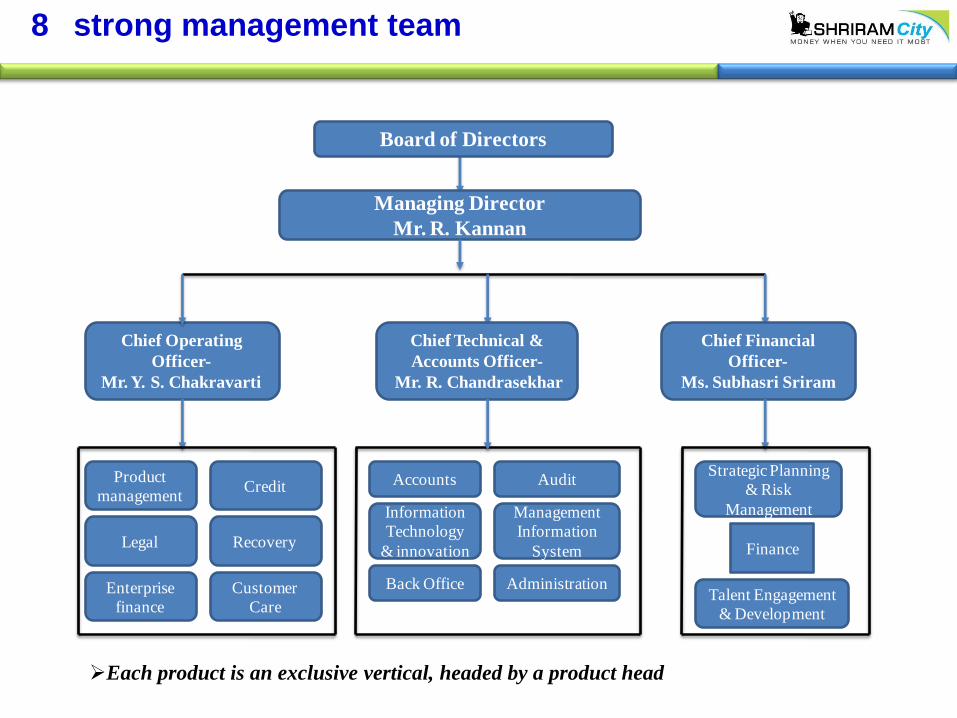
Each product is an exclusive vertical, headed by a product head
strong management team8
Chief Operating
Officer-
Mr. Y. S. Chakravarti
Managing Director
Mr. R. Kannan
Board of Directors
Chief Technical &
Accounts Officer-
Mr. R. Chandrasekhar
Chief Financial
Officer-
Ms. Subhasri Sriram
Product
managementCredit
Legal Recovery
Enterprise
finance
Accounts
Information
Technology
& innovation
Talent Engagement
& Development
Finance
Strategic Planning
& Risk
Management
Back OfficeCustomer
Care
Audit
Management
Information
System
Administration

…Backed by Eminent board…
Board of Directors
Mr. Arun Duggal Chairman
• Former MD & CEO, Bank of America (India)
• Former CFO, HCL Technologies
Mr. R. KannanManaging Director
• Around 3 decades of experience in Shriram
• Former ED, Shriram Chits
Mr. S. VenkatakrishnanDirector
• Retired senior bureaucrat from Civil Services. He has served in senior finance, audit & accounts posts in the Government and Public sector undertakings
• Has been strategic advisor to the group for over a decade
Mr. G.S. Sundararajan
Director
• Current MD of Shriram Capital
• Former CEO & MD Fullerton India Credit Company
• Former MD and head of Citibank's SME and asset based finance business in India
Mr. Puneet BhatiaDirector
• Managing Director and Country Head - India for TPG Asia
• Served as Chief Executive, Private Equity Group for GE Capital India (“GE Capital”)
Mr. Ranvir DewanDirector
• Head of Financial Institutions Group Operations- TPG Capital
• Served as Executive Vice President and Chief Financial Officer of Standard Chartered First Bank (formerly Korea First Bank) in Seoul, Korea.
8
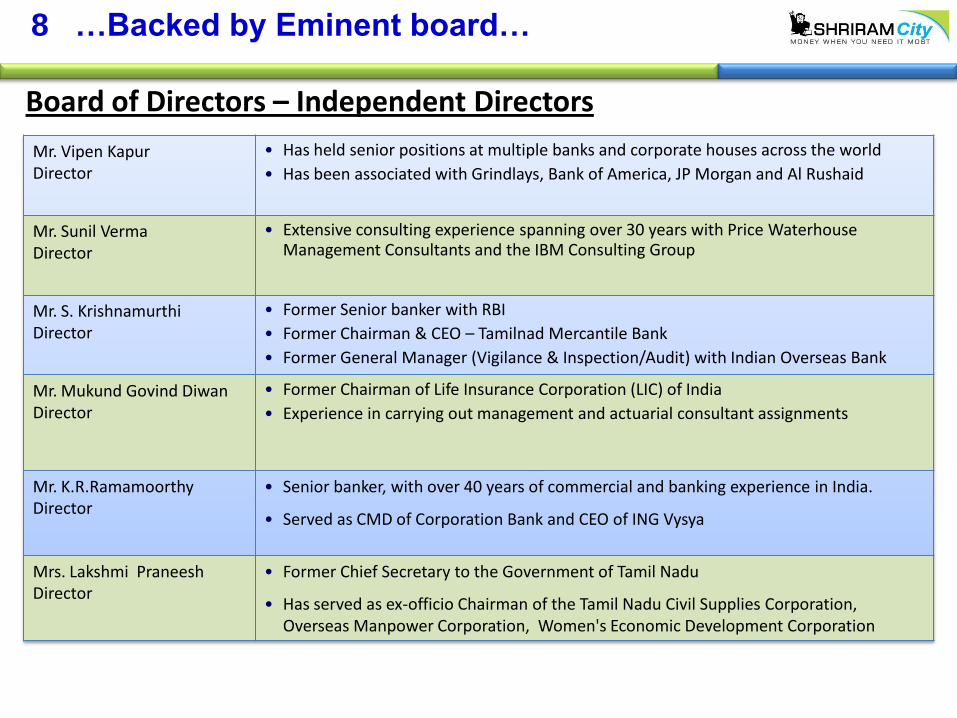
Board of Directors – Independent Directors
Mr. Vipen KapurDirector
• Has held senior positions at multiple banks and corporate houses across the world
• Has been associated with Grindlays, Bank of America, JP Morgan and Al Rushaid
Mr. Sunil VermaDirector
• Extensive consulting experience spanning over 30 years with Price Waterhouse Management Consultants and the IBM Consulting Group
Mr. S. KrishnamurthiDirector
• Former Senior banker with RBI
• Former Chairman & CEO – Tamilnad Mercantile Bank
• Former General Manager (Vigilance & Inspection/Audit) with Indian Overseas Bank
Mr. Mukund Govind DiwanDirector
• Former Chairman of Life Insurance Corporation (LIC) of India
• Experience in carrying out management and actuarial consultant assignments
Mr. K.R.RamamoorthyDirector
• Senior banker, with over 40 years of commercial and banking experience in India.
• Served as CMD of Corporation Bank and CEO of ING Vysya
Mrs. Lakshmi PraneeshDirector
• Former Chief Secretary to the Government of Tamil Nadu
• Has served as ex-officio Chairman of the Tamil Nadu Civil Supplies Corporation, Overseas Manpower Corporation, Women's Economic Development Corporation
…Backed by Eminent board…8

Type of Risk ShriramCity Model
Concentration Risk Multiple products ensure risk diversification.
optimum mix of retail & institutional borrowings
Interest Rate Risk Balanced mix of fixed / floating rate loans.
Loan assets are at Fixed rates and the borrowings are an equal mix of fixed
and floaters
The entire retail liability constituting 34% of the total borrowings, are all at
fixed rates with the average balance maturity of approx. 30 months.
Liquidity Risk Adequate liquidity back up in the form of unutilized working capital limits,
fixed deposits with banks.
Unutilized Cash Credit limits and balances in bank accounts as at 31st Dec
2010, was at Rs. 14102 Millions
ALM Risk Positive cumulative mismatch in all the buckets – assets being of short tenors
(18 – 24 months) and borrowings of longer tenors (24 – 36 months)
Sound Risk management Systems9
Competitive Positioning

Competitive positioning
Company
Consumer
Durables Car 2 wheeler 3 wheeler
Commercial
Vehicles* Personal
SME/
Business Gold
Housing /
property*
Shriram City
Bajaj
Sundaram
Future Cap
Manappuram
Muthoot
Chola
TATA CAPITAL
Magma
ShriramCity offers most diverse and complete product offerings among
major Retail NBFCs in India…
Product / service offered by the Company
* Finances commercial vehicles with a vintage of more than 12 years. Housing finance to be launched soon
Shriram Group Eco-system
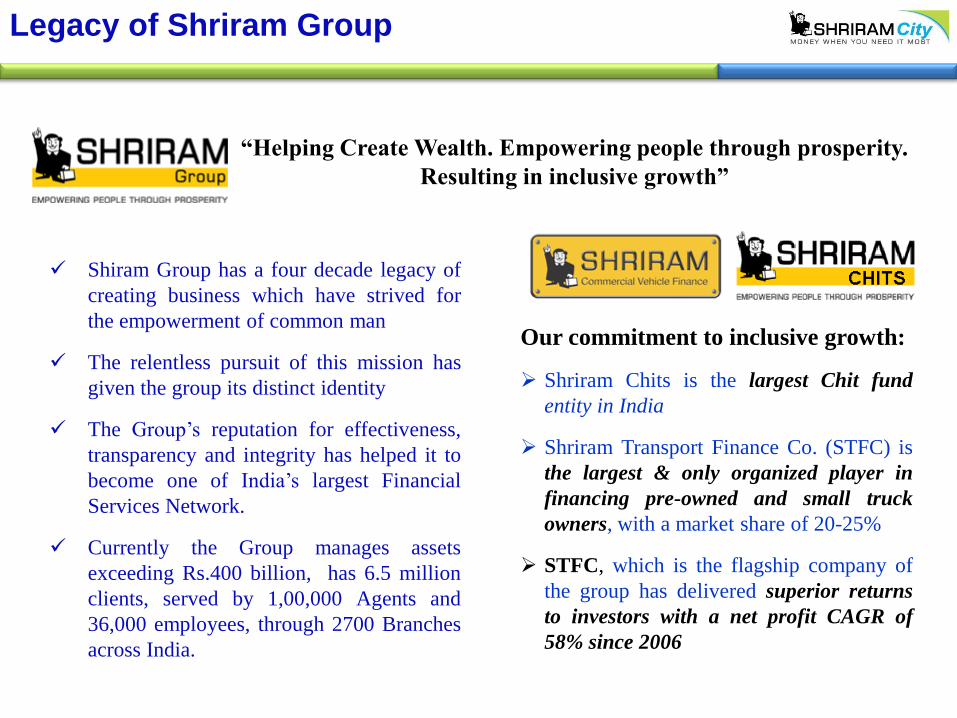
Legacy of Shriram Group
“Helping Create Wealth. Empowering people through prosperity.
Resulting in inclusive growth”
Shiram Group has a four decade legacy of
creating business which have strived for
the empowerment of common man
The relentless pursuit of this mission has
given the group its distinct identity
The Group‟s reputation for effectiveness,
transparency and integrity has helped it to
become one of India‟s largest Financial
Services Network.
Currently the Group manages assets
exceeding Rs.400 billion, has 6.5 million
clients, served by 1,00,000 Agents and
36,000 employees, through 2700 Branches
across India.
Our commitment to inclusive growth:
Shriram Chits is the largest Chit fund
entity in India
Shriram Transport Finance Co. (STFC) is
the largest & only organized player in
financing pre-owned and small truck
owners, with a market share of 20-25%
STFC, which is the flagship company of
the group has delivered superior returns
to investors with a net profit CAGR of
58% since 2006

Future Growth
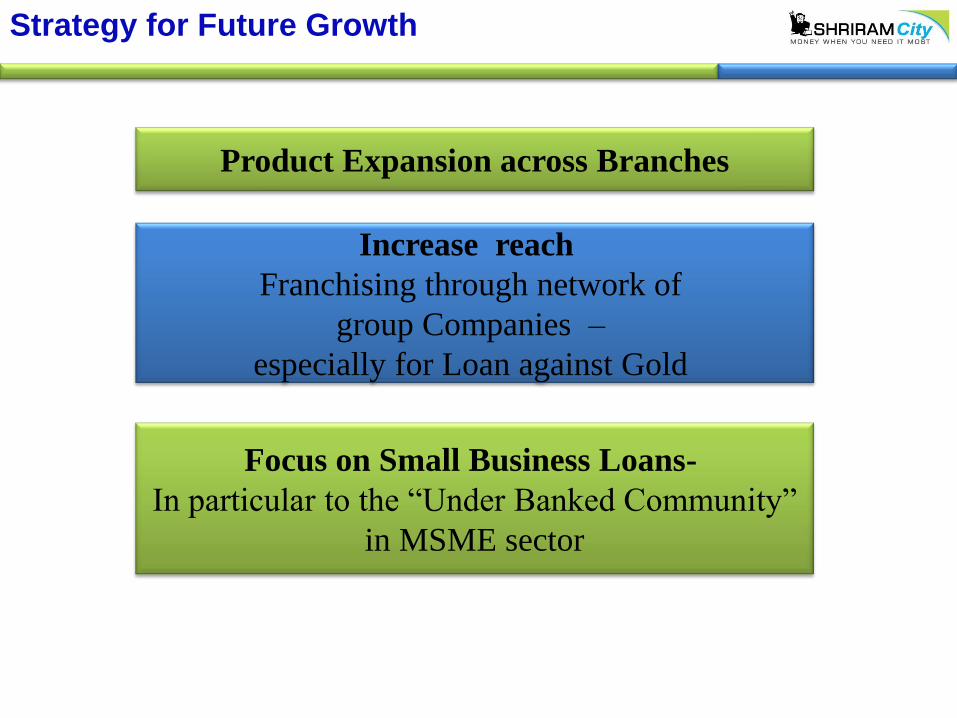
Strategy for Future Growth
Product Expansion across Branches
Increase reach
Franchising through network of
group Companies –
especially for Loan against Gold
Focus on Small Business Loans-
In particular to the “Under Banked Community”
in MSME sector

Product Expansion – Small Business Loans
Financial inclusion has become a national and a government imperative in the last few years..
Many believe that fastest and most efficient way to ensure economic development of financially
excluded is by improving the bankability and thereby competitiveness of Micro, Small & Medium
Businesses (MSMEs)
MSMEs – Some statistics
Constituting around 26 million units
Contributes to 45% of industrial output
40% of exports are fromMSMEs
Employs 60 million people
Creates 1.3 million jobs every year
Currently 21% of SCUF’s loan portfolio is
towards MSME loans
Lending is largely addressed by unorganized
sector
Expertise of Shriram Group
Localized presence - loans are to be processed
and delivered at the customers doorsteps
Ability to understand the customer’s business
model and provide tailor made loans
Lending to this segment, cannot be based
purely on collaterals - this is where
ShriramCity scores over competition
Shriram Chits has years of expertise in this
segment. We have an extensive borrower
database of Shriram Chits – which is
combined with our own borrower database
Gives us an edge over competition in assessing
customers’ requirements and ability to repay
the loan

Product Expansion – Gold Loans
Gold-backed lending to households presents a good opportunity, given the safety of gold as
collateral and high levels of accumulated gold stock among Indian households…
South India is the largest market for Gold
ShriramCity is better positioned compared to large banks in the gold loan segment:
Source: Broker research, IMACS Report on Gold Loans Market in India 2009 and Updated Report on Gold Loans Market In India 2010
0
100
200
300
400
500
600
FY 02 FY 07 FY 09 FY 10 FY 11
Rs.bn
Size of Gold Loans Market in India
Targeting Non – bankable Customers
Perhaps the only product where customers
assess lender‟s brand equity and goodwill
Minimum documentation formalities
Better operating structures compared to banks
Brand name and trust of Shriram Brand
Ability to use the existing infrastructure of
group companies
Average yield on gold loans of SCUF is 18-
20%, which is much higher than average
yields enjoyed by banks (10-12%)

Disclaimer
This presentation is for information purposes only and does not constitute an offer, solicitation or advertisement with respect tothe purchase or sale of any security of Shriram City Union Finance Limited (the “Company”) and no part of it shall form the basisof or be relied upon in connection with any contract or commitment whatsoever. No offering of securities of the Company will bemade except by means of a statutory offering document containing detailed information about the Company.
This presentation is not a complete description of the Company. Certain statements in the presentation contain words or phrasesthat are forward looking statements. All forward-looking statements are subject to risks, uncertainties and assumptions that couldcause actual results to differ materially from those contemplated by the relevant forward looking statement. Any opinion,estimate or projection herein constitutes a judgment as of the date of this presentation, and there can be no assurance thatfuture results or events will be consistent with any such opinion, estimate or projection. The information in this presentation issubject to change without notice, its accuracy is not guaranteed, it may be incomplete or condensed and it may not contain allmaterial information concerning the Company. We do not have any obligation to, and do not intend to, update or otherwise reviseany statements reflecting circumstances arising after the date of this presentation or to reflect the occurrence of underlyingevents, even if the underlying assumptions do not come to fruition.
All information contained in this presentation has been prepared solely by the Company. No information contained herein hasbeen independently verified by anyone else. No representation or warranty (express or implied) of any nature is made nor is anyresponsibility or liability of any kind accepted with respect to the truthfulness, completeness or accuracy of any information,projection, representation or warranty (expressed or implied) or omissions in this presentation. Neither the Company nor anyoneelse accepts any liability whatsoever for any loss, howsoever, arising from any use or reliance on this presentation or its contentsor otherwise arising in connection therewith. This presentation may not be used, reproduced, copied, distributed, shared, ordisseminated in any other manner. The distribution of this document in certain jurisdictions may be restricted by law and personsinto whose possession this presentation comes should inform themselves about, and observe, any such restrictions.