Embed Size (px)
Citation preview

ANNUAL REPORT 2017
SHRINKING DIMENSIONSEXPANDING PERSPECTIVES

1ANNUAL REPORT 2017
SHAREHOLDERS & GENERAL INFORMATIONFINANCIAL STATEMENTSGOVERNANCEPERFORMANCE REVIEWSTRATEGY & BUSINESSABOUT
TABLE OF CONTENTS
ABOUT
OUR COMPANYMessage from the CEO 4At a glance 8The world in which we operate 11Chip making 14
SHRINKING DIMENSIONS, EXPANDING PERSPECTIVES 17
STRATEGY & BUSINESS
OUR STRATEGYMission, vision, strategy and focus areas 24Long-term value creation 27Corporate responsibility 30
OUR INNOVATION AT WORKCollaboration and innovation at work 38Markets and products 39Research and development 43People and society 46Environment 50Supply chain 51
RISK MANAGEMENTRisk management approach 54Risk categories and factors 58
PERFORMANCE REVIEW
OUR RESULTSFinancial performance 63Markets and products 72Research and development 73People and society 74Environment 79Supply chain 81
GOVERNANCE
CORPORATE GOVERNANCECorporate governance principles 84Management Board 85Supervisory Board 87Supervisory Board report 91Remuneration report 94External auditor 97
FINANCIAL STATEMENTS
CONSOLIDATED FINANCIAL STATEMENTSConsolidated statement of profit or loss 100Consolidated statement of comprehensive income 101Consolidated statement of financial position 102Consolidated statement of changes in equity 103Consolidated statement of cash flows 104Notes to the Consolidated financial statements 105
ASM INTERNATIONAL NV FINANCIAL STATEMENTSCompany balance sheet 152Company statement of profit or loss 153Notes to the Company financial statements 154
INDEPENDENT AUDITOR’S REPORT
SHAREHOLDERS & GENERAL INFORMATION
SHAREHOLDERS INFORMATIONInterview with the CFO 170Share listing 172Shareholder returns 174Shares and shareholders’ rights 176Key dates 179Key figures 179Contact information 180
GENERAL INFORMATIONProduct description 182Declarations 184Other information 185Non-financial data glossary 187Definitions and abbreviations 189Locations worldwide 191Safe harbor statement 193Privacy statement 194

ANNUAL REPORT 2017 2
SHAREHOLDERS & GENERAL INFORMATIONFINANCIAL STATEMENTSGOVERNANCEPERFORMANCE REVIEWSTRATEGY & BUSINESSABOUT
OUR COMPANY
> Message from the CEO
> At a glance
> The world in which we operate
> Chip making
SHRINKING DIMENSIONS, EXPANDING PERSPECTIVES
ABOUT
CHAPTER PREVIEW

ANNUAL REPORT 2017 3
CHAPTER PREVIEWThe worldwide demand for smaller, faster and cheaper semiconductor chips continues, as the move to digitalization drives greater automation.
MEETING DEMAND
We are helping to meet this demand by focusing on our innovative strength and building on our
world-leading ALD performance, while expanding our advanced epitaxy and PECVD capabilities.
DELIVERING RESULTS
In 2017, our focus on innovation and continuing to develop our strengths enabled us to deliver
compelling solutions for a number of applications in the growing ALD sector, and introduce new
solutions in the epitaxy market. It also contributed to our strong financial results, which included:
› Net sales of €737 million
› Bookings of €774 million
› Operating result of €113 million
› Operating cash flow of €116 million
SHAREHOLDERS & GENERAL INFORMATIONFINANCIAL STATEMENTSGOVERNANCEPERFORMANCE REVIEWSTRATEGY & BUSINESSABOUT
ABOUT
CHAPTER PREVIEW
OUR COMPANY
> Message from the CEO
> At a glance
> The world in which we operate
> Chip making
SHRINKING DIMENSIONS, EXPANDING PERSPECTIVES

ANNUAL REPORT 2017 4
SHAREHOLDERS & GENERAL INFORMATIONFINANCIAL STATEMENTSGOVERNANCEPERFORMANCE REVIEWSTRATEGY & BUSINESSABOUT
OUR COMPANY
MESSAGE FROM THE CEOIn 2017 we achieved significant progress against our strategic targets. Our sales benefited from a clear recovery in the single-wafer Atomic Layer Deposition (ALD) market, in particular driven by strong increases in the 3D-NAND segment. During the year we also successfully expanded our position in the epitaxy market with an important tool win from a leading foundry customer. In total, our revenue increased by 23% to a new record level.
Last year, we reduced our shareholding in ASMPT from approximately 39% to approximately 25% with the
proceeds being used for share buyback programs and a proposed return of capital to our shareholders.
We continue to invest in new precision deposition applications that help our customers to transition
to the next generations of ever faster and more power-efficient semiconductor devices. Our company
remains well positioned for long-term value creation for all stakeholders.
Our achievements would not be meaningful if we did not achieve them responsibly. We continue
to focus on improving the way we do business responsibly, in our operations, in our supply chain,
and with our stakeholders. As of this report, we no longer report Corporate Responsibility separate
from our Annual Report. This report is yet another step in further integrating our responsible business
practices into our strategies and the value we bring to society.
“IN 2017, FOR THE FIRST TIME, 3D-NAND ACCOUNTED FOR A SOLID DOUBLE DIGIT PERCENTAGE OF OUR TOTAL COMPANY SALES.”
RECOVERY IN OUR ALD BUSINESS 2017 was a year of strong growth for our industry. Worldwide semiconductor industry sales increased
by more than 20% and were for a large part driven by favorable market conditions and price increases
in the memory segments. The market for Wafer Fab Equipment (WFE) grew by approximately
30%. The growth in equipment spending was primarily driven by memory customers who invested
in 3D-NAND capacity expansion, and by higher spending in upgrading existing capacity to advanced
DRAM nodes. The logic/foundry segment of the WFE market was relatively stable in 2017.
Against this positive industry backdrop, the market for single-wafer ALD equipment showed a clear
recovery in 2017. 3D-NAND was the main driver of the growth in the single-wafer ALD market in 2017
and it was also the main driver of growth in our ALD sales. In 2017, for the first time, 3D-NAND
accounted for a solid double digit percentage of our total company sales.
CHARLES D. (CHUCK) DEL PRADO
Chairman of the Management Board,President and Chief Executive Officer

ANNUAL REPORT 2017 5
SHAREHOLDERS & GENERAL INFORMATIONFINANCIAL STATEMENTSGOVERNANCEPERFORMANCE REVIEWSTRATEGY & BUSINESSABOUT
After the drop in 2016, our DRAM business remained at a relatively low level in 2017. Our DRAM
business failed to show the recovery in 2017 that we had expected earlier in the year. Investments
by DRAM customers increased in 2017 but were mainly made within existing fabs with more reuse
of existing equipment as a result. This had a negative impact on the demand for new single-wafer ALD
patterning tools in particular. However, in the latter part of 2017 the first signs appeared of renewed
capacity additions in the DRAM segment, which are likely to drive demand for new ALD patterning
tools in the course of 2018.
In the logic/foundry segment of the single-wafer ALD market demand remained at a healthy level
in 2017 following the strong sales increase that we achieved in 2016. Our customers in this segment
continued to invest in the 10nm node and also made their first early investments in the next 7nm node.
Single-wafer ALD is essential for several new critical process steps to build these advanced devices.
During the year we achieved tool-of-record selections for multiple new ALD applications for the 7nm
logic/foundry node. We expect that these new applications will further increase our addressable
market for ALD.
SUCCESSFUL EXPANSION IN EPITAXYAnother highlight of 2017 was the launch of our new epitaxy tool, the Intrepid ES. The benefits of this
tool versus our earlier Intrepid tool, include amongst others substantially improved temperature
control capabilities which enables both enhanced process control and increased productivity. In April
2017, we announced that we won our first process tool-of-record selection for the Intrepid ES for
an advanced epitaxy application at a leading foundry customer. With the successful launch of the
Intrepid ES we are substantially increasing our addressable market in epitaxy. In earlier years we were
mainly focused on the market segment for power and analog epitaxy applications. With the Intrepid
ES we now also target advanced-node applications in logic/foundry and memory, which form the
largest part of the epitaxy market.
The new customer win for our Intrepid ES tool drove a strong increase in our epitaxy sales
in 2017, which approximately doubled compared to a lower base in 2016. Epitaxy is expected
to be an attractive growth market, as it is a key technology that helps our customers to improve the
transistor performance of their next generation devices. In addition, a stronger position in epitaxy will
help us to further broaden our relationships with key customers and it will also provide a stronger and
more diversified base to our revenue stream.
As part of our growth strategy we also invest selectively in other parts of our portfolio, next to ALD and
epitaxy, where our solutions can make a difference for our customers. In 2017, this resulted in a new
win in our Plasma Enhanced CVD (PECVD) activity in the 3D-NAND market, which also contributed
to our revenue growth last year.
POSITIONED FOR GROWTH IN 2018Since 2010 we have grown our sales with an average annual growth rate of 14%. This compares to an
average annual increase of about 6% (source: Gartner) for the WFE market over the same period.
The outlook for our industry this year looks healthy. For 2018, market watchers currently expect the
WFE market to increase with, on average, a high single-digit percentage. We aim to outgrow the WFE
market in 2018.
In our ALD activities we target an increase in our DRAM related activities. An expected increase in new
DRAM capacity investments will likely drive some improvement in demand for new ALD patterning
tools. In addition, we have been broadening our R&D-scope in the DRAM ALD market beyond
applications in patterning, for which we expect the first results in 2019. We also expect to benefit
from continued investments in the 10nm/7nm logic/foundry market. In 3D-NAND, we are focused
on serving the current volume ramps at the 3D-NAND manufacturers and to position our company for
a broader participation in this space.
“ANOTHER HIGHLIGHT OF 2017WAS THE LAUNCH OF OUR NEW EPITAXY TOOL, THE INTREPID ES.”For our product in epitaxy we expect traction to remain strong in 2018. As far as our other products
PECVD and Vertical Furnace are concerned, we continue to invest in selected parts of these activities,
which we expect will create growth opportunities in 2018. From a geographical point of view,
we expect a higher sales contribution from China in 2018 following our investment to increase our
presence in this market and as local Chinese customers are preparing for higher investments in more
advanced technology nodes.

ANNUAL REPORT 2017 6
SHAREHOLDERS & GENERAL INFORMATIONFINANCIAL STATEMENTSGOVERNANCEPERFORMANCE REVIEWSTRATEGY & BUSINESSABOUT
PROGRESS IN STRATEGIC FOCUS AREAS Our overall progress in operational excellence is also recognized by our customers and positions
us well to continue to compete effectively in the future. Last December, ASMI received an Excellent
Performance Award from TSMC, as one of seven equipment suppliers, in recognition of our technology
and performance in development and production at TSMC fabs. This follows the award that
we received from TSMC in February 2017 for the innovation, performance and support of ASMI’s ALD
equipment and technology.
“IN MARCH OF 2018, WE RECEIVED INTEL’S PREFERRED QUALITY SUPPLIER (PQS) AWARD FOR OUR PERFORMANCE ACROSS 2017.”
In March of 2018, we were recognized by Intel as a recipient of their Preferred Quality Supplier (PQS)
award for our performance across 2017. The PQS award, the 2nd PQS win for ASMI, recognizes
companies like ASMI that Intel believes have relentlessly pursued excellence and conducted business
with resolute professionalism. The PQS award celebrates exceptional, persistent performance and
the continuous pursuit of excellence.
ASMPT STAKE REDUCED TO 25%During 2017 we reduced our shareholding in ASMPT in two steps from approximately 39%
to approximately 25%, which we believe will further drive the long-term value of our company. In April
2017 we sold a 4.9% stake for proceeds of approximately €245 million and last November we sold
another 9.1% stake for proceeds of approximately €445 million. We announced plans to use the
proceeds of these two stake sales for share buybacks and also for a proposed return of capital to our
shareholders.
In 2017, our shareholding in ASMPT contributed solidly to our net earnings. Normalized result
from investments, which includes the contribution from ASMPT, increased by 66% to €112 million.
ASMPT’s sales growth accelerated from 10% in 2016 to 23% in 2017. In Back-end equipment, the
company performed very well in segments such as Back-end equipment for CMOS image sensors,
power management and advanced packaging. In addition, ASMPT’s surface mount technology (SMT)
solutions recorded particularly strong growth driven by automotive and industrial electronics and the
latest upgrade cycle in the smartphone market. Based on its leading positions and diversified portfolio
we believe ASMPT stands to benefit from broad-based market drivers.
FINANCIAL PERFORMANCE With the recovery in our ALD business and a strongly increased contribution from our epitaxy and
PECVD activities, our revenue increased by 23% in 2017 to a new record high. Our gross margins
decreased from 44.2% to 41.5%, which is explained by the temporary effect of initial costs related
to new epitaxy and PECVD product launches. With operating expenses remaining under control, our
operating profit increased 38% to €113 million.
Our key priority is to maintain a strong balance sheet that enables us to continue investing in the
growth of our business. Our commitment to use excess cash for the benefit of our shareholders
remains unchanged. During 2017 we completed our third consecutive €100 million share buyback
program. Furthermore, using the proceeds of the ASMPT stake sale of April 2017 we launched a new
€250 million buyback program that was started in September 2017 and was for 97% complete per
March 9, 2018. In addition, with the publication of our fourth quarter 2017 results we announced that
we intend to use part of the proceeds of the ASMPT stake sale of November 2017 for a proposed
tax-efficient return of capital of €4 per share to our shareholders, for a total amount of approximately
€220 million. Moreover, we also announced that we plan to use €250 million for a new share buyback
program. We will also propose to the Annual General Meeting of Shareholders 2018 an ordinary
dividend of €0.80 per share, which is an increase of 14% compared to the dividend paid in 2017.
CORPORATE RESPONSIBILITY Our strategy continues to focus on further integrating Corporate Responsibility across all areas
of our business, and we are well aligned with the United Nations Sustainable Development Goals
(SDG). Our progress and results in 2017 are correlated with the SDG goals in the areas of Gender
Equality, Decent Work and Economic Growth, Industry Innovation and Infrastructure, Responsible
Consumption and Production, and Climate Action. Our contributions to these global goals are shared
throughout this report.
SOLID LONG-TERM PROSPECTS We remain focused on supporting our customers in their relentless push to follow Moore’s Law. ALD
is now firmly established as a key enabling technology that contributed to the introduction of several
device generations in the memory and logic/foundry markets. As our industry moves to the next
technology nodes, dimensions further scale and complex 3D device structures and new materials
need to be introduced. The technology inflections on the roadmaps of our customers play to the

ANNUAL REPORT 2017 7
SHAREHOLDERS & GENERAL INFORMATIONFINANCIAL STATEMENTSGOVERNANCEPERFORMANCE REVIEWSTRATEGY & BUSINESSABOUT
strengths of ALD as these will drive the need for more precise deposition of ultra-thin and highly
conformal films.
The continuous improvement in processing speed, storage capacity, energy efficiency and cost
effectiveness of the most advanced semiconductor devices is a driving force behind the creation
of new end market applications in areas such as artificial intelligence, cloud computing and IoT.
The advances in semiconductor technology to which we contribute are therefore at the heart of new
developments in for instance electric autonomous cars, innovations in healthcare and education and
more efficient transportation systems, with potentially large benefits for our everyday lives and for
society at large.
With an expanding number of applications, we remain confident that the single-wafer ALD market will
over time grow as a percentage of the total deposition market. As a leader in ALD, ASMI continues
to be well positioned to capture the growth expected in this market. In addition to further growth in our
ALD activities, we expect an increased contribution from our epitaxy and PECVD activities. To prepare
our company for the next stage of growth we intend to invest in the expansion and upgrading of our
R&D and manufacturing facilities, which will be reflected in a higher level of our capital spending in the
period 2017-2019.
We would like to thank our employees for their continued commitment and hard work: together
as one ASMI team we have again made progress this year in many critical areas. We are also grateful
for the trust of our customers and the continued support of our shareholders. Our focus remains the
creation of sustainable value for all our stakeholders.
March 16, 2018
Charles D. (Chuck) del Prado
President and Chief Executive Officer

ANNUAL REPORT 2017 8
SHAREHOLDERS & GENERAL INFORMATIONFINANCIAL STATEMENTSGOVERNANCEPERFORMANCE REVIEWSTRATEGY & BUSINESSABOUT
AT A GLANCE
ASM International NV (ASMI) is a leading supplier of semiconductor wafer processing equipment and process solutions. Our customers include all of the top semiconductor device manufacturers in the world. Semiconductor chips sit at the heart of almost every electronic device we use today. They run programs, apps, and operating systems. They connect your television to your wireless internet. Without them, today’s society would simply disconnect. And our technology is the first step towards making it all possible. Our semiconductor process tools enable chip manufacturers to make higher capacity, more powerful, and faster logic processor and memory chips. Our R&D investments lead to new device architectures, new materials, and new processes, together advancing nanotechnology that help us all make connections.
* Excluding effect of sale of ASMPT shares
BOOKINGSEUR million
NET EARNINGS*EUR million
GLOBAL INJURY RATE Per 100 employees
LANDFILL DIVERSION RATE
WATER CONSUMPTIONm3 per million R&D
investment
GHG EMISSIONSmtCO2e per million
R&D investment
PATENTS IN FORCE
OPERATING CASH FLOWEUR million
NET SALESEUR million
RESULT FROM INVESTMENT* EUR million
CASH EUR million
PATENT FILINGS
OPERATING RESULTEUR million
EMPLOYEES IN R&D
EARNINGS PER SHARE*(Diluted) EUR
STAFFEmployees
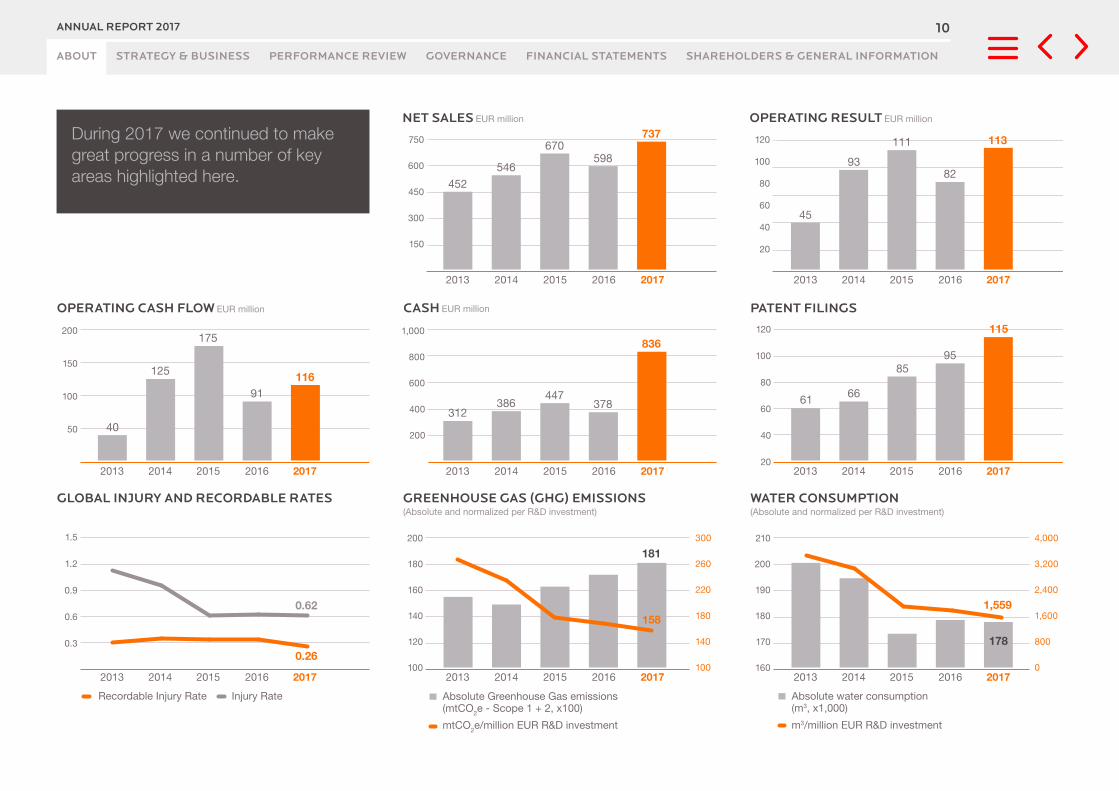
774 112
1,900 26% 115 1,604
737 116113 836 3.21 190
0.62 79%1,559158
ORGANIZATIONAL STRUCTUREASMI has two operating segments, Front-end (wafer processing) and Back-end (assembly and packaging).
ASM INTERNATIONAL NVHeadquarters: Almere, the Netherlands
FRONT-END BACK-ENDAssembly & Packaging / 25.18% ownership
ASM Pacific Technology LtdWafer processing

ANNUAL REPORT 2017 9
SHAREHOLDERS & GENERAL INFORMATIONFINANCIAL STATEMENTSGOVERNANCEPERFORMANCE REVIEWSTRATEGY & BUSINESSABOUT
KEY FIGURES
EUR (million, except per share data and employees) 2013 3) 2014 2015 2016 2017
Operations:
Net salesFront-end 452 546 670 598 737
Back-end 160 – – – –
Result from operations:Front-end 45 93 111 82 113
Back-end (4) – – – –
Net earnings (loss) from continuing operations (343) 138 157 135 452
Net earnings (loss) from discontinued operations 1,405 3 – – –
NET EARNINGS (LOSS) FROM OPERATIONS 1,062 141 157 135 452
Balance sheet:Net working capital 1) 109 108 114 157 180
Total assets 1,608 1,889 2,076 2,131 2,177
Net cash 2) 312 386 447 378 836
Backlog:Front-end 115 176 128 157 180
Back-end – – – – –
Number of staff:
EmployeesFront-end 1,502 1,635 1,597 1,670 1,900
Back-end – – – – –
Per share data:
Net earnings (loss) on operations per shareBasic net earnings (loss) 16.81 2.23 2.53 2.23 7.72
Diluted net earnings (loss) 16.55 2.20 2.50 2.21 7.63
Weighted average number of shares used in
computing per share amounts (in thousands):Basic 63,202 63,558 62,114 60,616 58,573
Diluted 64,196 64,707 62,928 61,253 59,3251 Net working capital includes accounts receivable, inventories, other current assets, accounts payable, provision for warranty and accrued expenses and other payables.2 Net cash includes cash and cash equivalents less long-term debt and notes payable to banks.3 ASMPT (Back-end) was deconsolidated as from March 15, 2013.
ANNUAL REPORT 2017 10
SHAREHOLDERS & GENERAL INFORMATIONFINANCIAL STATEMENTSGOVERNANCEPERFORMANCE REVIEWSTRATEGY & BUSINESSABOUT
PATENT FILINGS
0
150
300
450
600
750
0
20
40
60
80
100
120
178
452
737
598670
40
125 116
175
91
45
9382
113111
546
300
260
220
180
140
100
210
200
190
180
170
160
4,000
3,200
2,400
1,600
800
0
120
100
80
60
40
20
750
600
450
300
150
200
150
100
50
120
100
80
60
40
20
1.5
1.2
0.9
0.6
0.3
1581,559
181
20142013 2015 2016 2017
20142013 2015 2016 2017
20142013 2015 2016 2017
20142013 2015 2016 2017
20142013 2015 2016 2017
20142013 2015 2016 201720142013 2015 2016 2017
20142013 2015 2016 2017
61 66
95
115
85
836
312386
447378
200
180
160
140
120
1000.26
0.62
GREENHOUSE GAS (GHG) EMISSIONS(Absolute and normalized per R&D investment)
WATER CONSUMPTION(Absolute and normalized per R&D investment)
OPERATING RESULT EUR million
1,000
800
600
400
200
CASH EUR million
NET SALES EUR million
OPERATING CASH FLOW EUR million
Global Injury and RECORDABLE RatEs
Absolute Greenhouse Gas emissions(mtCO2e - Scope 1 + 2, x100)
Absolute water consumption(m3, x1,000)
m3/million EUR R&D investmentmtCO2e/million EUR R&D investment
Injury RateRecordable Injury Rate
During 2017 we continued to make great progress in a number of key areas highlighted here.

ANNUAL REPORT 2017 11
SHAREHOLDERS & GENERAL INFORMATIONFINANCIAL STATEMENTSGOVERNANCEPERFORMANCE REVIEWSTRATEGY & BUSINESSABOUT
THE WORLD IN WHICH WE OPERATEThe world around us is changing rapidly, as society becomes increasingly automated and connected. We rely on a broad range of connected electronic devices, often called the Internet of Things (IoT), to control our homes, offices, vehicles, and communications.
Due to the expansion of artificial intelligence, these devices are getting smarter, enabling office
building environments and public transportation to be optimized in real time, without human
interaction. It allows individuals to speak to their electronic personal assistants for guidance, carry
out information searches, or to execute tasks. This connected and automated world is creating
the demand for massive amounts of data, requiring ever-greater computer processing power and
storage, capable of analyzing and acting on the data quickly and effectively. Making this possible
requires the processing power of semiconductor chips. And it is our technology that is playing a vital
part in making it all possible.
OUR ROLEWe design, manufacture, and sell equipment and services to our customers for the production
of semiconductor devices, or integrated circuits (ICs). Semiconductor ICs, often called chips, are
a key technology that enable the advanced electronic products used by consumers and businesses
everywhere. Our innovative technologies are used by the most advanced semiconductor manufacturers.
Our customers’ goal is to build faster, cheaper, and more powerful semiconductors. We work closely
with them to make this a reality, forging mutually beneficial partnerships that enable us to help them
develop their technology roadmap. At the same time, our customers become expert users of our
equipment, and their insights help us to continuously improve our systems, resulting in greater
productivity and lower operating costs per wafer, benefiting us, them, and the end consumer.
The result is value creation not only for our customers, but for all of our stakeholders.
Collaboration is a vital part of our success, which is why we have developed close ties with many
of our stakeholders. For example, we maintain partnerships with technical institutions and universities
to carry out cutting-edge research and development (R&D). At the same time, working closely with our
suppliers helps us manufacture, service, and sustain our products efficiently.
INVESTORSCUSTOMERS SOCIETYEMPLOYEES
OUR POSITION IN THE INDUSTRY
END CONSUMERSSemiconductorindustry
University research/R&D institutes
Materialssuppliers
ASMI & other FAB equipment suppliers
Semiconductorsuppliers

ANNUAL REPORT 2017 12
SHAREHOLDERS & GENERAL INFORMATIONFINANCIAL STATEMENTSGOVERNANCEPERFORMANCE REVIEWSTRATEGY & BUSINESSABOUT
COMPLEX PROCESSESThe process of making semiconductor chips is both highly complex and very costly. Semiconductor
fabrication plants, called fabs, house a large set of wafer-processing equipment which performs
a series of process steps on round silicon wafers, which are typically 300mm in diameter. The
equipment is operated in cleanrooms, which filter the air to avoid contamination from small particles
that could negatively affect the circuitry on the chips. The dimensions of the features within each chip
continue to get smaller, as the demand for performance continues to expand.
Our systems are designed for deposition processes when thin films, or layers, of various materials
are grown or deposited onto the wafer. Many different thin-film layers are deposited to complete the
full sequence of process steps necessary to manufacture a chip. After testing the individual circuits
for correct performance, the chips on the wafer are separated and then packaged in a protective
housing before ultimately becoming part of a set of semiconductor chips on circuit boards within
an electronic product.
THE DRIVING FORCE Our people are the driving force and the differentiating factor behind these innovations, which is why
we focus on attracting and retaining talented individuals from across the globe. We know that it takes
the right mix of people, working together, to solve big challenges. Investing in our people enables us to
deliver the advanced nanotechnologies that lead to better products, resulting in an expansion in the
connections, automation, and intelligence that drive our daily lives.
MOORE’S LAWA key driver in the semiconductor industry is the continuous demand for smaller, faster, and
cheaper semiconductor components. Through technology advances in the manufacturing process,
semiconductor manufacturers are continuously scaling chips to smaller dimensions. This enables more
transistors to fit in the same physical space, thereby reducing the costs and increasing the speed and
performance of a device. Moore’s Law states that the number of transistors in an integrated circuit
will double approximately every two years, and the cost per transistor will reduce by half over the
same time frame. The industry’s relentless push to follow Moore’s Law and the continuous demand
for smaller, faster, and cheaper semiconductor components drives the technology advances in the
semiconductor manufacturing process.
100,000,000,000
10,000,000,000
TRA
NS
ISTO
RS
PE
R M
ICR
OP
RO
CE
SS
OR
YEAR
1,000,000,000
100,000,000
10,000,000
1,000,000
100,000
10,000
1,000
ASMI’s technologies are focused on helping enable our customers to continue extending Moore’s Law.
MOORE’S LAW
1970 1978 1986 1994 2002 2010 20181974 1982 1990 1998 2006 2014 2022

ANNUAL REPORT 2017 13
SHAREHOLDERS & GENERAL INFORMATIONFINANCIAL STATEMENTSGOVERNANCEPERFORMANCE REVIEWSTRATEGY & BUSINESSABOUT
THE WORLD IN WHICH WE OPERATE CONTINUED
ASMI is a global company with offices around the world. We are present in all major markets of our customers. For a complete list of all our locations, please visit our website.
PLASMA PRODUCTSBUSINESS UNIT AND PRODUCT RESEARCH & DEVELOPMENT
Tokyo, Japan
Cheonan, South Korea
THERMAL PRODUCTSBUSINESS UNIT AND PRODUCT RESEARCH & DEVELOPMENT
RESEARCHFACILITIES
MANUFACTURING
Almere, the Netherlands
Phoenix, AZ, US
Helsinki, Finland
Leuven, Belgium
Singapore, Singapore
Cheonan, South Korea

ANNUAL REPORT 2017 14
SHAREHOLDERS & GENERAL INFORMATIONFINANCIAL STATEMENTSGOVERNANCEPERFORMANCE REVIEWSTRATEGY & BUSINESSABOUT
CHIP MAKINGSemiconductor chips are used in virtually all modern electronic products. From microprocessors, memories, and power devices, to image sensors, and analog devices, chips are critical to the global economy. Their use has revolutionized how we live, work, and play, enabling us to understand, create, and share information faster and more easily. Behind this lies the hugely complex manufacturing process that makes semiconductor chips a reality, and which gets increasingly complex every year.
SEMICONDUCTOR DEVICE MANUFACTURINGThe process of manufacturing semiconductor devices on a wafer can be divided into three distinct parts:
› Wafer manufacturing;
› Transistor formation (known as Front-end of the line (FEOL) processing); and
› Interconnect formation (known as Back-end of the line (BEOL) processing).
At ASMI, we develop, manufacture and sell equipment, and provide services used by semiconductor
device manufacturers, at every stage.
WAFER PROCESSINGIn the wafer manufacturing process, a large single crystal of very pure silicon is grown from molten
silicon. The crystal is then sliced into a large number of thin slices, or wafers, of single crystalline silicon.
These slices are polished to an atomic-level flatness before the next steps are executed. For advanced
applications, some layers are deposited on the wafer for later use, by either epitaxy or diffusion/
oxidation. Epitaxial wafers are even flatter and contain fewer surface defects than polished wafers.
FROM WAFER TO DEVICESDuring FEOL and BEOL wafer processing, multiple thin films of either electrically-insulating material, also called dielectrics, or conductive material are modified, grown, or deposited on a silicon wafer. This involves the following steps:
› First, several material processing cycles are used in the FEOL to build the basic transistor and other
components such as capacitors and resistors; and
› Second, several processing cycles are used in the BEOL to electrically connect the large number of
transistors and components, and to build additional passive components such as capacitors,
inductors, and resistors. Patterning of deposited layers with lithography and etching (described
below) creates the transistors, passive components, and connecting wires, which together make up
the integrated circuit. Each integrated circuit is a single chip or a die on the wafer.
A finished wafer may contain several dozen to several thousand individual dies. Wafer processing
is performed either one wafer at a time in single-wafer processing systems or many wafers at a time
in batch processing systems. Multiple deposition and patterning processes are performed on the
same wafer to complete a device.
PROCESS STEPSThe number and precise order of the process steps varies depending upon the complexity and design
of the integrated circuit. The performance of the circuit is determined in part by the various electrical
characteristics of the materials used in the layers of the circuit and the wafer. Simple circuits may
have as few as ten layers, while complex circuits may have more than one hundred layers. The device
manufacturing process is capital-intensive, requiring multiple units of several different production
systems. Many different but complementary methods are used to modify, grow, or deposit materials
on the wafers. The device manufacturing process on the wafer is complete when all of the layers have
been deposited and patterned on the wafer.
CLEANROOMSThe introduction of even trace levels of foreign particles or material can make a circuit, or even an entire
wafer, unusable. To reduce the level of foreign particles or material, wafer processing is performed
in cleanrooms with ultra-low particle and contamination levels. The correct electrical functioning of the
integrated circuits on each die is confirmed by probing. Non-functioning circuits are marked so they
can later be discarded before money is spent on packaging the chip. The yield – or the percentage
of known good die for a mature process – is usually well above 95%. For a process in development,
the yield can be substantially smaller, and it is important to improve this as quickly as possible as it
determines, to a large extent, the profitability of our customers.

ANNUAL REPORT 2017 15
SHAREHOLDERS & GENERAL INFORMATIONFINANCIAL STATEMENTSGOVERNANCEPERFORMANCE REVIEWSTRATEGY & BUSINESSABOUT
FRONT-END AND BACK-END PROCESSINGThere are two basic segments of chip manufacturing to complete a final packaged chip product.
We refer to them as wafer processing, and assembly and packaging. We are an equipment supplier
for the Front-end part: wafer processing.
During wafer processing – the start of the manufacturing line – manufacturers process wafers made
of silicon, on which the electrical components are formed. During assembly and packaging – the
Back-end of the manufacturing line – the wafers are divided up into individual chips and tested before
being assembled and packaged.
CHIP MAKING PROCESS
1
4
7
2
5
8
3
6
9
1. FROM SAND TO PURE SILICONIt all starts with one simple, common substance: sand. The silicon found in sand is in the form of silicon
dioxide. To make chips, manufacturers need pure silicon, which means the first step in the process
is to separate the silicon from the oxygen molecules. The pure silicon needed to make silicon chips
can have only one foreign atom for every billion silicon atoms. It must also be in monocrystalline form.
The way atoms are organized in this form of silicon is essential to some of the later processes.
2. WAFER BLANKSThe silicon is then extracted, or pulled, from liquid silicon in the form of long cylindrical ingots at around
1,400 degrees Celsius.
3. WAFERS ARE CUTWafers are then cut from the ingots before being polished to produce a smooth surface. They are
then sent to chip manufacturers for processing. The next steps in wafer processing are then repeated
many times to create the finished wafer that contains chips.
4. COATING A WAFERThe wafer is put into a high-temperature furnace and exposed to oxygen, forming a layer of silicon
dioxide on the surface. Then chemical vapor deposition (CVD) is used to add a layer or film of nitride.
5. CREATING MASKSOnce the circuit layout of the chips has been designed, glass plates or masks are created which help
copy the design onto the surface of the wafer. Several masks are used in sequence to add more
complexity to the chips.
6. ADDING A PATTERNNow comes the time to begin creating the design on the surface of the wafer using the masks as a
guide. Photolithography, a type of optical printing, is used. The wafer is first coated with photoresist,
which changes when exposed to ultraviolet (UV) light. The mask is placed above the wafer and
precisely aligned with it. UV light shining above the mask reacts with the exposed parts of the
photoresist, creating a pattern. The wafer is covered with a developing solution to develop these
patterns, which are then etched, leaving the parts not exposed to UV light intact. The surface now
contains ‘trenches’ that run across the surface.

ANNUAL REPORT 2017 16
SHAREHOLDERS & GENERAL INFORMATIONFINANCIAL STATEMENTSGOVERNANCEPERFORMANCE REVIEWSTRATEGY & BUSINESSABOUT
DEPOSITIONA dielectric or insulating film is deposited in the trenches by one of a number of deposition technologies
such as CVD or ALD or PEALD. Gates are formed between the trenches, creating parts of the many
millions of transistors that may be created on a single chip. Gates can be switched to allow charge
carriers, such as electrons, to flow or to prevent them from flowing. Contacts are formed by each gate
to create a source and drain. Ion implantation is used to implant special elements into the wafer for
the source and drain. The charge carrier enters a gate channel at the source contact and exits at the
drain contact.
CONNECTOnce the basic chip components have been created, they need to be connected. The same processes
of lithography, etching, and deposition, are used to form trenches filled with metal connections. These
connections between components are created not just on one level, but on many. The finished wafer
will contain up to several thousand individual chips in a space of 200mm to 300mm, and some chips
can hold billions of transistors.
7. WAFERS SEPARATED INTO INDIVIDUAL CHIPSOnce wafer processing has been completed, the finished wafers are transported to another plant for
cutting, assembly, and packaging. The individual wafers are cut into separate chips.
8. LEAD FRAMESThe chips are then placed in a lead frame, forming a protective housing.
9. TESTING & PACKAGINGEach chip is then tested before being packaged to be sent for placement on circuit boards.

ANNUAL REPORT 2017 17
SHAREHOLDERS & GENERAL INFORMATIONFINANCIAL STATEMENTSGOVERNANCEPERFORMANCE REVIEWSTRATEGY & BUSINESSABOUT
SHRINKING DIMENSIONS, EXPANDING PERSPECTIVES
ALMOST EVERY ELECTRONIC PRODUCT USES A SET OF SEMICONDUCTOR IC DEVICES. THE MOVE TO DIGITALIZATION IS DRIVING THE INCREASING AUTOMATION WE SEE EVERY DAY. AND, ULTIMATELY, THIS IS WHAT DRIVES THE INSATIABLE DEMAND FOR SMALLER, FASTER AND CHEAPER SEMICONDUCTOR CHIPS.
But how do high performance chips impact our everyday life? The impact is visible in many places. For example, electronic signs around our city can automatically redirect us to avoid traffic congestion, while collision avoidance systems can be integrated into our vehicles. Our perspectives are changing because of the expanding capabilities that are possible due to advanced computing.
SHRINKING DIMENSIONS, EXPANDING PERSPECTIVES
LET’S EXPLORE
VISIT ONLINE
INVESTORSCUSTOMERS SOCIETYEMPLOYEES

ANNUAL REPORT 2017 18
CUSTOMERS
VISIT ONLINE
SHAREHOLDERS & GENERAL INFORMATIONFINANCIAL STATEMENTSGOVERNANCEPERFORMANCE REVIEWSTRATEGY & BUSINESSABOUT
THE THIRD DIMENSIONFor certain device types, the technology roadmap includes expanding in the third dimension: in a vertical 3D structure.
PROBLEM SOLVINGFor logic devices, the performance scaling requirements have resulted in a 3D gate stack structure, commonly known as FinFETs. We are addressing technology challenges related to these structures through our ALD and epitaxy systems.
CUSTOMER SOLUTIONSUsing our equipment and process innovations, our customers can achieve their roadmaps for 3D devices. This enables them to deliver the next-generation chips demanded by the market for high-performance electronic systems.
HIGHERLEVEL
ENABLING 3D DEVICES
By working closely with our customers, we are intensely focused on developing innovative solutions to the roadmap challenges of realizing advanced technology nodes.

ANNUAL REPORT 2017 19
VISIT ONLINE
SHAREHOLDERS & GENERAL INFORMATIONFINANCIAL STATEMENTSGOVERNANCEPERFORMANCE REVIEWSTRATEGY & BUSINESSABOUT
EMPLOYEES
SMALLERSIZE
ADVANCING MOORE’S LAW
NEW TECHNOLOGIESOur customers rely on us to develop and deliver equipment and process solutions that help them achieve their technology roadmaps.
DIMENSION SCALINGDimensional scaling is critical for high-performance computing and high-density data storage, the building blocks for today’s expanding automation applications.
REAL OPPORTUNITIESFor our people, this means opportunities to work at the cutting-edge of their profession. Being involved in R&D activities that lead to ground-breaking developments means we are creating an environment that enables our people to excel and turn today’s challenges into tomorrow’s opportunities.
Shrinking dimensions means developing new solutions within deposition processes, including film thickness control, patterning spacer sidewall performance, and particle management. This is achieved by our highly-skilled people, who produce cutting-edge technologies to address these challenges and advance Moore’s Law.

ANNUAL REPORT 2017 20
INVESTORS
VISIT ONLINE
SHAREHOLDERS & GENERAL INFORMATIONFINANCIAL STATEMENTSGOVERNANCEPERFORMANCE REVIEWSTRATEGY & BUSINESSABOUT
DELIVERING SOLUTIONSWe are delivering compelling solutions for an increasing number of applications in the growing ALD sector.
NEW BUSINESSIn the epitaxy market, we introduced the new Intrepid ES tool, which enabled us to win new volume production business from a leading-edge foundry customer.
INVESTOR RETURNSOur innovations are leading to a higher level of business for a broader range of deposition applications. This translates into long-term value creation growth and positive investor returns.
BROADERSCOPE
EXPANDING OUR DEPOSITION APPLICATIONS
Over the last few years, ASMI has further broadened its customer and product base. We have continued to focus on our innovative strength, building on our world-leading ALD performance and expanding our advanced epitaxy and PECVD capabilities.

ANNUAL REPORT 2017 21
VISIT ONLINE
SHAREHOLDERS & GENERAL INFORMATIONFINANCIAL STATEMENTSGOVERNANCEPERFORMANCE REVIEWSTRATEGY & BUSINESSABOUT
SOCIETYTOMORROW’S TECHNOLOGYWe are focused on innovations and R&D that enable our customers to deliver the next-generation chips needed to implement the latest technologies.
INTERNET OF THINGSTechnologies that are connected by the IoT, with its huge potential to benefit society: from medical devices with embedded sensors to improve health care, to sensors on transport vehicles to monitor their location, speed and environment, all in real-time.
BENEFITTING SOCIETYAs smart devices and the IoT become ever-more integrated into our lives, artificial intelligence and more advanced data analysis will increase the applications, expanding the benefits to society.
BIGGERIMPACT
NEW TECHNOLOGY APPLICATIONS
Developing new applications enables us to create technologies that, until recently, were seen as science fiction. Tomorrow’s learning and health care will have as much to do with technology as ideas, creating a range of benefits for society.

22ANNUAL REPORT 2017
SHAREHOLDERS & GENERAL INFORMATIONFINANCIAL STATEMENTSGOVERNANCEPERFORMANCE REVIEWSTRATEGY & BUSINESSABOUT
OUR STRATEGY
> Mission, vision, strategy and focus areas
> Long-term value creation
> Corporate responsibility
OUR INNOVATION AT WORK
> Collaboration and innovation at work
> Markets and products
> Research and development
> People and society
> Environment
> Supply chain
RISK MANAGEMENT
> Risk management approach
> Risk categories and factors
STRATEGY & BUSINESS
CHAPTER PREVIEW

23ANNUAL REPORT 2017
CHAPTER PREVIEWOur technology enables precision deposition of thin films in various steps in the fabrication of semiconductor chips, helping our customers build the most advanced chips used in the electronics systems throughout society.
To advance our mission of providing our customers with the most advanced, cost-effective, and
reliable products, service, and global support network in the semiconductor industry and beyond,
in 2017 we continued to develop the three key elements of our strategy:
INNOVATIVE STRENGTH
Our innovative strength is what differentiates us in the marketplace, creates growth opportunities
for our employees, and continues to be the cornerstone of our strategy.
LEADERSHIP IN DEPOSITION
We create value through our advanced thin film deposition technologies, which help leading
semiconductor and technology industry partners to deliver the world of tomorrow through
advanced chips. Our focus areas include high-k metal gate, advanced FinFET transistors,
dielectric spacers for multiple patterning, and a number of other technologies.
OPERATIONAL EXCELLENCE
We aim to provide our customers with dependable, leading-edge products and services at
a consistent quality level, providing the best cost of ownership. To help achieve this, we continue
to optimize our manufacturing and global sourcing processes, including the migration to common
product platforms.
SHAREHOLDERS & GENERAL INFORMATIONFINANCIAL STATEMENTSGOVERNANCEPERFORMANCE REVIEWSTRATEGY & BUSINESSABOUT
OUR STRATEGY
> Mission, vision, strategy and focus areas
> Long-term value creation
> Corporate responsibility
OUR INNOVATION AT WORK
> Collaboration and innovation at work
> Markets and products
> Research and development
> People and society
> Environment
> Supply chain
RISK MANAGEMENT
> Risk management approach
> Risk categories and factors
STRATEGY & BUSINESS
CHAPTER PREVIEW

24ANNUAL REPORT 2017
SHAREHOLDERS & GENERAL INFORMATIONFINANCIAL STATEMENTSGOVERNANCEPERFORMANCE REVIEWSTRATEGY & BUSINESSABOUT
OUR STRATEGY
MISSION, VISION, STRATEGY AND FOCUS AREASOur track record as an experienced innovation leader is the result of focusing on key issues and challenges within the semiconductor industry, enabling us to make a difference to our customers, employees, and company stakeholders. While challenges and opportunities may change over time, we will continue to transform the results of our breakthrough technologies into volume manufacturing, benefiting our customers.
We are committed to making positive contributions to society and striving to prevent harm to people
and reduce our impact on the environment. This is the foundation of our commitment to improve
the communities and industry we operate in. We are a part of a fast-paced industry that continues
to reshape the world. Our technology enables the semiconductor industry to drive innovation
in communications, energy, transport, medicine and beyond.
We are making positive contributions in what we do. We have a certified global environmental
management system to drive continuous improvement in environmental performance across all
of our operations. We are committed to the Responsible Business Alliance (RBA) Code of Conduct
and will strive to meet its goals as best we can on a global basis. We are engaging our supply chain
to do the same. We continue to focus on and enable the achievement of smaller device geometries
which will enable even greater advances and opportunities in communications, energy, medicine and
the positive advances of humanity.
At ASMI we know that meeting the needs of today does not mean compromising the future. Therefore
we encourage our employees to make positive contributions to our customers and suppliers,
our industry, environment, and society reflecting our ambition to drive innovation and deliver excellence.
MISSIONOur mission is to provide our customers with the most advanced, cost-effective, and reliable products, service, and global support network in the semiconductor industry and beyond. We advance the adoption of our deposition technology platforms by developing new materials and process applications that support our customers’ long-term technology roadmaps.
VISIONWe aim to delight our customers, employees, shareholders and society by driving innovation with new technologies, and delivering excellence with dependable products. By doing this, we will create new possibilities for everyone to learn, create, and share more of what they are passionate about.
STRATEGYOur strategic objective is to realize profitable, sustainable growth by capitalizing on our innovative strength in deposition technologies and our strong relationships with key customers. We act thereby as a responsible citizen.
LEADERSHIPIN DEPOSITION
INNOVATIVESTRENGTH
OPERATIONALEXCELLENCE

25ANNUAL REPORT 2017
SHAREHOLDERS & GENERAL INFORMATIONFINANCIAL STATEMENTSGOVERNANCEPERFORMANCE REVIEWSTRATEGY & BUSINESSABOUT
THE KEY ELEMENTS OF OUR STRATEGY ARE:
We are recognized for our technology leadership. We provide leading thin film deposition technologies that support our customers in staying on the curve of Moore’s Law. Our innovative strength is what differentiates us in the marketplace, creates growth opportunities for our employees, and continues to be the cornerstone of our strategy. Apart from our internal R&D efforts, we are continuously expanding and deepening our strategic cooperation with key customers, suppliers, chemical manufacturers, and research institutes such as imec. Our suppliers manufacture advanced components and assemblies to the tightest of tolerances and are required to adhere to our stringent design specifications, quality systems, and corporate responsibility requirements. This approach enables us to remain innovative and swiftly meet the changing demands of our customers.
We create value through our advanced thin film deposition technologies, which help leading semiconductor and technology industry partners to deliver the world of tomorrow through advanced chips. One of these technologies is ALD, which is established as a mainstream technology in high-volume manufacturing, supporting virtually all of the leading customers in the semiconductor industry. As a leader in this space, ALD has turned into a key growth driver for our business. We expect that the trends of continued scaling and evolution towards 3D device structures will further expand the number of applications for ALD. We aim to maintain our leading position in ALD by leveraging on our strong expertise and established customer relationships, and by developing new applications in deposition technologies to support our customers with increasingly complex device node transitions. We are also expanding the applications that we address in epitaxy, by focusing on advanced-node applications in logic/foundry and memory.
While technology leadership remains crucial, we have a responsibility to our stakeholders to continue to focus on further improving the effectiveness of our organization and process efficiency. We aim to provide our customers with dependable, leading-edge products and services at a consistent quality level, providing the best cost of ownership. To help achieve this, we continue to optimize our manufacturing and global sourcing processes, including the migration to common product platforms. We are working with our suppliers to improve fundamental quality through statistical methods and process controls. Our employees are engaged in an improved product life cycle process and our Product Safety Council is focused on further improving product safety through fundamental design.
In addition to addressing the technology needs of our customers, we also focus on further increasing equipment throughput and equipment reliability, thereby lowering the cost per wafer of our wafer processing systems. Combined with our commitment to quality, we continuously strive to achieve industry-leading productivity. In addition, to enable further efficiencies in our manufacturing process and the maintenance process of our customers, we put significant efforts into improving the level of standardization in our equipment portfolio by migrating to common platforms, subassemblies and components.
LEADERSHIPIN DEPOSITION
INNOVATIVESTRENGTH
OPERATIONALEXCELLENCE

26ANNUAL REPORT 2017
SHAREHOLDERS & GENERAL INFORMATIONFINANCIAL STATEMENTSGOVERNANCEPERFORMANCE REVIEWSTRATEGY & BUSINESSABOUT
FOCUS AREASWithin wafer processing, we focus primarily on equipment and process solutions for the deposition
of thin films. Our core strengths are in ALD, epitaxy, Plasma Enhanced Chemical Vapor Deposition
(PECVD), low pressure chemical vapor deposition (LPCVD) and oxidation/diffusion. With this broad
portfolio of technologies, we are addressing many of the key areas on the semiconductor industry
roadmap, including:
› high-k metal gate;
› advanced FinFET transistors;
› dielectric spacers for multiple patterning;
› advanced 3D memories;
› liners, etch stops, and spacers;
› low-k dielectrics for interconnect;
› strained silicon for transistor channel engineering; and
› surface pre-clean for interface control.
Our breakthrough technologies enable the industry to move to smaller line widths and better
transistors that use new materials. We focus on serving the top companies that produce logic
chips and memory devices, which includes addressing the needs of leading foundries. By serving
the leading chipmakers, we maintain an understanding of the important requirements of the next
generation of device roadmaps, enabling us to develop value-added solutions to the industry’s critical
issues. In many cases, new films developed for one device type can be utilized for other device types
with relatively limited additional development.
CUSTOMER FEEDBACKIn February 2017, we received a Supplier Excellence Award from TSMC for the performance and
support of our ALD equipment and technology during 2016. During the presentation of the award,
TSMC explained the three key points that contributed to the award:
1 cutting-edge tool innovations for advanced nodes;2 superb support to achieve quick solutions on consigned tools; and3 great record of on-time tool delivery.
Furthermore, TSMC also recognized ASMI with another Excellent Performance Award at their 2017
Supply Chain Management Forum in December.
In March 2018, ASMI has been recognized by Intel as a recipient of a 2017 Preferred Quality Supplier
(PQS) award. The PQS award recognizes companies like ASMI that Intel believes have relentlessly
pursued excellence and conducted business with resolute professionalism.

27ANNUAL REPORT 2017
SHAREHOLDERS & GENERAL INFORMATIONFINANCIAL STATEMENTSGOVERNANCEPERFORMANCE REVIEWSTRATEGY & BUSINESSABOUT
LONG-TERM VALUE CREATIONWe create value through our technologies by enabling leading semiconductor and technology industry partners to deliver the world of tomorrow through our innovative processing solutions and equipment. We partner with our customers and stakeholders to develop new materials, processes, and technologies that support their technology roadmaps that shape the world of the Internet of Things, smart cars, artificial intelligence, and cloud computing.
In the chip-making process, we are now creating transistors that are only a small number
of nanometers in width. Connecting billions of nanoscopic transistors on a single chip requires
an astonishing degree of precision and control. As a leading supplier of equipment and process
solutions to the semiconductor industry, our technology makes this possible.
GREATER PERFORMANCE, REDUCED ENERGY CONSUMPTIONOur advanced deposition technologies support cost-effective products enabling the electronic
devices of the future. This leads to electronic devices that deliver ever-greater performance while
reducing their energy consumption. Higher performance translates into more processing power, while
a lower energy requirements means smaller, longer-lasting, more efficient products. This enables our
customers to further integrate smart technology into a wider range of their products.
The result is value creation not only for our customers, but for all of our stakeholders. For example,
our employees enjoy the challenge of developing cutting-edge technology solutions, and have
the opportunity for advancement. Our suppliers, in addition to a higher activity level, also benefit
from improved quality based on the use of statistical methods employed in our supplier process
control program.
10 NANOMETER DEVICESThe industry’s relentless push to follow Moore’s Law leads to the continuous demand for smaller,
faster, and cheaper semiconductor components. Thus, the minimum size of a single transistor in an
integrated circuit is an important parameter. As the transistors in an integrated circuit become smaller,
the cost-per-component decreases. At the same time, the operating speed of the transistor increases.
Today, our customers manufacture semiconductor devices as small as 10 nanometers (one
nanometer, or nm, is one billionth of a meter), sometimes in a vertical 3D transistor or FinFET
architecture. Our customers are already qualifying and testing new critical processes to generate
devices with line widths at or below 7nm. Simultaneously, in our customers’ laboratories and several
collaborative research environments, advanced 5nm design rule devices and related materials are
being developed. These next-generation technology nodes are increasing the demand for new
materials and more complex process integration methods.
In developing faster and smaller devices, our customers’ major technology requirements are:
› introduction of new thin-film materials and device designs needed for continued scaling;
› reliable manufacturing of taller and narrower 3D structures in devices;
› lithography of ever-smaller feature sizes, now much smaller than the wavelength of visible light; and
› new manufacturing processes that reduce device variability and increase yield.
DEVELOPING NEW MATERIALSIn order to meet our customers’ needs, we are developing many new materials. For example, ALD
technology is used to create ultra-thin films of exceptional quality and flatness. ALD of high-k dielectrics
and novel metal gate electrodes can improve the performance and reduce the power consumption
of a device, thereby enhancing battery life. This same class of materials can also lead to larger charge
storage in a smaller capacitor, critical for memories and RF circuits.
In addition to the development of the high-k dielectric, there is also a great deal of focus on new
technologies and materials for the metal gate electrode, the gate sidewall passivation, and many
other applications. Plasma Enhanced ALD (PEALD) is an important technology that enables precise
deposition at very low temperatures. One application of PEALD is spacer defined multi-patterning,
whereby the deposition of a highly conformal oxide spacer enables the extension of existing optical
lithography technology beyond its basic resolution limits. Another example of new materials is from
epitaxy deposition.

28ANNUAL REPORT 2017
SHAREHOLDERS & GENERAL INFORMATIONFINANCIAL STATEMENTSGOVERNANCEPERFORMANCE REVIEWSTRATEGY & BUSINESSABOUT
EPITAXYEpitaxy is a process for depositing highly controlled silicon-based crystalline films. Many epitaxy
steps are used to create the transistor channel and for channel engineering to improve transistor
performance. Our silicon-germanium (SiGe) and silicon-carbon-phosphorous (SiCP) epitaxial
materials can increase the switching speed of the transistors and the circuit in which they are
embedded by so-called strain engineering. Strained silicon is a layer in which the atoms are stretched
beyond their normal interatomic distance, allowing higher electron mobility. This results in faster
transistor switching at lower power. In 2017, we introduced a new epitaxy tool, the Intrepid ES,
for advanced-node CMOS logic and memory applications, which offers an innovative closed-loop
reactor temperature control system enabling precise process control, high productivity, and low cost
per wafer.
LOW-K MATERIAL SUITEFor interconnect processes, a continued demand to improve the speed at which signals travel
through thin copper wires has led to the development of a full suite of low-k materials. These
low-k materials can decrease the amount of delay in signal propagation, resulting in, for example, faster
microprocessors. Simultaneously, these low-k materials can reduce the amount of power loss in the
interconnections. We have been one of the leaders in successfully introducing these low-k materials
in the market, and we are continuing to develop improvements to this low-k technology to enable
faster interconnect circuits.
HIGH PRODUCTIVITYIn addition to addressing the technology needs of our customers, the relentless drive of the industry
to reduce cost corresponds to significant spending on development programs that further increase
throughput, equipment reliability, and yield in our customers’ line, and further lower the cost per wafer
of the wafer processing systems.
An excellent example of high productivity is our XP8 platform, on which we offer PEALD and PECVD
processes. The XP8 incorporates eight process chambers in a compact configuration around
one central handling platform. Two wafers are moved simultaneously into dual chamber modules
(DCM), which generally doubles the throughput compared to single wafer movements. Eagle XP8
PEALD tools and Dragon XP8 PECVD tools are in volume manufacturing at logic and memory fabs
worldwide, and demonstrate reliable advanced performance with high productivity.
ALD AT ASMIALD is one of the newest technologies to deposit ultra-thin films of exceptional flatness and uniformity.
This technology was brought into ASMI in 1999 with the acquisition of Microchemistry, who first
developed thermal ALD technology. Plasma Enhanced ALD (PEALD) is an extension of this original
ALD technology that uses plasma, which was brought into ASMI in 2001 through a partnership with
Genitech, and a subsequent acquisition in 2004 and formation of ASM Korea.
The use of plasma enables us to deposit high-quality films at very low temperatures. ALD is a very
versatile technology that can be used to deposit high-k insulating materials, conductors, silicon
oxide, silicon nitride, and other materials. We expect the trends of continued scaling, and evolution
towards 3D device structures for both logic and memory devices, to play into the strength of our ALD
position. We offer ALD/PEALD processes on several of our product platforms, including single-wafer
and batch systems, and for multiple wafer sizes.
OUR BUSINESS MODELOur technology enables precision deposition of thin films in various steps in the fabrication
of semiconductor chips, helping our customers build the most advanced chips used in the electronics
systems throughout society.
Our business model enables us to create value for the company and all of our stakeholders.
We achieve this by working with our customers to develop innovative solutions, while constantly
looking at what is best for our investors, our employees, society, and other stakeholders.
Fundamental to our model is R&D investment, including basic chemical, materials, and feasibility
research, followed by process and product developments. We endeavor to continuously employ
experts in the semiconductor process and equipment technology fields. We cooperate with research
institutes and our customers to understand the technology roadmap challenges and to develop
the appropriate process and equipment solutions required. Our manufacturing facilities allow us to
deliver high-quality systems on schedule so that our customers can ramp their fabrication plants.
We support our customers globally with process and equipment service, and spare parts.

29ANNUAL REPORT 2017
SHAREHOLDERS & GENERAL INFORMATIONFINANCIAL STATEMENTSGOVERNANCEPERFORMANCE REVIEWSTRATEGY & BUSINESSABOUT
HUMAN CAPITAL
INTELLECTUAL CAPITAL
FINANCIAL CAPITAL
388
115
3.21
774
18,083
OUTPUTS
Revenue per employee (EUR thousand)
Patent filings
Earnings attributable to shareholders per share
Bookings (EUR million)
GHG emission scope 1&2 (mtCO2e)
MANUFACTURING
& SUPPLY CHAIN CAPITAL
NATURAL CAPITAL
CONTRIBUTION TO IMPROVE GLOBAL WELL-BEINGAs measured by sustainable development goals
HOW WE CREATE VALUE
HUMAN CAPITAL
INTELLECTUAL CAPITAL
FINANCIAL CAPITAL
1,900
114
3,165
334
33,011,075
INPUTS
Employees
R&D investment (EUR million)
Market capital (EUR million)
Manufacturing supply chain spending (EUR million)
Electric usage (KwH)
MANUFACTURING
& SUPPLY CHAIN CAPITAL
NATURAL CAPITAL
OUR BUSINESSASMI designs,
manufactures, sells andservices complex wafer
processing equipment usedin various steps in the
fabrication of semiconductorintegrated circuit chips.
OUR STAKEHOLDERS
INNOVATIVESTRENGTH
LEADERSHIPIN DEPOSITION
OPERATIONALEXCELLENCE
OUR LONG-TERM STRATEGIC PILLARS
INVESTORSCUSTOMERS SOCIETYEMPLOYEES

30ANNUAL REPORT 2017
SHAREHOLDERS & GENERAL INFORMATIONFINANCIAL STATEMENTSGOVERNANCEPERFORMANCE REVIEWSTRATEGY & BUSINESSABOUT
CORPORATE RESPONSIBILITYSince 1968 we have helped the industry to create smaller, cheaper, and more powerful microchips. Our focus is on continuing to help our customers achieve their technology roadmap, by expanding our broad portfolio of innovative technologies and products.
Our innovations have led to a range of scientific breakthroughs, which have positively benefited
many aspects of society. We have pioneered technologies that are widely used today, including
photolithography, epitaxy, ion implantation, and atomic layer deposition (ALD). These innovations
support our customers’ roadmaps to bring the end consumer the technologies of today
and tomorrow.
Our investment in research and development (R&D) is key to our mission. We have R&D partnerships
with customers, universities, industry groups, and with our suppliers. We believe these partnerships
help us positively influence many segments of society around the world. This is a responsibility
we incorporate into our CR strategy.
The key elements of ASMI’s strategy, being Innovative Strength, Leadership in Deposition, and
Operational Excellence, are reflected in our corporate responsibility (CR) strategy:
› strengthen our R&D and innovation to create value for society;
› support innovation by managing all aspects of our business responsibly to meet or exceed
stakeholder expectations; and
› recognize that managing all aspects of our business includes holding our critical suppliers to the
same standards we hold ourselves to.
The United Nations’ Sustainable Development Goals (SDGs) reflect the priorities of global society, and
our CR strategy makes significant contributions to a number of these important goals.
The ways we contribute to these SDGs are described below in the detailed descriptions of our three
strategic CR pillars.
PILLAR 1 – STRENGTHEN R&D AND INNOVATIONFor decades, we have contributed technological innovations that help drive modern society.
To continue to innovate and benefit society, we need to focus strongly on our R&D efforts, and
improve the way we bring our product to market through our product life cycle process.
Of course, these societal benefits can only be realized when innovations are brought to market.
An efficient and effective product life cycle process is therefore important to bring continually
improved technological capabilities to all aspects of life.
Our investments in R&D and our breakthroughs in bringing technological advances to the
marketplace enable us to make substantial contributions to several aspects of SDG 9: Industry,
Innovation and Infrastructure.
› Continue our strong focus on R&D and innovation to create value for society through technology.
› Manage all aspects of our business responsibly to meet or exceed stakeholder expectations.
› Hold our critical suppliers to the same standards that we hold ourselves to.
CR STRATEGY
Our mission is to provide our customers with the most advanced, cost-effective, and reliable products, services and global support network in the semi conductor industry, and beyond.
ASMI MISSION
As a truly global citizen, our vision of ZERO HARM! means we strive to reduce our impact on the environment, and positively contribute to society.
CR VISION

31ANNUAL REPORT 2017
SHAREHOLDERS & GENERAL INFORMATIONFINANCIAL STATEMENTSGOVERNANCEPERFORMANCE REVIEWSTRATEGY & BUSINESSABOUT
PILLAR 2 – MANAGE ALL ASPECTS OF BUSINESS RESPONSIBLYWe believe that responsibly managing our business creates value for our company, as well as our
stakeholders and society. Our key corporate responsibility philosophy is ZERO HARM! We strive
to prevent harm to people, reduce our impact on the environment, and make positive contributions
to society. To achieve these goals, we strive to be innovative and challenge conventional approaches,
using our guiding principle ‘Drive Innovation, Deliver Excellence’.
Our CR policy lays out our commitment and expectations to health and safety, the environment,
labor, ethics, and supply chain management. Each of these areas is further supported by policies,
systems, programs, and metrics to ensure that we meet our long-term objectives. The full text of our
CR policy is available on our website.
Through stakeholder alignment, we have based our CR Strategy on the Responsible Business Alliance
Code of Conduct (RBA, formerly the Electronics Industry Citizenship Coalition, EICC) framework.
The RBA Code of Conduct (the Code) has been widely adopted throughout the electronics
industry, with the semiconductor industry and its value chain an essential aspect of this. Many
of our customers are RBA members, and as a critical supplier to them we are expected to adopt
the Code. The Code, evolves constantly to cover the most recent developments in responsible
business practices, and is updated regularly to stay abreast of societal norms and expectations,
and the evolution of international standards and expectations. We are committed to upgrading our
management practices as the Code and other standards and expectations evolve. Currently, the
Code references and follows multiple international expectations and standards, including:
› the OECD Guidelines for Multinational Enterprises;
› the Universal Declaration of Human Rights; and
› the ILO International Labor Standards and International Organization for Standardization (ISO).
Differences between the Code and the OECD Guidelines are mainly related to business-to-consumer
aspects which are not relevant to our business. We use the Code, its supporting documentation,
and engagement with RBA member customers to drive a continuous improvement process within
the company. The framework of the Code allows us to critically assess our compliance with it and
customer expectations. We routinely assess our standing with the Code via multiple methods,
including self-assessments, internal audits, and customer audits.
However, responsibility is more than codes and standards, it is also about understanding stakeholder
priorities, our material aspects, and integrating responsible business practices into our strategies,
objectives, and processes. In this way, we are routinely reassessing ourselves, engaging with
key stakeholders, and finding ways to reduce harm, and bring value to society. Employees are
encouraged to contribute to this at ASMI, helping strengthen our ZERO HARM! vision.
Through our efforts to manage all aspects of our business responsibly, we contribute to global
progress towards the SDGs for gender equality, decent work and economic growth, responsible
production, and climate action (SDGs 5, 8, 12 and 13).
PILLAR 3 – HOLD CRITICAL SUPPLIERS TO THE SAME STANDARDSOur supply chain is the full system of building and delivering our products to customers. We know
we lead a larger system to deliver our final product, and we drive responsibility within that system.
Our approach is driven by our Supplier Code of Conduct (CoC). We have taken into account our
stakeholder requirements for a supply chain compliant with the RBA Code of Conduct, and have
adopted the Code directly as our Supplier CoC. This ensures our critical suppliers are aligned with
the policies and expectations of ASMI. We require our direct suppliers to acknowledge the CoC.
If non-compliance is identified, we may choose to terminate the supplier relationship.
Self-Assessment
Questionnaire (SAQ)
PHASE 2PHASE 1
Riskassessment
PHASE 3Auditing/
Corrective actions
CRITICAL SUPPLIER CR STRATEGY
RBACODE OF CONDUCT
We operate an assurance process for our critical suppliers, who are identified annually based on key
elements such as, but not limited to, the amount we spend with them, how many similar or alternative

32ANNUAL REPORT 2017
SHAREHOLDERS & GENERAL INFORMATIONFINANCIAL STATEMENTSGOVERNANCEPERFORMANCE REVIEWSTRATEGY & BUSINESSABOUT
suppliers exist, and the amount of time we would need to switch suppliers if we had to. We set
objectives for Code acknowledgment, self-assessment, and auditing/corrective action processes
that are consistent with RBA requirements.
Our customers also view the ASMI supply chain as their own. Their value chain includes our value
chain, and their feedback in 2017 places emphasis on preventing forced and bonded labor (FLBL)
and increased attention on diversity.
By focusing on responsible business practices in our supply chain, we expand our impact and our
contribution to the achievement of relevant SDGs.
CR STRATEGY AND GOVERNANCE Our CR management system relies on the Corporate Governance Framework set out in the
Governance section of this report. This begins with the Supervisory Board and Management Board
and the corporate governance standards and values they hold the company accountable to.
Our Management Board is actively engaged in corporate responsibility through the Corporate Vice
President of Human Resources, who is also Chairperson of the ASMI Ethics Committee, and the
Corporate Vice President of Operational Excellence, who is directly responsible for the Environmental,
Health, Safety, and Corporate Responsibility of the company.
Working together, these two organizations define the strategy and approach to corporate
responsibility in terms of environmental performance, employee health and safety, labor and ethics,
which is subject to approval of the Management Board. The implementation and control of economic
and financial aspects is overseen by the Management Board. The Management Board is supported
by various functions that each regularly provide forward looking information for the company and the
business it operates in.
>
>
>
>
MANAGEMENT BOARD,
SUPERVISORY BOARD AND COMMITTEES
VALUES AND ETHICS
mis
sio
n
OB
JEC
TIV
ES
VISION
STRATEGY
CORPORATEGOVERNANCE
POLICIES & REGULATORY FRAMEWORK
TRANSPARENCY AND
ACCOUNTABILITY
RISK AND PERFORMANCEMANAGEMENT
MONITORING AND INTERNAL
CONTROL
CORPORATE GOVERNANCE FRAMEWORK
COMMITTEESETHICS COMMITTEEOur Ethics Committee governs our system of ethics, and reports to the Management Board. The
committee is chaired by the Corporate VP of Human Resources, and is composed of representation
from the departments legal, corporate responsibility, internal audit, and regional human resources.
This committee monitors global ethics issues facing our industry and society, receives feedback
from stakeholders, and closely monitors issues we face to set and improve our ethics management
system. The committee also monitors performance to the system, meeting regularly and reporting
progress to the Management Board. The Ethics Committee also has the important role of supervising
the investigation of all ethics-related complaints, including those anonymously reported via SpeakUp!.
The SpeakUp! process enables employees, suppliers, customers and any other stakeholder to report
ethics issues, concerns or complaints, anonymously and in their own language.

33ANNUAL REPORT 2017
SHAREHOLDERS & GENERAL INFORMATIONFINANCIAL STATEMENTSGOVERNANCEPERFORMANCE REVIEWSTRATEGY & BUSINESSABOUT
RESPONSIBLE BUSINESS ALLIANCE COMMITTEEThe RBA Committee is chaired by the Director Global Corporate Responsibility and is comprised
of subject matter experts and executives. The RBA Committee governs the RBA framework and
performance, and reviews applicable stakeholder feedback to the committee’s oversight of material
issues, meeting regularly throughout the year. The committee sets performance objectives and
reports to the Management Board.
STAKEHOLDER ENGAGEMENTIntegration and alignment with the world around us makes us stronger. We learn, grow, and evolve
to be a better company with feedback and input from stakeholders. Their feedback can help
us shape strategy, policy making, and objectives in relevant areas of social responsibility. Stakeholder
feedback also helps to ensure that our decisions and innovations lead to meaningful benefits for all
key stakeholders.
A key step in engagement is first identifying key stakeholders, including:
› customers;
› employees;
› suppliers;
› shareholders and investors;
› society, including but not limited to:
› governments and regulators;
› non-governmental organizations (NGOs);
› industry consortiums and partners;
› local communities in which we operate.
KEY OUTCOMES OF ENGAGEMENTS IN 2017
STAKEHOLDER ENGAGEMENT METHOD FEEDBACK OUTCOME
Customers Direct customer meetings (recurring) Attending customer supplier development sessions (recurring)
Engagement with our key customers has provided systematic inputs for our annual program to improve the structural maturity and operational performance of the company
ASMI continues to score higher on supplier process maturity scales with key customers, and strengthens its related policies, procedures, and activities
Employees Bi-annual survey Survey conducted of all worldwide lab employees, with feedback on areas to improve safety and satisfaction in the labs
Focused lab safety improvement plan with targets tied directly to the employee feedback, including improvements in communication of lab safety project improvements, and improvements in routine manager and employee participation audits
Industry consortium and partners Renewed R&D partnership with imec Extended University of Helsinki partnership
Cooperation and bilateral research activities Additional ALD, PEALD, Epitaxy, and LPCVD capability
These key outcomes are just a few examples of how we consider stakeholder input and feedback,
which we use to further improve our strategies, targets and ultimately our performance.
Additionally, in 2017 we continued to participate in the Transparency Benchmark, an annual
assessment on the content and quality of corporate social responsibility reports of Dutch companies.
The benchmark helps us gain insight on not only improved reporting, but also on strengthening our
programs. Our 2017 performance in the benchmark improved 23% over the 2016 scoring. This
benchmark is viewed as an important tool to various stakeholders, including the Dutch Ministry
of Economic Affairs as the administrators of the benchmark, and others who have expressed interest
as the VDBO and SRI focused investors.

34ANNUAL REPORT 2017
SHAREHOLDERS & GENERAL INFORMATIONFINANCIAL STATEMENTSGOVERNANCEPERFORMANCE REVIEWSTRATEGY & BUSINESSABOUT
MATERIALITYIn 2015, we introduced our materiality assessment process. The process provides us with the
opportunity to continually assess if our strategic objectives, actions, and initiatives are aligned with
our stakeholders and overall importance to our business. The process has remained constant since
then, following the sustainability materiality steps and matrix based on the Global Reporting Initiative’s
(GRI) G4 Sustainability Reporting Framework, and represents the internal and external stakeholders
we have identified. We have also identified environmental, social, and economic aspects that have
the greatest impact on our business and have generated the greatest level of interest with our
stakeholders across our value chain. The assessment encompasses aspects that are internal and
external to the organization.
The materiality assessment continues to capture more aspects of our business, and in the three
cycles it has been conducted there has been a slight shift, in importance levels. The risk ranking
of the relevant aspects provides a list of our primary strategic focus areas.
For example, while ‘company financial health’, ‘innovation and R&D investment’, and ‘product
safety and compliance’ are still the highest-ranking aspects, there has been a gradual increase
in importance of ‘information security’. In response, we continue to assess our information security
positions, and improve on protection strategies.
ECONOMIC
Company financial health
Innovation and R&D investment
Protecting and using
intellectual property
Business risk and business
continuity (BCP)
Product life cycle management
SOCIAL
Worker health and safety
Information security
Attracting, developing and
retaining talent
Ethics and code conformance
Training and education
Employee relations and
workplace vitality
Stakeholder engagement
and communication
Trusted partner for customers via
code conformance
Supply Chain EHS
Human rights/conflict minerals
Supplier Labor Standards
Diversity
Community engagement
ENVIRONMENTAL
Product safety and environmental
compliance
Hazardous substance management
Energy use/greenhouse gas
(GHG) reduction
Water usage/recycling
Recycling/reuse
1
6
9
12
13
4
2
7
11
15
16
17
18
3
8
10
14
5
RELEVANT IMPACT TO OUR BUSINESS
IMP
OR
TAN
CE
TO
OU
R S
TAK
EH
OLD
ER
S
12
15
12
17
6
7
14
13
9
18
3
4
8
11
10
16
5
Note: Those aspects in the top-right segment of the chart are referred to as ‘primary aspects’ in this report.
OUR PRIMARY ASPECTS
19
20
21
22
2322
20
19
23
21

35ANNUAL REPORT 2017
SHAREHOLDERS & GENERAL INFORMATIONFINANCIAL STATEMENTSGOVERNANCEPERFORMANCE REVIEWSTRATEGY & BUSINESSABOUT
All aspects shown in the materiality matrix results are material. Decisions on how to prioritize
resources are made regularly, with priority given to those in the high Impact and Importance category.
These are considered the primary aspects.
Each one of the current primary aspects is considered strategic to the business, and is integrated
with strategic initiatives where applicable. One example is the investments made in R&D, which
result in patents and intellectual property that are part of the assets protected by our information
security systems. Protecting these investments helps drive company financial health through product
development and customer confidence.
Those near the bottom of the assessment are not considered immaterial. In many cases, we do
evaluate those against future risks and global trends. One example is the environmental performance
aspects. We recognize that climate change, resource conservation, and water management are
critical to the survival of the planet. Our impact may be small compared to other companies, but
the collective contribution of everyone can have an impact on future generations. We know we can
do our part, and strive for improvements in the way we manage our environmental impact. One
example of this is the implementation of a water reuse system at our Phoenix facility.
Our validation process is managed through the internal committees and business function owners.
Those organizations use applicable market research, benchmarking, and performance assessments
to identify gaps and opportunities, as well as risks and challenges to set future strategies, steering
methods, and controls.

36ANNUAL REPORT 2017
SHAREHOLDERS & GENERAL INFORMATIONFINANCIAL STATEMENTSGOVERNANCEPERFORMANCE REVIEWSTRATEGY & BUSINESSABOUT
PRIMARY ASPECTS OUR STRATEGIESSETTING STRATEGIES, STEERING AND CONTROLS NEW IN 2017 RESULT/STAKEHOLDERS’ IMPACT
ECONOMIC
1 Company financial
health
2 Innovation and
R&D investment
3 Protecting and using
intellectual property
› Realize profitable, sustainable growth through innovation
› Maintain technology leadership in deposition
› Invest in and develop new applications to support our customers’ with increasing technology requirements
› Leverage our strong technology expertise to enhance customer/stakeholder relationships
› Create the company culture and environment for innovation and patent creation with strong IP protection programs
› Management meetings
› Market assessments
› Business unit/operational reviews
› Technical steering meetings
› Legal reviews
› Renewed R&D partnerships with imec and University of Helsinki
› Continued implementation of software, training and agreements protecting IP
› Technology leadership recognition with sustainable profitability and business growth
› IP creation/Patent creation
SOCIAL
6 Worker health and
safety7 Information security8 Attracting, developing
and retaining talent9 Ethics and code
conformance
› We use performance evaluation, succession planning, and employee learning and development programs
› Establish leadership academy to ensure our leadership pipeline and stay competitive in labor markets
› We partner closely with select top universities globally for technology development and recruitment
› Conducts business according to ethical and professional standards
› Implement Ethics Code of Conduct, CR policy and commitment to our RBA Code of Conduct
› Secure IT systems
› Global Human Resources
› Global EHS
› Global IT
› Ethics Committee
› Globally harmonized new employee onboarding process
› Interactive platform for developing managerial skills
› Piloting technical career ladder for engineers
› Lab gas system improvements
› Customer safety leadership engagements
› Management safety audit leadership
› Gifts and entertainment policy and reporting improvements
› Enhanced employee IT security awareness
› IT Infrastructure modernization
› Stable workforce with suitable technology and leadership capability
› Employees’ professional development
› Employment creation and employee satisfaction
› Safer work environment and processes
› Closer engagement with customers for shared work environments
› Compliance and responsible business practices
› Secure innovation and personnel data
ENVIRONMENTAL
19 Product safety and
environmental
compliance 20 Hazardous substance
management
› Reduce overall risk of exposure with focus on high risk activities and functions, including Labs, Manufacturing and Service
› Contribute to the communities in which we operate, and continuously strive to reduce the environmental impact
› Product safety steering committee
› Business unit engineering
› Global EHS and facilities
› Strengthen product compliance team
› Improved standardization of global design standards
› Lab gas system enhancements
› Improvements in chemical storage infrastructure
› Compliant and safe products
› Customer satisfaction and safety
› Minimize environmental impact and protect communities in which we operate
The table above provides an overview of the primary aspects and their related strategies.

37ANNUAL REPORT 2017
SHAREHOLDERS & GENERAL INFORMATIONFINANCIAL STATEMENTSGOVERNANCEPERFORMANCE REVIEWSTRATEGY & BUSINESSABOUT
For full discussion on each aspect, please refer to the following:
PRIMARY ASPECT MORE INFORMATION IN
1 Company financial health Financial statements
2 Innovation and R&D Investment Research and development
7 Information security Research and development
19 Product safety and environmental
compliance
Markets and products
8 Attracting, developing and retaining
talent
People and society
3 Protecting and using intellectual
property
Research and development
9 Ethics and code conformance People and society
6 Worker health and safety People and society
20 Hazardous substance management Environment
TAX PRINCIPLETaxes are determined and paid in accordance with all relevant rules and regulations in the countries
in which we operate. We do not use artificial tax structures solely aimed at tax avoidance. We aim
to follow both the letter as well as the spirit of the law.
We apply the arm’s length principle to determine transfer prices in accordance with domestic
and international rules and standards, such as the OECD Guidelines for Multinational Enterprises.
Our disclosures are made in accordance with the relevant local and/or international regulations.
Our goal is to seek an open and constructive dialog with the tax authorities in the countries where
we operate, and we aim to disclose all relevant facts and circumstances. We believe that this will
enhance certainty on our respective tax position in view of the applicable tax rules and regulations.

38ANNUAL REPORT 2017
SHAREHOLDERS & GENERAL INFORMATIONFINANCIAL STATEMENTSGOVERNANCEPERFORMANCE REVIEWSTRATEGY & BUSINESSABOUT
COLLABORATION AND INNOVATION AT WORKCollaboration and innovation are key to our success. While our core technologies, products, and services enable our customers to develop their technology roadmap, our capabilities hinge on the partnerships we enjoy with all our stakeholders. Partnerships that include our key customers, suppliers, research institutes, universities, society and, of course, our people. Without our people, we would not be the company we are today. Below we have outlined those areas where collaboration and innovation are vital to our continued success.
MARKETS AND PRODUCTSAs an innovation leader for nearly a half-century, the greatest contribution we make to society
is through our advanced technology developments, including Atomic Layer Deposition (ALD), plasma
deposition, and epitaxy. The result? A broad range of products, services, and innovative solutions
that support our customers to make the products that connect the world.
RESEARCH AND DEVELOPMENTOur research and development (R&D) teams develop the new materials and processes that lead
to the technological breakthroughs that drive us forward. But achieving these breakthroughs
involves working closely with our research partners and customers. As part of our efforts to increase
innovation, we continue to pursue and enhance strategic R&D partnerships with universities, industry
groups, and customers.
BREAKTHROUGH TECHNOLOGIESOur long track record of scientific breakthroughs helps to create transistors only a few times larger
than a single strand of DNA. Working alongside our customers, we have co-created technology
roadmaps that have led to a range of advanced technologies, including the home computer,
smartphones, medical equipment, and nearly every device containing an integrated circuit. Today, the
strong relationships that enable us to develop our technologies help support the astonishing leaps
behind the Internet of Things, cloud computing, artificial intelligence, and smart cars.
PEOPLE AND SOCIETYThe world we live in is made up of a series of connections: people connecting to people; people
connecting to machines; and machines connecting to machines. At ASMI, we know that it takes
the right mix of people, working together, to solve big challenges. This is why we attract and invest
in talented people from around the world. By investing in their future, we believe we are investing in all
our futures.
ENVIRONMENTOur technologies contribute positively to the world around us through improved computing power
and reduced energy consumption. We recognize, however, that this is not enough, and are striving
to reduce the environmental footprint of our direct operations. We align our strategies across the
industry, including with customers and industry standards, to focus on key areas such as reducing
greenhouse gases and water consumption, improving our recycling and reuse of raw materials, and
focusing on responsibly designed and operated facilities.
SUPPLY CHAINAs our technologies develop and expand, our partnerships for success also must grow to meet the
increasing demands of our customers. A strong supply chain is critical to our success. We have
set forth a framework for technological strength at a competitive cost, as well as resiliency and
responsibility in our operations and supply chain.
OUR INNOVATION AT WORK

39ANNUAL REPORT 2017
SHAREHOLDERS & GENERAL INFORMATIONFINANCIAL STATEMENTSGOVERNANCEPERFORMANCE REVIEWSTRATEGY & BUSINESSABOUT
MARKETS AND PRODUCTSThe semiconductor capital equipment market is composed of three major market segments: wafer processing equipment, assembly and packaging equipment, and test equipment. We operate in the semiconductor wafer processing equipment market, primarily for deposition equipment.
MARKETSIn 2017, the semiconductor industry was driven by a US$2 trillion global electronics industry
(VLSI Research Chip Insider, January 23, 2018) that required approximately US$350 billion
of semiconductors, which was up by around 20% compared to 2016, driven mostly by higher prices
in memory devices. In turn, the semiconductor industry supported the approximately US$71 billion
semiconductor capital equipment industry (up around 30% compared to 2016), which supplies the
required production systems and services. The equipment segment was driven mostly by capacity
expansion in 3D-NAND memory fabs, technology conversion investments in DRAM memory fabs,
and new technology generation investments in logic and foundry fabs.
We serve the wafer processing equipment segment, which is part of the capital equipment segment.
This, in 2017, was worth approximately US$47 billion. Demand for semiconductor capital equipment
is driven both by growth in the market for semiconductor devices and the new technology needed
to realize the next generation of devices.
LOGIC, FOUNDRY AND MEMORY MARKETS › ASMI supplies equipment to the leading semiconductor manufacturers in the logic, foundry, and
memory markets, primarily for the deposition of thin films;
› The logic market is made up of manufacturers who create chips that are used to process data.
Known as the central processing unit (CPU), this microprocessor is the ‘brains’ of a computer
system, and can be found in smartphones, laptops, and computers;
› The foundry market consists of businesses that operate semiconductor fabrication plants to
manufacture the designs of other so-called fabless semiconductor companies; and
› The memory market covers manufacturers who make chips that store information either temporarily,
such as Random Access Memory (RAM), or permanently, such as NAND non-volatile memory.
The NAND memory market has evolved to include 3D-NAND chips, which are designed for the
vertical stacking of memory cells to increase bit density.
ANALOG DEVICE MARKETSWe also supply equipment to leading manufacturers of analog semiconductor devices, which are
important for enabling the increasing semiconductor content used in most products worldwide.
The analog market includes a wide array of chip types, including:
› power management;
› signal processing;
› MEMS;
› sensors;
› discretes, and others.
The industry recently adopted the phrase ‘More than Moore’, to identify and acknowledge a strongly-
growing market of various types of analog chips which are not driven by the same Moore’s Law
technology scaling inflections of mainstream logic and memory chips. But these ‘More than Moore’
devices often have their own various technology challenges.

40ANNUAL REPORT 2017
SHAREHOLDERS & GENERAL INFORMATIONFINANCIAL STATEMENTSGOVERNANCEPERFORMANCE REVIEWSTRATEGY & BUSINESSABOUT
PRODUCTSMARKET COVERAGE The semiconductor capital equipment market is composed of three major market segments:
› wafer processing equipment;
› assembly and packaging equipment; and
› test equipment.
We are active in the wafer processing segment. Within wafer processing equipment, the major
segments are:
› lithography;
› CMP;
› ion implant;
› deposition;
› etch & clean; and
› process diagnostics.
The principal market segment in which we participate is deposition and related tools. Within the
deposition market, the major equipment technology segments are:
› chemical vapor deposition (CVD);
› physical vapor deposition (PVD);
› atomic layer deposition (ALD);
› rapid thermal processing (RTP);
› epitaxy; and
› diffusion/furnace.
OUR PRODUCTSOur products include wafer processing deposition systems for CVD, ALD, epitaxy, and diffusion/
furnace. We make two types of process tools: single-wafer and batch. The majority of our business
comes from single-wafer tools, which are designed to process an individual wafer in each processing
chamber on the tool.
In contrast, a batch tool is designed such that a large number of wafers are processed simultaneously
in a larger processing chamber. Batch tools typically achieve a higher throughput compared to single
wafer tools.
Single-wafer tools typically achieve a higher level of process performance and control, especially
for complex, critical applications. We work closely with our customers to meet their demands, and
in recent years we have developed single wafer tools with multiple chambers configured together
in a compact way on a single platform. This approach offers the best of both worlds, combining high
productivity and a high level of performance.
Our XP platform is a high-productivity common 300mm single-wafer platform that can be configured
with up to four process modules. The XP platform enables high-volume multi-chamber parallel
processing or integration of sequential process steps on one platform. The XP common platform
benefits our customers through reduced operating costs, as many of our products use the same
parts and consumables, and a common control architecture improves ease of use.
Our XP8 platform follows the basic architectural standards of the XP, but provides even higher
productivity with up to eight chambers integrated on a single-wafer platform with a small footprint.
BREAKTHROUGH TECHNOLOGIESWe are a leading supplier of ALD equipment and process solutions for the semiconductor industry.
Today, our ALD process technology delivers the highest performance available to support the next
generation of semiconductor devices.
Precursor
Byproduct
ByproductOxidant
PURGE
ALD CYCLE
PURGE
ATOMIC LAYER DEPOSITION
21
34

41ANNUAL REPORT 2017
SHAREHOLDERS & GENERAL INFORMATIONFINANCIAL STATEMENTSGOVERNANCEPERFORMANCE REVIEWSTRATEGY & BUSINESSABOUT
INCREDIBLE PRECISIONALD allows us to deposit thin films atom-by-atom on silicon wafers, meaning we can deliver atomic-
scale thickness control, high-quality deposition film properties, and large area uniformity.
With such precision, we can use materials that previously could not be considered, and develop
3D structures that are vital to the future of electronics. 3D technology provides a number
of real benefits, including saving space while delivering chips with higher performance that consume
less power.
ALD IN VOLUME MANUFACTURINGOur ALD technology is being used to build ICs for a wide range of leading-edge products, including
high-performance computers and smartphones. The results of ALD are visible everywhere in the
world around us.
ALD is also our basic platform for the development of a wide range of new materials. Our research
centers across the globe are working on ALD, and we are conducting joint research projects with
Europe’s largest independent research institute, imec. Taken together, this helps make ALD one
of the principal drivers for future growth in microelectronics.
ALD – A DRIVER OF FUTURE GROWTHUsing ALD, we can deposit new materials several atoms thick on semiconductor wafers, producing
ultra-thin films of exceptional quality and uniformity.
In PEALD, plasma is used to provide the reaction energy for the process, enabling us to use lower
temperatures for low-thermal budget applications. This technology was introduced in DRAM and
planar NAND flash manufacturing in the 3x nm node, for spacer-defined double patterning (SDDP),
a technique that can reduce device dimensions, postponing the need for new lithography technologies.
Using ALD technology, we can scale devices to smaller dimensions while reducing the power
consumption of transistors, all of which helps the industry follow Moore’s Law and create smaller,
more powerful semiconductors. For advanced 3D memory applications, where devices are stacked
vertically in high densities, ALD is critical for uniformly depositing films in deep trenches and over
complicated features. Many new applications are emerging where ALD is the technology of choice,
and in a number of cases the only solution that meets the challenging technology requirements.
We expect ALD to be one of the principal drivers of growth in microelectronics over the coming
decade. In addition, we expect growth in other deposition technologies, including epitaxy for
advanced transistors and PECVD for creating improved interconnects. Looking ahead, we will
continue to develop the huge potential of our deposition technologies in support of the semiconductor
industry, enabling the industry to support the future demands of consumers and businesses.
EPITAXYEpitaxy is a critical process technology for creating advanced transistors and memories. The epitaxy
process is used for depositing precisely controlled crystalline silicon-based layers that are important
for semiconductor device electrical properties. In some cases, the epitaxy films incorporate dopant
atoms to achieve specific material properties.
Epitaxy process temperature control is of the utmost importance. We have developed new methods
of temperature control in our Intrepid ES epitaxy tool that enable improved film performance and
repeatability in volume production. Furthermore, Intrepid’s closed-loop reactor temperature control
enables enhanced stability in production.

42ANNUAL REPORT 2017
SHAREHOLDERS & GENERAL INFORMATIONFINANCIAL STATEMENTSGOVERNANCEPERFORMANCE REVIEWSTRATEGY & BUSINESSABOUT
PRODUCT STEWARDSHIP AND PRODUCT LIFE CYCLE MANAGEMENTFocusing on product stewardship and product life cycle (PLC) management involves taking
responsibility to reduce the product’s environmental impact along its entire life cycle, i.e. from cradle
to grave. Ultimately, this approach enables us to make products more efficiently and productively for
our customers, while extending the products’ useful life.
Our product lifecycle process follows the well-established construct of phase-gate product
development guided by several key inputs:
› our collective industry knowledge/experience and subject matter experts;
› industry/customer requirements and frameworks (such as, customer purchase specs and business
requirements); and
› industry regulations, standards and guidelines.
Product-specific requirements realized from these inputs are documented in market requirement
specifications ( ), which are held as the objectives we need to meet through the product development
process. The MRS is continually updated to capture changes to market conditions, regulations and
standards, and related specifications.
Governance is provided by the Management Board and their direct staff through key technical
meetings (architecture reviews, design reviews and validation reviews) and phase exit meetings
through the various lifecycle stages of the product.
• Functionality• Cost• Reliability• Safety & Compliance
• FMEA• Design for X (DFX)• Product Safety
• Internal• 3rd Party• Customer
• Continuous improvement• Operations
• Customer management• Asset disposition
REQUIREMENTS
CONCEPT& DESIGN
VALIDATION
RELEASEEnd oF LIFE
PRODUCT DEVELOPMENT
PRODUCT SAFETY AND GOVERNANCEOur product safety policy is part of our global business management system, and is delivered and
maintained by our Product Safety Steering Council. This policy defines the requirements, processes,
and roles and responsibilities in support of our vision to achieve ZERO HARM! in product safety.
Product safety requirements are defined and maintained by the Product Safety Committee, which
includes engineers representing each of the design centers. These requirements are established
in the PLC during the requirements phase. The requirements include legislation and standards
from the semiconductor industry and customers. During the concept and design phase, as well
as safety reviews and safety risk assessments, we verify that safety requirements are being met.
Independent third-party validations are done during the validation phase. This helps ensure that our
products are safe to operate and maintain, both at our own locations and those of our customers.
The Product Safety Committee meets regularly to refine this process and implement continuous
improvement opportunities. In addition, we integrate the identification of opportunities for safety
design improvements into our global safety reporting system. This system enables our engineers and
technicians, who work with our equipment on a daily basis to report opportunities for improvement.
These reports are reviewed on a daily basis. Corrective actions, and lessons learned are captured.
This data is invaluable in linking the end user with the design process.
Our stakeholders working with our equipment rely on this process of continual assessment,
integration, and improvement, to make sure they can work safely with our products.

43ANNUAL REPORT 2017
SHAREHOLDERS & GENERAL INFORMATIONFINANCIAL STATEMENTSGOVERNANCEPERFORMANCE REVIEWSTRATEGY & BUSINESSABOUT
RESEARCH AND DEVELOPMENTWe have been an innovation leader for 50 years. We not only contribute to the remarkable advance of the semiconductor industry, we help shape the industry itself through our collaborative research and development (R&D) models. This success, and our future success, is largely dependent on our ability to develop new products and new materials, and to improve existing products and materials. Achieving this requires a large commitment to R&D. In 2017 and 2016, our R&D investments were €114 million and €102 million respectively. As of year-end 2017, 497 employees were employed in R&D, representing 26% of our total staff.
Driving innovations
RESEARCHINSTITUTIONS &UNIVERSITIES
ASMITECHNOLOGY
ANDPRODUCTS
CHIPMANU-
FACTURERS
CLOUDCOMPUTING
SMARTCARS
INTERNETOF THINGS
ARTIFICIALINTELLIGENCE
ADVANCEDIC CHIPS
GLOBAL RESEARCHAs a global company, we carry out R&D on different continents, giving us access to the smartest
professionals working in the semiconductor sector today, and bringing our R&D closer to our
customers. In our research centers in Belgium, Finland, Japan, the Netherlands, South Korea,
and the United States we are active at all stages of our innovations’ life cycle, from developing the
basic chemistry and materials to implementing improvements on our equipment at our customers’
production sites. We also work with specialists across a wide array of disciplines to develop our
research goals, including scientists from research institutes, universities, and suppliers.
REGIONAL EXPERTISEWith our R&D activities chiefly conducted in the principal semiconductor markets of the world,
we are able to draw on innovative and technical capabilities internationally. Each geographical center
provides expertise for specific products or technologies, and interacts with customers on a global
scale. This approach, combined with structured and managed interactions between the individual
centers, enables the efficient allocation of resources during development and knowledge sharing.
Under the umbrella of our global product development policies, our local activities are directed both
towards expanding and improving existing product lines to incorporate technology improvements
and reduce product cost and total cost of ownership, as well as developing new products for
existing and new markets. These activities require the application of physics, chemistry, materials
science, electrical engineering, precision mechanical engineering, software engineering, and
systems engineering.
CUSTOMER COLLABORATIONThe most important collaborations we have are those with our customers, with whom we co-create
and jointly develop technology roadmaps, and new processes and materials when our customers
need them for their next products. The diversity in collaborations ranging from early research to pilot
production helps us reduce risk as early as possible in the innovation life cycle.

44ANNUAL REPORT 2017
SHAREHOLDERS & GENERAL INFORMATIONFINANCIAL STATEMENTSGOVERNANCEPERFORMANCE REVIEWSTRATEGY & BUSINESSABOUT
GLOBAL PLATFORM ENGINEERING GROUP AND CORPORATE R&DA global platform engineering group addresses the needs for common platforms for the various
products in our product portfolio. This helps us in driving standardization of hardware and software
through the organization. A corporate R&D group consisting mainly of resources in Leuven, Belgium
and Helsinki, Finland addresses common needs for advanced process and materials development,
and process integration work for the 5nm, 3nm and 2nm nodes, and even beyond.
LOCATION
NUMBER OF R&D EMPLOYEES AS OF DECEMBER 31, 2017, EXCLUSIVE OF
TEMPORARY WORKERS
Almere, the Netherlands 35
Leuven, Belgium 28
Helsinki, Finland 27
Phoenix, Arizona, United States 194
Cheonan, South Korea 92
Singapore 4
Tokyo, Japan 117
TOTAL 497
INITIATIVES WITH CUSTOMERS, INSTITUTES AND UNIVERSITIESAs part of our research and development activities, we are engaged in various formal and informal
arrangements with customers, suppliers, research institutes and universities.
Next to large scale R&D engagements, we have specific bilateral research activities with several key
academic groups at universities in Asia and Europe, typically centric to our core R&D focus on new
equipment, material and process developments.
We contribute to several process and equipment development projects at the major Dutch
technical universities through the Dutch FOM and STW funding organizations for fundamental and
applied research.
We participate in select publicly-funded programs to research and develop technology for
semiconductor devices with line widths of 5nm and below, and in ‘More than Moore’ technologies.
We are also involved in several cluster development programs in the Eureka initiative, as a member
of the AENEAS association as mentor or reviewer, and in road-mapping activities.
And finally, we occasionally cooperate with other semiconductor capital equipment suppliers
in complementary fields, in order to gain knowledge on the performance of our own deposition
processes, in cooperation with other processes, either in bilateral or consortia projects.
PATENTS & TRADEMARKSCAPTURING IDEAS EFFICIENTLYWe expect new deposition technologies and chemistries to be a major driver for new intellectual
property (IP) in the future. Patents protect our discoveries and enable us to speak more openly
about our inventions and share ideas in the marketplace that benefit our customers. Our patents
are usually registered in the principal countries where semiconductor devices or equipment are
manufactured and/or sold. Our vision is to increase our value to our customers and shareholders
by using our IP in a way that differentiates our products, influences the market, and provides additional
monetization opportunities.
CULTURE OF INNOVATIONWe have been an innovation leader within the semiconductor industry for 50 years. During that time,
we have helped shape the industry through a series of breakthrough innovations in technologies
such as ALD, plasma deposition, and epitaxy.
We strive to maintain a culture of innovation at every level of the organization. We attract and retain
creative people from around the world, who help us create a steady stream of innovations that
we bring to volume manufacturing through close cooperation with our customers.
Our vision is to increase value to the company and our customers through innovations and the use
of our IP to differentiate our products. We understand that a failure to adequately protect our IP and/
or leakage of our IP could result in the loss of our competitive advantage and adversely impact
demand, as well as our financial performance.
We have implemented a robust IP protection program that protects IP for us, our customers, our
suppliers and our partners. We train all employees not only on the importance of IP protection, but
also on how to recognize and report possible IP infractions. This training is provided to all new hires,
and employees are given regular refresher training.
We continue to implement new software, training, and agreements which will allow us to better
protect our IP and safeguard our technology developments.

45ANNUAL REPORT 2017
SHAREHOLDERS & GENERAL INFORMATIONFINANCIAL STATEMENTSGOVERNANCEPERFORMANCE REVIEWSTRATEGY & BUSINESSABOUT
INFORMATION SECURITYOur technologies, innovations, IP, products and process data, as well as the sensitive information
about our customers, suppliers, and employees, are valuable assets. Any breach of our information
systems could adversely affect our finances and operating results, as well as our reputation.
Information security is a material aspect to us and our stakeholders, and requires the proper controls
to protect it.
Our approach to information security management includes developing and sustaining a proper
global IT security management framework with a policy, processes, and controls to protect against
unauthorized system access and loss of valuable information, regardless of location.
In 2017, we continued to assess our position on network security and took steps to enhance the
security posture of our global network, improved employee education, and awareness on cyber
security/safety, and made infrastructure modernization enhancements.
Our goal is to protect our intellectual property and privacy, while mitigating risks and achieving data
security for our customers, employees, and other stakeholders.

46ANNUAL REPORT 2017
SHAREHOLDERS & GENERAL INFORMATIONFINANCIAL STATEMENTSGOVERNANCEPERFORMANCE REVIEWSTRATEGY & BUSINESSABOUT
PEOPLE AND SOCIETYKey in our mission to drive innovation and deliver excellence is having the right people; talented people who are able to provide our customers with pioneering solutions and first-class service. People who share our fascination for the future, but want answers today. From the sharpest graduates, to skillful engineers and inspirational leaders.
To be able to realize our ambition to drive innovation and deliver excellence, it is crucial to attract, develop,
and retain critical talent. In our innovative industry particular, people are the differentiating element.
To ensure we are able to brand ASMI as global employer of choice in the global labor market, in 2017
we implemented a holistic approach. This approach integrates the mission, vision and strategy of the
company with our employment brand and our people.
In the execution of all our people-related actions, we focus on four key areas:
› attracting the right talented people;
› enabling our people to fulfill their tasks to the best of their abilities;
› engaging our people by fostering a collaborative and appealing culture; and
› helping our people to excel in their personal development and career.
ATTRACTING A DIVERSE WORKFORCEA key part of attracting and developing the right talent is being an equal opportunities employer.
We understand that everyone is unique and recognize and respect the differences between
individuals, including ethnicity, religious beliefs, nationality, age, gender, sexual orientation, family
status, physical ability, experience, and perspective. This is reflected in our Global Employment
Standards and as such is integrated into our recruitment policy, processes, and practices.
Recruiting and developing a diverse workforce gives us a wide range of perspectives, and allows
us to explore and adopt new technological ideas and innovations. It also allows us to better
understand and meet the needs of our diverse customers, suppliers, and communities. Diversity also
enables us to bring a range of different insights together to create breakthrough innovations, turning
today’s challenges into tomorrow’s opportunities. This is supported by our global recruitment policy
and process.
STRATEGY
MISSION / VISION
PEOPLE
EMPLOYMENTBRAND
EMPLOYEE ENGAGEMENT& BRAND AMBASSADORS
• BEHAVIORS• KNOWLEDGE
• SKILLS
FOSTER A COLLABORATIVEAND ENGAGING
CULTURE
BUILD ANDIMPROVE
UPON ASMI’SDIVERSITY
att
ract ENABLE
ENGAGEE
XCEL

47ANNUAL REPORT 2017
SHAREHOLDERS & GENERAL INFORMATIONFINANCIAL STATEMENTSGOVERNANCEPERFORMANCE REVIEWSTRATEGY & BUSINESSABOUT
ENABLE OUR PEOPLETo enable our people to fulfill their assignments to the best of their abilities, we use high-quality
global processes and tooling that provide managers and employees with access to the services they
need 24/7. This includes technical education, as well as leadership trainings, through our leadership
academy and a newly introduced online platform.
THE ASM NEW COLLEGE GRADUATE PROGRAMTo help attract and develop our people, we have established the ASMI New College Graduate
(NCG) program. We focus on top graduates with advanced degrees in physics, physical chemistry,
chemistry, materials science, and engineering. Working with a select list of universities that focus
on the education and training that fit our technology needs, we participate in career events,
partnerships, and projects that give us the opportunity to showcase the company. Following their
training period, the new graduates begin working at the cutting edge of technology, alongside
experienced innovators. Their goal is to resolve some of our toughest scientific challenges. During
the first few years of their careers, they are based at one of our innovation centers in Helsinki, Finland,
or Leuven, Belgium, before being given the opportunity to apply their knowledge in different product
areas at one of our global product development facilities.
THE ASM LEADERSHIP ACADEMYOnce the right people are attracted, we work hard to ensure they are engaged with the company and
its strategic goals, and ensure we provide an enabling environment that allows them to excel and turn
today’s challenges into tomorrow’s opportunities. One example is the ASMI Leadership Academy,
which offers our people different leadership programs. Our Leadership Academy helps managers
and leaders from all levels of the organization to foster a collaborative and engaging culture and build
upon the diversity of their teams. Bringing managers and leaders together in these programs, while
using consistent content, has also led to increased understanding and greater cross-cultural and
business collaboration.
HELPING OUR PEOPLE ENGAGE AND EXCELTo accelerate our people’s development and career, we focus on two areas: our succession and
talent review process and our performance management and development process. Both processes
are pivotal in managing and mitigating risks associated with our business operations.
Our global succession and talent reviews are deployed for all critical organizational areas. For those
positions that are identified as pivotal to develop our capabilities, we define the required talent-related
actions to ensure timely succession and support.
ASMI has implemented a structural performance management and development process.
This process supports management and employees to discuss key objectives and competences
on a regular basis and is set up as a dialog between manager and employees.
ETHICSAt ASMI, we have adopted a Code of Ethics that sets out clear standards in different areas of business
life. Its purpose is to promote a clear, strong and consistent culture of ethics that applies to our
Supervisory Board and Management Board, and to all our employees, consultants, contractors,
temporary employees, and critical suppliers. The full Code of Ethics can be found on our website.
We continuously promote ethical behaviors and ensure all employees are actively exposed to our
Code of Ethics in multiple ways:
› new hires are trained in the code and associated policies within first weeks of employment;
› refresher training on ethics topics is conducted annually;
› articles from Executives and members of the Ethics Committee are published through our global
employee newsletter;
› we post visual awareness reminders at ASMI sites; and
› a dedicated ethics website is directly accessible via ASMI’s Intranet landing page.
Our goal of zero ethical violations is communicated and reinforced through these active engagements.
All of these efforts aim to foster ethical behavior in line with our Code of Ethics and in reporting
potential violations.
ASMI is committed to conducting business in a manner consistent with the Responsible Business
Alliance (RBA) principles to protect our employees, customers, communities, shareholders and
the environment.
Our ethics management system provides appropriate resources and tools:
› anonymous reporting of ethics issues and complaints through an independent third party called
SpeakUp!;
› Global Employment Standards which drive our approach to ethically managing employees, human
rights and free labor;
› whistleblower policies and procedures to prevent amongst others fraudulent behavior in financial
reporting;
› insider trading policies that provide clear rules on trading in ASMI shares;
› gifts and entertainment protocol and corresponding system set up to prevent conflict of interest; and
› anti-fraud and corruption practices, which provide clear guidance to prevent fraud and corruption.

48ANNUAL REPORT 2017
SHAREHOLDERS & GENERAL INFORMATIONFINANCIAL STATEMENTSGOVERNANCEPERFORMANCE REVIEWSTRATEGY & BUSINESSABOUT
SPEAKING UPPotential violations of our Code of Ethics can be reported through the SpeakUp! process, or directly
to management, HR, or the compliance officer. When we receive complaints, these are investigated
under the supervision of the Ethics Committee. The SpeakUp! process lets employees, suppliers,
customers, and any other stakeholder report ethics issues, concerns or complaints anonymously
and in their own language. Independent of the way of reporting, our Code of Ethics includes
a non-retaliation policy that applies to any person making use of this process.
We encourage our employees to speak up when they feel ASMI’s actions or behaviors within
are (potentially) in conflict with the Code of Ethics. An anonymous reporting system is available
in all countries in which we operate, in native languages. In all cases and situations, we follow
a comprehensive and consistent process to investigate, report and take appropriate measures. This
is supported by a non-retaliation policy.
GLOBAL EMPLOYMENT STANDARDSOur Global Employment Standards (GES) summarize our approach to respecting human rights
throughout our global operations and supply chain. They are written with everyone in our value chain
in mind.
The GES reflect the principles laid out by the United Nations in the Guiding Principles on Business and
Human Rights, and support the RBA Code of Conduct framework including the following:
› prohibit the use of forced or involuntary labor, including fees of any type to secure employment;
› prohibit the employment of child labor, ASMI policy specifically does not allow anyone under the age
of 18 to be employed at ASMI; and
› prohibit corporal punishment, threats of violence or other forms of physical or verbal coercion
or harassment.
We are committed to updating our management practices to stay compliant with the RBA code
as it evolves.
Updates to the global employment standards are communicated to all employees as well as being
posted internally and externally on our website.
We believe that everyone deserves to work in an environment free of any threats to their human
rights. In 2017, we had no reports or evidence of any human rights violations or abuses within our
global hiring or employment practices.
DISCLOSING OUTSIDE EMPLOYMENT ACTIVITIESASMI supports employee interests and activities away from the company. For reasons of transparency
and to avoid conflict of interest, corruption and bribery, we further formalized ASMI’s position through
a policy change. Among other things, this policy change means that all employees are to report all
outside employment activities prior to any employment activities occurring.

49ANNUAL REPORT 2017
SHAREHOLDERS & GENERAL INFORMATIONFINANCIAL STATEMENTSGOVERNANCEPERFORMANCE REVIEWSTRATEGY & BUSINESSABOUT
PROVIDING EMPLOYMENT CONTRACTS IN NATIVE OR PREFERRED LANGUAGESASMI strengthened its support of prospective employees full understanding of the terms
of employment by providing employment contracts in the native or preferred languages.
These terms and conditions, when taken as a whole, contribute to ASMI’s approach for respecting
human rights. Employees and prospective employees are not in debt to secure employment, they are
able to understand the terms of their employment, and are free to sever employment.
HEALTH & SAFETYOur corporate responsibility policy includes a commitment to a philosophy of ZERO HARM! with
respect to the health and safety of our employees, our suppliers, and our customers’ employees who
work with and around our equipment. The ZERO HARM! philosophy means we strive to prevent injury
and illness at our sites and at our customers’ sites. This includes providing workplaces with good
working conditions, positive reinforcement of health & safety, and proactive programs such as safety
management by walking around (SMBWA) audits to prevent incidents. We look to all management
to exhibit safety leadership and all employees to report risks and concerns, not only at our sites but
in the design and manufacturing of our products. We take a proactive approach to identifying risks
and hazards early, and a structural approach to elimination when they are discovered. We use a robust
reporting system for identifying gaps and opportunities, and focus on continuous improvement.
We believe that safety is more than just complying with regulations. We have to continually challenge
ourselves, our suppliers, our industry, and our customers to be leaders in safety. In an industry such
as ours, where there are shared work sites, shared objectives for producing end-user products,
and a supply chain that supports our peers and competitors, there is no room for a lapse in safety
leadership. When it comes to health & safety, everyone is a stakeholder.
Our attitude to minimizing internal risks follows a similar approach. Through our strategic lab
safety, service safety, and manufacturing safety plans, we have implemented working groups
comprised of key representatives from the sites and functions. Those working groups are engaged
in driving a strategic plan and objectives for each site/function that focuses on multiple dimensions
of safety influence, including reduction of physical risks, improvement of procedures, and responding
to employee feedback.

50ANNUAL REPORT 2017
SHAREHOLDERS & GENERAL INFORMATIONFINANCIAL STATEMENTSGOVERNANCEPERFORMANCE REVIEWSTRATEGY & BUSINESSABOUT
ENVIRONMENTOur technologies enable our customers to provide consumers with more powerful technologies, while lowering energy demands. We align our strategies across the industry, including with customers and industry standards, to focus on key areas including reducing greenhouse gases and water consumption, improving our recycling and reuse of raw materials, and focusing on responsibly designed and operated facilities.
Our enabling technology is not the only approach we take to improve environmental performance.
Our ZERO HARM! philosophy drives us to continually improve our environmental performance both in our
own operations and in our products, so that our customers realize a reduced environmental footprint.
Our environmental policy is a core element of our overall corporate responsibility Policy. This policy
establishes our commitment to reduce our environmental impact by continuously improving
our management systems and setting objectives. The policy is not limited to any one aspect
of environmental protection, and we will continuously evaluate our performance in areas applicable
to our operations and products.
TARGETSIn 2016, we initiated a five-year target cycle for reducing our environmental footprint in key areas
that are applicable to our operations and aligned with industry standards, including the Sustainability
Accounting Standards Board (SASB) accounting standards for the semiconductor industry.
Our environmental targets remain unchanged for 2016-2020 and are:
› reduce greenhouse gas emissions by 5% per euro of research and development (R&D) investment
below 2015 levels by 2020;
› reduce water consumption by 10% per euro of R&D investment below 2015 levels by 2020;
› divert more than 90% of all waste from landfill through recycle or reuse by 2020; and
› all new construction projects to exceed the energy efficiency standards of local jurisdictions.
These targets are aligned with key initiatives across our operations, and leverage our environmental
management system which is certified to the ISO 14001 standard to further improve visibility
across the company. Over 95% of our realized greenhouse gas emissions are a direct result
of scope 2 purchased electricity. We strive to find ways to reduce our electrical consumption where
we use it most, at our engineering, and research and development. For example, we commissioned
an energy audit in partnership with a local utility at one of our engineering sites, and are exploring
the opportunities identified in future objective setting for the targets, objectives and actions taken
to support SDG 13: Climate Action.
EVALUATIONFurther to the applicable targets, we evaluate our overall environment aspects and impacts, including
changes in regulatory aspects, on an annual basis to identify any change in operations or impacts
that require inclusion. In 2017, no material changes to our current operations occurred that alters
the way we interface with the ecosystem or manage our on-site surface water. We approach
new projects with a impact assessment, and strive to minimize identified potential impacts, such
as through erosion protection, surface water containment, abatement technologies, and water
resource management.

51ANNUAL REPORT 2017
SHAREHOLDERS & GENERAL INFORMATIONFINANCIAL STATEMENTSGOVERNANCEPERFORMANCE REVIEWSTRATEGY & BUSINESSABOUT
SUPPLY CHAINASMI is engaged in manufacturing products of increasing complexity in a challenging business environment, which requires quick responses to customized solutions. A robust supply chain management system, with a diverse scope and global footprint, becomes critical to meet ASMI business aspirations. This requires our global supply chain organization to continuously drive operational excellence by employing policies, initiatives, and tools to proactively engage our suppliers to ensure business compliance and continuity. These include regular supply and financial risk monitoring, performance management, and Responsible Business Alliance (RBA) commitment from our critical business partners. ASMI’s global supply chain organisation is committed to maintaining a supply portfolio that is value creating, sustainable, and ethical.
A DIVERSE GLOBAL SUPPLY CHAINOur mission at ASMI is to build a world-class supply chain that provides our customers with the
most technologically advanced products, services, and global support network, at a competitive
cost of ownership. We partner with hundreds of suppliers who provide goods and services used
to manufacture our products and serve our customers. They play a critical role in enabling us to
achieve our mission, covering a broad spectrum of commodities across 20+ countries and regions
worldwide. The main categories include, but are not limited to, contract manufacturers, precision
machining, gas systems, robotics, electronics, and high-tech chemistries. These suppliers
manufacture advanced materials to tight tolerances and performance attributes, as required
to achieve our stringent design specifications and requirements. This approach enables us to remain
innovative and swiftly meet the challenging demands of our customers.
MANAGEMENT APPROACHOur supply chain is a critical part of our end-to-end value chain. To fulfill our customers’ expectations
and requirements, we need to manage our suppliers effectively and ensure that they meet their
performance requirements.
OUR POSITION IN THE INDUSTRY
END CONSUMERSSemiconductorindustry
University research/R&D institutes
Materialssuppliers
ASMI & other FAB equipment suppliers
Semiconductorsuppliers

52ANNUAL REPORT 2017
SHAREHOLDERS & GENERAL INFORMATIONFINANCIAL STATEMENTSGOVERNANCEPERFORMANCE REVIEWSTRATEGY & BUSINESSABOUT
Our customers and other stakeholders increasingly expect greater transparency within our supply
chain, including how our products are manufactured, whether labor standards are upheld, and
workers are treated fairly, and what impact the supply chain has on the environment.
To extend our commitment and approach to corporate responsibility, we use the RBA Code
of Conduct as our Supplier Code of Conduct, and we have established management systems for
our critical suppliers that match the industry-standard supplier assessment process. By integrating
corporate responsibility into our supply chain management process, we believe that we can create
long-term business value and further mitigate supply continuity risk.
As part of our supplier relationship management process, we have developed a critical supplier risk
assessment process based upon a multitude of criteria. Every year, we assess our supply chain and
identify our critical suppliers based on key elements such as, but not limited to, the amount we spend
with them, how many similar or alternative suppliers exist, and the amount of time we would need
to switch suppliers if we had to.
SUPPLIER EXPECTATIONSWe communicate our expectations and measure conformance to our expectations with our critical
suppliers. This approach manages our supply chain risks by focusing on the areas where a majority
of our materials come from and spending occurs.
Our critical supplier requirements include, but are not limited to, their commitment to:
› the RBA Code of Conduct;
› ASMI’s Environmental Health and Safety Policy;
› ASMI’s Code of Ethics;
› ASMI’s Intellectual Property Policies;
› hazardous materials identification regulations; and
› conflict materials identification and disclosure.
These requirements are outlined on our public supplier management web page.
INTEGRATED SUPPLIER MANAGEMENTWe believe that building a sustainable supply chain begins with solid business partnerships. Our goal
is to find the most capable suppliers in the industry, treat each supplier with respect, and conduct
business fairly across all facets of our operations.
By adhering to these principles, we believe we can forge lasting partnerships that will provide long-
term benefits to ASMI, our suppliers, our customers, and our stakeholders.
Suppliers who share our vision for an integrated supply chain model routinely demonstrate
a commitment to solving many of our customers’ challenges. They understand industry dynamics
and recognize the need to partner in developing solutions that improve the overall strength of ASMI.
When faced with a particular opportunity, they will quickly use their industry expertise to highlight
opportunities and share recommendations, whether technical, commercial or environmental. In many
cases, these suppliers can call on a wide variety of global industries and disciplines from which
to share best practices. By building a strong relationship with our suppliers, we are able to build upon
a foundation of experience and rapidly respond to the business environment.
RISK ASSESSMENT AND MANAGEMENTWe operate globally and have partnerships with suppliers from 20+ countries across Asia, North
America, and Europe. We place high expectations on our supply chain when it comes to operational
flexibility and responsiveness, and together we must be prepared to respond quickly to a wide range
of unplanned events. This requires working proactively with our supply chain partners to ensure they
are able to assess and manage risks.
Our supply chain risk management process consists of a combination of critical supplier risk
assessments, supplier self-assessments, RBA audits, and training and capability-building activities
to help our supply chain be both resilient and responsible.
We actively engage our critical suppliers to drive:
› RBA Code Compliance and SAQ compliance;
› business continuity planning;
› financial risk monitoring; and
› strategic business reviews.
Consideration is also given to other suppliers that we are actively developing or that have
key capabilities.
SUPPLIER DEVELOPMENT AND PERFORMANCE MANAGEMENTKeeping pace with Moore’s Law means the semiconductor industry is advancing at an impressive
rate and placing increasing demands on our products. This means we need to make advances

53ANNUAL REPORT 2017
SHAREHOLDERS & GENERAL INFORMATIONFINANCIAL STATEMENTSGOVERNANCEPERFORMANCE REVIEWSTRATEGY & BUSINESSABOUT
across a number of areas simultaneously, including in material properties, operational capability,
manufacturing processes, and capacity management.
These advances and demands are quickly shared with our supply chain, which means we need
to continually evaluate our supplier landscape to partner with those suppliers who have demonstrated
the right level of business commitment.
We continue to invest in our own capability to meet these increasing challenges, which includes
growing our capabilities and resources in our global procurement organization, inclusive of our
supplier development and supplier quality engineering teams. These investments are consistent with
our commitment to continuous improvement. As part of our supplier selection and recertification
process, our supplier engineers perform comprehensive audits, evaluating supplier compliance
across a multitude of business elements. In 2017, these audit areas included their employee health
and safety, quality management system, ISO compliance, and intellectual property management.
During these audits, we had a 93% closure rate on corrective actions.
We are committed to working with each of our suppliers in developing the right technology,
operational capability, or investment in capacity. In addition, we are also committed to helping
them adhere to our corporate responsibility expectations. For our critical suppliers, we not only
communicate our expectations, we also offer free hosted webinars to help them to understand
the code requirements and the measurement methods, and to gradually build up their knowledge
to enhance their management systems.
CONFLICT MINERALS AND HUMAN RIGHTSConflict minerals are those minerals mined in the Democratic Republic of Congo (DRC) or adjoining
countries. Profits from the sale of these minerals may directly or indirectly benefit those involved
in rebel conflicts and human rights violations. These minerals and the metals created from them
– tin, tantalum, tungsten, and gold – can make their way into the supply chains of products used
around the world, including the semiconductor industry. As a member of the global community,
we have a strong commitment to our sustainability programs, including conflict minerals disclosure
requirements, aimed at preventing related human rights violations.
OUR APPROACHWe do not directly source minerals from mines anywhere, including from the DRC or adjoining
countries. Our Conflict Minerals Policy, which is published on our website, communicates our
commitment to responsible sourcing. To enforce this policy, we developed, and have been executing,
our supply chain Conflict Minerals due diligence process annually since 2014.
We joined, and have participated in, the widely-recognized Conflict-Free Sourcing Initiative (CFSI).
The CFSI brings together the electronics, automotive, and other industries to jointly improve
conditions in the extractives industry (www.conflictfreesourcing.org).
Our programs focus on communicating of our policy, training and surveying our critical suppliers,
and collecting supply chain sourcing information on the sources of tin, tantalum, tungsten and gold
(3TG) using the industry-standard CFSI template, known as the Conflict Minerals Reporting Template
(CMRT). We actively engage with critical suppliers for Reasonable Country of Origin Inquiries (RCOI)
and conduct due diligence based on OECD guidance.
OUR PERFORMANCE MANAGEMENT AND GOALAfter we complete our due diligence survey, we carry out detailed data verification and analysis with
identified smelters, from whom our critical suppliers source. This process establishes traceability
to the smelters and measures the smelters identified with the validated conflict-free smelters (CFS)
list published by the CFSI. This helps us ensure that the products and components we source are
DRC conflict-free. We encourage all of our suppliers to source 3TGs responsibly, and to use certified
conflict-free smelters using recognized certification organizations, such as the Conflict-Free Smelter
Program (CFSP). Our goal is to trace all of our critical suppliers and ensure they are using only certified
conflict-free smelters, and that our sourcing funds do not finance conflict in the covered countries.
COMPLIANCE WITH LEGISLATIONWe are committed to the RBA Code of Conduct, including its commitment to conflict-free sourcing,
and will continue our active participation and contribution to the CFSI and our engagement with other
relevant stakeholders. These include the European Parliament and other international NGOs, through
our engagement with CFSI. Current information on the due diligence process and our policy can
be found on our website, in the supply chain section under corporate responsibility.
In November 2016, an agreement was reached by European institutions on the text of an
EU Regulation which will require upstream importers, smelters and refiners to conduct due diligence
checks from 2021 to ensure they do not source conflict minerals. ASMI is a downstream company,
and uses the industry tools to conduct due diligence of our supply chain.

54ANNUAL REPORT 2017
SHAREHOLDERS & GENERAL INFORMATIONFINANCIAL STATEMENTSGOVERNANCEPERFORMANCE REVIEWSTRATEGY & BUSINESSABOUT
RISK MANAGEMENT APPROACHDoing business inherently involves taking risks, and ASMI can be adversely affected by a variety of business risks and economic developments. A structured risk management process helps management to better understand how risks might impact the Company and to take appropriate risk mitigation initiatives. Deploying effective risk management is a key success factor for realizing our strategic objectives as it provides reasonable assurance to prevent material misstatements or losses. ASMI has implemented an internal risk management and control framework.
RISK MANAGEMENT APPROACHA comprehensive risk management and control framework, based on the ‘three lines of defense
model’, has been established that provides the Audit Committee and the Management Board
with a clear overview of the effectiveness of internal controls and risk management. Within the
framework, the Management Board is responsible for designing, implementing, and operating
an adequately functioning internal risk management and control framework within the company.
The objective of this framework is to identify and manage the strategic, operational, financial, financial
reporting, and compliance risks to which ASMI is exposed, to promote effectiveness and efficiency
in our operations, to promote reliable financial reporting, and to promote compliance with laws and
regulations. The Management Board is aware that such a framework can neither provide absolute
assurance that its objectives will be achieved, nor can it entirely prevent material errors, losses, fraud,
or the violation of laws and regulations.
STRATEGY AND OBJECTIVE SETTINGASMI’s strategy and objectives are described on page 24. During the objective and strategy setting
process, the Management Board takes into account the company’s known risks and opportunities,
and its risk appetite. The objectives and strategy are discussed with the Supervisory Board.
RISK CULTUREASMI strives for a culture of openness and transparency in which identified risks are disclosed
proactively and unexpected events are reported as soon as they occur. ASMI has established a Code
of Ethics (the Code). The Code applies to all ASMI employees and temporary staff. It describes
how we work in an open, transparent, honest and socially responsible way. We communicate the
Code on our corporate website and our intranet, while new or temporary employees also receive
a copy of the Code on their first working day. Annually, via a mandatory online test, all our employees
are made aware of the importance of our compliance environment. We have a stringent approach
to bribery and corruption, fraud, and all other forms of (illegal) misconduct, including facilitation
payments. As well as through the test mentioned, the effectiveness of, and compliance with, the Code
is assessed by actively detecting and investigating any alleged misconduct and taking appropriate
disciplinary action if misconduct is substantiated. To strengthen the tone at the top and in other
management levels, we conduct annual fraud risk assessments. The business control framework
contains all corporate policies and guidelines that are mandatory for all of ASMI’s activities.
RISK APPETITEUndertaking business activity inevitably leads to taking risks. Each type of risk encountered is dealt
with in a manner that matches the risk appetite of the Management Board. Risk appetite is the level
of risk we deem acceptable to achieve our objectives. ASMI’s risk appetite is primarily established
based on the defined and agreed strategy and the individual objectives within this strategy. Risk
appetite is further guided by our Code as well as detailed policies and procedures. The risk appetite
is the total residual impact of our risks that ASMI is willing to accept in the pursuit of its (strategic)
objectives. The risk appetite per objective or risk area is determined annually by the Management
Board. Overall, ASMI’s risk appetite did not change materially compared to the previous year.
RISK MANAGEMENT

55ANNUAL REPORT 2017
SHAREHOLDERS & GENERAL INFORMATIONFINANCIAL STATEMENTSGOVERNANCEPERFORMANCE REVIEWSTRATEGY & BUSINESSABOUT
Our risk appetite differs per risk type:
› strategic risks: we aim to deliver on our strategic ambitions and priorities, and are willing to accept
reasonable risks in a responsible way to achieve this taking into account our stakeholders’ interests.
Innovation will drive future growth. In that respect ASMI, is willing to take a higher risk in its key
longer-term growth areas, being ALD and epitaxy products;
› operational risks: we face operational challenges which require an appropriate level of management
attention. The overall objective is to avoid risks that could negatively impact our goal to achieve
operational efficiency, while ensuring our quality standards are unaffected. ASMI has a very low
tolerance related to product safety and associated compliance risks. We strive for zero harm;
› financial risks: our financial strategy is focused on a strong financial position and creating long-
term value for our shareholders;
› legal and regulatory risks: we strive to be fully compliant with our Code and national and
international laws and regulations of the markets in which we operate;
› financial reporting risks: we have effective control frameworks in place to minimize the risk of
material misstatements and errors in our financial statements; and
› compliance risks: we are committed to full compliance with relevant laws and regulations and have
a zero-tolerance approach to bribery and corruption, fraud, and all other forms of (illegal) misconduct.
RISK ASSESSMENT AND COUNTERMEASURESASMI has implemented an effective internal risk management and control system to manage its
main risks. The following systems are the main ways that we cover the most relevant risk areas for
the Company:
Control system › Product safety and EHS
› Compliance frameworks
› IT security & continuity
› Year plan & year outlook
› Financial framework
Control system objective › ZERO HARM!
› Maintaining licenses to operate
› Mitigating increasing cyber threats
› Creating shareholder value
› Maintaining sufficient liquidity for continuity purposes and
shareholder returns
Strategic objectivesEvery year we assess the top risks at a consolidated level (top-down approach) and on segment
level (bottom-up approach) and, if necessary, we implement countermeasures to mitigate the risks
within the defined risk appetite. The business objectives are detailed in a strategic business plan.
Every quarter, segments perform a ‘most likely’ forecast four to six quarters ahead on their main
financials and key performance indicators (the rolling forecast). Each month, business management
discusses their actual performance, including updates of the current and next quarter, with the
Management Board.
Operational objectivesASMI has several business continuity plans in place to safeguard the continuity of activities
to customers and critical systems and processes. We designed and maintained new control
frameworks for safeguarding the reliability of non-financial KPIs, as senior management relies
on these KPIs in their decision making. We continuously work on improving our services and
processes. Risks related to climate change and compliance with new environmental legislations
are incorporated in our risk management and control system. For example, environmental risks
are managed in ASMI’s business continuity strategy. Our main suppliers comply with the Supplier
Code of Conduct. Via this code, suppliers confirm that they support and respect the protection
of internationally proclaimed human rights and operate in the spirit of the Charter of the United
Nations, for example by preventing discrimination, child labor or forced labor, and by recognizing and
respecting the environment in their business operations.
Financial objectivesASMI’s treasury department manages risks related to cash positions, finance agreements, credit
ratings, and currency and interest exposures. The treasury department has defined policies with clear
boundaries for these risks. Compliance with these policies is monitored frequently.
As part of ASMI’s tax strategy, the tax department recommends the most tax-efficient and responsible
approach in the interest of all stakeholders, while adhering to ASMI’s tax policy and complying with
all relevant tax laws and regulations. ASMI does not use artificial tax structures solely aimed at tax
avoidance. ASMI proactively engages with tax authorities, and tax exposures (if any) are contained
and under control.
Financial reporting objectivesOur financial control framework is designed to prevent and detect material misstatements
in ASMI’s financial statements in a timely manner. The internal audit department periodically assesses
the overall effectiveness of the controls. A disclosure committee examines all reports and documents
containing financial information that are intended for external publication, to ensure that these fairly
present ASMI’s financial position and results.

56ANNUAL REPORT 2017
SHAREHOLDERS & GENERAL INFORMATIONFINANCIAL STATEMENTSGOVERNANCEPERFORMANCE REVIEWSTRATEGY & BUSINESSABOUT
RISK REPORTINGBusiness management provides the Management Board with a quarterly assurance letter regarding
the reliability of their financial reporting, the effectiveness of their internal controls, risk management,
and compliance with internal policies and other laws and regulations.
Summary of main risks and countermeasuresIn the next section, we provide a summary of our main risks, the potential consequences and the
mitigating measures. It lists the controls that ASMI has implemented to monitor the development
of the risks and the realization of our risk appetite. The risks and controls are frequently monitored
in regular Management Board meetings. During those meetings, improvement actions, where
necessary, are also taken into account.
Internal auditASMI’s internal audit function assesses the design and effectiveness of the internal risk management
and control systems and provides assurance to both the Management Board and the Audit
Committee concerning the ‘in control’ status of ASMI. Moreover, Internal Audit conducts ad hoc
financial and operational audits and special investigations.
To ensure the independence of this function, the Director Internal Audit reports to the Management
Board and the Audit Committee. The Audit Committee is involved in reviewing and approving the
audit plan for the year which the internal auditor executes.
The internal auditor regularly provides updates on its findings to the Audit Committee.
Governance of risk management and complianceAlthough the Management Board is ultimately responsible for risk management and compliance, the
Management Board is supported by the following three pillars:
› business & operations management. These management functions own and manage risk, and
are responsible for maintaining effective controls and for executing risk and control procedures on
a daily basis. This involves identifying and assessing risks being undertaken and establishing
appropriate controls to mitigate the risks. There are adequate management controls in place to
monitor ongoing compliance and to highlight control breakdowns;
› oversight functions. These management functions support business & operations management
and help ensure that the risk and control procedures are operating as intended; and
› internal audit. This function provides independent objective assurance on the effectiveness of
governance, risk management and internal controls, including the manner in which business &
operations management and the oversight functions manage and control risk. Internal audit brings
a systematic, disciplined approach to evaluate and improve the effectiveness of risk management,
control and governance processes.
Description and evaluationAs set forth by principle 1.2 of the Dutch Corporate Governance Code and related best practice
provisions, ASMI has designed and implemented internal risk management and control systems,
to identify and manage the risks associated with the Company’s strategy and activities. A summary
overview of the main internal risk management and control systems was provided in the
preceding paragraphs.
MANAGEMENT BOARD
FIRST LINE OF DEFENSE
OWNERSHIP & MANAGEMENT RISK & CONTROL FUNCTIONS INDEPENDENT OBJECTIVEASSURANCE
BUSINESS & OPERATIONSMANAGEMENT OVERSIGHT FUNCTIONS INTERNAL AUDIT
SECOND LINE OF DEFENSE THIRD LINE OF DEFENSE

57ANNUAL REPORT 2017
SHAREHOLDERS & GENERAL INFORMATIONFINANCIAL STATEMENTSGOVERNANCEPERFORMANCE REVIEWSTRATEGY & BUSINESSABOUT
CONTROL EFFECTIVENESS STATEMENTThe Management Board is responsible for ASMI’s internal risk management and control framework.
This system is designed to manage the main risks that may prevent ASMI from achieving its
objectives. However, this system cannot provide absolute assurance that material misstatements,
fraud, and violations of laws and regulations can be avoided. The internal risk management and
control framework and the evaluation of the effectiveness of our internal controls and areas for
improvement are regularly discussed with the Audit Committee and KPMG Accountants, our external
auditor. The Audit Committee reports on these matters to the Supervisory Board.
The Management Board conducted an assessment on the design and operating effectiveness of the
internal risk management and control systems. During the assessment, several weaknesses and
improvement actions were identified. One of the findings related to the dilution effect of the associate
ASMPT as disclosed in Note 29 to the Consolidated financial statements. None of the findings
were classified as major failings as referred to in the best practice provision 1.4. Based on this
evaluation of the effectiveness of the Company’s internal control over financial reporting, all members
of the Management Board concluded that, as of December 31, 2017, the Company’s internal
control over financial reporting was effective and provides reasonable assurance for the reliability
of financial reporting and the preparation of financial statements for external purposes in accordance
with generally accepted accounting principles. In addition, to the best of the knowledge
of the Management Board, the management report includes a fair review of the development and
performance of the business and the position of the Company and the undertakings included
in the consolidation as a whole, as well as a description of the principal risks and uncertainties that
the Company faces. No changes to the Company’s internal control over financial reporting have
occurred during 2017 that have materially affected, or are reasonably likely to materially affect, the
Company’s internal control over financial reporting.
All internal control systems, no matter how well designed and implemented, have inherent limitations.
Even systems determined to be effective may not prevent or detect misstatements or fraud, and can
only provide reasonable assurance with respect to disclosure and financial statement presentation
and reporting. Additionally, projections of any evaluation of effectiveness to future periods are subject
to the risk that controls may become inadequate due to changed conditions and that the degree
of compliance with the policies or procedures may deteriorate.
In view of all of the above, the Management Board believes that it complies with the requirements
of best practice provision 1.2 and 1.4 of the Dutch Corporate Governance Code.

58ANNUAL REPORT 2017
SHAREHOLDERS & GENERAL INFORMATIONFINANCIAL STATEMENTSGOVERNANCEPERFORMANCE REVIEWSTRATEGY & BUSINESSABOUT
RISK CATEGORIES AND FACTORSIn conducting our business, we face a number of risks that may interfere with our business objectives. Some of these risks relate to our operational processes, while others relate to our business environment. It is important to understand the nature of these risks and the impact they may have on our business, financial condition, and results of operations. Some of the more relevant risks are described below, which may not be in order of likelihood or materiality. These risks are not the only ones we face. Some risks may not yet be known to us and certain risks that we do not currently believe to be material could become material in the future.
STRATEGIC RISKS › The semiconductor industry is highly cyclical and is subject to rapid technological change. We face
intense competition from companies that have greater resources than we do, and potential
competition from new companies entering the market in which we compete. Therefore, we invest in
research and development, in an effort to compete effectively. Our primary competitors for our wafer
processing equipment include Applied Materials, Lam Research Corporation, Tokyo Electron,
Hitachi Kokusai, Wonik IPS, and Jusung;
› We have to recruit or retain qualified personnel or integrate qualified personnel into our organization
in order to avoid reduced sales, delayed product development, and diversion of management
resources. Our business and future operating results depend in part upon our ability to attract and
retain qualified management, technical, sales, and support personnel for our operations on
a worldwide basis. Competition for qualified personnel is intense, and we cannot guarantee that we
will be able to continue to attract and retain qualified personnel; and
› The costs to semiconductor manufacturers for switching from one semiconductor equipment
supplier to another can be high, therefore it may be more difficult to sell our products to customers
having a competing installed base.
OPERATIONAL RISKS › The Company derives a significant percentage of its revenue from a small number of large customers.
The ten largest customers accounted for approximately 83.1% of net sales in 2017 (2016: 78.5%).
Reduction, rescheduling or cancellation of orders would reduce our revenues;
› Our products generally have long sales cycles and implementation periods, which increase our
costs of obtaining orders and reduce the predictability of our earnings. Our products are
technologically complex. Prospective customers generally must commit significant resources to test
and evaluate our products and to install and integrate them into larger systems. In addition,
customers often require a significant number of product presentations and demonstrations, in some
instances evaluating equipment on site, before reaching a sufficient level of confidence in the
product’s performance and compatibility with the customer’s requirements to place an order.
As a result, our sales process is often subject to delays associated with lengthy approval processes
that typically accompany the design and testing of new products;
› We outsource a significant portion of the manufacturing of our business to a limited number of
suppliers. If our suppliers were unable or unwilling to deliver products in a timely manner to us in the
quantities we require, we may be unable to fill customer orders on a timely basis, which could
negatively affect our customer relationships and financial performance. We conduct much of our
operational activities to our Front-end Manufacturing Singapore (FEMS) facility. If this facility were to
experience a manufacturing disruption for any reason, our ability to timely meet our customers’
needs may be impaired, which would negatively affect our customer relationships and financial
performance; and
› Our internal information technology systems are a fundamental component of our business
operations. In today’s world, these systems are subject to compromise by aging and other matters,
such as computer viruses, unauthorized access, and general system failures or unforeseen
difficulties. Such incidents could result in business disruption and theft of confidential information.
We focus on proactive measures to prevent and mitigate such risks.

59ANNUAL REPORT 2017
SHAREHOLDERS & GENERAL INFORMATIONFINANCIAL STATEMENTSGOVERNANCEPERFORMANCE REVIEWSTRATEGY & BUSINESSABOUT
LEGAL AND REGULATORY RISKS › Our success and ability to compete depends a large extent upon protecting our proprietary
technology. We rely on a combination of patent, trade secret, copyright and trademark laws,
non-disclosure and other agreements, and technical measures to protect our proprietary rights and
confidential information. These agreements and measures may turn out not to be sufficient. Our
technology may be infringed by third parties. In addition, patents issued to us may be challenged,
invalidated or circumvented, rights granted to us under patents may not provide competitive
advantages to us. In addition, monitoring unauthorized use of our intellectual property is difficult and
we cannot be certain that the steps we have taken will prevent unauthorized use of our technology.
The laws of some countries in which our products are or may be developed, manufactured or sold,
including various countries in Asia, may not protect our products or intellectual property rights to the
same extent as do the laws of the Netherlands and the United States. In past years, there has been
substantial litigation regarding patent and other intellectual property rights in our semiconductor and
related technology industries. Litigation is sometimes necessary to enforce patents issued to us, to
protect trade secrets or know-how owned by us or to defend us against claimed infringement of the
rights of others and to determine the scope and validity of the proprietary rights of others. A threat
is that third parties may assert that our products infringe their intellectual property;
› We are party from time to time to various legal proceedings and claims generally incidental to our
business, including without limitation to, intellectual property and product liability claims. For each of
these proceedings and claims, our management evaluates, based on the relevant facts and legal
principles, the likelihood of an unfavorable outcome and whether the amount of the loss can be
reasonably estimated, in connection with our determination of whether or not to record a charge to
earnings. In 2007, ASMI licensed Hitachi Kokusai under certain of its patents in the field of Atomic
Layer Deposition. The license agreement was renewed in 2012. On August 30, 2017, ASMI initiated
an arbitration with the American Arbitration Association against Hitachi Kokusai for breach of the
license agreement between the parties. At this point of time it is unpredictable when the arbitration
will be completed. Following the expiration of the parties’ patent license agreement, ASMI filed, on
December 1, 2017, a suit for patent infringement against Hitachi Kokusai and its US subsidiary in
the US District Court for the Northern District of California. ASMI has asserted infringement of three
of its patents and is seeking both an injunction and monetary damages. Hitachi Kokusai subsequently
filed suit on December 1, 2017 for alleged patent infringement against ASMI in the US District Court
for the Northern District of California. Hitachi Kokusai has asserted seven patents and also seeks an
injunction and monetary damages. No specific monetary amount has been requested to date.
Thereafter, on February 20, 2018, Hitachi Kokusai initiated litigation in the District of Oregon asserting
four patents against ASMI. ASMI is evaluating the allegations in the Oregon action. ASMI will
vigorously defend its position in each suit asserted by or against Hitachi Kokusai. Litigation
concerning intellectual property rights is complex and usually takes a protracted period of time.
Therefore in connection with these lawsuits ASMI may incur substantial legal fees and costs, and it
is not certain that ASMI will prevail in the suits. If ASMI would not be successful in its suits as plaintiff
or as defendant, then the potential outcomes may include, without limitation, payment of significant
monetary damages, injunctive relief prohibiting sales in the USA, and/or settlement involving
significant costs. At this stage it is not possible to predict the outcome of the above mentioned suits,
or whether other suits will be started by Hitachi Kokusai. The final outcome could potentially have
a material adverse effect on our business, results and financial condition;
› Our operations are subject to many laws and regulations wherever we operate. To the extent such
regulations or directives apply to our business throughout the world, such legislation may adversely
affect our business. As with other companies engaged in similar activities, we face inherent risks of
environmental liability in our current and historical manufacturing, R&D activities, and operations.
Accordingly, costs and regulatory fines associated with such future environmental compliance or
remediation obligations could adversely affect our business. We seek to mitigate these risks through
preventative and protective practices; and
› Changes in taxation could affect our future profitability.
RISKS RELATED TO OUR INVESTMENT IN ASM PACIFIC TECHNOLOGY › A significant portion of our total assets is composed of our interest in ASMPT. Prior to March
2013, we owned approximately 52% of the outstanding equity of ASMPT, and the assets and
operating results of ASMPT were reported by us on a consolidated basis. On March 15, 2013,
we disposed of a 12% stake in ASMPT, which reduced our ownership to approximately 40% of
the outstanding equity. As a result of this, ASMPT ceased to be a consolidated subsidiary as of
that date and our pro rata interest in the net earnings of ASMPT is reported in our Consolidated
Statement of Profit or Loss. During 2017, we disposed a stake of approximately 14% in ASMPT.
As per December 31, 2017, our interest in ASMPT is 25.18%. Although ASMPT operates in the
same industry as ASMI, ASMPT addresses a different segment of the industry, which may involve
different market dynamics and competitive factors from time to time, as well as different business
risks unique to their operations. ASMPT is a public company traded on the Hong Kong Stock
Exchange.

60ANNUAL REPORT 2017
SHAREHOLDERS & GENERAL INFORMATIONFINANCIAL STATEMENTSGOVERNANCEPERFORMANCE REVIEWSTRATEGY & BUSINESSABOUT
The significant risks currently considered relevant, potential consequences, and applicable mitigating measures can be outlined as follows:
RISK POTENTIAL CONSEQUENCES MITIGATING MEASURES
STRATEGIC
Ability to respond to changes in product demand and technology change
Financial loss due to decreased orders and/or reputation damage Appropriate investment in R&D initiatives to support both strategic objectives and customer requests
Ability to attract and retain appropriately qualified and experienced personnel
Reduced sales, delayed product development and diversion of management resources
Robust talent management and succession planning programs and tools
Cyclical nature of the semiconductor market Financial loss due to reduced demand and fixed overheads during industry downturns
Abrupt increases in demand for semiconductor devices and insufficient production capacity during industry upturns
Outsourcing generic manufacturing
Financial structure, cash, standby credit facility
OPERATIONAL
Failure to deliver product of sufficient quality or on time Financial loss due to penalties, rework and/or reduced future demand Commitment to: › delivering quality tools and equipment with robust quality assurance processes and controls in place
› timely response to customer requests through 24/7
Dependence on small number of large customers Loss of a customer or significant reduction in demand could result in significant downturn in financial results
Commitment to: › delivering quality tools and equipment with robust quality assurance processes and controls in place
› timely response to customer requests › pro-actively working with customers to strengthen relationships and ensure as far as possible we meet expectations
IT security breaches including cyber attacks Reputation damage and/or financial loss IT risk management framework
Failure of contract manufacturer to deliver Financial loss due to penalties, rework and/or reduced future demand Effective recovery plan in place for contract manufacturers
Disruption of material supplies Loss of reputation and/or financial loss Effective recovery plan to ensure continuity of material supplies
Disruption of critical business processes through IT downtime
Potential loss of reputation and/or financial loss Comprehensive IT recovery plan based on detailed business impact analysis
Environment, health and safety (EHS) Incidents and accidents Effective global EHS organization and corrective and preventive action processes to implement structural controls
FINANCIAL
Financial reporting is not complete or accurate Reputation damage and/or financial loss Finance Control Framework
LEGAL AND REGULATORY RISKS
Non-adherence to laws and regulations Reputation damage and/or financial loss Detailed policies and procedures
Failure to adequately protect our Intellectual Property (IP) and/or leakage of our IP
Loss of competitive advantage could adversely impact demand and financial performance
Robust governance framework and controls in place to establish, maintain and protect our intellectual property rights
Control framework established to minimize as far as possible the risk of data leakage

61ANNUAL REPORT 2017
SHAREHOLDERS & GENERAL INFORMATIONFINANCIAL STATEMENTSGOVERNANCEPERFORMANCE REVIEWSTRATEGY & BUSINESSABOUT
OUR RESULTS
> Financial performance
> Markets and products
> Research and development
> People and society
> Environment
> Supply chain
PERFORMANCE REVIEW
CHAPTER PREVIEW

62ANNUAL REPORT 2017
CHAPTER PREVIEWWe performed strongly in 2017, with revenues increasing by 23% to a record high and total new bookings growing by 24% to €774 million.
Revenue growth was driven by customers investing in new ALD applications for the most
advanced 3D-NAND device manufacturing, while we also saw strong traction in new product
areas in epitaxy and PECVD. The contribution to our equipment sales of both product lines
increased during the year.
EXPANDING OUR CUSTOMER BASE
In recent years, we have further broadened our customer base and strengthened relationships
with key customers. Revenue from our top-ten customers increased to 83% in 2017, from 79%
in 2016.
KEY TECHNOLOGY
Working with our customers, we continued to expand the number of ALD process steps and
applications for the most advanced technology nodes. ALD is now firmly established as a key
enabling technology. In logic, foundry, and memory, the leading customers have already ramped
several technology generations based on our ALD equipment.
SHAREHOLDERS & GENERAL INFORMATIONFINANCIAL STATEMENTSGOVERNANCEPERFORMANCE REVIEWSTRATEGY & BUSINESSABOUT
OUR RESULTS
> Financial performance
> Markets and products
> Research and development
> People and society
> Environment
> Supply chain
PERFORMANCE REVIEW
CHAPTER PREVIEW

63ANNUAL REPORT 2017
SHAREHOLDERS & GENERAL INFORMATIONFINANCIAL STATEMENTSGOVERNANCEPERFORMANCE REVIEWSTRATEGY & BUSINESSABOUT
FINANCIAL PERFORMANCEWe are an equipment supplier mainly to the semiconductor manufacturing industry. We design, manufacture, and sell equipment and services to our customers for the production of semiconductor devices, or integrated circuits. The semiconductor capital equipment market is composed of three major market segments: wafer-processing equipment, assembly and packaging equipment, and test equipment. Through our Front-end business, we are active in the wafer processing segment. Additionally, as per December 31, 2017, we have a 25.18% stake in ASM Pacific Technology (ASMPT), which is a leading supplier of assembly and packaging equipment to the semiconductor, LED, and electronics markets.
FRONT-END OPERATIONSWe conduct our Front-end business through wholly-owned subsidiaries, the most significant being
ASM Front-End Manufacturing Singapore Pte Ltd (FEMS), located in Singapore, ASM Europe BV
(ASM Europe), located in the Netherlands, ASM America Inc (ASM America), located in the United
States, ASM Japan KK (ASM Japan), located in Japan, and ASM Korea Ltd (ASM Korea), located
in South Korea. The locations of our facilities allow us to interact closely with customers in the
world’s major geographical market segments: Europe, United States, and Asia.
Our wafer processing business supplies equipment to the leading semiconductor manufacturers
in the logic, foundry and memory markets, primarily for the deposition of thin films. The logic market
is made up of manufacturers who create chips that are used to process data; the foundry market
consists of businesses that operate semiconductor fabrication plants to manufacture the designs
of other semiconductor companies; and the memory market covers manufacturers who make chips
that store information either temporarily or permanently, such as random access memory (RAM).
We also supply equipment to leading manufacturers of analog semiconductor devices.
The principal markets that we address in wafer processing are selected segments of the deposition
equipment market. The total deposition equipment market was estimated to be US$11.5 billion
in 2017 (VLSI Research, February 2018). Within this market we focus on the following segments:
vertical furnaces, epitaxy, PECVD, and ALD. ALD is an advanced technology that deposits atomic
layers one at a time on wafers. This process is used to create ultra-thin films of exceptional quality
and flatness. Plasma is sometimes used to enhance the process further (Plasma Enhanced ALD,
or PEALD) and enables the deposition at reduced process temperature.
BACK-END OPERATIONSOur investment in ASM Pacific Technology represents the Back-end business. The Back-end
operations are conducted through facilities in Hong Kong, the People’s Republic of China, Singapore,
Malaysia, and Germany. On March 15, 2013, we reduced our shareholding in ASMPT from 52%
to around 40%. The sale of the 12% stake in ASMPT caused and required the deconsolidation
of ASMPT. Since that date, our share of the net result of ASMPT is reported on the line share
in income of investments in associates. In April 2017, we sold a stake of 4.9% and in November
2017 we sold a stake of 9.1% in ASMPT. Our current shareholding in ASMPT is 25.18%.
MOORE’S LAWA key driver in the semiconductor industry is the continuous demand for smaller, faster, and
cheaper semiconductor components. Through technology advances in the manufacturing process,
semiconductor manufacturers are continuously scaling chips to smaller dimensions. This enables
more transistors to fit in the same physical space, thereby reducing the costs and increasing the
speed and performance of a device. Another trend is towards vertical or 3D transistors. This trend
also helps to keep the industry on track with Moore’s Law (processor speeds, or overall processing
power for computers, will double every two years).
OUR RESULTS

64ANNUAL REPORT 2017
SHAREHOLDERS & GENERAL INFORMATIONFINANCIAL STATEMENTSGOVERNANCEPERFORMANCE REVIEWSTRATEGY & BUSINESSABOUT
ADVANCED DEPOSITION TECHNIQUESThe manufacture of ever-smaller and more complex devices requires more advanced and precise
deposit techniques. ALD offers the precision needed to deposit ultra-thin and highly conformal
films, even on challenging 3D surfaces. Our portfolio of ALD products is an enabling technology
for our customers, helping them to manufacture semiconductor devices at smaller line widths with
new materials and 3D architectures. Our technologies support our customers in their roadmap
towards chips with a higher performance and reduced energy consumption, which in turn enable the
introduction of new and more advanced products ranging from high-end servers to smartphones,
wearable devices, and automotive electronics.
STRATEGYOur strategic objective is to realize profitable, sustainable growth by capitalizing on our innovative
strength in deposition technologies and our strong relationships with key customers. We act as a
responsible citizen in achieving this.
MARKET DEVELOPMENTThe broader semiconductor wafer fab equipment (WFE) market showed a strong performance with
approximately 30% year-over-year growth in 2017. The growth in WFE spending was particularly
driven by the memory segment while the logic/foundry segment was relatively stable. Within memory
capital spending the growth was highest in the NAND Flash segment, predominantly in the area
of 3D-NAND. WFE spending in the DRAM segment also increased following the drop in 2016.
The single-wafer ALD market showed a clear improvement in 2017 following the drop in 2016.
The single-wafer ALD market was particularly driven by strong increases in memory, while the logic/
foundry remained relatively stable at a strong level. The recovery in the DRAM patterning part of the
single-wafer ALD was held back by reuse of existing equipment as customer focused on investments
within existing facilities.
FINANCIAL RESULTSThe following table shows the operating performance for 2017, versus 2016:
(EUR million) 2016 2017 CHANGE
New orders 622.3 773.6 24%
Backlog 156.7 176.3 13%
Book-to-bill 1.0 1.0
Net sales 597.9 737.4 23%
Gross profit 264.5 305.9 16%
Gross profit margin % 44.2% 41.5%
Selling, general and administrative expenses (91.1) (99.9) 10%
Research and development expenses (87.6) (88.4) 1%
Impairment charges property, plant and equipment and other intangible assets (3.6) (4.3) 19%
Operating result 82.2 113.2 38%
Operating margin % 13.8% 15.3%
Financing income / (expense) 15.0 (30.7) (45.7)
Income taxes (2.3) (4.6) (2.3)
Net earnings before share in income of investments in associates 95.0 77.9 (17.1)
Share in income of investments in associates 40.5 89.6 49.1
Result from sale ASMPT shares — 284.9 n/a
Net earnings 135.5 452.4 316.9
Net earnings per share, diluted €2.21 €7.63 €5.42
Net earnings per share excluding effects from the sale of ASMPT shares €2.65 €3.21 €0.56

65ANNUAL REPORT 2017
SHAREHOLDERS & GENERAL INFORMATIONFINANCIAL STATEMENTSGOVERNANCEPERFORMANCE REVIEWSTRATEGY & BUSINESSABOUT
The following table shows certain Consolidated statement of profit or loss data as a percentage
of net sales for our operations for 2016 and 2017:
2016 2017
Net sales 100.0% 100.0%
Cost of sales (55.8)% (58.5)%
GROSS PROFIT 44.2% 41.5%
Selling, general and administrative expenses (15.2)% (13.6)%
Research and development expenses (14.6)% (12.0)%
Impairment charges (0.6)% (0.6)%
OPERATING RESULT 13.8% 15.3%
Net interest income (expense) 0.3% (0.0)%
Foreign currency exchange gains (losses) 2.2% (4.1)%
Share in income of investments in associates 6.8% 12.2%
Result from sale ASMPT shares —% 38.6%
EARNINGS BEFORE INCOME TAXES 23.0% 62.0%
Income taxes (0.4)% (0.6)%
NET EARNINGS FROM OPERATIONS 22.7% 61.4%
NET SALESThe sales cycle from quotation to shipment for our Front-end equipment generally takes several
months, depending on capacity utilization and the urgency of the order. Usually, acceptance
is within four months after shipment. The sales cycle is longer for equipment that is installed at the
customer’s site for evaluation prior to sale. The typical trial period ranges from six months to one year
after installation.
Our sales are concentrated in the United States, Europe and Asia. The following table shows the
geographic distribution of our net sales for 2016 and 2017:
YEAR ENDED DECEMBER 31,
(EUR million) 2016 2017
United States €145.1 24.3% €199.5 27.1%
Europe 113.8 19.0% 106.7 14.5%
Taiwan 182.8 30.6% 164.0 22.2%
Japan 60.2 10.1% 112.7 15.3%
South Korea 46.8 7.8% 102.9 14.0%
Other Asia 49.2 8.2% 51.7 7.0%
€597.9 100.0% €737.4 100.0%
A substantial portion of our sales is for equipping new or upgraded fabrication plants where device
manufacturers are installing complete fabrication equipment. As a result, our sales in this segment
tend to be uneven across customers and financial periods. Sales to our ten largest customers
accounted for 78.5% and 83.1% of net sales in 2016 and 2017, respectively. The composition of our
ten largest Front-end customers changes from year to year. The largest customer accounted for
more than 10% of Front-end net sales in 2016 and 2017.
Revenue growth driven by improvement in single-wafer ALD market and new product launchesOur revenue increased by 23% in 2017 to a new record high of €737 million. The impact of currency
changes on revenue was a decrease of 2%. Next to strong traction in new product areas in epitaxy
and PECVD we benefited from a clear improvement in the single-wafer ALD market in 2017. Our
revenue growth was particularly driven by customers’ investments in new ALD applications for the
manufacturing of advanced generations of 3D-NAND devices. After the strong growth we recorded
in 2016 especially in the foundry segment, our ALD sales in the overall logic/foundry segment
remained relatively stable in 2017 and were driven by continued capacity investments in the
10-nanometer technology node as well as the first investment in the next 7-nanometer technology.
In the DRAM segment our sales remained at a relatively low level following the drop in 2016.
By industry segment, the revenue stream in 2017 was led by foundry, followed by memory and
then logic. Within memory, sales were predominantly related to 3D-NAND. In 2016, sales were led
by foundry, followed by logic.

66ANNUAL REPORT 2017
SHAREHOLDERS & GENERAL INFORMATIONFINANCIAL STATEMENTSGOVERNANCEPERFORMANCE REVIEWSTRATEGY & BUSINESSABOUT
In addition to an overall increase in our ALD product line, we achieved strong growth in our
epitaxy and PECVD product lines. In epitaxy sales growth was primarily driven by a tool win that
we announced in April 2017. This win was from a leading foundry customer that selected our newly-
launched Intrepid ES systems for an advanced CMOS application in high volume manufacturing.
In PECVD we also recorded a strong increase in our sales in 2017 following a new application win
in the 3D-NAND segment.
In 2017, we again made further progress, in cooperation with our customers, to expand the number
of ALD process steps and applications for the most advanced technology nodes. ALD is now firmly
established as a key enabling technology. In logic, foundry, and memory, the leading customers have
already ramped several technology generations based on our ALD equipment.
Our ALD equipment is an enabling technology for spacer-defined multiple patterning, which is used
by leading customers in DRAM memory and the logic and foundry market. In addition, ALD is a
core technology for high-k metal gate and advanced FinFET applications in the logic and foundry
sectors. In the memory market ALD is also increasingly being used for critical process steps in next-
generation 3D-NAND devices.
Strong growth in epitaxy and PECVDIn recent years, we have further broadened our customer base and strengthened relationships with
key customers.
We recorded strong growth in epitaxy and PECVD and the contribution to our equipment sales
of both product lines increased in 2017. Following several years of steady growth in customer
deployment and the development of new applications, ALD continues to be a key growth driver for
our company. In 2017 we benefited from a clear recovery in the single-wafer ALD market. Our ALD
product lines continued to account for clearly more than half of total equipment revenue in 2017.
BOOKINGSThe following table shows the level of new orders for the full year 2017 and the backlog for the same
period over 2016:
YEAR ENDED DECEMBER 31,
(EUR million) 2016 2017 % CHANGE
BACKLOG AT THE BEGINNING OF THE YEAR 127.8 156.7 23%
New orders 622.3 773.6 24%
Net sales (597.9) (737.4) 23%
FX-effect 4.5 (16.6)
BACKLOG AS PER REPORTING DATE 156.7 176.3 13%
BOOK-TO-BILL RATIO (NEW ORDERS DIVIDED BY NET SALES) 1.0 1.0
The backlog includes orders for which purchase orders or letters of intent have been accepted,
typically for up to one year. Historically, orders have been subject to cancellation or rescheduling
by customers. In addition, orders have been subject to price negotiations and changes
in specifications as a result of changes in customers’ requirements. Due to possible customer
changes in delivery schedules and requirements, and to cancellations of orders, our backlog at any
particular date is not necessarily indicative of actual sales for any subsequent period.
For the year in total, our new bookings increased by 24% in 2017 to €774 million. The book-to-
bill as measured by orders divided by sales remained on the same level (1.0 in 2016 and 1.0 in
2017). Equipment bookings in 2017 for ASMI as a whole were led by the foundry segment, followed
by logic, and memory.
Bookings increased to record highs in the first half of 2017 with a level of more than €200 million
in both the first and second quarter. Bookings moderated to €160 million in the third quarter and then
increased again to €203 million in the fourth quarter of 2017.
We finished the year with an order backlog of €176 million, an increase of 13% compared to the end
of 2016.

67ANNUAL REPORT 2017
SHAREHOLDERS & GENERAL INFORMATIONFINANCIAL STATEMENTSGOVERNANCEPERFORMANCE REVIEWSTRATEGY & BUSINESSABOUT
GROSS PROFIT MARGINTotal gross profit developed as follows:
YEAR ENDED DECEMBER 31,
GROSS PROFIT GROSS PROFIT MARGIN INCREASE (DECREASE)
PERCENTAGE POINTS(EUR million) 2016 2017 2016 2017
Front-end 264.5 305.9 44.2% 41.5% (27) ppt
The gross profit margin decreased to 41.5% in 2017 compared to 44.2% in 2016.
The decrease in gross margin mainly reflects the negative impact from new product introductions
and related initial costs in our epitaxy and PECVD activities. This negative impact was mainly
reflected in the gross margin in the second half of the year as our sales in the third and fourth quarter
included multiple tools of our Intrepid epitaxy system and PECVD tools for new applications. In the
first half of 2017 the gross margin was still relatively steady at 43.6% but decreased to 39.6% in the
second half.
Excluding the temporary impact from the new product introductions, our gross margin was stable
in 2017. This reflects the impact from the programs that have been implemented in the recent years
to further improve the efficiency and flexibility of our manufacturing and supply chain operations.
These measures included new outsourcing initiatives, a stronger focus on sourcing of complete
subassemblies and the migration of a major part of our supply base to Asia. Over time, these
measures have contributed to a reduction in the fixed costs part of total costs of goods sold.
Currency changes led to a 2% decrease in gross profit compared to 2016.
SELLING, GENERAL AND ADMINISTRATIVE EXPENSESTotal selling, general and administrative expenses developed as follows:
YEAR ENDED DECEMBER 31,
(EUR million) 2016 2017 % CHANGE
Front-end 91.1 99.9 10%
Selling, general and administrative (SG&A) expenses increased by 10% in 2017 compared to the
previous year. As a percentage of sales, SG&A expenses were 14% in 2017 and 15% in 2016.
SG&A included restructuring expenses of €0.8 million in 2017.
The impact of currency changes on SG&A expenses resulted in a decrease of 1% year-over-year.
RESEARCH AND DEVELOPMENT EXPENSESTotal research and development (R&D) expenses, excluding impairment charges, increased by 2%
in 2017 compared to the previous year, mainly driven by additional investments to fulfill customer
requirements. As a percentage of sales, R&D expenses decreased to 13% compared to 15%
in 2016. Currency changes resulted in a 2% decrease in R&D expenses year-over-year.
Total research and development expenses developed as follows:
YEAR ENDED DECEMBER 31,
(EUR million) 2016 2017 % CHANGE
Front-end:
Research and development expenses 101.5 114.1 12%
Capitalization of development expenses (26.5) (38.6) 46%
Research and development grants and credits (0.8) (0.3) (61%)
Amortization of capitalized development expenses 13.3 13.3 –%
87.6 88.4 1%
Impairment capitalized development expenses 3.6 4.3 19%
TOTAL 91.1 92.8 2%
Impairment of capitalized development expenses related primarily to the development of new
technology that is now no longer in-demand from customers.
We continue to invest strongly in R&D. As part of our R&D activities, we are engaged in various
development programs with customers and research institutes. These allow us to develop products
that meet customer requirements and obtain access to new technology and expertise. The costs
relating to prototypes and experimental models, which we may subsequently sell to customers, are
charged to the cost of sales.

68ANNUAL REPORT 2017
SHAREHOLDERS & GENERAL INFORMATIONFINANCIAL STATEMENTSGOVERNANCEPERFORMANCE REVIEWSTRATEGY & BUSINESSABOUT
Our R&D operations in the Netherlands, Belgium, and the United States receive research and
development grants and credits from various sources.
OPERATING RESULTThe operating result developed as follows:
YEAR ENDED DECEMBER 31,
(EUR million) 2016 2017 % CHANGE
Front-end:
BEFORE SPECIAL ITEMS 90.7 118.3 30%
Impairment charges (5.3) (4.3) (19)%
Restructuring expenses (3.1) (0.8) n/a
INCLUDING SPECIAL ITEMS 82.2 113.2 38%
Operating profit increased to €113.2 million from €82.2 million in 2016, and the operating profit
margin increased to 15.3% from 13.8%.
Impairment charges in 2017 and 2016 related to capitalized development expenditures and assets.
FINANCING COSTSFinancing costs mainly reflect translation results. A substantial part of our cash position is denominated
in US dollars.
RESULTS FROM INVESTMENTSResults from investments, which primarily reflects our shareholding in ASMPT, increased to
€112.4 million from €67.7 million in 2016. These exclude the amortization of intangible assets related
to ASMPT, as well as the book profit on the stake sales in 2017. During the year, we reduced our
stake in ASMPT in two steps from approximately 39% to approximately 25%. ASMI’s net earnings
included a result of €285 million from the sale of the ASMPT stake.
Total sales as reported by ASMPT increased by 23% to US$2.2 billion in 2017. Sales of the Back-end
equipment business increased 19% in 2017. This growth percentage was impacted by the LED
market which contracted in 2017 as customers needed time to digest the new capacity installed
in 2016. ASMPT performed very well in segments such as camera image sensors and 3D Sensing,
advanced packaging and power management applications. Sales of SMT Solutions increased
by a very strong 31% for the full year driven by automotive, industrial electronics and the latest
upgrade cycle in the smartphone market.
ASMPT increased gross margins from 37.6% to 40.2% in 2017. On a 100% basis ASMPT increased
net profits by 89%.
INCOME TAXThe income tax expense of €4.6 million (2016: €2.3 million) reflects an effective tax rate of 1.0%
(2016: 1.7%). For further information on tax, see Note 20 to the Consolidated financial statements.
NET EARNINGSNet earnings developed as follows:
YEAR ENDED DECEMBER 31,
(EUR million) 2016 2017 CHANGE
Front-end:
BEFORE SPECIAL ITEMS 103.4 83.0 (20.4)
Impairment charges (5.3) (4.3) 1.0
Restructuring expenses (3.1) (0.8) 2.3
TOTAL 95.0 77.9 (17.1)
Back-end:
Investment in ASMPT 67.7 112.4 44.7
Amortization other intangible assets from purchase price allocation (27.2) (22.8) 4.4
Result from sale of ASMPT stake – 284.9 284.9
TOTAL 40.5 374.5 334.0
NET RESULT FROM CONTINUING OPERATIONS 135.5 452.4 316.9
NET RESULT FROM OPERATIONS 135.5 452.4 316.9

69ANNUAL REPORT 2017
SHAREHOLDERS & GENERAL INFORMATIONFINANCIAL STATEMENTSGOVERNANCEPERFORMANCE REVIEWSTRATEGY & BUSINESSABOUT
CASH FLOWThe following table shows the cash flow statement:
(EUR million) 2016 2017
NET EARNINGS FROM OPERATIONS 135.5 452.4
Adjustments to cash from operating activities:
Depreciation, amortization and impairments 51.7 52.1
Income tax 2.3 4.6
Share in income of investments in associates (40.5) (89.6)
Gain on sale of ASMPT shares – (284.9)
Share-based compensation 8.4 7.8
Non-cash financing costs (2.5) 29.6
Changes in other assets and liabilities:
Accounts receivable (43.4) (37.9)
Inventories (9.5) (45.2)
Accounts payable and accrued expenses 7.0 28.4
Other assets and liabilities (10.2) 2.5
Income tax paid (7.4) (3.9)
NET CASH FROM OPERATING ACTIVITIES 91.4 116.1
Capital expenditures (net) (25.7) (43.3)
Capitalized development expenditure (27.3) (38.6)
Purchase of intangible assets (7.0) (2.4)
Dividend received from associates 22.1 36.5
Proceeds from sales of ASMPT shares – 690.7
NET CASH FROM INVESTING ACTIVITIES (38.0) 642.8
Purchase treasury shares (97.0) (239.6)
Debt issuance fees paid (0.8) (0.1)
Proceeds from issuance of treasury shares 14.7 13.3
Dividend paid to shareholders ASMI (42.7) (41.5)
NET CASH USED IN FINANCING ACTIVITIES (125.8) (267.9)
TOTAL NET CASH PROVIDED / (USED) (72.4) 491.0
STATEMENT OF FINANCIAL POSITIONWorking capital at December 31, 2017 was €180 million (2016: €157 million). Working capital
consists of: inventories, accounts receivable, other current assets, accounts payable, provision for
warranty and accrued expenses, and other payables. The number of outstanding days of working
capital, measured against quarterly sales, decreased from 82 days at December 31, 2016 to 77 days
at December 31, 2017.
EMPLOYEESThe following table lists the total number of employees, exclusive of temporary workers:
DECEMBER 31,
GEOGRAPHICAL LOCATION 2016 2017
Europe:
- the Netherlands 141 143
- EMEA 162 171
United States 535 555
Japan 212 228
South Korea 157 221
Singapore 340 395
Asia, other 123 187
TOTAL 1,670 1,900
We had 1,900 employees as per December 31, 2017. The following table lists the number
of employees per function:
DECEMBER 31,
FUNCTION 2016 2017
Research and development 447 497
Manufacturing 296 361
Marketing and sales 252 268
Customer service 506 597
Finance and administration 169 177
TOTAL 1,670 1,900

70ANNUAL REPORT 2017
SHAREHOLDERS & GENERAL INFORMATIONFINANCIAL STATEMENTSGOVERNANCEPERFORMANCE REVIEWSTRATEGY & BUSINESSABOUT
Our Dutch operations, which employed 143 staff as per December 31, 2017, is subject to standardized
industry bargaining under Dutch law, and is required to pay wages and meet conditions established
as a result of negotiations between all Dutch employers in their industry and unions representing
employees of those employers. As required by Dutch law, management in our Dutch facilities meet
with a works council consisting of elected employee representatives to discuss working conditions
and personnel policies, as well as to explain major corporate decisions and to solicit their advice
on major issues.
The assembly and packaging segment, ASMPT, had 16,400 employees as per December 31, 2017
(December 31, 2016: 14,360).
SUBSEQUENT EVENTSSubsequent events were evaluated up to March 16, 2018, which is the issuance date of this Annual
Report 2017. There are no subsequent events to report.
LIQUIDITY AND CAPITAL RESOURCESLIQUIDITYOur liquidity is affected by many factors, some of which are related to our ongoing operations
while others are related to the semiconductor and semiconductor equipment industries, and to the
economies of the countries in which we operate. Although our cash requirements fluctuate based
on the timing and extent of these factors, we believe that cash generated by operations, together
with the liquidity provided by our existing cash resources and our financing arrangements, will
be sufficient to fund working capital, capital expenditures and other ongoing business requirements
for at least the next twelve months.
On December 31, 2017, our principal sources of liquidity consisted of €836 million in cash and cash
equivalents and €150 million in undrawn bank lines.
For the most part, our cash and cash equivalents are not guaranteed by any governmental agency.
We place our cash and cash equivalents with high-quality financial institutions to limit our credit
risk exposure.
CASH FLOWWe generated cash from operating activities of €116.1 million in 2017 (2016: €91.4 million).
We generated cash from investing activities of €642.8 million (2016: €38.0 million used), and used
€267.9 million (2016: €125.8 million) in financing activities.
DEBTWe were debt-free as of December 31, 2017.
In December 2016, we finalized the renewal of our current standby revolving credit facility.
The security of the previous credit agreement has been released. The maturity date of the new credit
commitment of €150 million is December 16, 2021 with an extension option for up to two years.
As per December 31, 2017, this facility was undrawn.
The credit facility of €150 million includes two financial covenants:
› Minimum consolidated tangible net worth; and
› Consolidated total net debt/total equity ratio.
These financial covenants are measured twice each year, on June 30 and December 31. We were
in compliance with these financial covenants as per December 31, 2017.
See Notes 10, 15, and 16 to the Consolidated financial statements for more on our funding, treasury
policies and our long-term debt.
ASMPTThe assembly and packaging segment of our business is organized in ASM Pacific Technology
Ltd (ASMPT). Net cash of our 25.18%-owned associate was €252 million on December 31, 2017.
The cash resources and borrowing capacity of ASMPT are not available to our wafer processing
equipment segment.
Although certain directors of ASMPT are directors of ASMI, ASMPT is under no obligation to declare
dividends to shareholders or enter into transactions that are beneficial to us. As a substantial
shareholder, we can participate in the shareholders’ approval of the payment of dividends, but
cannot compel their payment or size. Cash dividends received from ASMPT during 2016 and 2017
were €22.1 million and €36.5 million, respectively.
The market value of our 25.18% investment in ASMPT was approximately €1,197 million as per
December 31, 2017.

71ANNUAL REPORT 2017
SHAREHOLDERS & GENERAL INFORMATIONFINANCIAL STATEMENTSGOVERNANCEPERFORMANCE REVIEWSTRATEGY & BUSINESSABOUT
FINANCIAL RISK FACTORSWe are exposed to market risks (including foreign exchange rate risk), credit risk, liquidity risk, and
equity price risk. We may use forward exchange contracts to hedge foreign exchange risk. We do
not enter into financial instrument transactions for trading or speculative purposes. See Note 16 to
the Consolidated financial statements for financial risk factors.
OUTLOOKWe have developed forecasts and projections of cash flows and liquidity needs for the upcoming
year. These take into account the current market conditions, reasonable possible changes in trading
performance based on such conditions, and our ability to modify our cost structure as a result
of changing economic conditions and sales levels. In the forecasts, we have also taken into account:
the total cash balances amounting to €836 million on December 31, 2017; the ability to renew debt
arrangements and to access additional indebtedness; and whether or not we will comply with our
financial covenants. Based on this, we believe that our cash on hand at the end of 2017 is adequate
to fund our operations, and our investments in capital expenditures and to fulfill our existing
contractual obligations for the next twelve months.

72ANNUAL REPORT 2017
SHAREHOLDERS & GENERAL INFORMATIONFINANCIAL STATEMENTSGOVERNANCEPERFORMANCE REVIEWSTRATEGY & BUSINESSABOUT
MARKETS AND PRODUCTS2017 was a year of strong growth for our industry. Worldwide semiconductor industry sales increased by more than 20% and were for a large part driven by favorable market conditions and price increases in the memory segments. The market for wafer fab equipment (WFE) grew by approximately 30%, primarily driven by memory customers.
MARKETSIn 2017 our revenue increased by 23% to a new record level. Single-wafer ALD equipment showed
a clear recovery in 2017, with 3D-NAND being the main growth driver. After the drop in 2016, our
ALD DRAM business remained at a relatively low level in 2017. Our DRAM business failed to show
the recovery in 2017 that we had expected earlier in the year. Investments by DRAM customers
increased in 2017 but were mainly made within existing fabs with more reuse of existing equipment
as a result. In the logic/foundry segment of the single-wafer ALD market demand remained
at a healthy level in 2017 following the strong sales increase that we achieved in 2016 in particular
in foundry. During the year we achieved tool-of-record selections for multiple new ALD applications
for the 7nm logic/foundry node.
PRODUCTSNEW PRODUCT INTRODUCTIONSWe launched our new epitaxy tool in 2017, the Intrepid ES and we won our first process
tool-of-record selection for the Intrepid ES for an advanced epitaxy application at a leading foundry
customer. The new customer win for our Intrepid ES tool drove a strong increase in our epitaxy
sales in 2017, which approximately doubled compared to a lower base in 2016. With the successful
launch of the Intrepid ES we are substantially increasing our addressable market in epitaxy.
Our technology investments also resulted in a new win in our PECVD activity in the 3D-NAND market,
which also contributed to our revenue growth in 2017.
PRODUCT STEWARDSHIPWe made significant progress in our quest for product stewardship in 2017. For example, our
engineers developed a key upgrade to our Intrepid epitaxy reactors that allows us to maintain quartz
chambers at a constant temperature during deposition. This keeps the chamber clean, eliminating
the time and energy needed to perform a clean step after every wafer. This also reduces the
environmental footprint in our labs and customer production facilities, as this allows them to extend
the time between wafer clean cycles. This reduces the frequency of thermal cycling and exposure
to corrosive chemicals.
Another notable improvement in 2017 involves heating the exhaust lines of our key products.
This allows toxic effluents to be abated properly via a scrubber rather than being deposited
as byproducts in the exhaust lines, which leads to hazardous waste management challenges.
In 2017, we also increased our focus on the responsible disposal of assets by actively sourcing
end-of-life products back from the market and refurbishing them in lieu of a new product sale where
possible. This extends the life of the equipment and reduces the end-of-life disposal requirements.

73ANNUAL REPORT 2017
SHAREHOLDERS & GENERAL INFORMATIONFINANCIAL STATEMENTSGOVERNANCEPERFORMANCE REVIEWSTRATEGY & BUSINESSABOUT
RESEARCH AND DEVELOPMENTARRANGEMENTS WITH CUSTOMERS, INSTITUTES AND UNIVERSITIESAs of December 31, 2017, we were engaged in several formal joint-development programs with
customers for 300mm applications of our products. As part of these efforts, we may sell new
products to customers at a significantly reduced margin, and invest significant resources in the joint
development and subsequent product qualification. We also were active in evaluations of our most
advanced technologies with selected customers.
We also enter into research projects with universities and research institutes. In 2017, we renewed
our strategic R&D partnership with the Interuniversity Micro-Electronics Center (imec) in Leuven,
Belgium, extending into 2022. Essentially all of our 300mm products, and some of our 200mm
products, are involved in this partnership. From 2013 through 2017, we significantly expanded our
partnership with additional ALD, PEALD, epitaxy, and LPCVD capability. This gives us the opportunity
to investigate, both jointly and independently, the integration of individual process steps in process
modules and electrically active devices. We have partnered with imec since 1990, with significant on-
site representation since 1994.
In December 2003, we commenced a five-year partnership with the University of Helsinki that aims
to further develop atomic layer deposition processes and chemistries. This partnership was extended
for a second and then a third five-year period.
PATENTS AND TRADEMARKSIntellectual property (IP) managers work at all of our major global R&D sites, where they capture
patentable material resulting from our R&D activities. We now have over 1,600 patents in force
worldwide, with many hundreds of those relating specifically to the ALD process technology platform.
TRADEMARK LIST AS OF DECEMBER 31, 2017We have registered a number of trademarks covering our product portfolio in the principal countries.
ASM, the ASM International logo, the ASM Qualified Licensed Supplier logo, Advance, Aurora, Axis,
Dragon, Eagle, EmerALD, Epsilon, Horizon, Intrepid, Medallion, Polygon, Previum, Pulsar, Silcore and
Synergis are registered trademarks of ASM International NV. A400, A412, Loadstar, NCP, XP, and
XP8 are our trademarks. ‘Drive Innovation. Deliver Excellence.’ is our service mark.
EMPLOYEES IN R&D in %
22
26
2120
262730
24
18
12
6
20142012 2013 2015 2016 2017
PATENTS IN FORCEINITIAL PATENT FILINGS
61 6663
95
115
85 1,1661,266
1,081
1,4901,604
1,395
2,000
1,600
1,200
800
400
150
120
90
60
30
20142012 2013 2015 2016 2017 20142012 2013 2015 2016 2017

74ANNUAL REPORT 2017
SHAREHOLDERS & GENERAL INFORMATIONFINANCIAL STATEMENTSGOVERNANCEPERFORMANCE REVIEWSTRATEGY & BUSINESSABOUT
PEOPLE AND SOCIETYIn 2017 we were highly successful in recruiting the skilled and talented people we needed to support our company’s growth, ranging from technicians building our products, to service engineers delivering high-quality support to our clients and people in R&D driving our innovations.
WORKFORCE2014 2015 2016 2017
Employees 1,635 1,597 1,670 1,900
Including external 1,770 1,741 1,770 2,043
Nationalities 26 29 28 29
Male 86% 86% 85% 85%
Female 14% 14% 15% 15%
Voluntary turnover rate 6.1% 6.4% 7.1% 10.4%
Our workforce grew from 1,670 to 1,900 ASMI employees by the end of 2017. In addition to our
own workforce, and taking into account fluctuations in demand, we had also hired 143 external
employees by the end of 2017.
ASMI’s global focus and business spread is clearly reflected in the distribution of our new hires.
Including turnover replacement, we hired in total 487 new employees in 2017: 23% in the US, 6%
in Europe and 72% in Asia.
In 2017 our voluntary turnover rate increased to 10.4%, which although still below the industry
benchmark figures, requires our ongoing focus. We attribute this turnover increase to the improving
economies and industries in all of our regions, which means compelling alternative jobs are available.
At the same time, our focus on attracting the right talented people and our talent management related
actions in developing and retaining the right talent, remain critical given our business requirements
and developments in the international labor market. This is when our succession and talent review
process is crucial in building a talent pipeline to ensure timely succession in case of turnover.
Through our exit interview process we investigate and analyze reasons for turnover, to help improve
our HR processes and policies. The feedback received from exit interviews is also used to drive
improvements an help retain talent going forward.
In 2017, we implemented improvements as part of our continuous people development process.
We started a new online platform for managers to further develop their managerial skills, using the
latest insights on management practices. This will enable managers to improve the quality of their
conversations with employees, leading to more engagement and constructive interactions.
NET SALES (EUR million)
431NET SALES (EUR million)
199NET SALES (EUR million)
EUROPE asiaNorth amErica
107EMPLOYEES (At year-end)
1,031EMPLOYEES (At year-end)
555EMPLOYEES (At year-end)
314

75ANNUAL REPORT 2017
SHAREHOLDERS & GENERAL INFORMATIONFINANCIAL STATEMENTSGOVERNANCEPERFORMANCE REVIEWSTRATEGY & BUSINESSABOUT
Further, we began piloting a comprehensive technical career ladder framework. The model
is designed to support the development of our engineers, enhance their capabilities and ensure
adequate rewards and recognition for continued performance. We will evaluate this pilot in 2018 and,
if deemed successful, will roll it out to a broader target group.
DIVERSITYASMI is an equal opportunity employer. We recognize and respect the differences between individuals
and we understand that these differences can include ethnicity, religious beliefs, nationality, age,
gender, sexual orientation, family status, physical ability, experience, and perspective.
In 2017 we continued to employ a large number of nationalities throughout the company,
with 29 different nationalities active in 14 different countries. This diversity is reflected at site
levels, meaning that it is normal to work with people from different nationalities on a daily basis.
This international dimension is one of the reasons why people appreciate working for ASMI. In terms
of gender diversity, 15% of our workforce was female at year-end.
ANNUAL ETHICS SCORECARD
CRITERIA SCOPE PERFORMANCE CRITERIA 2017 RESULT
TRAINING
NEW HIRESMandatory sign-off on having received, read, understood and agreed to the Code of Ethics
99.8%
ALL EMPLOYEESEmployees completion of bi-annual refresher training
99.7%
COMPLIANCE ALL EMPLOYEES
Reported concerns from anonymous global reporting program SpeakUp!
1
Reported concerns from other channels 5
AWARENESS GLOBAL Published articles in internal employee newsletter
3
ETHICSOur Code of Ethics applies to our Supervisory Board and Management Board, and to all our
employees, consultants, contractors, temporary employees and critical suppliers. The Code of Ethics
promotes honest and ethical conduct throughout our global operations. The full Code of Ethics can
be found on our website.
TRAININGFor new employees, training starts on the day they begin working with ASMI. They are required
to familiarize themselves with the Code of Ethics and associated policies and processes within
the first week of employment and complete all the required training. In 2017, 99.8% of our new
hires signed off on having read, understood and agreed to the Code of Ethics and completed the
required training. In addition to the initial training, we also require all our employees to take refresher
training every two years. In 2017, 99.7% of all our employees completed the bi-annual Code
of Ethics courses.
COMPLIANCEUnder the governance of our Ethics Committee, which reports to the Management Board,
we continually track our performance against our goals and improve our ethics management system
and performance. We continue to strive for zero ethics violations.
In 2017, one concern was reported through our SpeakUp! system, while five cases were reported
via other channels to the Ethics Committee. All incidents were fully investigated and, in those cases
involving violations to our Code of Ethics, appropriate actions were taken according to internal
policies. The Ethics Committee reviewed all cases and approved the measures taken.
AWARENESSWe work continuously to both increase awareness of and promote ethical behavior. In 2017,
we issued three publications to all employees through our global Connect! internal newsletter. The
articles highlighted a range of relevant topics, such as IT-related ethical questions, ethics in business,
a BU perspective and challenges and opportunities of talent diversification. All articles were written
by members of the Ethics Committee together with a business leader accountable for the relevant
topic. All of these efforts aim to foster behavior in line with our Code of Ethics and in reporting
potential violations.

76ANNUAL REPORT 2017
SHAREHOLDERS & GENERAL INFORMATIONFINANCIAL STATEMENTSGOVERNANCEPERFORMANCE REVIEWSTRATEGY & BUSINESSABOUT
GIFTS AND ENTERTAINMENTIn 2017, building on guidance taken from our Code of Ethics, we introduced a protocol to further
prevent conflict of interest, corruption, and bribery. The protocol provides clear guidance and criteria
on when to accept and when to reject a gift or entertainment. The ultimate aim is to avoid employees
risking any conflict of interest.
GLOBAL EMPLOYMENT STANDARDSIn 2017, we finalized updates to the GES and implemented supporting systems in a number of areas
including disclosing outside employment activities and providing employment contracts in native
or preferred languages.
HEALTH & SAFETYOur safety goal is ZERO HARM! Any incident or injury inspires us to push ourselves more to identify
the risk and prevent the exposure. We continue to set an annual target that pushes ourselves so that
we can ultimately reach ZERO HARM!
Our key performance measures are aligned with our industry and peers, and allow us to benchmark
our performance year-on-year. The key measures include an overall injury rate indicator and
a recordable injury rate indicator (see Glossary at the end of the Annual Report for full definitions).
In 2017, our total injury rate showed a 1.5% improvement from 2016. However, the recordable
injury rate, the measure of serious injuries, improved to a record low since we started measuring
11 years ago.
In 2017, we continued to strengthen our own safety leadership, both internally and externally.
We deployed our ‘BeSAFE – The 6Es of Safety Leadership’ framework to our employees.
We believe that focusing on the key elements of safety leadership within the company helps everyone
become a safety leader. Together, we work to eliminate the risks and hazards that can lead to safety
and health incidents. The model emphasizes this by empowering everyone to lead by example
through taking action, an emphasis on eliminating hazards, and means of evaluating performance
through surveys and incident rates. In 2017, we initiated a quarterly global safety leadership award
that recognizes achievements in demonstrating the attributes of safety leadership. We have started
to share this model with key customers during safety leadership collaboration meetings, which
we believe will improve safety for our people and customers, as well as our industry overall, and lead
to closer collaboration with our customers.
0.26
0.62
20142013 2015 2016
Global Injury and RECORDABLE RatEs
2017
1.5
1.2
0.9
0.6
0.3
Injury RateRecordable Injury Rate
KNOW FOR YOURSELF, REQUIRE TIMELY COMPLETION OF SAFETY TRAINING
YOUR AND YOUR ORGANIZATION’SSAFETY LEADERSHIP
PREVENTION ALWAYSCOMES FIRST, ELIMINATE
HAZARDS UP FRONT
EVERYONE IS A LEADERFOR SAFETY
EL
IMIN
AT
E
EVALUATE
EDUCATEEMPOWER
EX
EM
PL
IFY
EXPECTATIONS
SET THE FOUNDATION FOROUR SAFETY CULTURE
LEAD BY EXAMPLE, IN WORDS AND ACTIONS

77ANNUAL REPORT 2017
SHAREHOLDERS & GENERAL INFORMATIONFINANCIAL STATEMENTSGOVERNANCEPERFORMANCE REVIEWSTRATEGY & BUSINESSABOUT
COMMUNITY CONNECTION AND WELL-BEINGOne of the most important connections we make is with the communities in which we operate. As a global company, we have roots in local communities in Europe, North America and across Asia. In 2017, we participated in a number of new community efforts, and continued with others we were already involved with. In all cases, we are proud to provide support for programs that are important to our employees and that address important community needs.
CONTRIBUTING TO ZERO HUNGERIn 2017, teams at our Singapore and Phoenix
locations, volunteered to help stamp out
hunger. The Singapore HR Team members
volunteered a half-day’s work with the Food
from the Heart (FFTH) charity organization.
Established in February 2003, FFTH is a non-
profit charity that feeds those on low incomes
and those in need in Singapore through its
food distribution. In Phoenix, a Global Operations team volunteered at Feed my Starving Children,
packaging over 1,000 meals that could be sent around the world.
FURNISHING WITH DIGNITYIn 2017, two of our ASMI teams in Phoenix volunteered at Furnishing With Dignity, a non-profit group
that helps families needing support get back on their feet with new furnished homes. The teams
spent several hours in the heat packing up trailers for two families that were about to move into
new apartments.
BLOOD DONATIONIn Singapore, only 1.8% of the population
donates blood. To contribute to what
is a community necessity, each year ASMI joins
a blood donation event. More than 30 employees
(out of 395 employees) took part in the event
in 2017. The donated blood will be used to save
lives in times of emergency and for various
medical conditions.
CONNECTING TEENS AND TECHNOLOGYWe embrace innovation challenges. Over the
past decade, however, society has begun facing
a challenge as the population ages and fewer
students are attracted to technical education.
Technology industries, including our own
semiconductor industry, are facing shortages
of talented young engineers, and the expectation
is that this will continue unless something is done
to reverse the trend. To help address this issue in the Netherlands, Dutch industry has established
a collaboration program between the government and high schools, called JetNet.

78ANNUAL REPORT 2017
SHAREHOLDERS & GENERAL INFORMATIONFINANCIAL STATEMENTSGOVERNANCEPERFORMANCE REVIEWSTRATEGY & BUSINESSABOUT
JetNet aims to inspire children and teenagers to learn more about technology and to stimulate them
to consider a technical education and career. We support JetNet as a partner organization, and joined
the platform in 2015 by developing a relationship with Almere High School to promote technology
classes. In 2017, we engaged with two high school classes and shared with them some of the
diverse problems that we work on at ASMI. Our topics included actual challenges in mechatronics,
reliability, and warranty. By showing them the practical application of the theories they are learning
at school, we hope to instill a desire to help shape the future of our industry.
In 2017, we continued with our lectures, on-site experiments and technical games at the school,
organized an internship, and gave some students the opportunity to visit ASMI to directly understand
and respond to our technology challenges.
ASSISTING WITH A UNIQUE OPPORTUNITYIn Singapore, a local school had a unique request that ASMI was glad to help with. The Association
for Persons with Special Needs (APSN) runs programs focused on developing individuals with
special needs to their fullest potential so that they can lead dignified, fulfilling, and independent lives
as integral members of the society. Among their services, they run multiple schools for children.
One of their schools relocated in 2017, but instead of just closing the doors of the old school and
opening the doors of the new school, they wanted to hold a symbolic walk to raise the excitement
among the children. But how do you safely walk dozens of children with special needs through
a busy and bustling city? ASMI volunteered to help, both in scouting the route, planning how to get
around obstacles, and providing walkers, crosswalk marshals, and sweepers watching the back
of the line on the day of the event. The children arrived at their new school safely and ASMI was
honored to have participated in this unique opportunity.
SUPPORTING PEOPLE WITH LIMITED JOB PROSPECTSAs part of ASMI’s commitment to corporate social responsibility, ASMI is exploring how to support
people with limited job prospects due to their health, mental or physical condition. This initiative is part
of the Dutch Prestatieladder Socialer Ondernemen (PSO) program, the Dutch scheme for social
entrepreneurship, to encourage employers to make a sustainable contribution to the job market.
During 2017, an internal analysis was made to identify the potential for formalizing and certifying our
efforts. This analysis was executed by certified external experts and covered both the role of ASMI
as a social entrepreneur, as well ASMI’s role within the supply chain of suppliers and vendors.
The outcome of the analysis provides ASMI with the required insights to determine a plan of approach
to apply for the so-called ‘Aspirant status’, which is the first level of recognition for the Dutch PSO
certificate. We expect to receive the certification in the course of 2018.

79ANNUAL REPORT 2017
SHAREHOLDERS & GENERAL INFORMATIONFINANCIAL STATEMENTSGOVERNANCEPERFORMANCE REVIEWSTRATEGY & BUSINESSABOUT
ENVIRONMENT
2015Baseline
2017Results
2020Target
GREENHOUSE GAS(GHG) EMISSIONS (per R&D investment)
Figures are mtCO2e/R&D investment EUR millions
177158
168
Below 2015 baseline
10.5%Target
Below 2015 baseline
5 %
2015Baseline
2017Results
2020Target
WATERCONSUMPTION (per R&D investment)
Figures are m3/R&D investment EUR millions
1,886
1,5591,697
Below 2015 baseline
17.3%Target
Below 2015 baseline
10%
Figures are percent solid waste landfill diversion
2015Baseline
2017Results
2020Target
LANDFILL DIVERSION RATE
65%
79%90%
Diversion79%
Target
>90 %
GREENHOUSE GAS (GHG) EMISSIONS(Absolute and normalized per R&D investment)
Absolute Greenhouse Gas emissions(mtCO2e - Scope 1 + 2, x100)
mtCO2e/million EUR R&D investment
20142013 2015 2016 2017
200
180
160
140
120
100
300
260
220
180
140
100
59 5765
7279
In %
20142013 2015 2016 2017
LANDFILL DIVERSION RATE
100
80
60
40
20
0
WATER CONSUMPTION(Absolute and normalized per R&D investment)
Absolute water consumption (m3, x1,000)
m3/million EUR R&D investment
20142013 2015 2016 2017
210
200
190
180
170
160
4,000
3,200
2,400
1,600
800
0

80ANNUAL REPORT 2017
SHAREHOLDERS & GENERAL INFORMATIONFINANCIAL STATEMENTSGOVERNANCEPERFORMANCE REVIEWSTRATEGY & BUSINESSABOUT
Consistent with our ZERO HARM! vision, we strive to continuously reduce our environmental impact.
Our current environmental performance improvement cycle is from 2016-2020, so we are two years
into the cycle. In line with science based targets, we have normalized our greenhouse gas (GHG)
emission reduction and our water consumption reduction objectives to our research and development
(R&D) spend. Our R&D operations are responsible for a majority of the utility consumption through
equipment installations and supporting facility infrastructure.
We have continued to make progress against the objectives. We have exceeded the 5-year objectives in both GHG emissions and water consumption. While this seems early in the cycle, the challenge before us is to ensure the measures taken can be sustained over the target cycle years regardless of changes in R&D spending in years to come. In 2017, we experienced a net increase in the number of process modules in R&D facilities. As a result, absolute electrical consumption increased, leading to an absolute increase in GHG emissions. However, absolute water consumption was reduced. Some initiatives that contributed to the progress toward the normalized objectives include:
› implementation of water reuse plant;
› air conditioner replacements serving R&D operations; and
› conversion to LED lighting.
Our landfill diversion progress continues to trend toward the 2020 objective to divert 90% of our
materials to recycle or reuse. In 2017, we made progress in the implementation of a crate reuse
program through a pilot program with a product line. The program targets the reuse of transportation
crates approximately 10 times before needing to dispose of the crating materials. Previously, crates
were one-time-use materials. The pilot program contributed approximately a 2% increase towards
the landfill diversion results. The opportunity now exists to transfer the process to other product lines
through 2020.
Looking forward, we have plans to:
› replace aging chillers supporting R&D equipment to more efficient
(electrical and water consumption) units;
› replace additional air conditioning systems to more efficient units; and
› expand crate reuse at manufacturing sites.

81ANNUAL REPORT 2017
SHAREHOLDERS & GENERAL INFORMATIONFINANCIAL STATEMENTSGOVERNANCEPERFORMANCE REVIEWSTRATEGY & BUSINESSABOUT
SUPPLY CHAINSUPPLY CHAIN SPEND BY REGION
20% North America
74% Asia Paci�c
6% Europe, Middle East, Africa
In 2017, 85% of our critical suppliers acknowledged our Supplier Code of Conduct.
Our supplier risk assessment process and self-assessments help us identify and measure social,
environmental and ethical risks in our supply chain. This helps us better understand how our critical
suppliers are performing against the code and standards. We work closely with our critical suppliers
to influence corrective actions to ensure continuous improvement. In 2017, 78% of our critical
suppliers completed the required self-assessment with low or medium risk, which is equivalent
to 92% of our total critical supplier baseline spend.
PERFORMANCE MANAGEMENTAs part of our supplier relationship management process, in 2017 we launched the supplier scorecard
to evaluate each of our critical suppliers against a wide range of performance and compliance criteria.
Elements such as cost, quality, and delivery, as well as scoring criteria for compliance are tabulated,
analyzed and distributed quarterly. Each supplier’s performance is reviewed quarterly between the
commodity managers and their key supplier counterparts. In addition to this, semi-annual executive
business reviews are held to put action plans together to monitor and address any gaps.
On August 14, 2017, ASMI held its first-ever global supplier day, inviting over 50 of our critical
suppliers to the event, to deliver industry updates, business unit product insights, and the overall
direction of our company. Using our performance scoring criteria as a baseline for results, we publicly
recognized our top suppliers for their outstanding contribution to ASMI’s success in the prior year.
Suppliers who routinely underperform in any area, or who continually demonstrate a risk to our
continuity of supply or corporate responsibility, are assessed for removal from our portfolio.
MOVING FORWARDIn 2018, we will continue to identify opportunities to improve supply chain operational efficiency,
supplier communication, and supplier training, and embed these in our supplier management system
and procedures. We are therefore preparing to revamp our supplier portal and improve our procure-
to-pay process, supplier communications related to supply chain initiatives, business requirements,
and supplier performance.
GLOBAL SUPPLY CHAIN PROCESSWe are also progressively consolidating our spend with critical suppliers that are supportive of ASMI
compliance policies and business needs. Overall spend with these suppliers has increased from 64%
in 2016 to 67% in 2017.

82ANNUAL REPORT 2017
SHAREHOLDERS & GENERAL INFORMATIONFINANCIAL STATEMENTSGOVERNANCEPERFORMANCE REVIEWSTRATEGY & BUSINESSABOUT
CORPORATE GOVERNANCE
> Corporate governance principles
> Management board
> Supervisory board
> Supervisory board report
> Remuneration report
> External auditor
GOVERNANCE
CHAPTER PREVIEW

83ANNUAL REPORT 2017
CHAPTER PREVIEWWe aspire to high standards of corporate governance and ethics practices. Sound corporate governance is a key component of our culture, behavior, and management and is consistent with our core values. Our corporate governance is supported by a strong focus on integrity, transparency and clear and timely communication.
STRONG FRAMEWORK
We carry out our business in an ethical and open manner. We achieve this by setting up
transparent processes and following internal policies and procedures that enable us to operate
in the best interests of all our stakeholders, and which comply with applicable Dutch corporate
governance requirements. Our corporate governance framework is an integral part of this process,
supporting our business and meeting the needs of our stakeholders.
SHAREHOLDERS & GENERAL INFORMATIONFINANCIAL STATEMENTSGOVERNANCEPERFORMANCE REVIEWSTRATEGY & BUSINESSABOUT
GOVERNANCE
CORPORATE GOVERNANCE
> Corporate governance principles
> Management board
> Supervisory board
> Supervisory board report
> Remuneration report
> External auditor
CHAPTER PREVIEW

84ANNUAL REPORT 2017
SHAREHOLDERS & GENERAL INFORMATIONFINANCIAL STATEMENTSGOVERNANCEPERFORMANCE REVIEWSTRATEGY & BUSINESSABOUT
CORPORATE GOVERNANCE PRINCIPLESGood corporate governance is about applying sound business practices. At ASMI we do business in an ethical and transparent manner. We achieve this by setting up transparent processes and following internal policies and procedures that enable us to operate in the best interests of all our stakeholders, and which comply with applicable Dutch corporate governance requirements.
HIGH STANDARD OF CORPORATE GOVERNANCEASMI aspires to high standards of corporate governance and ethics practices. Sound corporate
governance is a key component of ASMI’s culture, behavior, and management and is consistent with
our core values. Our corporate governance is supported by a strong focus on integrity, transparency
and clear and timely communication. We endeavor to ensure that our policies and procedures comply
with both applicable Dutch corporate governance requirements, to the extent possible and desirable,
and the relevant laws. Furthermore, our corporate governance structure supports our business and
meets the needs of our stakeholders.
COMPANY STRUCTUREASMI is a public listed company established under Dutch law. The company’s management and
supervision structure is organized in a two-tier system, comprising a Management Board, composed
of executive directors, and a Supervisory Board, composed of non-executive directors. The
Company’s Management Board has ultimate responsibility for the overall management of ASMI.
The Management Board is supervised and advised by an independent Supervisory Board. The
Management Board and the Supervisory Board are accountable to ASMI’s shareholders.
ASMI’s common stock trades on the Euronext Amsterdam Stock Exchange (symbol ASM) and
is required to comply with the Dutch Corporate Governance Code (the Code). The ASMI common
shares, which are held in the US as New York Registry Shares, are eligible for trading on the OTC
Market under the symbol ASMIY.
Corporate governance-related documents are available on our website, and include:
› Supervisory Board profile;
› Supervisory Board rules;
› Management Board rules;
› Audit Committee charter;
› Nomination, Selection and Remuneration Committee charter;
› remuneration policy;
› Code of Ethics;
› whistleblower policy;
› anti-fraud policy; and
› rules concerning insider trading.
>
>
>
>
MANAGEMENT BOARD,
SUPERVISORY BOARD AND COMMITTEES
VALUES AND ETHICS
mis
sio
n
OB
JEC
TIV
ES
VISION
STRATEGY
CORPORATEGOVERNANCE
POLICIES & REGULATORY FRAMEWORK
TRANSPARENCY AND
ACCOUNTABILITY
RISK AND PERFORMANCEMANAGEMENT
MONITORING AND INTERNAL
CONTROL
CORPORATE GOVERNANCE FRAMEWORK
Corporate governance

85ANNUAL REPORT 2017
SHAREHOLDERS & GENERAL INFORMATIONFINANCIAL STATEMENTSGOVERNANCEPERFORMANCE REVIEWSTRATEGY & BUSINESSABOUT
MANAGEMENT BOARDThe Management Board, supervised and advised by the Supervisory Board, manages ASMI’s strategic, commercial, financial, and organizational matters, and appoints senior managers. The Supervisory Board supervises and advises the Management Board in the execution of its tasks and responsibilities and establishes their individual remuneration within the boundaries of the remuneration policies approved by the Annual General Meeting of Shareholders and the recommendations by the Nomination, Selection and Remuneration Committee.
COMPOSITION OF THE MANAGEMENT BOARDCHARLES D. (CHUCK) DEL PRADO – CEOMr. del Prado was appointed as a member of the Management Board in May 2006 and President
and Chief Executive Officer on March 1, 2008. Mr. del Prado was reappointed on May 21, 2014 for
a period of four years. Between 1989 and 1996, Mr. del Prado held several marketing and sales
positions at IBM Nederland NV. From 1996 to 2001, he worked in various management positions
at ASML, in manufacturing and sales in Taiwan and the Netherlands. He was appointed as Director
Marketing, Sales & Service of ASM Europe in March 2001. From 2003 to 2007, he was President
and General Manager of ASM America. From January 1, 2008 to February 29, 2008, he acted
as Executive Vice President Front-end Operations at ASM America. He holds a Master’s of Science
degree in Industrial Engineering and Technology Management from the University of Twente,
the Netherlands. Mr. del Prado is a Dutch national.
PETER A.M. VAN BOMMEL – CFOMr. van Bommel was appointed as a member of the Management Board on July 1, 2010 and became
Chief Financial Officer on September 1, 2010. Mr. van Bommel was reappointed on May 21, 2014
for a period of four years. Mr. van Bommel has more than twenty years of experience in the
electronics and semiconductor industry. He spent most of his career at Philips, which he joined
in 1979. From the mid-1990s until 2005, he acted as CFO of several business units of the Philips
Group. Between 2006 and 2008, he was CFO at NXP, formerly Philips Semiconductors. He was
CFO of Odersun AG, a manufacturer of thin-film solar cells and modules until August 31, 2010.
He holds a Master’s degree in Economics from the Erasmus University Rotterdam, the Netherlands.
Mr. van Bommel is a Dutch national.
From left to right: Peter A.M. van Bommel, Charles D. (Chuck) del Prado

86ANNUAL REPORT 2017
SHAREHOLDERS & GENERAL INFORMATIONFINANCIAL STATEMENTSGOVERNANCEPERFORMANCE REVIEWSTRATEGY & BUSINESSABOUT
On April 13, 2016, Mr. van Bommel was reappointed for a period of four years as a member of the
Supervisory Board of Royal KPN NV. He also became the Chairman of the Audit Committee as per that
day. On April 16, 2015, Mr. van Bommel was appointed as a member of the Supervisory Board of Neways
Electronics International NV. Since May 2017, Mr. van Bommel is Executive Director of Stichting Bernhoven.
RESPONSIBILITIESIn addition to the duties of the Management Board stipulated by law and our Articles of Association, the Management Board has the following responsibilities:
› achieving the aims, strategy, policy and results of the Company;
› managing the risks associated with the activities of the Company;
› ensuring proper financing of the Company;
› establishing and maintaining disclosure controls and procedures that ensure that all major financial
information is known to the Management Board in order to ensure that the external financial
reporting is achieved in a timely, complete and accurate manner; and
› determining relevant aspects and achieving aims relating to corporate social responsibility and
sustainability.
The Management Board is guided by the interests of the Company, taking the interests of all
stakeholders into consideration.
The members of the Management Board are collectively responsible for managing the Company.
They are collectively and individually accountable to the Supervisory Board and the Annual General
Meeting of Shareholders for executing the Management Board’s responsibilities. The Management
Board has the general authority to enter into binding agreements with third parties.
The Management Board held various meetings throughout the year 2017. At least once a month,
the Management Board meets to discuss and review the performance of the company.
RISK MANAGEMENT AND CONTROL FRAMEWORKThe Management Board ensures that the Company has an adequately functioning internal risk
management and control framework. A comprehensive risk management and control framework,
based on the “three lines of defense model”, has been established that allows the Audit Committee
and the Management Board a clear overview of the effectiveness of internal controls and risk
management. This is explained in more detail in the risk management chapter on page 54.
The Management Board periodically discusses the internal risk management and control systems
with the Supervisory Board and the Audit Committee. The Management Board provides the
Supervisory Board with all information required for the fulfillment of their obligations and the exercise
of their powers.
The Management Board provides the Annual General Meeting of Shareholders with all information
required for the fulfillment of its obligations and the exercise of its powers in a timely fashion. The
Management Board is responsible for the quality and completeness of financial and other reports
that are publicly disclosed by or on behalf of the Company, including all reports and documents the
Company is required to file.
CONFLICTS OF INTERESTEach Management Board member shall immediately report any potential conflict of interest to the
Chairman of the Supervisory Board and to the other Management Board members. In such cases,
a Management Board member shall provide the Chairman of the Supervisory Board and the other
Management Board members with all information relevant to the conflict and follow the procedures
as set out in the Management Board rules.
APPOINTMENT, SUSPENSION, AND DISMISSALThe Annual General Meeting of Shareholders (AGM) appoints a Management Board member based
on a binding nomination drawn up by the Supervisory Board. The AGM may set aside a binding
nomination by a resolution taken with an absolute majority of the votes cast, representing at least
one third of the share capital. If such a binding nomination is set aside, a new binding nomination
will be drawn up by the Supervisory Board and submitted to a newly called General Meeting
of Shareholders. If this binding nomination is set aside, the General Meeting of Shareholders is free
to appoint a Management Board member, but only with an absolute majority of the votes cast
representing at least one third of our issued capital.
A Management Board member may be suspended at any time by the Supervisory Board.
A Management Board member may, in accordance with a proposal by the Supervisory Board,
be dismissed by the AGM through a majority vote. A resolution to suspend or to dismiss a member
of the Management Board, other than in accordance with a proposal of the Supervisory Board, shall
require the affirmative vote of a majority of the votes cast at a meeting. The affirmative votes must
represent at least one third of the issued capital.
REMUNERATIONFor information regarding the remuneration of the Management Board, please see the remuneration
policy which is posted on our website, the remuneration report, which is included in this report, and
Note 24 to the Consolidated financial statements.

87ANNUAL REPORT 2017
SHAREHOLDERS & GENERAL INFORMATIONFINANCIAL STATEMENTSGOVERNANCEPERFORMANCE REVIEWSTRATEGY & BUSINESSABOUT
SUPERVISORY BOARDThe Supervisory Board oversees strategic and commercial policymaking by the Management Board and the way in which it manages and directs ASMI’s operations and affiliated/associated companies. Members of the Supervisory Board are appointed by the Annual General Meeting of Shareholders upon binding nomination by the Supervisory Board.
COMPOSITION
NAME POSITIONNATION-
ALITYYEAR OF
BIRTHINITIAL
APPOINTMENTTERM
EXPIRES
Jan C. Lobbezoo 1) 2)Chairman of the Supervisory Board Dutch 1946 2009 2021
Heinrich W. Kreutzer 1)Member of the Supervisory Board German 1949 2006 2018
Martin C.J. van Pernis 2)Member of the Supervisory Board Dutch 1945 2010 2018
Ulrich H.R. Schumacher 2)Member of the Supervisory Board German 1958 2008 2020
Stefanie Kahle-Galonske 1)Member of the Supervisory Board German 1969 2017 2021
1 Member of Audit Committee. 2 Member of Nomination, Selection and Remuneration Committee.
JAN C. LOBBEZOOMr. Lobbezoo was initially elected as a member
of the Supervisory Board in May 2009. He became Chairman
of the Supervisory Board in July 2013 and was reappointed
as member and Chairman on May 22, 2017 for a period
of four years. Mr. Lobbezoo was Executive Vice President and
Chief Financial Officer of the semiconductor division of Royal
Philips Electronics from 1994 to 2005. He was a member of the Board of Taiwan Semiconductor
Manufacturing Company (TSMC) for 12 years until 2007 and remains its adviser, specifically
in the areas of US corporate governance, international reporting, and financial review. Currently,
Mr. Lobbezoo is a non-executive member of the one-tier Board of Time Acquisition, the holding
company of the TMC Group. He is Chairman of the Supervisory Board of 5BY2, a Dutch company
active in the supply of automated parking systems. He is also Chairman of the Supervisory Board
of Point One Innovation Investment Fund. He holds a Master’s degree in Business Economics from
the Erasmus University Rotterdam, the Netherlands, and is a Dutch Registered Accountant (RA) and
a member of the Dutch NBA. Mr. Lobbezoo is a Dutch national.
STEFANIE KAHLE-GALONSKEMrs. Kahle-Galonske was elected as a member of the
Supervisory Board on May 22, 2017 for a period of four years.
Since April 2016 Mrs. Kahle-Galonske is CFO of Egon Zehnder
International in Zurich, Switzerland. From March 2013 till March
2016, she was CFO of Markem Imaje (industrial automation)
at Dover Corporation, based in Geneva, Switzerland. Between
January 2007 and February 2012, she held various senior finance positions at NXP Semiconductors
in France and the Netherlands. She started her career in 1997 at Philips Electronics in Hamburg,
Germany and held various finance positions till December 2006 at Philips Electronics and
Semiconductors in Germany and the US. Mrs. Kahle-Galonske graduated in Economics at Ruhr-
University of Bochum, Germany and is a CPA since 2002. Mrs. Kahle-Galonske is a German national.
HEINRICH W. KREUTZERMr. Kreutzer was initially elected as a member of the
Supervisory Board in November 2006 and was reappointed
on May 21, 2014 for a period of four years. Between 1999
and 2003, Mr. Kreutzer was a member of the Management
Board as Chief Operating Officer and Chief Technology Officer
of Alcatel Germany. From 2004 to 2006, he was Managing
Director of Kabel Deutschland GmbH in Munich, Germany. Prior to that he worked at several
companies including General Telephone & Electronics in Waltham, US, and Alcatel in Stuttgart,
Germany. Mr. Kreutzer was on the Board of Directors of Micronas Semiconductor AG (Chairman)
in Zurich, Switzerland, and Micronas Semiconductor GmbH (Chairman) in Freiburg, Germany until

88ANNUAL REPORT 2017
SHAREHOLDERS & GENERAL INFORMATIONFINANCIAL STATEMENTSGOVERNANCEPERFORMANCE REVIEWSTRATEGY & BUSINESSABOUT
April 2016, and at the Board of BKtel Communications GmbH (Chairman), Germany until the end
of 2017. Mr. Kreutzer holds a Master’s degree in Engineering and a Master’s degree in Economics,
and studied at the Technical University of Berlin and the University of Hagen, Germany. Mr. Kreutzer
is a German national.
Per the 2018 AGM Mr. Kreutzer will retire from the Supervisory Board after completing three terms
of four years. A successor will be appointed.
MARTIN C.J. VAN PERNISMr. van Pernis was initially elected as member of the Supervisory
Board in May 2010 and was reappointed on May 21, 2014 for
a period of four years. Mr. van Pernis joined Siemens in 1971 and
retired from the Siemens Group at the end of 2009 as Chairman
of the Management Board of Siemens Nederland NV.
Mr. van Pernis is Chairman of the Supervisory Boards
of Batenburg Techniek NV, Aalberts Industries NV, CM Payments, Optixolar BV, Sacon Architects,
the Rotterdams Philharmonic Orchestra and Member of the Advisory Board of G4S Netherlands.
Mr. van Pernis holds a Master’s degree in Electrical Engineering from the Technical University Delft and
Technical High School The Hague, the Netherlands, and a Master’s degree in Law and Economics from
the Erasmus University Rotterdam, the Netherlands. Mr. van Pernis is a Dutch national.
Per the 2018 AGM Mr. van Pernis will have completed 2 terms of 4 years. In order to attain adequate
continuity and experience in the Supervisory Board it will be proposed to re-appoint Mr. van Pernis for
an additional period of 2 years. This is in line with article 2.2 of the Dutch Corporate Governance Code.
ULRICH H.R. SCHUMACHERMr. Schumacher was initially elected as member of the
Supervisory Board in May 2008 and was reappointed on May
25, 2016 for a period of four years. From 1986 to 1999, he held
various engineering and management positions at Siemens
AG. Between 1996 and 1999, he was CEO and President
of Siemens Semiconductor Group, and became President
and CEO of Infineon Technologies AG after the spin-off from Siemens Semiconductor Group
in 1999. From 2004 to 2007, Mr. Schumacher was a partner at Francisco Partners, a private equity
investment company based in the US. Between 2007 and 2016, he was the CEO and President
of Grace Semiconductor Manufacturing Corporation. More recently he was Managing Director of CGS
DS. From 2012 until the end of 2015, he was Chairman of the Supervisory Board of PACT XPP
Technologies AG. From 2013 till February 2018, Mr. Schumacher was the Chairman of the Executive
Board and CEO of Zumtobel Group AG. Mr. Schumacher holds a PhD in Electrical Engineering from
the University of Aachen, Germany and has completed further education in Business Administration.
Mr. Schumacher is a German national.
THE IMPORTANCE OF DIVERSITYThe Supervisory Board recognizes the value of diversity amongst the members of the Supervisory
Board and the members of the Management Board. Diversity is considered in any event to consist
of gender, specific knowledge, work background, nationality, age and ethnic diversity, (technical)
experience, and skills.
With respect to gender, we strive to have a composition of both the Supervisory Board and
Management Board, representing at least 30% of the seats held by either gender at the same time.
RESPONSIBILITIESThe supervision over the policies of our Management Board and the general course of our business,
and the related management actions, is entrusted to the Supervisory Board. In our two-tier structure
under applicable Dutch law, the Supervisory Board is a separate body independent from the
Management Board.
The Supervisory Board supervises and advises the Management Board in executing its responsibilities, particularly regarding:
› achievement of the Company’s objectives;
› corporate strategy and the risks inherent in the business activities;
› structure and operation of the internal risk management and control systems;
› financial reporting process;
› compliance with legislation and regulations;
› relation of the Company to its shareholders; and
› relevant aspects of corporate social responsibility.
The Supervisory Board is responsible for monitoring and assessing its own performance.
CONFLICTS OF INTERESTA Supervisory Board member facing a conflict of interest shall, in accordance with Article 13 of our
Supervisory Board rules, inform the Chairman of the Supervisory Board immediately. The Chairman
shall, if possible in consultation with the other members of the Supervisory Board, determine the
course of action to be taken.

89ANNUAL REPORT 2017
SHAREHOLDERS & GENERAL INFORMATIONFINANCIAL STATEMENTSGOVERNANCEPERFORMANCE REVIEWSTRATEGY & BUSINESSABOUT
APPOINTMENTIn accordance with Dutch law and the Corporate Governance Code, the Supervisory Board has
drawn up a profile for its own composition. This Supervisory Board Profile is available on our website.
For the selection of future members of the Supervisory Board, we will actively seek for candidates that
support the realization of diversity on the earlier mentioned criteria. Any appointment or reappointment
to the Supervisory Board shall be based on the candidate’s match with the Supervisory Board
Profile. For reappointment, the candidate’s performance during the previous period shall be taken
into account. A Supervisory Board member who is available for reappointment must be interviewed
by the Chairman of the Nomination, Selection and Remuneration Committee. The Chairman of the
Nomination, Selection and Remuneration Committee must be interviewed by the Chairman of the
Supervisory Board. All members of the Supervisory Board follow an introduction program after their
first appointment, in which financial and legal aspects as well as financial reporting and specific
features of ASMI are discussed.
The Supervisory Board shall consist of at least three members. The members should operate
independently of each other and within a good relationship of mutual trust. They should
be experienced in the management of an international, public listed company, and have sufficient
time available to fulfill the function of a Supervisory Board member. The Supervisory Board members
appoint a Chairman from among themselves.
The Supervisory Board is currently again composed of five members, after Mrs. Kahle-Galonske
was elected as a member of the Supervisory Board in May 2017. Mr. Lobbezoo was reappointed
as member in May 2017 in order to attain adequate continuity and experience in the Supervisory
Board.
All members of the Supervisory Board meet the required profile. Supervisory Board members
serve in principle a four-year term and may be re-elected in line with article 2.2 of the Corporate
Governance Code.
REMUNERATIONFor information regarding the remuneration of the Supervisory Board, please see the remuneration
report, which is included in our Annual Report 2017, and Note 24 to the Consolidated
financial statements.
COMMITTEESIn order to more efficiently fulfill its role and in compliance with the Code, the Supervisory Board has
created two committees: the Audit Committee and the Nomination, Selection and Remuneration
(NSR) Committee.
AUDIT COMMITTEEThe Audit Committee assists the Supervisory Board in its responsibility to oversee ASMI’s financing,
financial statements, financial reporting process, and system of internal business controls and risk
management. The Audit Committee advises the Supervisory Board for the nomination of the external
auditor of the Company.
The Audit Committee consists of:
› Heinrich Kreutzer (Chairman);
› Jan Lobbezoo; and
› Stefanie Kahle-Galonske.
Mr. Schumacher was a member of the Audit Committee until Mrs. Kahle-Galonske joined the
Supervisory Board and the Audit Committee, upon which Mr. Schumacher switched to become
a member of the NSR Committee.
The Audit Committee supervises the activities of the Management Board with respect to:
› the structure and operation of the internal risk management and control systems, including
supervision of the enforcement of the relevant legislation and regulations;
› the role and functioning of internal audit;
› policy on tax planning;
› the applications of information and communication technology;
› financing of the Company;
› compliance with recommendations and observations of internal and external auditors;
› release of financial information; and
› relations with the external auditor, including, in particular, its independence, remuneration, and any
non-audit services performed for the Company.

90ANNUAL REPORT 2017
SHAREHOLDERS & GENERAL INFORMATIONFINANCIAL STATEMENTSGOVERNANCEPERFORMANCE REVIEWSTRATEGY & BUSINESSABOUT
The Audit Committee meets periodically to:
› consider the adequacy of the internal control procedures;
› review the operating results with management and the independent auditors;
› review the scope and results of the audit with the independent auditors;
› review the scope and results of internal audits with internal audit;
› review performance evaluations relating to the auditor’s independence;
› review performance and services of the external auditor; and
› review adequateness of the financing structure and tax planning of the Company.
The Chief Executive Officer, Chief Financial Officer, Director Internal Audit, Corporate Director
Group Control, and representatives of the external auditor are invited to, and also attend, the Audit
Committee meetings.
Mr. Lobbezoo, Chairman of the Supervisory Board, and Mrs. Kahle-Galonske, member of the
Supervisory Board, are both members of the Audit Committee and are the Supervisory Board’s financial
experts, taking into consideration their extensive financial background and experience.
NOMINATION, SELECTION AND REMUNERATION COMMITTEEThe Nomination, Selection and Remuneration Committee (NSR) Committee advises the Supervisory
Board on matters relating to the selection and nomination of the members of the Management Board
and Supervisory Board. The NSR Committee further monitors and evaluates the Remuneration Policy
for the Management Board.
The NSR Committee consists of:
› Martin van Pernis (Chairman);
› Jan Lobbezoo; and
› Ulrich Schumacher.
The NSR Committee ensures that a competitive remuneration structure is provided by benchmarking
with other multinational companies of comparable size and complexity operating in comparable
geographical and industrial markets. The NSR Committee evaluates the achievement of performance
criteria specified per Management Board member. After the evaluation, it recommends the level
of remuneration to the Supervisory Board.
On an annual basis, the NSR Committee reports to the Supervisory Board on the application
of the remuneration policy in the previous year and recommends the remuneration policy for the
following years.
The Chief Executive Officer and the Corporate Vice President Global Human Resource are invited to,
and also attend, the NSR Committee meetings.

91ANNUAL REPORT 2017
SHAREHOLDERS & GENERAL INFORMATIONFINANCIAL STATEMENTSGOVERNANCEPERFORMANCE REVIEWSTRATEGY & BUSINESSABOUT
SUPERVISORY BOARD REPORTDuring the year under review, the Supervisory Board performed its duties in accordance with applicable legislation and the Articles of Association of ASM International NV and supervised and advised the Management Board on an ongoing basis.
FINANCIAL STATEMENTSWe present the ASMI 2017 Annual Report in accordance with IFRS, as prepared by the Management
Board and reviewed by the Supervisory Board. Our independent auditors, KPMG Accountants NV,
have audited these financial statements and issued an unqualified opinion. Their report appears
on pages 161 to 167.
All of the members of the Supervisory Board have signed the financial statements in respect of the
financial year 2017.
SUPERVISIONSupervision of the Management Board, its policy decisions and actions are entrusted
to the Supervisory Board. In accordance with Dutch law, the Supervisory Board is a separate
body, independent of the Management Board. The Supervisory Board supervises and advises the
Management Board in executing its responsibilities. The profile of the Supervisory Board describes the
range of expertises that should be represented within the Board. The procedures of the Supervisory
Board and the division of its duties are laid down in the Supervisory Board rules. Both documents are
available on our website www.asm.com.
MEETINGS OF THE SUPERVISORY BOARDDuring 2017, the Supervisory Board met with the Management Board on seven occasions, and
in one conference call. Heinrich Kreutzer, Martin van Pernis, and Ulrich Schumacher attended all
Supervisory Board meetings with the Management Board, while Jan Lobbezoo attended all meetings
except one and Stefanie Kahle-Galonske attended all meetings since her appointment.
SUPERVISORY BOARD MEMBERS’ MEETING ATTENDANCE
CommitteeSupervisory
BoardAudit
Committee
Nomination, Selection and Remuneration Committee (NSR)
Jan C. Lobbezoo 7/8 4/4 1/1
Heinrich W. Kreutzer 8/8 4/4 –
Martin C.J. van Pernis 8/8 – 1/1
Stefanie Kahle-Galonske 6/6 2/2 –
Ulrich H.R. Schumacher 8/8 1/2 1/1
Attendance is expressed as the number of meetings attended out of the number eligible to be attended.
In these meetings, the Boards discussed the strategy and the progress of implementation thereof,
operations, business risks, product and market developments, the Company’s organization,
management and financial structure, and performance, including further profitability improvements.
The developments in corporate governance in general and the Corporate Governance Code
specifically were discussed and reviewed. Other topics addressed by the Supervisory Board were
the annual budget, the review of quarterly financial results and the preparation of the quarterly
earnings press releases. The Supervisory Board also approved the dividend proposal as prepared
by the Management Board and proposed at the AGM in 2017.
One of the meetings was specifically earmarked to discuss with the Management Board the long-term
strategy of the company, the planned implementation of it, and the risks attached to its realization.
In the long-term strategy meeting the Board discussed the semiconductor and semiconductor
equipment market and outlook, the development of ASMI’s market share, the development of the
competitive environment, technology and market trends, the progress with ASMI’s strategic priorities
and ASMI’s long-term revenue and profit or loss forecasts. Also, strategic initiatives to be considered
to improve the Company’s long-term value creation strategy were discussed. Certain topics
discussed during the long-term strategy discussion will be followed up in subsequent meetings of the
Board during 2018.

92ANNUAL REPORT 2017
SHAREHOLDERS & GENERAL INFORMATIONFINANCIAL STATEMENTSGOVERNANCEPERFORMANCE REVIEWSTRATEGY & BUSINESSABOUT
In addition, the Supervisory Board reviewed and discussed the functioning of the Supervisory
Board, its committees, and its individual members through an internal assessment as conducted
by the members of the Supervisory Board. The composition, competencies and functioning of the
Supervisory Board, as also described in the Supervisory Board profile, and its committees were part
of the assessment, as well as the composition of the Management Board, their performance, and the
performance of its individual members, and the relationship between the Supervisory Board and the
Management Board. The conclusion of the assessment was that both the Supervisory Board as the
Management Board function properly and effectively, in addition some suggestions came up for
future Supervisory Board meetings.
CORPORATE GOVERNANCEIncluded in the responsibilities of the Supervisory Board is to oversee the Company’s compliance
with corporate governance standards and best practices. The Supervisory Board is of the opinion
that the Company complies with the Dutch Corporate Governance Code.
SHAREHOLDERSOn April 24, 2017, the Company announced it would sell a stake of 20 million shares of the total
outstanding share capital in ASM Pacific Technology Ltd. (ASMPT) through a partial secondary share
placement. The offering generated cash proceeds for ASMI of a total amount of approximately €245
million. Following the divestment, ASMI owned approximately 34% of the shares in ASMPT.
On September 22, 2017, the Company announced that it will commence a share buyback program
of ASMI’s common shares up to €250 million.
Then on November 2, 2017, the Company further announced that it intended to sell a stake
of 37 million shares of the total outstanding share capital in ASMPT through a partial secondary
share placement, representing a stake of approximately 9% in ASMPT. The Company announced
its intention to distribute a part of the proceeds to its shareholders in the form of a tax efficient
capital return. The offering generated cash proceeds for ASMI of a total amount of approximately
€445 million.
SUPERVISORY BOARD COMPOSITIONThe Supervisory Board is composed of five members. In May 2017, Mrs. Kahle-Galonske was elected
as a member of the Supervisory Board for a period of four years. All five members are independent,
in line with the Corporate Governance Code.
MANAGEMENT BOARD COMPOSITIONThe Management Board remains composed of two members. During 2017, no changes took place
in its composition.
DIVERSITYThe Supervisory Board recognizes the value of diversity amongst the members of the Supervisory
Board and the members of the Management Board as stated in the ASMI diversity policy. Diversity
is considered in any event to consist of gender, specific knowledge, work background, nationality,
age and ethnic diversity, (technical) experience, and skills.
We strive to have a composition with at least 30% of the seats in the Management Board and
Supervisory Board held by either gender. At the same time we aim for the best candidate taking into
account the realization on the diversity criteria and match with the Supervisory Board profile.
In 2017, when searching for a new member of the Supervisory Board, special attention was given
to seek for female candidates. With the appointment of Mrs. Kahle-Galonske as member of the
Supervisory Board, we achieve a 20% female representation in the Supervisory Board. In 2017, the
composition of the Management Board remained unchanged.
In case of open positions in the Supervisory Board or Management Board, the Supervisory Board
prepares a profile based on the required educational and professional background and in the search
will actively seek for candidates that support the realization of diversity on the earlier mentioned
criteria.
INDEPENDENCEThe Supervisory Board is of the opinion that its current members are all independent as defined
by the Dutch Corporate Governance Code. Neither the Chairman nor any other member of the
Supervisory Board is a former member of ASMI’s Management Board, or has another relationship
with ASMI which can be judged ‘not independent’ of ASMI.

93ANNUAL REPORT 2017
SHAREHOLDERS & GENERAL INFORMATIONFINANCIAL STATEMENTSGOVERNANCEPERFORMANCE REVIEWSTRATEGY & BUSINESSABOUT
SUPERVISORY BOARD COMMITTEESAudit CommitteeThe role of the Audit Committee is described in its charter, which is available on the Company’s website
(www.asm.com). The Audit Committee consists of Messrs. Kreutzer (Chairman) and Lobbezoo, and
Mrs. Kahle-Galonske. During the year, the Audit Committee met with the Management Board and
KPMG Accountants, the Company’s independent auditors, on four occasions. Audit Committee
discussions included: the Company’s financial reporting including the application of accounting
principles; the Company’s financial position and financing programs, and tax planning; the
Company’s internal risk management systems; effectiveness of internal controls; the audit performed
and its findings, the Annual Report and financial statements; and the budget and the quarterly
progress reports prepared by the Management Board. The internal auditor participated in all four
Audit Committee meetings, presenting her own actions and findings.
On several occasions, the Audit Committee met with KPMG Accountants, without the members of the
Management Board present, to discuss the risk of fraud. Furthermore, the Audit Committee discussed
the auditor’s performance with the Management Board without KPMG Accountants present.
Nomination, Selection and Remuneration CommitteeThe role of the Nomination, Selection and Remuneration (NSR) Committee is described in its charter,
which is available on the Company’s website, www.asm.com. In general, the NSR Committee advises
the Supervisory Board on matters relating to the selection and nomination of new Management Board
members, as well as the remuneration of the members of the Management Board. This Committee
consists of Messrs. van Pernis (Chairman), Lobbezoo and Schumacher.
In 2017, the NSR Committee held one meeting. The topics discussed included the remuneration
of the individual members of the Management Board. During the meeting of the Committee, the Chief
Executive Officer was present, except when his own remuneration was discussed.
The remuneration of the members of the Management Board is disclosed in Note 24 to the
Consolidated financial statements of the Annual Report. The remuneration of the members of the
Management Board during 2017 is fully in accordance with the remuneration policy.
WORD OF THANKSWe extend gratitude and appreciation to ASMI employees worldwide for their many contributions
and enduring commitment to the Company. It is their commitment and determination that enabled
us to make substantial progress in 2017. We recognize that the cumulative efforts of our workforce
are truly creating real value for all of our stakeholders.
SUPERVISORY BOARDJ.C. Lobbezoo, Chairman
H.W. Kreutzer
S. Kahle-Galonske
M.C.J. van Pernis
U.H.R. Schumacher
Almere, the Netherlands
March 16, 2018

94ANNUAL REPORT 2017
SHAREHOLDERS & GENERAL INFORMATIONFINANCIAL STATEMENTSGOVERNANCEPERFORMANCE REVIEWSTRATEGY & BUSINESSABOUT
REMUNERATION REPORTThis remuneration report is based on the remuneration policy of ASM International NV (ASMI), dated May 21, 2014. The remuneration policy was adopted by the 2014 Annual General Meeting of Shareholders.
REMUNERATION POLICY MANAGEMENT BOARDThe remuneration policy was reviewed by the Supervisory Board in 2014 and is applicable
to members of the Management Board of ASMI. An analysis of different scenarios was included
in this review.
The objective of the remuneration policy is twofold:
› to create a remuneration structure that will allow ASMI to attract, reward and retain qualified
executives in our global competitive industry; and
› to provide and motivate executives with a balanced and competitive remuneration that is focused
on sustainable results, aligned with the long term strategy of ASMI.
The remuneration structure includes four components:
› a fixed (base) salary component;
› a variable component (annual performance based bonus or short-term incentive);
› a long term component (performance based long-term incentive) in the form of stock options and
performance shares; and
› pension provisions and fringe benefits.
The remuneration peer group currently consists of the following companies:
Aalberts Industries N.V. ASML Holding N.V. Lam Research Corporation Spirent Communications
Aixtron SE BE Semiconductor N.V. Microchip Technology Inc. Teradyne Inc.
Amkor Technology Inc. Freescale Semiconductor Ltd 1)
ON Semiconductor Corp. TomTom N.V.
Arcadis N.V. KLA-Tencor Corporation Renishaw Plc Veeco Instruments Inc.
1 Freescale Semiconductor Ltd has been acquired by NXP Semiconductor N.V. and is therefore excluded from the peer group for future reviews.
BASE SALARY MANAGEMENT BOARDThe amounts paid as base salaries to the members of the Management Board in 2017 were as follows:
C.D. del Prado €636,881
P.A.M. van Bommel €415,847
ANNUAL SHORT-TERM INCENTIVE (CASH BONUS) MANAGEMENT BOARDEach year, a short-term incentive can be earned, based on the achievement of specific challenging
targets. These targets are for 75% based on company financial targets, being sales, EBIT and free
cash flow, and for 25% based on non-financial targets. These non-financial targets are derived from
ASMI’s strategic and organizational priorities and include qualitative targets that are relevant to the
responsibilities of the individual Management Board member.
The on-target bonus percentage for the CEO is 100% of base salary, with a maximum pay-out
of 150% of base salary. The on-target bonus percentage for the other members of the Management
Board is 75% of base salary, with a maximum pay-out of 125% of base salary.
For the year 2017 the Management Board partially met the financial targets and met the
non-financial targets.
Based on the results in 2017, the following bonuses shall be paid:
C.D. del Prado €548,646
P.A.M. van Bommel €288,711

95ANNUAL REPORT 2017
SHAREHOLDERS & GENERAL INFORMATIONFINANCIAL STATEMENTSGOVERNANCEPERFORMANCE REVIEWSTRATEGY & BUSINESSABOUT
LONG-TERM INCENTIVE (STOCK OPTIONS/PERFORMANCE SHARES) MANAGEMENT BOARDThe long-term incentive scheme for the members of the Management Board, which was
approved in the 2014 Annual General Meeting of Shareholders, consists of stock options and
performance shares.
The long-term incentive scheme has the following main features:
STOCK OPTIONS › the options will be unconditional;
› 100% of the options which have been granted will become exercisable after three years;
› the options will have a term of seven years;
› the exercise price will be equal to the average closing price on Euronext of ASMI shares during the
five trading days preceding the granting of the option and including the date of granting; and
› the number of options to be granted will be based on a fair value approach.
PERFORMANCE SHARES › the number of the performance shares for on target performance to be awarded will be determined
by the Supervisory Board depending on the value of performance shares as part of the mix between
stock options and performance shares;
› the shares will become unconditional after three years depending on the achievement of
predetermined targets;
› the financial targets to be achieved are measured over a three year performance period. The first
target is sales growth compared to market, which is measured as the average own sales growth
during the measurement period compared to the average market growth during the measurement
period. The second target is the average EBIT percentage, which is measured as the average EBIT
over the measurement period as a percentage of the average sales;
› the maximum number of shares that can be achieved in case of meeting stretch target is 150% of
the target number of performance shares. The minimum number of shares is zero, in case none of
the targets are met; and
› the Management Board members will hold the unconditional shares for at least an additional
two years, however they are allowed to sell a part of the unconditional shares after three years for
tax purposes.
The mix between stock options and performance shares will be determined annually by the
Supervisory Board, taking into account the objectives of the remuneration policy.
The Supervisory Board decided to grant the following value to:
C.D. del Prado:
Performance shares €891,633
P.A.M. van Bommel:
Performance shares €426,243
The grant date is April 20, 2018.
VESTING PERFORMANCE SHARESIn 2017, the first three year performance period of the performance shares granted to the members
of the Management Board has been completed.
Based on the achievement of the performance criteria, the realization percentage is 117.5%.
This leads to the following vesting of the performance shares awarded.
PERFORMANCE SHARES AWARDED APRIL 24, 2015
PERFORMANCE SHARES VESTED APRIL 24, 2018
C.D. del Prado 8,544 10,039
P.A.M. van Bommel 4,450 5,229
PENSION MANAGEMENT BOARDThe pension contributions paid in 2017 were as follows:
C.D. del Prado €110,615
P.A.M. van Bommel €85,306
As of 2015, the members of the Management Board no longer participate in the industry wide
pension fund. They are offered participation in a defined contribution plan for their salary up to
€103,317 (2017). For their salary above €103,317, the members of the Management Board are
compensated with an amount equal to the employer pension contribution. The members of the
Management Board have the option to participate in a net pension plan offered by the company or to
have the compensation paid out in cash.

96ANNUAL REPORT 2017
SHAREHOLDERS & GENERAL INFORMATIONFINANCIAL STATEMENTSGOVERNANCEPERFORMANCE REVIEWSTRATEGY & BUSINESSABOUT
The pension contributions vary from 7.2% to 28.4% of the pensionable salary depending on age.
The members of the Management Board contribute 4.6% of the pensionable salary and ASMI pays
the remaining part.
There are no arrangements regarding early retirement.
OTHER ARRANGEMENTS MANAGEMENT BOARDA number of other arrangements are offered to members of the Management Board, such as expense
and representation allowance, disability insurance, accident insurance and a car allowance/
company car.
ASMI’s policy does not allow personal loans to members of the Management Board.
CONTRACTS OF EMPLOYMENT MANAGEMENT BOARDAll members of the Management Board have a written contract of employment with ASMI or one of its related subsidiaries. The members of the Management Board have been appointed to the Management Board for a four year period:
› C.D. del Prado, started May 18, 2006; in May 2014 Mr. del Prado was reappointed for a new term
of 4 years; and
› P.A.M. van Bommel, started July 1, 2010; in May 2014 Mr. van Bommel was reappointed for a new
term of 4 years.
For future new appointments to the Management Board, the term of the appointment will also be set
at four years.
As is mentioned in the employment agreements of the members of the Management Board, in case
of termination of the employment on behalf of the company, the members of the Management Board
are eligible for a severance payment of maximum one year base salary.
PAY RATIOThe ratio of the CEO remuneration and the average remuneration of all other employees (the
pay ratio) is calculated by dividing the remuneration of the CEO by the average remuneration
of all employees. The remuneration of the CEO is the total of base salary, bonus and share based
payments, as published in Note 24 to the Consolidated financial statement of this report. The average
remuneration of all employees is calculated by dividing the total personnel costs (wage and salaries
and share based payments) as published in Note 21 to the Consolidated financial statement minus
the remuneration of the Management Board, by the total number of employees.
The 2017 CEO pay ratio is 25.
REMUNERATION SUPERVISORY BOARDThe remuneration of the members of the Supervisory Board is not dependent on our financial
results. No member of the Supervisory Board personally maintains a business relationship with ASMI
other than as a member of the Supervisory Board. The Nomination, Selection and Remuneration
(NSR) Committee is responsible for reviewing and, if appropriate, recommending changes to the
remuneration of the Supervisory Board. Any recommended changes to the remuneration of the
members of the Supervisory Board must be submitted to the Annual General Meeting of Shareholders
(AGM) for approval.
The remuneration of the Supervisory Board was approved by the shareholders in the 2011 AGM.
The Supervisory Board’s annual remuneration has been fixed as follows:
(Amount in euros)
BASE REMUNERATION:
Chairman of the Supervisory Board 60,000
Member of the Supervisory Board (other than the Chairman) 45,000
ADDITIONAL REMUNERATION:
Chairman of the Audit Committee 7,500
Member of the Audit Committee (other than the Chairman) 5,000
Chairman of the Nomination, Selection and Remuneration Committee 7,500
Member of the Nomination, Selection and Remuneration Committee (other than the Chairman) 5,000

97ANNUAL REPORT 2017
SHAREHOLDERS & GENERAL INFORMATIONFINANCIAL STATEMENTSGOVERNANCEPERFORMANCE REVIEWSTRATEGY & BUSINESSABOUT
EXTERNAL AUDITORIn accordance with Dutch law, ASMI’s external auditor is appointed by the Annual General Meeting of Shareholders and is nominated for appointment by the Supervisory Board upon advice from the Audit Committee and the Management Board. Our current external auditor, KPMG, was reappointed as external auditor by the 2017 Annual General Meeting of Shareholders (AGM) for the reporting year 2017.
The external auditor is present at our AGM to respond to questions, if any, from the shareholders
about the auditor’s report on the financial statements.
The Audit Committee has determined that the provision of services by KPMG and its member firms
is compatible with maintaining KPMG’s independence. All audit and permitted non-audit services
provided by KPMG and its member firms during 2017 were pre-approved by the Audit Committee.
AUDIT COMMITTEE POLICIES AND PROCEDURESThe Audit Committee has adopted the following policies and procedures for pre-approval of all audit
and permitted non-audit services provided by our external auditor:
AUDIT SERVICESManagement submits to the Audit Committee for pre-approval the scope and estimated fees for
specific services directly related to performing the independent audit of our statutory and consolidated
financial statements for the current year.
AUDIT-RELATED SERVICESThe Audit Committee may pre-approve expenditures up to a specified amount for services included
in identified service categories that are related extensions of audit services and are logically performed
by the auditors. Additional services exceeding the specified pre-approved limits require specific Audit
Committee approval.
TAX SERVICESThe Audit Committee may pre-approve expenditures up to a specified amount per engagement and
in total for identified services related to tax matters. Additional services exceeding the specified pre-
approved limits, or involving service types not included in the pre-approved list, require specific Audit
Committee approval.
OTHER SERVICESIn the case of specified services for which utilizing our external auditor creates efficiencies, minimizes
disruption or preserves confidentiality, or for which management has determined that our external
auditor possesses unique or superior qualifications to provide such services, the Audit Committee
may pre-approve expenditures up to a specified amount per engagement and in total. Additional
services exceeding the specified pre-approved limits, or involving service types not included in the
pre-approved list, require specific Audit Committee approval.

98ANNUAL REPORT 2017
SHAREHOLDERS & GENERAL INFORMATIONFINANCIAL STATEMENTSGOVERNANCEPERFORMANCE REVIEWSTRATEGY & BUSINESSABOUT
CONSOLIDATED FINANCIAL STATEMENTS
> Consolidated statement of profit or loss
> Consolidated statement of comprehensive income
> Consolidated statement of financial position
> Consolidated statement of changes in equity
> Consolidated statement of cash flows
> Notes to the Consolidated financial statements
ASM INTERNATIONAL NV FINANCIAL STATEMENTS
> Company balance sheet
> Company statement of profit or loss
> Notes to the Company financial statements
INDEPENDENT AUDITOR’S REPORT
FINANCIAL STATEMENTS
CHAPTER PREVIEW

99ANNUAL REPORT 2017
CHAPTER PREVIEWIn 2017, our sales increased by 23% to €737 million. We made investments in new areas resulting in new tool wins in our epitaxy and PECVD product lines. While these new tool wins strongly contributed to our sales growth in 2017, the initial costs related to the launch of the new products in epitaxy and PECVD led to a decrease in our gross margin, which dropped from 44.2% to 41.5%. Excluding this impact, our gross margin would have been relatively stable in 2017. Operating expenses remained under control and decreased as a percentage of revenue from 30% to 26%. Operating profit increased 38% with the operating margin improving to 15.3%.
SHAREHOLDER VALUE
During the course of 2017, we reduced our stake in ASMPT in two steps from approximately 39%
to approximately 25%. In April, we sold a 4.9% stake in a partial secondary share placement
for proceeds of approximately €245 million. We used the proceeds for a new €250 million share
buyback program that we started in September. In November, we sold another 9.1% stake in
ASMPT that generated proceeds of approximately €445 million. We announced plans to use
these proceeds for share buybacks and a capital return to our shareholders.
SHAREHOLDERS & GENERAL INFORMATIONFINANCIAL STATEMENTSGOVERNANCEPERFORMANCE REVIEWSTRATEGY & BUSINESSABOUT
CONSOLIDATED FINANCIAL STATEMENTS
> Consolidated statement of profit or loss
> Consolidated statement of comprehensive income
> Consolidated statement of financial position
> Consolidated statement of changes in equity
> Consolidated statement of cash flows
> Notes to the Consolidated financial statements
ASM INTERNATIONAL NV FINANCIAL STATEMENTS
> Company balance sheet
> Company statement of profit or loss
> Notes to the Company financial statements
INDEPENDENT AUDITOR’S REPORT
FINANCIAL STATEMENTS
CHAPTER PREVIEW

100ANNUAL REPORT 2017
SHAREHOLDERS & GENERAL INFORMATIONFINANCIAL STATEMENTSGOVERNANCEPERFORMANCE REVIEWSTRATEGY & BUSINESSABOUT
CONSOLIDATED STATEMENT OF PROFIT OR LOSS YEAR ENDED DECEMBER 31,
(EUR thousand, except per share data) NOTES 2016 2017
Net sales 19 597,930 737,401
Cost of sales (333,430) (431,506)
GROSS PROFIT 19 264,500 305,895
Operating expenses:
Selling, general and administrative 21 (91,130) (99,931)
Research and development 22 (91,129) (92,777)
TOTAL OPERATING EXPENSES (182,259) (192,708)
RESULT FROM OPERATIONS 19 82,241 113,187
Finance income 3,095 1,683
Finance expense (1,096) (1,799)
Foreign currency exchange gain (loss), net 13,032 (30,546)
Share in income of investments in associates 6 40,488 89,614
Result from sale of ASMPT shares 6 – 284,898
RESULT BEFORE INCOME TAXES 137,760 457,037
Income taxes 20 (2,289) (4,635)
NET EARNINGS FROM OPERATIONS, ATTRIBUTABLE TO COMMON SHAREHOLDERS 135,471 452,402
Per share data 23
Basic net earnings per share (EUR):
FROM OPERATIONS 2.23 7.72
Diluted net earnings per share (EUR):
FROM OPERATIONS 2.21 7.63
Weighted average number of shares (thousand):
Basic 60,616 58,573
Diluted 61,253 59,325
CONSOLIDATED FINANCIAL STATEMENTS

101ANNUAL REPORT 2017
SHAREHOLDERS & GENERAL INFORMATIONFINANCIAL STATEMENTSGOVERNANCEPERFORMANCE REVIEWSTRATEGY & BUSINESSABOUT
CONSOLIDATED STATEMENT OF COMPREHENSIVE INCOME YEAR ENDED DECEMBER 31,
(EUR thousand) NOTES 2016 2017
NET EARNINGS FROM OPERATIONS, ATTRIBUTABLE TO COMMON SHAREHOLDERS 135,471 452,402
Other comprehensive income, net of income tax
Items that will not be reclassified subsequently to profit or loss:
Remeasurement of defined benefit obligation – (261)
Share of other comprehensive income (loss) investments in associates 6 (1,344) (2,580)
(1,344) (2,841)
Items that may be subsequently reclassified to profit or loss:
Foreign currency translation effect 40,069 (172,893)
40,069 (172,893)
OTHER COMPREHENSIVE INCOME FOR THE YEAR, NET OF INCOME TAX 38,725 (175,734)
TOTAL COMPREHENSIVE INCOME, ATTRIBUTABLE TO COMMON SHAREHOLDERS 11 174,196 276,668

102ANNUAL REPORT 2017
SHAREHOLDERS & GENERAL INFORMATIONFINANCIAL STATEMENTSGOVERNANCEPERFORMANCE REVIEWSTRATEGY & BUSINESSABOUT
CONSOLIDATED STATEMENT OF FINANCIAL POSITION DECEMBER 31,
(EUR thousand) NOTES 2016 2017
Assets
Property, plant and equipment 3 95,004 106,632
Goodwill 4 11,270 11,270
Other intangible assets 5 100,179 113,295
Investments in associates 6 1,218,024 730,552
Deferred tax assets 20 13,919 18,116
Other non-current assets 4,824 4,845
Evaluation tools at customers 7 36,594 29,710
TOTAL NON-CURRENT ASSETS 1,479,814 1,014,420
Inventories 8 112,339 142,849
Accounts receivable 9 137,020 163,135
Income taxes receivable 20 370 1,272
Other current assets 28 22,849 19,065
Cash and cash equivalents 10 378,157 836,461
TOTAL CURRENT ASSETS 650,735 1,162,782
TOTAL ASSETS 2,130,549 2,177,202
Equity and liabilities
EQUITY 11 1,998,142 2,011,512
Pension liabilities 12 1,418 386
Deferred tax liabilities 20 13,118 13,864
TOTAL NON-CURRENT LIABILITIES 14,536 14,250
Accounts payable 60,910 79,349
Provision for warranty 13 5,800 6,562
Income taxes payable 20 2,467 6,575
Accrued expenses and other payables 14 48,694 58,954
TOTAL CURRENT LIABILITIES 117,871 151,440
TOTAL LIABILITIES 132,407 165,690
TOTAL EQUITY AND LIABILITIES 2,130,549 2,177,202

103ANNUAL REPORT 2017
SHAREHOLDERS & GENERAL INFORMATIONFINANCIAL STATEMENTSGOVERNANCEPERFORMANCE REVIEWSTRATEGY & BUSINESSABOUT
CONSOLIDATED STATEMENT OF CHANGES IN EQUITY(EUR thousand except for share data) NOTES
NUMBER OF COMMON SHARES
OUTSTANDINGCOMMON
SHARESCAPITAL IN EXCESS
OF PAR VALUETREASURY
SHARES AT COSTRETAINED
EARNINGSOTHER
RESERVES 1)
TOTAL EQUITY
BALANCE AS OF JANUARY 1, 2016 61,706,387 2,552 221,868 (84,000) 1,606,666 190,763 1,937,849
Net earnings – – – – 135,471 – 135,471
Other comprehensive income 11 – – – – – 38,725 38,725
TOTAL COMPREHENSIVE INCOME (LOSS) – – – – 135,471 38,725 174,196
Dividend paid to common shareholders – – – – (42,673) – (42,673)
Compensation expense share-based payments 12 – – 8,387 – – – 8,387
Exercise stock options out of treasury shares 720,572 – (2,591) 27,836 (10,536) – 14,709
Vesting restricted shares out of treasury shares 12 55,041 – (1,827) 1,827 – – –
Purchase of common shares 11 (2,666,157) – – (97,140) – – (97,140)
Other movements in investments in associates:
Dilution 6 – – – – 2,814 – 2,814
BALANCE AS OF DECEMBER 31, 2016 59,815,843 2,552 225,837 (151,477) 1,691,742 229,488 1,998,142
Net earnings – – – – 452,402 – 452,402
Other comprehensive income 11 – – – – – (175,734) (175,734)
TOTAL COMPREHENSIVE INCOME (LOSS) – – – – 452,402 (175,734) 276,668
Dividend paid to common shareholders – – – – (41,470) – (41,470)
Compensation expense share-based payments 12 – – 7,801 – – – 7,801
Exercise stock options out of treasury shares 12 626,939 – (10,612) 23,904 – – 13,292
Vesting restricted shares out of treasury shares 12 118,317 – (4,501) 4,501 – – –
Purchase of common shares 11 (4,420,946) – – (243,527) – – (243,527)
Cancellation of common shares out of treasury shares 11 – (60) – 61,945 (61,885) – –
Other movements in investments in associates:
Dilution 6 – – – – 606 – 606
BALANCE AS OF DECEMBER 31, 2017 56,140,153 2,492 218,525 (304,654) 2,041,395 53,754 2,011,5121 Other reserves consist of the currency translation reserve, remeasurement on net defined benefit and the reserve for proportionate share in other comprehensive income investments in associates. See Note 11.

104ANNUAL REPORT 2017
SHAREHOLDERS & GENERAL INFORMATIONFINANCIAL STATEMENTSGOVERNANCEPERFORMANCE REVIEWSTRATEGY & BUSINESSABOUT
CONSOLIDATED STATEMENT OF CASH FLOWS YEAR ENDED DECEMBER 31,
(EUR thousand) NOTES 2016 2017
Cash flows from operating activitiesNet earnings from operations 135,471 452,402Adjustments to reconcile net earnings to net cash from operating activitiesDepreciation, amortization and impairments 3,5,7 51,690 52,097Share-based compensation 12 8,387 7,801Non-cash financing costs (2,483) 29,609Share in income of investments in associates 6 (40,488) (89,614)Gain on sale of ASMPT shares 6 – (284,898)Income tax 2,289 4,635Changes in assets and liabilitiesAccounts receivable (43,352) (37,930)Inventories (9,510) (45,161)Other current assets (10,212) 2,540Accounts payable and accrued expenses 7,045 28,449Income tax paid (7,425) (3,870)NET CASH FROM OPERATING ACTIVITIES 91,412 116,060
Cash flows from investing activitiesCapital expenditures 3 (26,890) (44,171)Proceeds from sale of property, plant and equipment 3 1,147 823Capitalized development expenditure 5 (27,327) (38,615)Purchase of intangible assets 5 (7,024) (2,393)Dividend received from associates 6 22,083 36,458Proceeds from sale of ASMPT shares 6 – 690,660NET CASH FROM IN INVESTING ACTIVITIES (38,011) 642,762
Cash flows from financing activitiesDebt issuance fees paid (810) (132)Purchase of treasury shares ASMI 11 (97,024) (239,555)Proceeds from issuance of treasury shares 12 14,709 13,292Dividends to common shareholders of ASMI (42,673) (41,470)NET CASH USED IN FINANCING ACTIVITIES (125,798) (267,865)
FOREIGN CURRENCY TRANSLATION EFFECT ON CASH AND CASH EQUIVALENTS 3,639 (32,653)
NET INCREASE / (DECREASE) IN CASH AND CASH EQUIVALENTS (68,758) 458,304Cash and cash equivalents at beginning of year 10 446,915 378,157
CASH AND CASH EQUIVALENTS AT END OF YEAR 10 378,157 836,461

105ANNUAL REPORT 2017
SHAREHOLDERS & GENERAL INFORMATIONFINANCIAL STATEMENTSGOVERNANCEPERFORMANCE REVIEWSTRATEGY & BUSINESSABOUT
NOTES TO THE CONSOLIDATED FINANCIAL STATEMENTSNOTE 1. GENERAL INFORMATION/SUMMARY OF SIGNIFICANT ACCOUNTING POLICIES
GENERAL INFORMATIONASM International NV (ASMI, or the Company) is a Dutch public liability company domiciled
in the Netherlands with its principal operations in Europe, the United States of America, and Asia.
The Company dedicates its resources to the research, development, manufacturing, marketing and
servicing of equipment and materials used to produce mainly semiconductor devices. The Company
is registered at Versterkerstraat 8, 1322 AP Almere, the Netherlands.
The Company’s shares are listed for trading on the Euronext Amsterdam Stock Exchange
(symbol ASM).
The accompanying Consolidated financial statements include the financial statements of ASM
International NV, and its consolidated subsidiaries (together referred to as ASMI, or the Company).
ASMI’s subsidiaries are listed in Note 2 and associates are listed in Note 6.
BASIS FOR ACCOUNTINGThe consolidated financial statements for the year ended December 31, 2017 have been prepared
in accordance with International Financial Reporting Standards (IFRS) as adopted by the European
Union and also comply with the financial reporting requirements included in Section 362(9) of Part 9,
Book 2 of the Dutch Civil Code.
The financial statements have been prepared by the Management Board of the Company and
authorized for issue on March 16, 2018 and will be submitted for adoption to the Annual General
Meeting of Shareholders (AGM) on May 28, 2018.
The financial statements will be filed at the Trade Register of the Chamber of Commerce in Almere,
the Netherlands within eight days of adoption by the 2018 AGM.
FUNCTIONAL AND PRESENTATION CURRENCYThe accompanying Consolidated financial statements are presented in Euro (EUR), which is the
Company’s functional currency. All amounts have been rounded to the nearest thousand, unless
otherwise indicated.
BASIS OF PREPARATIONThe Consolidated financial statements have been prepared under the historical cost convention,
unless otherwise indicated. The Company applies the going concern basis in preparing its
financial statements.
Historical cost is generally based on the fair value of the consideration given in exchange for goods
and services.
A number of the Company’s accounting policies and disclosures require the measurement of fair
values, for both financial and non-financial assets and liabilities.
Fair value is the price that would be received to sell an asset or paid to transfer a liability in an orderly
transaction between market participants at the measurement date, regardless of whether that price
is directly observable or estimated using another valuation technique.
The Company has an established approach with respect to the measurement of fair values. If third-
party information, such as broker quotes or pricing services, is used to measure fair values, the
Company assesses and documents the evidence obtained from the third parties to support the
conclusion that such valuations meet the requirements of IFRS, including the level in the fair value
hierarchy in which such valuations should be classified.
Fair values are categorized into different levels in a fair value hierarchy based on the inputs used in the
valuation techniques as follows:
Level 1: quoted prices (unadjusted) in active markets for identical assets or liabilities.
Level 2: inputs other than quoted prices included in Level 1 that are observable for the asset or liability,
either directly (i.e. as prices) or indirectly (i.e. derived from prices).
Level 3: inputs for the asset or liability that are not based on observable market data
(unobservable inputs).

106ANNUAL REPORT 2017
SHAREHOLDERS & GENERAL INFORMATIONFINANCIAL STATEMENTSGOVERNANCEPERFORMANCE REVIEWSTRATEGY & BUSINESSABOUT
If the inputs used to measure the fair value of an asset or a liability fall into different levels of the fair
value hierarchy, then the fair value measurement is categorized in its entirety in the same level of the
fair value hierarchy as the lowest level input that is significant to the entire measurement.
Further information about the assumptions made in measuring fair values is included in the following Notes:
› Note 12 – Employee benefits; and
› Note 16 – Financial instruments and financial risk management.
USE OF ESTIMATES AND JUDGMENTSIn preparing these Consolidated financial statements, management has made judgments, estimates
and assumptions about the carrying amounts of assets and liabilities that are not readily apparent
from other sources. The estimates and associated assumptions are based on historical experience
and other factors that are considered to be relevant. Actual results may differ from these estimates.
Estimates and underlying assumptions are reviewed on an ongoing basis. Revisions to estimates are
recognised prospectively.
Information about assumptions and estimation uncertainties that have a significant risk of resulting in a material adjustment to the carrying amounts of assets and liabilities within the year ended December 31, 2017 is included in the following Notes:
› Notes 3, 4, 5, 6 and 7 – Valuation of non-financial assets; and
› Note 20 – Valuation of deferred tax assets.
CRITICAL ACCOUNTING POLICIESA critical accounting policy is defined as one that is both material to the presentation
of ASMI’s Consolidated financial statements and that requires management to make difficult,
subjective or complex judgments that could have a material effect on ASMI’s financial condition
or results of operations. Specifically, these policies have the following attributes: (1) ASMI is required
to make assumptions about matters that are highly uncertain at the time of the estimate; and
(2) different estimates ASMI could reasonably have used, or changes in the estimate that are
reasonably likely to occur, could have a material effect on ASMI’s financial condition or results
of operations.
Estimates and assumptions about future events and their effects cannot be determined with
certainty. ASMI bases its estimates on historical experience and on various other assumptions
believed to be applicable and reasonable under the circumstances. These estimates may change
as new events occur, as additional information is obtained, and as ASMI’s operating environment
changes. These changes have historically been minor and have been included in the consolidated
financial statements as soon as they became known. In addition, management is periodically
faced with uncertainties, the outcomes of which are not within its control and will not be known
for prolonged periods of time. Based on a critical assessment of its accounting policies and the
underlying judgments and uncertainties affecting the application of those policies, management
believes that ASMI’s Consolidated financial statements are fairly stated in accordance with IFRS, and
provide a meaningful presentation of ASMI’s financial condition and results of operations. An analysis
of specific sensitivity to changes of estimates and assumptions is included in the Notes to the
financial statement.
Management believes that the following accounting policies are critical:
› revenue recognition;
› inventories;
› evaluation of long-lived assets for impairment;
› evaluation of investments in associates for impairment;
› intangible assets; and
› income taxes.
CHANGES IN ACCOUNTING POLICIESThe Company adopted new and/or revised standards and interpretations that came into effect from
January 1, 2017. The initial application of those standards and interpretations does not have any
material impact on the Consolidated financial statements.
SIGNIFICANT ACCOUNTING POLICIESThe Company has consistently applied the following accounting policies to all periods presented
in these Consolidated financial statements.
ConsolidationThe Consolidated financial statements include the accounts of ASMI and all of its subsidiaries where
ASMI holds a controlling interest. Non-controlling interest is disclosed separately, where appropriate,
in the Consolidated financial statements.
Control is achieved when ASMI has:
› the power over an investee;
› exposure, or rights, to variable returns from its involvement with the investee; and
› the ability to use its power over the investee to affect the amount of the investor’s returns.

107ANNUAL REPORT 2017
SHAREHOLDERS & GENERAL INFORMATIONFINANCIAL STATEMENTSGOVERNANCEPERFORMANCE REVIEWSTRATEGY & BUSINESSABOUT
ASMI reassesses whether or not it controls an investee if facts and circumstances indicate that there
are changes to one or more of the three elements of control listed above.
As from the date these criteria are met, financial data of the relevant subsidiary are included in the
consolidation and deconsolidated from the date on which ASMI’s control ceases.
Loss of controlUpon loss of control, ASMI derecognizes the assets and liabilities of the subsidiary. Any surplus
or deficit arising on the loss of control is recognized in profit or loss. If ASMI retains any interest
in this subsidiary, then such interest is measured at fair value at the date on which control is lost.
Subsequently, it is accounted for as an equity-accounted investee or as an available-for-sale financial
asset, depending on the level of influence retained.
SubsidiariesSubsidiaries are entities controlled by the Company. The financial statements of subsidiaries are
included in the Consolidated financial statements from the date on which control commences until
the date on which control ceases.
Interests in equity-accounted investeesThe Company’s interests in equity-accounted investees comprise investments in associates.
Associates are those entities in which the Company has significant influence, but not control or joint
control, over the financial and operating policies.
Interests in associates are accounted for using the equity method. They are initially recognized
at cost, which includes transaction costs. Upon acquisition of the investment in an associate, any
excess of the cost of the investment over the Company’s share of the net fair value of the identifiable
assets and liabilities of the investee is recognized as goodwill, which is included in the carrying
amount of the investment.
Subsequent to initial recognition, the consolidated financial statements include the Company’s share
of the profit or loss and other comprehensive income (OCI) of equity-accounted investees, until the
date on which significant influence ceases.
Transactions eliminated on consolidationIntra-group balances and transactions, and any unrealized income and expenses arising from intra-
group transactions, are eliminated. Unrealized gains arising from transactions with equity-accounted
investees are eliminated against the investment to the extent of the Company’s interest in the
investee. Unrealized losses are eliminated in the same way as unrealized gains, but only to the extent
that there is no evidence of impairment.
Foreign currency translationThe individual financial statements of each group entity are presented in their local functional currency.
For the purpose of the Consolidated financial statements, the results and financial position of each
entity is expressed in euros, which is ASMI’s functional currency and the presentation currency for the
Consolidated financial statements.
Foreign currency transactionsIn preparing the financial statements of the individual entities, transactions in foreign currencies
are recorded at the exchange rates on the date of the transactions. At each balance sheet date,
monetary items denominated in foreign currencies are translated at the rates prevailing on the balance
sheet date. Non-monetary items carried at fair value that are denominated in foreign currencies are
translated at the rates prevailing on the date when the fair value was determined.
Exchange rate differences arising on the settlement of monetary items, and on the translation
of monetary items, are recognized in the Consolidated Statement of Profit or Loss in the period
in which they arise. Exchange rate differences arising on the translation of non-monetary items
carried at fair value are recognized in the Consolidated Statement of Profit or Loss for the period
except for differences arising on the translation of non-monetary items in respect of which gains and
losses are recognized directly in equity.
Foreign operationsFor the purpose of presenting Consolidated financial statements, assets and liabilities of foreign
operations are translated into euro at the exchange rates at the reporting date. The income and
expenses of foreign operations are translated into euro at the exchange rates at the dates
of the transactions.
Foreign currency differences are recognized in OCI and accumulated in the translation reserve,
except to the extent that the translation difference is allocated to non-controlling interest.
When a foreign operation is disposed of in its entirety or partially such that control or significant
influence is lost, the cumulative amount in the translation reserve related to that foreign operation
is reclassified to profit or loss as part of the gain or loss on disposal. If the Company disposes of part
of its interest in a subsidiary but retains control, then the relevant proportion of the cumulative amount

108ANNUAL REPORT 2017
SHAREHOLDERS & GENERAL INFORMATIONFINANCIAL STATEMENTSGOVERNANCEPERFORMANCE REVIEWSTRATEGY & BUSINESSABOUT
is reattributed to non-controlling interest. When the Company disposes of only part of an associate
while retaining significant influence, the relevant proportion of the cumulative amount is reclassified
to profit or loss.
Segment reportingThe Back-end segment is still reported as a separate segment after the Company ceased control
on March 15, 2013, since the full results of the Back-end segment are continued to be reviewed
by our Chief Operating Decision Maker (CODM).
The Company organizes its activities in two operating segments, Front-end and Back-end.
Operating segments are reported in a manner consistent with the internal reporting provided
to the Chief Executive Officer (CEO), which is the CODM. Operating segments are in line with the
reporting segments.
Accordingly, the asset and profit or loss information regarding the operations that comprise the
segment are disclosed. The full financial results are reviewed by the CODM, the external reporting
of the segment is on an equity method investment basis. The total of all segments’ financial amounts
are reconciled to the corresponding amounts reported in the Consolidated financial statements,
eliminations are reflected in the reconciling column for amounts reported in excess of those amounts
reflected in the Consolidated financial statements.
The Front-end segment manufactures and sells equipment used in wafer processing, encompassing
the fabrication steps in which silicon wafers are layered with semiconductor devices. The segment
is a product driven organizational unit comprised of manufacturing, service, and sales operations
in Europe, the United States, Japan, South Korea and Southeast Asia.
The Back-end segment manufactures and sells equipment and materials used in assembly and
packaging, encompassing the processes in which silicon wafers are separated into individual circuits
and subsequently assembled, packaged and tested. The segment is organized in ASM Pacific
Technology Ltd, in which the Company holds a 25.18% interest, whilst the remaining shares are
listed on the Stock Exchange of Hong Kong.
Property, plant and equipmentItems of property, plant and equipment are measured at cost, which includes capitalized borrowing
costs, less accumulated depreciation and any accumulated impairment losses.
If significant parts of an item of property, plant and equipment have different useful lives, then they are
accounted for as separate items (major components) of property, plant and equipment.
Depreciation is calculated to write off the cost of items of property, plant and equipment less their
estimated residual values using the straight-line method over their estimated useful lives, and
is generally recognized in profit or loss. The estimated useful lives, residual values and depreciation
method are reviewed at the end of each reporting period, with the effect of any changes in estimate
accounted for on a prospective basis.
The estimated useful lives of property, plant and equipment for current and comparative periods are
as follows:
Land, building and leasehold improvements 0-25 years
Machinery equipment 2-10 years
Furniture and fixtures and other equipment 2-10 years
An item of property, plant and equipment is recognized upon disposal or when no future economic
benefits are expected to arise from the continued use of the asset. Any gain or loss on disposal of an
item of property, plant and equipment is recognized in profit or loss.
Intangible assets
GoodwillThe Company accounts for business combinations using the acquisition method when control
is transferred to the Company. The consideration transferred in the acquisition is generally measured
at fair value, as are the identifiable net assets acquired. Any goodwill that arises is tested annually for
impairment. Transaction costs are expensed as incurred.
Goodwill represents the excess of the costs of an acquisition over the fair value of the amounts
assigned to assets acquired and liabilities incurred or assumed of the acquired subsidiary at the date
of acquisition. Goodwill on acquisition of subsidiaries is allocated to cash generating units (CGUs) for
the purpose of impairment testing. The allocation is made to those CGUs that are expected to benefit
from the business combination in which the goodwill arose. Goodwill is tested for impairment annually
and whenever events or changes in circumstances indicate that the carrying amount of the goodwill
may not be recoverable. If the recoverable amount of the CGU is less than the carrying amount of the
unit, the impairment loss is recognized. An impairment loss recognized for goodwill is not reversed
in a subsequent period. Goodwill is stated at cost less accumulated impairment losses.

109ANNUAL REPORT 2017
SHAREHOLDERS & GENERAL INFORMATIONFINANCIAL STATEMENTSGOVERNANCEPERFORMANCE REVIEWSTRATEGY & BUSINESSABOUT
The Company’s policy for goodwill arising on the acquisition of an associate is described in Note 6
‘Investments in Associates’.
Other intangible assetsOther intangible assets include capitalized development expenses, software, purchased technology
and remaining other intangible assets. Other intangible assets that are acquired by the Company
with finite useful lives are measured at cost less accumulated amortization and any accumulated
impairment losses.
Expenditure on research activities is recognized in profit or loss as incurred.
In determining the capitalization of development expenses, the Company makes estimates and
assumptions based on expected future economic benefits generated by products that are the result
of these development expenses. Other important estimates and assumptions are the required internal
rate of return, the distinction between research, development and high-volume manufacturing and
the estimated useful life.
Development expenses are capitalized when all of the following criteria are demonstrated:
› the technical feasibility of completing the intangible asset so that it will be available for use or sale;
› its intention to complete the intangible asset and use or sell it;
› its ability to use or sell the intangible asset;
› how the intangible asset will generate probable future economic benefits;
› the availability of adequate technical, financial and other resources to complete the development
and to use or sell the intangible asset; and
› its ability to reliably measure the expenditure attributable to the intangible asset during its
development.
The Company capitalizes development expenses that meet the above-mentioned criteria in its
Consolidated financial statements. Subsequent to initial recognition, internally-generated intangible
assets are reported at cost less accumulated amortization and accumulated impairment losses,
on the same basis as intangible assets that are acquired separately.
Amortization of capitalized development expenses is calculated using the straight-line method over
the estimated useful lives of the developed product. Amortization starts when the developed product
is transferred to high-volume manufacturing.
Amortization method, useful life and residual value are reviewed at each reporting date and adjusted
if appropriate.
The estimated useful lives of other intangible assets for current and comparative periods are
as follows:
Development cost 5 years
Software 3 years
Purchased technology and other intangible assets 5-7 years
Investments in associatesInvestments in associates are investments in entities in which ASMI can exert significant influence
but which ASMI does not control, generally having between 20% and 50% of the voting rights.
These entities are accounted for using the equity method and are initially recognized at cost.
Dividend income from the Company’s associated companies is recognized when the right to receive
payment is established. Their carrying value includes goodwill identified upon acquisition, net of any
accumulated impairment.
When ASMI’s share of losses in an associate equals or exceeds its interest in the associate, including
any other receivables for which settlement is neither planned nor likely to occur in the foreseeable
future, ASMI does not recognize further losses, unless ASMI has obligations to or made payments
on behalf of the associate.
At each reporting date, the Company determines if there is any objective evidence that the associate
is impaired. An impairment, being the difference between the recoverable amount of the associate
and its carrying value, is recognized in the Consolidated statement of profit or loss.
ASMI does not separately test associates’ underlying assets for impairment. However, ASMI
recognizes its share of any impairment charge recorded by an investee and considers the effect,
if any, of the impairment on the basis difference in the assets giving rise to the investee’s impairment
charge. A loss in value of an investment which is significant or prolonged will be recognized.
Significant is defined as at least 20% over an uninterrupted period of nine months, or more than 40%
on the reporting date. Prolonged is defined as measured below cost for more than a year.
Equity method investments are tested for prolonged decline in value. If the fair value of an investment
is less than its carrying value, the Company determines whether the decline in value is temporary
or prolonged. A prolonged decline in value is measured as of a balance sheet date. If after a prior

110ANNUAL REPORT 2017
SHAREHOLDERS & GENERAL INFORMATIONFINANCIAL STATEMENTSGOVERNANCEPERFORMANCE REVIEWSTRATEGY & BUSINESSABOUT
recognized impairment the fair value is more than its carrying value, this impairment is reversed. The
determination of whether an investment is impaired is made at the individual security level in each
reporting period.
Evaluation tools at customersEvaluation tools at customers are systems generally delivered to customers under evaluation and
include substantial customization by our engineers and R&D staff in the field. Evaluation tools are
recorded at cost and depreciated using the straight-line method over their estimated useful life of five
years, or their shorter economic life. The depreciation expenses are reported as cost of sales.
On final acceptance from the customer, the purchase consideration is recognized as revenue and
the carrying value of the evaluation system is recognized as cost of sales. In the circumstance that
the system is returned, at the end of the evaluation period, a detailed impairment review takes place,
and future sales opportunities and additional costs are identified. It is only when the fair value is below
the carrying value of the evaluation tool that an additional depreciation is recognized. The remaining
carrying value is recognized as finished goods (inventory).
InventoriesInventories are stated at the lower of cost or net realizable value. Costs include net prices paid for
materials purchased, charges for freight and custom duties, production labor costs and factory
overhead. Allowances are made for slow-moving, obsolete or unsellable inventory.
Allowances for obsolescence of inventory are determined based on the expected demand as well
as the expected market value of the inventory. We regularly evaluate the value of our inventory
of components and raw materials, work in progress and finished goods, based on a combination
of factors including the following: forecasted sales, historical usage, product end of life cycle,
estimated current and future market values, service inventory requirements and new product
introductions, as well as other factors. Purchasing requirements and alternative uses for the inventory
are explored within these processes to mitigate inventory exposure. We record write-downs for
inventory based on the above factors and take into account worldwide quantities and demand into
our analysis.
Financial instrumentsThe Company classifies non-derivative financial assets into loans and receivables. The Company
classifies non-derivative financial liabilities into other financial liabilities.
Non-derivative financial assets and financial liabilities – Recognition and derecognitionThe Company initially recognizes receivables on the date when they are originated. Receivables
comprise account (trade) and other receivables and cash and cash equivalents. Receivables are
measured at amortized cost using the effective interest method, less any impairment. Financial assets
and financial liabilities are initially recognized on the trade date when the entity becomes a party
to the contractual provisions of the instrument.
The Company derecognizes a financial asset when the contractual rights to the cash flows from the
asset expire, or it transfers the rights to receive the contractual cash flows in a transaction in which
substantially all of the risks and rewards of ownership of the financial asset are transferred, or it
neither transfers nor retains substantially all of the risks and rewards of ownership and does not retain
control over the transferred asset. Any interest in such derecognizes a financial asset that is created
or retained by the Company is recognized as a separate asset or liability.
The Company derecognizes a financial liability when its contractual obligations are discharged
or cancelled, or expired.
Financial assets and financial liabilities are offset and the net amount presented in the statement
of financial position when, and only when, the Company currently has a legally enforceable right
to offset the amounts and intends either to settle them on a net basis or to realize the asset and settle
the liability simultaneously.
Non-derivative financial assets – MeasurementLoans and receivables are initially measured at fair value plus any directly attributable transaction
costs. Subsequent to initial recognition, they are measured at amortized cost using the effective
interest method.
Account receivableA significant percentage of our accounts receivable is derived from sales to a limited number
of large multinational semiconductor device manufacturers located throughout the world. In order
to monitor potential credit losses, we perform ongoing credit evaluations of our customers’ financial
condition. An allowance for doubtful accounts is maintained for potential credit losses based upon
management’s assessment of the expected collectability of all accounts receivable. The allowance
for doubtful accounts is reviewed periodically to assess the adequacy of the allowance. In making
this assessment, management takes into consideration any circumstances of which we are aware

111ANNUAL REPORT 2017
SHAREHOLDERS & GENERAL INFORMATIONFINANCIAL STATEMENTSGOVERNANCEPERFORMANCE REVIEWSTRATEGY & BUSINESSABOUT
regarding a customer’s inability to meet its financial obligations; and our judgments as to potential
prevailing economic conditions in the industry and their potential impact on the Company’s customers.
The allowance is based on historical experience, credit evaluations, specific customer collection
history and any customer-specific issues ASMI has identified. Changes in circumstances, such as an
unexpected adverse material change in a major customer’s ability to meet its financial obligation
to ASMI or its payment trends, may require us to further adjust our estimates of the recoverability
of amounts due to ASMI, which could have an adverse material effect on ASMI’s financial condition
and results of operations.
Cash and cash equivalentsCash and cash equivalents consist of deposits held at call with banks, investments in money
market funds that invest in debt securities of financial institutions and other short-term highly liquid
investments with original maturity of three months or less. Bank overdrafts are included in notes
payable to banks in current liabilities.
Non-derivative financial liabilities – MeasurementOther non-derivative financial liabilities are initially measured at fair value less any directly attributable
transaction costs. Subsequent to initial recognition, these liabilities are measured at amortized cost
using the effective interest method.
Share capital
Ordinary sharesOrdinary shares are classified as equity. Incremental costs directly attributable to the issue of ordinary
shares are recognized as a deduction from equity, net of any tax effects.
Preference share capitalPreference share capital is classified as equity if it is non-redeemable, or redeemable only
at the Company’s option, and any dividends are discretionary. Discretionary dividends thereon are
recognized as distributions within equity upon approval by the Company’s shareholders.
Preference share capital is classified as a financial liability if it is redeemable on a specific date
or at the option of the shareholders, or if dividend payments are not discretionary. Non-discretionary
dividends thereon are recognized as interest expense in profit or loss as accrued.
Repurchase and reissue of ordinary shares (treasury shares)When shares recognized as equity are repurchased, the amount of the consideration paid, which
includes directly attributable costs, is recognized as a deduction from equity. Repurchased shares are
classified as treasury shares and are presented in the treasury share reserve. When treasury shares
are sold or reissued subsequently, the amount received is recognized as an increase in equity and
the resulting surplus or deficit on the transaction is presented in a non-distributable capital reserve.
Issuance of shares by an equity accounted investeeThe associate ASMPT yearly issues common shares pursuant to their employee share incentive
scheme. The effect of these issuances is a dilution of the Company’s ownership in ASMPT.
The Company recognizes the impact of these issuances directly into equity.
Comprehensive incomeComprehensive income consists of net earnings (loss) and other comprehensive income. Other
comprehensive income includes gains and losses that are not included in net earnings, but are
recorded directly in equity.
ProvisionsProvisions are recognized when the Group has a present obligation (legal or constructive) as a result
of a past event, it is probable that the Group will be required to settle the obligation, and a reliable
estimate can be made of the amount of the obligation.
Provisions are determined by discounting the expected future cash flows at a pre-tax rate that
reflects current market assessments of the time value of money and the risks specific to the liability.
The unwinding of the discount is recognized as finance cost.
Impairment
Non-derivative financial assetsFinancial assets not classified as at fair value through profit or loss, including an interest in an equity-
accounted investee, are assessed at each reporting date to determine whether there is objective
evidence of impairment.
Objective evidence that financial assets are impaired includes, default or delinquency by a debtor,
restructuring of an amount due to the Company on terms that the Company would not consider
otherwise, indications that a debtor or issuer will enter bankruptcy, adverse changes in the payment
status of borrowers or issuers, the disappearance of an active market for a security because

112ANNUAL REPORT 2017
SHAREHOLDERS & GENERAL INFORMATIONFINANCIAL STATEMENTSGOVERNANCEPERFORMANCE REVIEWSTRATEGY & BUSINESSABOUT
of financial difficulties, or observable data indicating that there is a measurable decrease in the
expected cash flows from a group of financial assets.
Loans and receivablesThe Company considers evidence of impairment for these assets at both an individual asset and
a collective level. All individually significant assets are individually assessed for impairment. Those
found not to be impaired are then collectively assessed for any impairment that has been incurred
but not yet individually identified.
The impairment method for account receivables is described at Note 9 Accounts Receivable.
Equity-accounted investeesAn impairment loss in respect of an equity-accounted investee is measured by comparing the
recoverable amount of the investment with its carrying amount. An impairment loss is recognized
in profit or loss, and is reversed if there has been a favorable change in the estimates used
to determine the recoverable amount.
Non-financial assetsAt each reporting date, the Company reviews the carrying amounts of its non-financial assets (other
than biological assets, investment property, inventories and deferred tax assets) to determine whether
there is any indication of impairment. If any such indication exists, then the asset’s recoverable
amount is estimated. Goodwill is tested annually for impairment.
For impairment testing, assets are grouped together into the smallest group of assets that generates
cash inflows from continuing use that are largely independent of the cash inflows of other assets
or CGUs. Goodwill arising from a business combination is allocated to CGUs or groups of CGUs that
are expected to benefit from the synergies of the combination.
The recoverable amount of an asset or CGU is the greater of its value in use and its fair value less
costs to sell. Value in use is based on the estimated future cash flows, discounted to their present
value using a pre-tax discount rate that reflects current market assessments of the time value
of money and the risks specific to the asset or CGU.
An impairment loss is recognized if the carrying amount of an asset or CGU exceeds its
recoverable amount.
Impairment losses are recognized in profit or loss. They are allocated first to reduce the carrying
amount of any goodwill allocated to the CGU, and then to reduce the carrying amounts of the other
assets in the CGU on a pro rata basis.
An impairment loss in respect of goodwill is not reversed. For other assets, an impairment loss
is reversed only to the extent that the asset’s carrying amount does not exceed the carrying amount
that would have been determined, net of depreciation or amortization, if no impairment loss had
been recognized.
Commitments and contingenciesThe Company has various contractual obligations such as operating lease commitments, purchase
commitments and commitments for capital expenditure. These obligations are generally not
recognized as liabilities on the Company’s statement of financial position but are disclosed in the
Notes to the financial statements.
Revenue recognitionRevenue is measured at the fair value of the consideration received or receivable. Revenue is reduced
for estimated customer returns, rebates and other similar allowances.
The Company’s revenue includes revenue from contractual arrangements consisting of multiple
deliverables, such as equipment and installation. The revenue for the total transaction is first
allocated to its components, based on their relative selling prices. Then the revenue allocated to the
undelivered component is deferred. The revenue from the undelivered element of the arrangement
is deferred at the relative selling price until delivery of the element.
The Company’s sales frequently involve complex equipment, which may include customer-specific
criteria, sales to new customers or equipment with new technology. For each sale, the decision
whether to recognize revenue is, in addition to shipment and factory acceptance, based on the
contractual agreement with a customer, the experience with a particular customer, the technology
and the number of similarly configured equipment previously delivered. Instead of recognizing
revenue, the Company could decide to defer revenue recognition until completion of installation
at the customer’s site and obtaining final acceptance from the customer.
A major portion of our revenue is derived from contractual arrangements with customers that have
multiple deliverables, such as installation. The revenue relating to the undelivered elements of the
arrangements, the installation, is deferred until delivery of these elements.

113ANNUAL REPORT 2017
SHAREHOLDERS & GENERAL INFORMATIONFINANCIAL STATEMENTSGOVERNANCEPERFORMANCE REVIEWSTRATEGY & BUSINESSABOUT
Sale of goodsThe Company recognizes revenue when persuasive evidence exists, usually in the form of an arrangement, that the goods are delivered and titles have passed, at which time all the following conditions are satisfied:
› significant risks and rewards of ownership have been transferred to the buyer;
› there is neither continuing managerial involvement with the goods sold, nor effective control over
the goods sold;
› the amount of the revenue can be measured reliably;
› it is probable that the economic benefits associated with the transaction will flow to the Group;
› seller’s price to buyer is fixed or determinable;
› collectability is reasonably assured; and
› the cost incurred or to be incurred in respect of the transaction can be measured reliably.
In general, the Company recognizes revenue from sales of equipment upon shipment of equipment,
only if testing at the factory has proved that the equipment has met substantially all of the
customer’s criteria and specifications.
Revenue from the sale of spare parts and materials is recognized when the goods are shipped.
Rendering of serviceThe Company recognizes revenue from installation of equipment upon completion of installation
at the customer’s site. At the time of shipment, the Company defers that portion of the sales price
related to the installation. The relative selling price of the installation process is measured based
upon the per-hour amounts charged by third parties for similar installation services. Installation
is completed when testing at the customer’s site has proved that the equipment has met all of the
customer’s criteria and specifications. The completion of installation is signed-off by the customer
(final acceptance). The revenue relating to the undelivered elements of the arrangements is deferred
at their relative selling prices until delivery of these elements.
We provide training and technical support service to customers. Revenue related to such services
is recognized when the service is rendered.
Freight charges billed to customers are recognized as revenue, the related costs are recognized
as cost of sales. Revenues are recognized excluding the taxes levied on revenues.
Revenue on royalties and licensesRoyalty revenue is recognized on an accrual basis in accordance with the substance of the relevant
agreement (provided that it is probable that the economic benefits will flow to the Group and the
amount of revenue can be measured reliably). Royalties determined on a time basis are recognized
on a straight-line basis over the period of the agreement. Royalty arrangements that are based
on production, sales and other measures are recognized by reference to the underlying arrangement.
Cost of salesCost of sales comprise direct costs such as labor, materials, cost of warranty, depreciation, shipping
and handling costs and related overhead costs. Cost of sales also includes third party commission,
depreciation expenses of evaluation tools at customers, royalty payments and costs relating
to prototype and experimental products, which the Company may subsequently sell to customers.
Costs of warranty include the cost of labor and material necessary to repair a product during the
warranty period.
WarrantyWe provide maintenance on our systems during the warranty period, on average one year. Costs
of warranty include the cost of labor and material necessary to repair a product during the warranty
period. We accrue for the estimated cost of the warranty on products shipped in a provision for
warranty, upon recognition of the sale of the product. The costs are estimated based on historical
expenses incurred and on estimated future expenses related to current sales, and are updated
periodically. Actual warranty costs are charged against the provision for warranty. The actual warranty
costs may differ from estimated warranty costs, and we adjust our provision for warranty accordingly.
Future warranty costs may exceed our estimates, which could result in an increase of our cost
of sales.
Income taxIncome tax expense comprises current and deferred tax. It is recognized in the statement of profit
or loss except to the extent that it relates to a business combination, or items recognized directly
in equity or in other comprehensive income.
Current taxThe current corporate income tax charge recognized in the Consolidated statement of profit or loss
is calculated in accordance with the prevailing tax regulations and rates, taking into account non-
taxable income and non-deductible expenses. The current income tax expense reflects the amount
for the current reporting period that the Company expects to recover from or pay to the tax
authorities. Current income tax related to items recognized directly in equity is recorded in equity

114ANNUAL REPORT 2017
SHAREHOLDERS & GENERAL INFORMATIONFINANCIAL STATEMENTSGOVERNANCEPERFORMANCE REVIEWSTRATEGY & BUSINESSABOUT
and not in the Consolidated statement of profit or loss. ASMI’s management periodically evaluates
positions taken in the tax returns regarding situations in which applicable tax regulations are subject
to interpretation, and establishes provisions when deemed appropriate. Current tax also includes any
tax arising from dividends.
Current tax assets and liabilities are offset only if certain criteria are met.
Deferred taxDeferred income tax positions are recognized for temporary differences between the tax basis
of assets and liabilities and their carrying values in ASMI’s Consolidated statement of financial position.
Deferred tax assets are recognized for all deductible temporary differences, the carry forward
of unused tax credits and any unused tax losses. Deferred tax assets are recognized only to the extent
that it is probable that future taxable profits will be available against which the temporary differences
can be utilized. Both the recognized and unrecognized deferred tax assets are reassessed at each
reporting date. Deferred tax assets are recorded for deductible temporary differences associated with
investments in subsidiaries and are recorded only to the extent that it is probable that the temporary
differences will reverse in the foreseeable future and taxable profit will be available against which the
temporary differences can be utilized.
Deferred tax liabilities are recognized for all taxable temporary differences except when they affect
neither the profit or loss reported in the Consolidated statement of profit or loss nor the taxable profit
or loss. Also, no deferred tax liabilities are recorded for taxable temporary differences associated
with investments in subsidiaries when the timing of the reversal of the temporary differences can
be controlled and it is probable that the temporary differences will not reverse in the foreseeable future.
Deferred tax positions are stated at nominal value and are measured at the corporate income tax
rates the Company expects to be applicable in the year when the asset is realized or liability is settled
based on enacted or substantially enacted tax laws.
Deferred income tax assets and liabilities are netted if there is a legally enforceable right to set off
current tax assets against current tax liabilities, deferred income tax assets and deferred income tax
liabilities relate to income taxes levied by the same taxation authority on the same taxable entity, and
there is an intention to settle on a net basis.
We recognize a liability for uncertain tax positions when it is probable that an outflow
of economic resources will occur. Measurement of the liability for uncertain tax positions is based
on management’s best estimate of the amount of tax benefit that will be lost.
Retirement benefit costsThe Company has retirement plans covering substantially all employees. The principal plans are
defined contribution plans, except for the plans of the Company’s operations in the Netherlands and
Japan. The Company’s employees in the Netherlands participate in a multi-employer defined benefit
plan. Payments to defined contribution plans and the multi-employer plan are recognized as an
expense in the Consolidated Statement of Profit or Loss as they fall due. The Company accounts
for the multi-employer plan as if it were a defined contribution plan since the manager of the plan
is not able to provide the Company with the required Company-specific information to enable the
Company to account for the plan as a defined benefit plan.
The Company’s employees in Japan participate in defined benefit plans. Pension costs in respect
to this defined benefit plan are determined using the projected unit credit method. These costs
primarily represent the increase in the actuarial present value of the obligation for pension benefits
based on employee service during the year and the interest on this obligation in respect to employee
service in previous years, net of the expected return on plan assets.
For the defined benefit plan the Company recognizes in its Consolidated statement of financial
position an asset or a liability for the plan’s over-funded status or underfunded status respectively.
Actuarial gains and losses are recognized when incurred.
Obligations for contributions to defined contribution plans are expensed as the related service
is provided. Prepaid contributions are recognized as an asset to the extent that a cash refund or a
reduction in future payments is available.
Share-based paymentsThe costs relating to employee stock options and shares (compensation expense) are recognized
based upon the grant date fair value of the stock options or the shares. The fair value at grant date
of employee stock options is estimated using a Black-Scholes option valuation model. This model
requires the use of assumptions including expected stock price volatility, the estimated life of each
award and the estimated dividend yield. The risk-free interest rate used in the model is determined,
based on a euro government bond with a life equal to the expected life of the options. The estimated
fair value at grant date of shares is based on the share price of the ASMI share at grant date minus
the discounted value of expected dividends during the vesting period.

115ANNUAL REPORT 2017
SHAREHOLDERS & GENERAL INFORMATIONFINANCIAL STATEMENTSGOVERNANCEPERFORMANCE REVIEWSTRATEGY & BUSINESSABOUT
The grant date fair value of the stock options and shares is expensed on a straight-line basis over
the vesting period, based on the Company’s estimate of stock options and shares that will eventually
vest. The impact of the true up of the estimates is recognized in the Consolidated statement
of profit or loss in the period in which the revision is determined. The total estimated share-based
compensation expense, determined under the fair value based method is amortized proportionally
over the option vesting periods.
Operating lease
Determining whether an arrangement contains a leaseLeases are classified as finance leases whenever the terms of the lease transfer substantially all the
risks and rewards of ownership to the lessee. All other leases are classified as operating leases.
At inception of an arrangement, the Company determines whether the arrangement is or contains
a lease.
Lease paymentsPayments made under operating leases (net of any incentives received from the lessor) are recognized
in the statement of profit or loss on a straight-line basis over the term of the lease.
APPLICATION OF NEW AND REVISED INTERNATIONAL FINANCIAL REPORTING STANDARDS (IFRS)
Amendments to IFRS that are mandatorily effective for the current yearIn the current year, the Company has applied a number of amendments to IFRS issued by the
International Accounting Standards Board (IASB) that are mandatorily effective for an accounting
period that begins on or after January 1, 2017.
Disclosure Initiative (Amendments to IAS 7)The amendments require disclosures that enable users of financial statements to evaluate changes
in liabilities arising from financing activities, including changes arising from cash flow as well as non-
cash changes.
The Company has applied these amendments for the first time in the current year. The amendments
require an entity to provide disclosures that enable users of financial statements to evaluate changes
in liabilities arising from financing activities, including both cash and non-cash changes. The
Company currently has no liabilities arising from financing activities. As such, the application of these
amendments has had no impact on the Company’s Consolidated financial statements.
Recognition of Deferred Tax Assets for Unrealized Losses (Amendments to IAS 12)The Company has applied these amendments for the first time in the current year. The amendments
clarify how an entity should evaluate whether there will be sufficient future taxable profits against
which it can utilize a deductible temporary difference.
The application of these amendments has had no impact on the Company’s Consolidated financial
statements as the Company already assesses the sufficiency of future taxable profits in a way that
is consistent with these amendments.
Annual Improvements to IFRS 2014-2016 CycleThe Company has applied the amendments to IFRS 12 included in the Annual Improvements to IFRS
2014-2016 Cycle for the first time in the current year. The other amendments included in this package
are not yet mandatorily effective and they have not been early adopted by the Company.
IFRS 12 states that an entity need not provide summarized financial information for interests
in subsidiaries, associates or joint ventures that are classified (or included in a disposal group that
is classified) as held for sale. The amendments clarify that this is the only concession from the
disclosure requirements of IFRS 12 for such interests.
The application of these amendments has had no effect on the Company’s consolidated financial
statements as none of the Company’s interests in these entities are classified, or included in a
disposal group that is classified, as held for sale.
New and revised IFRS in issue but not yet effectiveThe Company has not applied the following new and revised IFRS that have been issued but are not yet effective:
› IFRS 9 Financial Instruments1
› IFRS 15 Revenue from Contracts with Customers (and the related Clarifications)1
› IFRS 16 Leases2
› Amendments to IFRS 2 Classification and Measurement of Share-based Payment Transactions1
› Amendments to IFRS 10 and IAS 28 Sale or Contribution of Assets between an Investor and its
Associate or Joint Venture3
› Amendments to IAS 40 Transfers of Investment Property1
› Amendments to IFRS Annual Improvements to IFRS 2014-2016 Cycle1
› IFRIC 22 Foreign Currency Transactions and Advance Consideration1
1 Effective for annual periods beginning on or after January 1, 2018, with earlier application permitted.2 Effective for annual periods beginning on or after January 1, 2019, with earlier application permitted.3 Effective for annual periods beginning on or after a date to be determined.

116ANNUAL REPORT 2017
SHAREHOLDERS & GENERAL INFORMATIONFINANCIAL STATEMENTSGOVERNANCEPERFORMANCE REVIEWSTRATEGY & BUSINESSABOUT
IFRS 9 Financial InstrumentsIFRS 9 issued in November 2009 introduced new requirements for the classification and measurement
of financial assets. IFRS 9 was subsequently amended in October 2010 to include requirements for
the classification and measurement of financial liabilities and for derecognition, and in November
2013 to include the new requirements for general hedge accounting. Another revised version of IFRS
9 was issued in July 2014 mainly to include a) impairment requirements for financial assets and
b) limited amendments to the classification and measurement requirements by introducing a ‘fair
value through other comprehensive income’ (FVTOCI) measurement category for certain simple
debt instruments.
Key requirements of IFRS 9All recognized financial assets that are within the scope of IFRS 9 are required to be subsequently
measured at amortized cost or fair value.
Classification and measurementAll financial assets and financial liabilities will continue to be measured on the same bases as is
currently adopted under IAS 39.
ImpairmentIn relation to the impairment of financial assets, IFRS 9 requires an expected credit loss model,
as opposed to an incurred credit loss model under IAS 39. The expected credit loss model requires
an entity to account for expected credit losses and changes in those expected credit losses at each
reporting date to reflect changes in credit risk since initial recognition. In other words, it is no longer
necessary for a credit event to have occurred before credit losses are recognized.
In general, management anticipates that the application of the expected credit loss model
of IFRS 9 will result in earlier recognition of credit losses for the respective items. However in general
balances are considered to be recoverable and as a result this will not increase the amount of loss
allowance recognized for these items.
Hedge accountingHedge accounting is not applied and as such management does not anticipate that the
application of the IFRS 9 hedge accounting requirements will have a material impact on the
Company’s Consolidated financial statements.
Based on an analysis of the Company’s financial assets and financial liabilities as at December
31, 2017 on the basis of the facts and circumstances that exist at that date, management of the
Company have assessed the impact of IFRS 9 to the Company’s consolidated financial statements
and as described above expects no material impact.
The new standard contains certain exemptions from full retrospective application, including
an exemption from the requirement to restate comparative information about classification and
measurement, including impairment.
We elected to use these exemptions and include a cumulative-effect adjustment in retained earnings
as of the beginning of the first reporting period in which the standard is effective. We will therefore not
restate prior year presented in our Consolidated financial statements upon adoption.
IFRS 15 Revenue from Contracts with CustomersIFRS 15 establishes a single comprehensive model for entities to use in accounting for revenue
arising from contracts with customers. IFRS 15 will supersede the current revenue recognition
guidance including IAS 18 Revenue, IAS 11 Construction Contracts and the related Interpretations
when it becomes effective.
The core principle of IFRS 15 is that an entity should recognize revenue to depict the transfer
of promised goods or services to customers in an amount that reflects the consideration to which the
entity expects to be entitled in exchange for those goods or services.
Specifically, the Standard introduces a 5-step approach to revenue recognition:1 step 1: Identify the contract(s) with a customer
2 step 2: Identify the performance obligations in the contract
3 step 3: Determine the transaction price
4 step 4: Allocate the transaction price to the performance obligations in the contract
5 step 5: Recognize revenue when (or as) the entity satisfies a performance obligation
Under IFRS 15, an entity recognizes revenue when (or as) a performance obligation is satisfied, i.e.
when ‘control’ of the goods or services underlying the particular performance obligation is transferred
to the customer.
Far more prescriptive guidance has been added in IFRS 15 to deal with specific scenarios.
Furthermore, extensive disclosures are required by IFRS 15.
In April 2016, the IASB issued Clarifications to IFRS 15 in relation to the identification of performance
obligations, principal versus agent considerations, as well as licensing application guidance.

117ANNUAL REPORT 2017
SHAREHOLDERS & GENERAL INFORMATIONFINANCIAL STATEMENTSGOVERNANCEPERFORMANCE REVIEWSTRATEGY & BUSINESSABOUT
The new standard is effective for interim and annual periods beginning after Janunary 1, 2018
and allows for either full retrospective adoption or modified retrospective adoption. We selected
full retrospective adoption and will therefore restate 2017 presented in our Consolidated financial
statements upon adoption in 2018.
We are finalizing our IFRS 15 implementation project comprising of two phases. Phase 1 involves
a detailed analysis of the impact of the principles of the new standard on our major contracts with
customers. Based on the contract analysis, a detailed concept has been developed for the transition
of revenue recognition to the new principles, including the need for adjustments to existing processes
and IT systems. The subsequent phase 2 of the project has served to implement the adjustments
identified in phase 1. We have finalized the contract assessment and are finalizing the full qualitative
impact analysis. We concluded that the timing of recognition for installation, conditional equipment
sales and fixed fee royalties are to be impacted.
At this time, we cannot reasonably estimate the exact financial impact of implementing this new
standard. However, for 2017 we expect an impact of our total net sales between 0 and 1.5% and
an impact of our net earnings between 0 and 7.5% due to a shift in timing of revenue recognition.
IFRS 16 LeasesIFRS 16 Leases was issued in January 2016. The standard has an effective date of January 1, 2019.
IFRS 16 was endorsed in November 2017. IFRS 16 introduces a comprehensive model for the
identification of lease arrangements and accounting treatments for both lessors and lessees. IFRS
16 will supersede the current lease guidance including IAS 17 Leases and the related interpretations
when it becomes effective.
IFRS 16 distinguishes leases and service contracts on the basis of whether an identified asset
is controlled by a customer. Distinctions of operating leases (off balance sheet) and finance leases
(on balance sheet) are removed for lessee accounting, and is replaced by a model where a right-
of-use asset and a corresponding liability have to be recognized for all leases by lessees (i.e. all
on balance sheet) except for short-term leases and leases of low value assets.
The right-of-use asset is initially measured at cost and subsequently measured at cost (subject
to certain exceptions) less accumulated depreciation and impairment losses, adjusted for any
remeasurement of the lease liability. The lease liability is initially measured at the present value of the
lease payments that are not paid at that date. Subsequently, the lease liability is adjusted for interest
and lease payments, as well as the impact of lease modifications, amongst others. Furthermore,
the classification of cash flows will also be affected as operating lease payments under IAS 17 are
presented as operating cash flows; whereas under the IFRS 16 model, the lease payments will
be split into a principal and an interest portion which will be presented as financing and operating
cash flows respectively.
In contrast to lessee accounting, IFRS 16 substantially carries forward the lessor accounting
requirements in IAS 17, and continues to require a lessor to classify a lease either as an operating
lease or a finance lease.
Furthermore, extensive disclosures are required by IFRS 16.
As at December 31, 2017, the Company has non-cancellable operating lease commitments of
€19 million. IAS 17 does not require the recognition of any right-of-use asset or liability for future
payments for these leases; instead, certain information is disclosed as operating lease commitments
in Note 17.
A preliminary assessment indicates that these arrangements will meet the definition of a lease
under IFRS 16, and hence the Company will recognize a right-of-use asset and a corresponding
liability in respect of all these leases unless they qualify for low value or short-term leases upon the
application of IFRS 16.
The new requirement to recognize a right-of-use asset and a related lease liability is expected
to have an impact on the amounts recognized in the Company’s Consolidated financial statements
and management is currently assessing its potential impact. Also, an impact is expected on our
Consolidated statement of profit or loss. Result from operations is expected to increase, but the
impact on income before income taxes is not expected to be material. It is not practicable to provide
a reasonable estimate of the financial effect until management complete the review.

118ANNUAL REPORT 2017
SHAREHOLDERS & GENERAL INFORMATIONFINANCIAL STATEMENTSGOVERNANCEPERFORMANCE REVIEWSTRATEGY & BUSINESSABOUT
Amendments to IFRS 2 Classification and Measurement of Share-based Payment TransactionsThe amendments clarify the following:1 in estimating the fair value of a cash-settled share-based payment, the accounting for the effects
of vesting and non-vesting conditions should follow the same approach as for equity-settled
share-based payments.
2 where tax law or regulation requires an entity to withhold a specified number of equity
instruments equal to the monetary value of the employee’s tax obligation to meet the employee’s
tax liability which is then remitted to the tax authority, i.e. the share-based payment arrangement
has a ‘net settlement feature’, such an arrangement should be classified as equity-settled in its
entirety, provided that the share-based payment would have been classified as equity-settled had
it not included the net settlement feature.
3 a modification of a share-based payment that changes the transaction from cash-settled to
equity-settled should be accounted for as follows:
› the original liability is derecognized;
› the equity-settled share-based payment is recognized at the modification date fair value of
the equity instrument granted to the extent that services have been rendered up to the
modification date; and
› any difference between the carrying amount of the liability at the modification date and
the amount recognised in equity should be recognized in profit or loss immediately.
The amendments are effective for annual reporting periods beginning on or after January 1, 2018
with earlier application permitted.
Management of the Company does not anticipate that the application of the amendments in the
future will have a significant impact on the Company’s Consolidated financial statements as the
Company does not have withholding tax arrangements with tax authorities in relation to share-
based payments.
Amendments to IFRS 10 and IAS 28 Sale or Contribution of Assets between an Investor and its Associate or Joint VentureThe amendments to IFRS 10 and IAS 28 deal with situations where there is a sale or contribution
of assets between an investor and its associate or joint venture. Specifically, the amendments state
that gains or losses resulting from the loss of control of a subsidiary that does not contain a business
in a transaction with an associate or a joint venture that is accounted for using the equity method,
are recognized in the parent’s profit or loss only to the extent of the unrelated investors’ interests
in that associate or joint venture. Similarly, gains and losses resulting from the remeasurement
of investments retained in any former subsidiary (that has become an associate or a joint venture
that is accounted for using the equity method) to fair value are recognized in the former parent’s profit
or loss only to the extent of the unrelated investors’ interests in the new associate or joint venture.
The effective date of the amendments has yet to be set by the IASB; however, earlier application
of the amendments is permitted. Management of the Company anticipates that the application
of these amendments may have an impact on the Company’s Consolidated financial statements
in future periods should such transactions arise.
Amendments to IAS 40 Transfers of Investment PropertyBecause the Company does not have investment property stated on the statement of financial
position, management concluded that the amendments will have no impact.
Amendments to IFRS Annual Improvements to IFRS 2014-2016 CycleThe annual improvements include amendments to IFRS 1 and IAS 28 which are not yet mandatorily
effective for the Company.
Both the amendments to IFRS 1 and IAS 28 are effective for annual periods beginning on or after
January 1, 2018. Management of the Company does not anticipate that the application of the
amendments in the future will have any impact on the Company’s Consolidated financial statements
as the Company is neither a first-time adopter of IFRS nor a venture capital organization. Furthermore,
the Company does not have any associate or joint venture that is an investment entity.

119ANNUAL REPORT 2017
SHAREHOLDERS & GENERAL INFORMATIONFINANCIAL STATEMENTSGOVERNANCEPERFORMANCE REVIEWSTRATEGY & BUSINESSABOUT
IFRIC 22 Foreign Currency Transactions and Advance ConsiderationIFRIC 22 addresses how to determine the ‘date of transaction’ for the purpose of determining the
exchange rate to use on initial recognition of an asset, expense or income, when consideration for
that item has been paid or received in advance in a foreign currency which resulted in the recognition
of a non-monetary asset or non-monetary liability (e.g. a non-refundable deposit or deferred revenue).
The Interpretation specifies that the date of transaction is the date on which the entity initially
recognizes the non-monetary asset or non-monetary liability arising from the payment
or receipt of advance consideration. If there are multiple payments or receipts in advance, the
Interpretation requires an entity is to determine the date of transaction for each payment or receipt
of advance consideration.
The Interpretation is effective for annual periods beginning on or after January 1, 2018 with earlier
application permitted. Entities can apply the Interpretation either retrospectively or prospectively.
Specific transition provisions apply to prospective application.
Management of the Company does not anticipate that the application of the amendments in the
future will have an impact on the Company’s Consolidated financial statements. This is because
the Company already accounts for transactions involving the payment or receipt of advance
consideration in a foreign currency in a way that is consistent with the amendments.

120ANNUAL REPORT 2017
SHAREHOLDERS & GENERAL INFORMATIONFINANCIAL STATEMENTSGOVERNANCEPERFORMANCE REVIEWSTRATEGY & BUSINESSABOUT
NOTE 2. SUBSIDIARIESUnless otherwise indicated, these are, directly or indirectly, wholly-owned subsidiaries. With respect
to the separate financial statements of the Dutch legal entities included in the consolidation, the
Company availed itself of the exemption laid down in section 403, subsection 1 of Book 2 of the
Dutch Civil Code.
The location included below is the principal place of business of the specified subsidiaries. There
is no difference between the principal place of business and country of incorporation.
% OWNERSHIP DECEMBER 31,
NAME LOCATION 2016 2017
Subsidiaries (consolidated)
ASM Europe BV 1) Almere, the Netherlands 100% 100%
ASM United Kingdom Sales BV 1) Almere, the Netherlands 100% 100%
ASM Germany Sales BV 1) Almere, the Netherlands 100% 100%
ASM Pacific Holding BV 1) 2) Almere, the Netherlands 100% 100%
ASM France SARL Crolles, France 100% 100%
ASM Belgium NV Leuven, Belgium 100% 100%
ASM Italia Srl Milano, Italy 100% 100%
ASM Microchemistry Oy Helsinki, Finland 100% 100%
ASM Services and Support Ireland Ltd Dublin, Ireland 100% 100%
ASM Services and Support Israel Ltd Kiryat Gat, Israel 100% 100%
ASM America Inc Phoenix, Arizona, United States of America 100% 100%
ASM Japan KK Tokyo, Japan 100% 100%
ASM Netherlands Holding BV Almere, the Netherlands 100% 100%
ASM China Ltd Shanghai, People’s Republic of China 100% 100%
ASM Wafer Process Equipment Singapore Pte Ltd Singapore 100% 100%
ASM Front-End Sales & Services Taiwan Co Ltd Hsin-Chu, Taiwan 100% 100%
ASM Services & Support Malaysia SDN BHD Kulim, Malaysia 100% 100%
ASM Front-End Manufacturing Singapore Pte Ltd Singapore 100% 100%
ASM Korea Ltd Cheonan, South Korea 100% 100%
ASM IP Holding BV 1) Almere, the Netherlands 100% 100%
ASM NuTool Inc Phoenix, Arizona, United States of America 100% 100%
ASM Europe Holding BV Almere, the Netherlands 100% liquidated
ASM Ion Implant BV Almere, the Netherlands 100% liquidated
Hamilcar Investments BV Almere, the Netherlands 100% liquidated
CVTR Development BV Almere, the Netherlands 100% liquidated
Rembrandt Lease and Finance BV Almere, the Netherlands 100% liquidated
ASM Wafer Process Equipment Ltd Kwai Chung, Hong Kong, People’s Republic of China 100% 100%1 For these subsidiaries ASM International NV has filed statements at the Dutch Chamber of Commerce assuming joint and several liability in accordance with Article 403 of Book 2, Part 9 of the Dutch Civil Code.2 ASM Pacific Holding BV holds 25.18% of the shares in ASM Pacific Technology Ltd.

121ANNUAL REPORT 2017
SHAREHOLDERS & GENERAL INFORMATIONFINANCIAL STATEMENTSGOVERNANCEPERFORMANCE REVIEWSTRATEGY & BUSINESSABOUT
NOTE 3. PROPERTY, PLANT AND EQUIPMENTThe changes in the amount of property, plant and equipment are as follows:
LAND, BUILDINGS AND LEASEHOLD IMPROVEMENTS MACHINERY, EQUIPMENT
FURNITURE AND FIXTURES AND OTHER EQUIPMENT
ASSETS UNDER CONSTRUCTION TOTAL
At cost
BALANCE JANUARY 1, 2016 43,294 158,901 19,490 14,735 236,420
Capital expenditures – 7,181 427 19,282 26,890
Retirements and sales (48) (6,734) (595) (360) (7,737)
Transfer from assets under construction 1,370 14,453 1,732 (17,555) –
Reclassification to other intangible assets – – – (21) (21)
Reclassification to evaluation tools – – – (1,633) (1,633)
Foreign currency translation effect 1,556 4,907 917 841 8,221
BALANCE DECEMBER 31, 2016 46,172 178,708 21,971 15,289 262,140
Capital expenditures 225 1,619 790 41,537 44,171
Retirements and sales (1,643) (10,308) (1,201) – (13,152)
Transfer from assets under construction 3,244 32,391 904 (36,539) –
Reclassification to other intangible assets – – 66 – 66
Reclassification to evaluation tools – – – – –
Foreign currency translation effect (3,226) (16,357) (1,638) (1,391) (22,612)
BALANCE DECEMBER 31, 2017 44,772 186,053 20,892 18,896 270,613
Accumulated depreciation and impairment
BALANCE JANUARY 1, 2016 25,401 102,114 17,111 144,626
Depreciation for the year 1,811 19,413 1,019 22,243
Impairment charges – 1,745 – 1,745
Retirements and sales (2) (6,270) (595) (6,867)
Foreign currency translation effect 820 3,778 791 5,389
BALANCE DECEMBER 31, 2016 28,030 120,780 18,326 167,136
Depreciation for the year 1,959 20,648 1,281 23,888
Impairment charges – – – –
Retirements and sales (1,632) (9,497) (1,201) (12,330)
Foreign currency translation effect (1,871) (11,457) (1,385) (14,713)
BALANCE DECEMBER 31, 2017 26,486 120,474 17,021 163,981
Carrying amounts
DECEMBER 31, 2016 18,142 57,928 3,645 15,289 95,004
DECEMBER 31, 2017 18,286 65,579 3,871 18,896 106,632
Useful lives in years 0-25 2-10 2-10

122ANNUAL REPORT 2017
SHAREHOLDERS & GENERAL INFORMATIONFINANCIAL STATEMENTSGOVERNANCEPERFORMANCE REVIEWSTRATEGY & BUSINESSABOUT
The impairment charges in 2016 relate to demo equipment and is reported in the Consolidated
statement of profit or loss in cost of sales.
NOTE 4. GOODWILLThe carrying amount of the goodwill is related to the acquisitions operations in the following
business units:
DECEMBER 31,
2016 2017
Thermal products business unit 2,611 2,611
Plasma products business unit 8,659 8,659
TOTAL 11,270 11,270
We perform an annual impairment test on December 31 of each year or if events or changes
in circumstances indicate that the carrying amount of goodwill exceeds its recoverable amount. For
the Front-end impairment test and the determination of the recoverable amount, a discounted future
cash flow approach is used which makes use of our estimates of future revenues, driven by assumed
market growth and estimated costs as well as appropriate discount rates.
The material assumptions used for the discounted future cash flows of the cash generating units (CGUs) are:
› an average discount rate of 11.5% (2016: 11.2%) representing the pre-tax weighted average cost
of capital;
› external market segment data, historical data and strategic plans to estimate cash flow growth per
product line; and
› cash flow calculations are limited to four years of cash flow; after these four years perpetuity
growth rates are set based on the market maturity of the products. For a maturing product, the
perpetuity growth rates used are 1% or less and for enabling technology products the rate used is
3% or less.
These estimates are consistent with the plans and estimated costs we use to manage the underlying
business. Based on this analysis, management concluded that as per December 31, 2017 the
recoverable amount of the CGUs exceeded the carrying value. The excess was over 100% for each
of the CGUs. Sensitivity analysis demonstrated that no reasonable possible change in estimated
cash flows or the discount rate used in calculating the fair value would cause the carrying value
of goodwill to exceed the fair value.
For Back-end, goodwill is included in the investment value of ASMPT. For the impairment test,
reference is made to Note 6.

123ANNUAL REPORT 2017
SHAREHOLDERS & GENERAL INFORMATIONFINANCIAL STATEMENTSGOVERNANCEPERFORMANCE REVIEWSTRATEGY & BUSINESSABOUT
NOTE 5. OTHER INTANGIBLE ASSETSOther intangible assets include capitalized development expenditure, software developed
or purchased (including licenses) for internal use and purchased technology from third parties. The
changes in the amount of other intangible assets are as follows:
DEVELOPMENT COSTS SOFTWAREPURCHASED TECHNOLOGY AND
OTHER INTANGIBLE ASSETS TOTAL
At cost
BALANCE JANUARY 1, 2016 117,983 21,203 11,704 150,890
Additions 27,327 7,024 – 34,351
Reclassification – 21 – 21
Disposals – (1) – (1)
Foreign currency translation effect 4,384 191 125 4,700
BALANCE DECEMBER 31, 2016 149,694 28,438 11,829 189,961
Additions 38,615 2,335 58 41,008
Reclassification – (66) – (66)
Disposals – (242) – (242)
Foreign currency translation effect (14,622) (638) (387) (15,647)
BALANCE DECEMBER 31, 2017 173,687 29,827 11,500 215,014
Accumulated amortization and impairment losses
BALANCE JANUARY 1, 2016 45,505 15,614 8,236 69,355
Amortization for the year 13,345 655 1,204 15,204
Impairments 3,575 – – 3,575
Disposals – (1) – (1)
Foreign currency translation effect 1,343 181 125 1,649
BALANCE DECEMBER 31, 2016 63,768 16,449 9,565 89,782
Amortization for the year 13,288 1,493 678 15,459
Impairments 4,337 – – 4,337
Disposals – (242) – (242)
Foreign currency translation effect (6,627) (602) (388) (7,617)
BALANCE DECEMBER 31, 2017 74,766 17,098 9,855 101,719
Carrying amounts
DECEMBER 31, 2016 85,926 11,989 2,264 100,179
DECEMBER 31, 2017 98,921 12,729 1,645 113,295

124ANNUAL REPORT 2017
SHAREHOLDERS & GENERAL INFORMATIONFINANCIAL STATEMENTSGOVERNANCEPERFORMANCE REVIEWSTRATEGY & BUSINESSABOUT
Impairment charges on capitalized development costs are included in operating expenses under
research and development. Impairment of capitalized development expenses primarily related
to development of new hardware for which customer demand has shifted out in time, and purchased
technology which became obsolete. The impairment charges for 2016 and 2017 related to customer
specific projects.
Capitalized development costs are amortized over their estimated useful lives of five years, other
intangible assets are amortized over their estimated useful lives of three to seven years.
Estimated amortization expenses relating to other intangible assets are as follows:
DEVELOPMENT COSTS SOFTWARE
PURCHASED TECHNOLOGY AND
OTHER INTANGIBLE ASSETS TOTAL
2018 9,811 3,116 670 13,597
2019 20,858 4,486 670 26,014
2020 20,791 3,490 285 24,566
2021 17,536 1,630 10 19,176
2022 15,306 7 10 15,323
Years thereafter 14,619 – – 14,619
TOTAL 98,921 12,729 1,645 113,295
NOTE 6. INVESTMENTS IN ASSOCIATESThe location included below is the principal place of business of the specified associates. There is no
difference between the principal place of business and country of incorporation.
% OWNERSHIP DECEMBER 31,
NAME LOCATION 2016 2017
Associates
Levitech BV Almere, the Netherlands 26.64% 26.64%
ASM Pacific Technology LtdKwai Chung, Hong Kong, People’s Republic of China 39.19% 25.18%

125ANNUAL REPORT 2017
SHAREHOLDERS & GENERAL INFORMATIONFINANCIAL STATEMENTSGOVERNANCEPERFORMANCE REVIEWSTRATEGY & BUSINESSABOUT
The changes in the investment and associates are as follows:
ASMPT
LEVITECH NET EQUITY SHAREOTHER (IN)TANGIBLE
ASSETS GOODWILL TOTAL ASMPT TOTAL
BALANCE JANUARY 1, 2016 – 375,172 147,539 647,598 1,170,309 1,170,309
Share in net earnings of investments in associates – 67,711 – – 67,711 67,711
Other comprehensive income of investments in associates – (1,344) – – (1,344) (1,344)
Amortization recognized (in)tangible assets – – (27,223) – (27,223) (27,223)
Dividends – (22,083) – – (22,083) (22,083)
Dilution ASMPT share to 39.19% – 9,336 (729) (5,793) 2,814 2,814
Foreign currency translation effect – 3,740 3,624 20,476 27,840 27,840
BALANCE DECEMBER 31, 2016 – 432,532 123,211 662,281 1,218,024 1,218,024
Share in net earnings of investments in associates – 112,424 – – 112,424 112,424
Other comprehensive income of investments in associates – (2,580) – – (2,580) (2,580)
Carrying amount of the divestment – (169,675) (34,557) (217,321) (421,553) (421,553)
Amortization recognized (in)tangible assets – – (22,811) – (22,811) (22,811)
Dividends – (36,458) – – (36,458) (36,458)
Dilution ASMPT share to 25.18% – 1,491 (112) (773) 606 606
Foreign currency translation effect – (32,063) (11,991) (73,046) (117,100) (117,100)
BALANCE DECEMBER 31, 2017 – 305,671 53,740 371,141 730,552 730,552
On March 15, 2013, the Company divested a controlling stake in its subsidiary ASM Pacific
Technology Ltd (ASMPT). After the initial accounting of the sale transaction and related gains, future
income from ASMPT was adjusted for the fair value adjustments arising from the basis differences
as if a business combination had occurred under IFRS 3R, Business Combinations, i.e. a purchase
price allocation (PPA).
The purchase of the associate has been recognized at fair value, being the value of the ASMPT
shares on the day of closing of the purchase transaction. The composition of this fair value was
determined through a PPA. The PPA resulted in the recognition of intangible assets for customer
relationship, technology, trade name, product names and goodwill. For inventories and property,
plant & equipment, a fair value adjustment was recognized.
The ASMPT investment is accounted for under the equity method on a go-forward basis. Equity
method investments are tested for prolonged impairment. An investment is considered impaired
if the fair value of the investment is less than its carrying value.
If the fair value of an investment is less than its carrying value at the balance sheet date, the
Company determines whether the impairment is temporary or prolonged. The amount per share
recognized as per December 31, 2017 under equity accounting amounts to HK$66.47, whereas the
level 1 fair value per share (being the market price of a share on the Hong Kong Stock Exchange)
was HK$108.90 as per December 31, 2017. Management concluded that based on quantitative
analysis no impairment of its share in ASMPT existed as per December 31, 2017.

126ANNUAL REPORT 2017
SHAREHOLDERS & GENERAL INFORMATIONFINANCIAL STATEMENTSGOVERNANCEPERFORMANCE REVIEWSTRATEGY & BUSINESSABOUT
In April 2017, the Company divested a 4.9% stake in ASMPT for the proceeds of €246 million.
In November 2017, the Company divested a 9.1% stake for the proceeds of €445 million. The
Company has accounted for the remaining stake as an associate because the Company continues
to have significant influence in ASMPT. The Company was considered to have significant influence
over this entity due to the fact that it had board representation.
2017
Proceeds of divestments 690,660
Plus: realized currency translation adjustment 15,791
Less: carrying amount of divestments 421,553
Gain recognized 284,898
In December 2017, 2,238,100 common shares of ASMPT were issued, for cash at par value
of HK$ 0.10 per share, pursuant to the Employee Share Incentive Scheme of ASMPT. The shares
issued under the plan in 2017 have diluted ASMI’s ownership in ASMPT further to 25.18% as of
December 31, 2017.
Per December 31, 2017, the book value of our equity method investment in ASMPT was €731
million. The historical cost basis of our 25.18% share of net assets on the books of ASMPT under
IFRS was €306 million as of December 31, 2017, resulting in a basis difference of €425 million.
€54 million of this basis difference has been allocated to property, plant and equipment, and
intangible assets. The remaining amount was allocated to equity method goodwill. Each individual,
identifiable asset will periodically be reviewed for any indicators of potential impairment. We amortize
the basis differences allocated to the assets on a straight-line basis, and include the impact within
the results of our equity method investments. Amortization and depreciation are adjusted for related
deferred tax impacts. Included in net income attributable to ASMI for 2017 was after-tax expense of
€23 million, representing the depreciation and amortization of the basis differences.
The market value of our 25.18% investment in ASMPT on December 31, 2017 approximates
€1,197 million.
Summarized 100% earnings information for ASMPT equity method investment excluding basis
adjustments (foreign currency exchange rate average 2017 1 HK$: €0.11378, for December 31,
2016: 1 HK$: €0.11698).
(HK$ million) 2016 2017
Net sales 14,249 17,523
Income before income tax 1,793 3,274
Net earnings 1,438 2,796
Other comprehensive income (237) 578
TOTAL COMPREHENSIVE INCOME 1,201 3,374
Summarized 100% statement of financial position information for ASMPT equity method investment
excluding basis adjustments (foreign currency exchange rate per December 31, 2017 was
1 HK$: €0.10670 for December 31, 2016: 1 HK$: €0.12232).
DECEMBER 31,
(HK$ million) 2016 2017
Current assets 11,918 14,572
Non-current assets 3,721 4,029
Current liabilities 6,237 4,784
Non-current liabilities 376 2,439
Equity 9,026 11,377
Equity of ASMPT per December 31, 2017 translated into euros at a rate of 0.10670 was €1,214 million
(our 25.18% share: €306 million).
The ASMPT Board is responsible for ongoing monitoring of the performance of the Back-end
activities. The actual results of the Back-end operating unit are discussed with the ASMPT Audit
Committee, which includes the representative of ASMI. The ASMI representative reports to the ASMI
Management Board and the Audit Committee of ASMI on a quarterly basis.
Our share of income taxes incurred directly by the associates is reported in result from investments
in associates and as such is not included in income taxes in our Consolidated financial statements.

127ANNUAL REPORT 2017
SHAREHOLDERS & GENERAL INFORMATIONFINANCIAL STATEMENTSGOVERNANCEPERFORMANCE REVIEWSTRATEGY & BUSINESSABOUT
NOTE 7. EVALUATION TOOLS AT CUSTOMERSThe changes in the amount of evaluation tools are as follows:
DECEMBER 31,
2016 2017
At cost
BALANCE AT BEGINNING OF YEAR 38,631 49,040
Evaluation tools shipped 28,490 25,082
Evaluation tools sold (22,038) (24,770)
Reclassification from assets under construction 1,633 –
Foreign currency translation effect 2,325 (4,938)
BALANCE AT END OF YEAR 49,040 44,414
Accumulated depreciation and impairment
BALANCE AT BEGINNING OF YEAR (9,632) (12,446)
Depreciation for the year (8,902) (8,224)
Impairment charges – –
Evaluation tools sold 6,605 4,621
Foreign currency translation effect (518) 1,345
BALANCE AT END OF YEAR (12,446) (14,704)
CARRYING AMOUNT AT BEGINNING OF YEAR 28,999 36,594
CARRYING AMOUNT AT END OF YEAR 36,594 29,710
Useful lives in years: 5
NOTE 8. INVENTORIESInventories consist of the following:
DECEMBER 31,
2016 2017
Components and raw materials 84,634 104,333
Work in progress 30,614 37,047
Finished goods 12,618 14,218
TOTAL INVENTORIES, GROSS 127,866 155,598
Allowance for obsolescence (15,527) (12,749)
TOTAL INVENTORIES, NET 112,339 142,849
The changes in the allowance for obsolescence are as follows:
DECEMBER 31,
2016 2017
BALANCE AT BEGINNING OF YEAR (19,350) (15,527)
Charged to cost of sales (6,120) (6,312)
Reversals 5,012 4,973
Utilization of the provision 5,178 3,085
Foreign currency translation effect (247) 1,032
BALANCE AT END OF YEAR (15,527) (12,749)
On December 31, 2017, our allowance for inventory obsolescence amounted to €12,749, which
is 8.2% of total inventory. The major part of the allowance is related to components and raw
materials. The addition for the years 2016 and 2017 mainly relate to inventory items which ceased
to be used due to technological developments and design changes which resulted in obsolescence
of certain parts.
The cost of inventories recognized as costs and included in cost of sales amounted to €336.4 million
(2016: €243.4 million).

128ANNUAL REPORT 2017
SHAREHOLDERS & GENERAL INFORMATIONFINANCIAL STATEMENTSGOVERNANCEPERFORMANCE REVIEWSTRATEGY & BUSINESSABOUT
NOTE 9. ACCOUNTS RECEIVABLEA significant percentage of our accounts receivable is derived from sales to a limited number of large
multinational semiconductor device manufacturers located throughout the world. In order to monitor
potential credit losses, we perform ongoing credit evaluations of our customers’ financial condition.
The carrying amount of accounts receivable is as follows:
DECEMBER 31,
2016 2017
Current 104,954 131,688
Overdue <30 days 7,152 15,784
Overdue 31-60 days 6,330 8,776
Overdue 61-120 days 12,531 2,800
Overdue >120 days 6,053 4,087
TOTAL 137,020 163,135
An allowance for doubtful accounts receivable is maintained for potential credit losses based upon
management’s assessment of the expected collectability of all accounts receivable. The allowance
for doubtful accounts is reviewed periodically to assess the adequacy of the allowance. In making
this assessment, management takes into consideration any circumstances of which we are aware
regarding a customer’s inability to meet its financial obligations, and our judgments as to potential
prevailing economic conditions in the industry and their potential impact on the Company’s customers.
The changes in the allowance for doubtful accounts receivable are as follows:
DECEMBER 31,
2016 2017
BALANCE AT BEGINNING OF YEAR (44) (94)
Charged to selling, general and administrative expenses (52) –
Utilization of the provision – 94
Foreign currency translation effect 2 –
BALANCE AT END OF YEAR (94) –
Accounts receivable are impaired and provided for on an individual basis. As of December 31,
2017, accounts receivable of €31 million were past due but not impaired. These balances are still
considered to be recoverable because they relate to customers for whom there is neither recent
history of default nor expectation that this will incur.
For further information on credit risk see Note 16.
NOTE 10. CASH AND CASH EQUIVALENTSCash and cash equivalents at December 31, 2017 include deposits with financial institutions that
have good credit ratings of €112 million (2016: €99 million), investments in money market funds that
invest in debt securities of financial institutions that have good credit rating and governments of €467
million (2016: €24 million) and interest-bearing bank accounts of €257 million (2016: €255 million).
Our cash and cash equivalents are predominantly denominated in Euros and US dollars, and partly
in Singapore dollars, Korean won, and Japanese yen.
Bank guarantees exist for an amount of €779 at December 31, 2017 (€827 as per
December 31, 2016).
Cash and cash equivalents have insignificant interest rate risk and remaining maturities of three
months or less at the date of acquisition. Except for an amount of €3.4 million (2016: €3.7 million),
no restrictions on usage of cash and cash equivalents exist. The carrying amount of these assets
approximates to their fair value.
NOTE 11. EQUITYOur Management Board has the power to issue ordinary shares and (financing) preference shares
insofar as the Management Board has been authorized to do so by the Annual General Meeting
of Shareholders (AGM). The Management Board requires the approval of the Supervisory Board for
such an issue. The authorization by the AGM can only be granted for a certain period. In the case
that the AGM has not authorized the Management Board to issue shares, the AGM shall have the
power to issue shares.
COMMON SHARES, PREFERRED AND FINANCING PREFERRED SHARESThe authorized capital of the Company amounts to 110,000,000 common shares of €0.04 par value,
118,000 preferred shares of €40 par value and 8,000 financing preferred shares of €40 par value.
The AGM of May 22, 2017, approved the cancellation of 1.5 million treasury shares. This became
effective as per August 1, 2017.

129ANNUAL REPORT 2017
SHAREHOLDERS & GENERAL INFORMATIONFINANCIAL STATEMENTSGOVERNANCEPERFORMANCE REVIEWSTRATEGY & BUSINESSABOUT
As per December 31, 2017, 62,297,394 ordinary shares with a nominal value of €0.04 each were
issued and fully paid up, of which 6,157,241 ordinary shares are held by us in treasury. All shares
have one vote per €0.04 par value. Treasury shares held by the Company cannot be voted on. Of our
56,140,153 outstanding common shares at December 31, 2017, 55,783,384 are registered with our
transfer agent in the Netherlands, ABN AMRO Bank NV, and 356,769 are registered with our transfer
agent in the United States, Citibank, NA, New York.
Financing preferred shares are designed to allow ASMI to finance equity with an instrument paying
a preferred dividend, linked to EURIBOR loans and government loans, without the dilutive effects
of issuing additional common shares.
Preferred and financing preferred shares are issued in registered form only and are subject to transfer
restrictions. Essentially, a preferred or financing preferred shareholder must obtain the approval of the
Company’s Supervisory Board to transfer shares. If approval is denied, the Supervisory Board will
provide a list of acceptable prospective buyers who are willing to purchase the shares at a cash
price to be fixed by consent of the Supervisory Board and seller within two months after the approval
is denied. If the transfer is approved, the shareholder must complete the transfer within three months,
at which time the approval expires.
Preferred shares are entitled to a cumulative preferred dividend based on the amount paid up on
such shares. Financing preferred shares are entitled to a cumulative dividend based on the par value
and share premium paid on such shares.
As per December 31, 2017 no preferred shares are issued.
PURCHASES OF EQUITY SECURITIES BY THE ISSUER AND AFFILIATED PURCHASERSOn May 22, 2017, the AGM authorized the Company, for an 18-month period, to be calculated from
the date of the AGM, to repurchase its own shares up to 10% of the issued capital, at a price at least
equal to the shares’ nominal value and at most a price equal to 110% of the shares’ average closing
price according to the listing on the Euronext Amsterdam stock exchange during the five trading
days preceding the purchase date.
On October 28, 2015, ASMI announced a share buyback program to purchase up to an amount of
€100 million of its own shares within the 2015-2016 time frame.
The following table provides a summary of shares repurchased by ASMI under this program:
PERIOD
TOTAL NUMBER OF SHARES
PURCHASED
AVERAGE PRICE PAID PER
SHARE (EUR)
CUMULATIVE NUMBER OF
SHARES PURCHASED
Share buyback program 2015-2016:
November, 2015 23,788 €37.59 23,788
December, 2015 228,191 €36.16 251,979
January, 2016 209,682 €34.29 461,661
February, 2016 407,902 €36.36 869,563
March, 2016 273,296 €38.71 1,142,859
April, 2016 272,475 €37.94 1,415,334
May, 2016 154,101 €34.91 1,569,435
June, 2016 226,996 €34.75 1,796,431
July, 2016 273,058 €35.83 2,069,489
August, 2016 312,157 €33.60 2,381,646
September, 2016 242,751 €35.10 2,624,397
October, 2016 106,095 €37.36 2,730,492
November, 2016 42,237 €38.93 2,772,729
TOTAL 2,772,729 €35.98
On October 26, 2016, ASMI announced a share buyback program to purchase up to an amount of
€50 million of its own shares within the 2016-2017 time frame. On March 2, 2017, ASMI announced
an increase in the 2016-2017 share buyback program to €100 million.

130ANNUAL REPORT 2017
SHAREHOLDERS & GENERAL INFORMATIONFINANCIAL STATEMENTSGOVERNANCEPERFORMANCE REVIEWSTRATEGY & BUSINESSABOUT
The following table provides a summary of shares repurchased by ASMI under this program:
PERIOD
TOTAL NUMBER OF SHARES
PURCHASED
AVERAGE PRICE PAID PER
SHARE (EUR)
CUMULATIVE NUMBER OF
SHARES PURCHASED
Share buyback program 2016-2017:
December, 2016 153,022 €42.30 153,022
January, 2017 143,498 €43.46 296,520
February, 2017 157,326 €47.56 453,846
March, 2017 330,000 €49.47 783,846
April, 2017 260,658 €51.73 1,044,504
May, 2017 258,400 €55.15 1,302,904
June, 2017 254,000 €53.07 1,556,904
July, 2017 182,000 €52.24 1,738,904
August, 2017 258,618 €49.35 1,997,522
TOTAL 1,997,522 €50.06
On September 22, 2017, ASMI announced a share buyback program to purchase up to an amount
of €250 million of its own shares within the 2017-2018 time frame.
The following table provides a summary of shares repurchased by ASMI under this program:
PERIOD
TOTAL NUMBER OF SHARES
PURCHASED
AVERAGE PRICE PAID PER
SHARE (EUR)
CUMULATIVE NUMBER OF
SHARES PURCHASED
Share buyback program 2017-2018:
September, 2017 240,237 €52.44 240,237
October, 2017 823,362 €55.30 1,063,599
November, 2017 714,716 €60.32 1,778,315
December, 2017 863,338 €56.43 2,641,653
TOTAL 2,641,653 €56.77
The following table provides the change in number of treasury shares and outstanding shares:
TREASURY SHARES OUTSTANDING SHARES
BALANCE AT BEGINNING OF YEAR 3,981,551 59,815,843
Purchase common shares 4,420,946 (4,420,946)
Exercise stock options out of treasury shares (626,939) 626,939
Vesting restricted shares out of treasury shares (118,317) 118,317
Cancellation treasury shares (1,500,000) –
BALANCE AT END OF YEAR 6,157,241 56,140,153
ASMI intends to use part of the shares for commitments under employee share-based
compensation schemes.
The share buyback programs were executed by intermediaries through on-exchange purchases
or through off-exchange trades. ASMI updated the markets on the progress of the share buyback
programs on a weekly basis.
The repurchase programs are part of ASMI’s commitment to use excess cash for the benefit
of its shareholders.

131ANNUAL REPORT 2017
SHAREHOLDERS & GENERAL INFORMATIONFINANCIAL STATEMENTSGOVERNANCEPERFORMANCE REVIEWSTRATEGY & BUSINESSABOUT
TREASURY SHARESOn December 31, 2017, we had 56,140,153 outstanding common shares excluding 6,157,241
treasury shares. This compared to 59,815,843 outstanding common shares and 3,981,551 treasury
shares at year-end 2016. Besides the cancellation of 1.5 million treasury shares in August 2017,
the change in the number of treasury shares in 2017 was the result of approximately 4.4 million
repurchased shares and approximately 745,000 treasury shares that were used as part of share
based payments.
2017
As per January 1:
Issued shares 63,797,394
Treasury shares 3,981,551
Outstanding shares 59,815,843
Changes during the year:
Cancellation of treasury shares 1,500,000
Share buybacks 4,420,946
Treasury shares used for share based performance programs 745,256
As per December 31:
Issued shares 62,297,394
Treasury shares 6,157,241
Outstanding shares 56,140,153
RETAINED EARNINGSDistributions to common shareholders are limited to the extent the total amount of shareholders’
equity exceeds the amounts of nominal paid-in share capital (exclusive any share premium) and any
reserves to be formed pursuant to law or the Company’s Articles of Association. The amounts are
derived from the Company financial statements of ASMI.
ASMI aims to pay a sustainable annual dividend. The Supervisory Board, upon proposal of the
Management Board, will annually assess the amount of dividend that will be proposed to the AGM.
The decision that a dividend be proposed to the AGM will be subject to the availability of distributable
profits as well as retained earnings and may be affected by our potential future funding requirements.
Accordingly, dividend payments may fluctuate and could decline or be omitted in any year.
In 2017, we paid a dividend of €0.70 per common share. We will propose to the forthcoming 2018
AGM to declare a dividend of €0.80 per share.
Results on dilution of investments in associates are accounted for directly in equity. For 2017 and
2016, these dilution results were €606 and €2,814 respectively.

132ANNUAL REPORT 2017
SHAREHOLDERS & GENERAL INFORMATIONFINANCIAL STATEMENTSGOVERNANCEPERFORMANCE REVIEWSTRATEGY & BUSINESSABOUT
OTHER RESERVESThe changes in the amount of other reserves are as follows:
PROPORTIONATE SHARE IN OTHER
COMPREHENSIVE INCOME INVEST-
MENTS IN ASSOCIATES 1)
REMEASUREMENTON NET DEFINED
BENEFITTRANSLATION
RESERVE
TOTAL OTHER
RESERVES
BALANCE JANUARY 1, 2016 (1,132) – 191,895 190,763Proportionate share in other comprehensive income investments in associates (1,344) – – (1,344)Foreign currency translation effect on translation of foreign operations – – 40,069 40,069
BALANCE DECEMBER 31, 2016 (2,476) 231,964 229,488
Proportionate share other comprehensive income investments in associates (2,580) – – (2,580)Remeasurement on net defined benefit – (264) 3 (261)Foreign currency translation effect on translation of foreign operations – (172,893) (172,893)
BALANCE DECEMBER 31, 2017 (5,056) (264) 59,074 53,7541 Proportionate share in other comprehensive income investments in associates and translation reserve, items may be
subsequently reclassified to profit or loss.
NOTE 12. EMPLOYEE BENEFITS
PENSION PLANSThe Company has retirement plans covering substantially all employees. The principal plans are
defined contribution plans, except for the plans of the Company’s operations in the Netherlands
and Japan.
Multi-employer planThere are 141 eligible employees in the Netherlands. These employees participate in a multi-
employer union plan (Pensioenfonds van de Metalektro PME) determined in accordance with the
collective bargaining agreements effective for the industry in which we operate. This current collective
bargaining agreement ends on May 31, 2018. This multi-employer union plan, accounted for
as a defined contribution plan, covers approximately 1,300 companies and approximately 145,000
contributing members. Our contribution to the multi-employer union plan was less than five percent
of the total contribution to the plan. The plan monitors its risks on a global basis, not by participating
company or employee, and is subject to regulation by Dutch governmental authorities. By law
(the Dutch Pension Act), a multi-employer union plan must be monitored against specific criteria,
including the coverage ratio of the plan’s assets to its obligations. As of January 1, 2015, new
pension legislation has been enacted. This legislation results in amongst others, an increase of legally
required coverage levels. The coverage percentage is calculated by dividing the funds capital by the
total sum of pension liabilities and is based on actual market interest rates. The coverage ratio as per
December 31, 2017 of 101.6% (December 31, 2016: 96.2%) is calculated giving consideration to the
pension legislation and is below the legally required level. We have however no obligation to pay off
any deficits the pension fund may incur, nor do we have any claim to any potential surpluses.
Every company participating in the PME contributes a premium calculated as a percentage of its
total pensionable salaries, with each company subject to the same contribution rate. The premium
can fluctuate yearly based on the coverage ratio of the multi-employer union plan, for 2017 the
contribution percentage was 22.9%. The pension rights of each employee are based upon the
employee’s average salary during employment.
Our net periodic pension cost for this multi-employer union plan for any period is the amount of the
required employer contribution for that period.

133ANNUAL REPORT 2017
SHAREHOLDERS & GENERAL INFORMATIONFINANCIAL STATEMENTSGOVERNANCEPERFORMANCE REVIEWSTRATEGY & BUSINESSABOUT
Defined benefit planThe Company’s employees in Japan participate in a defined benefit plan. The Company makes
contributions to defined benefit plans in Japan that provide pension benefits for employees
upon retirement. These are average-pay plans, based on the employees’ years of service and
compensation near retirement.
The most recent actuarial valuations of plan assets and the present value of the defined benefit
obligation were carried out on December 31, 2017. The present value of the defined benefit obligation
and the related current service cost and past service cost were measured using the projected unit
credit method. Significant actuarial assumptions for the determination of the defined obligation are
discount rate, future general salary increases and future pension increases.
The net liability of the plan developed as follows:
DECEMBER 31,
2016 2017
Defined benefit obligations 11,403 10,167
Fair value of plan assets 9,985 9,781
NET LIABILITY FOR DEFINED BENEFIT PLANS 1,418 386
The changes in defined benefit obligations and fair value of plan assets are as follows:
DECEMBER 31,
2016 2017
Defined benefit obligations
BALANCE JANUARY 1 9,800 11,403
Current service cost 702 747
Interest on obligation 84 52
Remeasurement result 736 (147)
Benefits paid (497) (926)
Foreign currency translation effect 578 (962)
BALANCE DECEMBER 31 11,403 10,167
Fair value of plan assets
BALANCE JANUARY 1 8,630 9,985
Interest income 80 48
Return on plan assets (211) 454
Company contribution 1,473 1,102
Benefits paid (497) (926)
Foreign currency translation effect 510 (882)
BALANCE DECEMBER 31 9,985 9,781
The defined benefit cost consists of the following:
DECEMBER 31,
2016 2017
Current service cost 702 747
Net interest costs 4 4
NET DEFINED BENEFIT COST 706 751
Reclassification to remeasurement – 866
Remeasurement on net defined benefit for the year – (602)
REMEASUREMENT ON NET DEFINED BENEFIT – 264
TOTAL DEFINED BENEFIT COST 706 1,015

134ANNUAL REPORT 2017
SHAREHOLDERS & GENERAL INFORMATIONFINANCIAL STATEMENTSGOVERNANCEPERFORMANCE REVIEWSTRATEGY & BUSINESSABOUT
The assumptions in calculating the actuarial present value of benefit obligations and net periodic
benefit cost are as follows:
2016 2017
Discount rate for defined benefit obligations 0.50% 0.50%
Discount rate for defined benefit cost 0.80% 0.50%
Assumptions regarding life expectancy are based on mortality tables published in 2014 by the
Ministry of Health, Labour and Welfare of Japan.
The main risk on the pension plan relates to the discount rate. The defined benefit obligation
is sensitive to a change in discount rates, a relative change of the discount rate of 25 basis points
would have resulted in a change in the defined benefit obligation of 2.7%.
The allocation of plan assets is as follows:
DECEMBER 31,
2016 2017
Cash and cash equivalent 80 1% 95 1%
Equity Instruments 1,723 17% 1,827 19%
Debt instruments 950 10% 1,029 11%
Assets held by insurance company 7,232 72% 6,830 69%
TOTAL 9,985 100% 9,781 100%
The investment strategy is determined based on an asset-liability study in consultation with
investment advisors and within the boundaries given by the regulatory bodies for pension funds.
Equity instruments consist primarily of publicly traded Japanese companies and common collective
funds. Publicly traded equities are valued at the closing prices reported in the active market in which
the individual securities are traded (level 1). Common collective funds are valued at the published
price (level 1) per share multiplied by the number of shares held as of the measurement date.
Debt instruments consists of government bonds and are valued at the closing prices in the active
markets for identical assets (level 1). Assets held by insurance company consist of bonds and loans,
government securities and common collective funds. Corporate and government securities are
valued by third-party pricing sources (level 2). Common collective funds are valued at the net asset
value per share (level 2) multiplied by the number of shares held as of the measurement date.
The plan assets do not include any of the Company’s shares.
Retirement plan costsASMI contributed €1,102 to the defined benefit plan in 2017 (€1,473 in 2016). The Company expects
to pay benefits for years subsequent to December 31, 2017 as follows:
EXPECTED CONTRIBUTION DEFINED BENEFIT PLAN
2018 820
2019 366
2020 305
2021 355
2022 753
Aggregate for the years 2023-2027 3,130
TOTAL 5,729
The Company does not provide for any significant post-retirement benefits other than pensions.
MANAGEMENT BOARD AND EMPLOYEE AND LONG-TERM INCENTIVE PLANThe Company has adopted various share plans (e.g. stock option plans, a restricted share plan
and a performance share plan) and has entered into share agreements with the Management Board
and various employees. Under the stock option plans, the Management Board and employees may
purchase per the vesting date a specific number of shares of the Company’s common stock at a
certain price. Options are priced at market value in euros or US dollars on the date of grant. Under
the restricted share plan, employees receive per the vesting date a specific number of shares of the
Company’s common stock. Under the performance share plan, the Management Board receives per
the vesting date, and provided the performance criteria have been met, a specific number of shares
of the Company’s common stock.
Authority to issue options and sharesBy resolution of the Annual General Meeting of Shareholders (AGM) of May 22, 2017, the formal
authority to issue options and shares was allocated to the Management Board subject to the
approval of the Supervisory Board. This authority is valid for 18 months and needs to be refreshed
by the 2018 AGM to allow the continued application of the long-term incentive (LTI) plans beyond
November 22, 2018.

135ANNUAL REPORT 2017
SHAREHOLDERS & GENERAL INFORMATIONFINANCIAL STATEMENTSGOVERNANCEPERFORMANCE REVIEWSTRATEGY & BUSINESSABOUT
The ASMI 2014 long-term incentive plan for employees (ELTI) is principally administered by the
Management Board and the ASMI 2014 long-term incentive plan for members of the Management
Board (MLTI) is principally administered by the Supervisory Board. This complies with applicable
corporate governance standards. However, the Supervisory Board has no power to represent
the Company. For external purposes the Management Board remains the competent body under
both LTI plans. The LTI plans envisage that the Supervisory Board, or in the case of the ELTI the
Management Board with the approval of the Supervisory Board, will determine the number of options
and shares to be granted to the Management Board members and to employees.
2011 Long-Term Incentive PlanIn 2011 a stock option plan was adopted. In this plan to limit potential dilution, the amount
of outstanding (vested and non-vested) options granted to the Management Board and to other
employees will not exceed 7.5% of the issued ordinary share capital of ASMI. The stock option plan
2011 consists of two sub-plans: the ASMI stock option plan for employees (ESOP) and the ASMI
stock option for members of the Management Board (MSOP).
For employees and existing Management Board members the grant date for all options granted
is December 31 of the relevant year. In each of these situations, the three-year vesting period starts
at the grant date. The exercise price in euros of all options issued under the ESOP and the MSOP
is determined on the basis of the market value of the ASMI shares at (i.e. immediately prior to) the
grant date.
The exercise period is four years starting at the third anniversary of the grant date.
The following table is a summary of changes in options outstanding under the 2011 and previous
long-term incentive plan:
EURO-PLANS US DOLLAR-PLANS
NUMBER OF OPTIONS
WEIGHTED AVERAGE
EXERCISE PRICE IN €
NUMBER OF
OPTIONS
WEIGHTED AVERAGE
EXERCISE PRICE IN US$
BALANCE JANUARY 1, 2016 2,012,710 21.09 22,209 19.91
Options forfeited (74,492) 23.73 (4,717) 29.69
Options expired (4,128) 22.93 – –
Options exercised (638,958) 19.70 (16,493) 17.31
BALANCE DECEMBER 31, 2016 1,295,132 21.63 999 16.62
Options forfeited – – – –
Options expired (2,179) 21.13 – –
Options exercised (626,444) 21.14 (999) 16.62
BALANCE DECEMBER 31, 2017 666,509 22.09 – –
The total intrinsic value of options exercised was €13,293 for the year ended December 31, 2017
(2016: €12,882). In 2017 treasury shares have been sold for the exercise of 626,939 options.
On December 31, 2017, options outstanding and options exercisable classified by range of exercise
prices are:
OPTIONS OUTSTANDING OPTIONS EXERCISABLE
RANGE OF
EXERCISE
PRICESNUMBER
OUTSTANDING
WEIGHTEDAVERAGE
REMAINING CONTRACTUAL
LIFE
WEIGHTED AVERAGE
EXERCISEPRICE
NUMBER EXERCISABLE
WEIGHTED AVERAGE
EXERCISEPRICE
Euro plans In years In EUR In EUR
€1.00-15.00 – – – – –
€15.01-20.00 195,346 1.0 18.93 195,346 18.93
€20.01-25.00 471,163 2.6 23.40 471,163 23.40
€1.00-25.00 666,509 2.1 22.09 666,509 22.09
At December 31, 2017, the aggregate intrinsic value of all options outstanding and exercisable under
these plans is €37,571.

136ANNUAL REPORT 2017
SHAREHOLDERS & GENERAL INFORMATIONFINANCIAL STATEMENTSGOVERNANCEPERFORMANCE REVIEWSTRATEGY & BUSINESSABOUT
Under these plans, no more options to purchase shares can be issued. Under the various stock option
plans a total of 666,509 options to purchase common stock were outstanding at December 31,
2017, expiring at various dates through 2020.
2014 Long-Term Incentive PlanIn 2014 a new long-term incentive plan was adopted. In the new plan to limit potential dilution, the
amount of outstanding (vested and non-vested) options and shares granted to the Management
Board and to other employees will not exceed 5% of the issued ordinary share capital of ASMI. The
new long-term incentive plan 2014 consists of two sub-plans: ELTI and the MLTI.
Options and performance shares are issued to Management Board members and restricted shares
are issued to employees once per annum on the date following the publication of the first-quarter
results of the relevant year. Possible grant to newly-hired employees can be issued once a quarter,
on the date following the publication of the financial results of the relevant quarter. The number
of options and shares outstanding under the long-term incentive plans or under any other plan
or arrangement in aggregate may never exceed 5% of ASMI’s share capital. In accordance with the
ASMI remuneration policy, an exception is made for a transition period of four years, during which the
dilution may exceed 5% but will not exceed 7.5%.
Performance and restricted shares outstandingThe following table is a summary of changes in performance shares and restricted shares outstanding
under the 2014 long-term incentive plan.
NUMBER OF PERFORMANCE
SHARES
NUMBER OF RESTRICTED
SHARES STATUS
FAIR VALUE AT GRANT
DATE (WEIGHTED
AVERAGE)
BALANCE JANUARY 1, 2016 12,994 166,337
Shares granted, employees – 206,726 Unconditional €35.36
Shares granted, Management Board 16,651 – Conditional €34.67
Shares vested – (55,041)
Shares forfeited – (10,517)
BALANCE DECEMBER 31, 2016 29,645 307,505
Shares granted, employees – 149,197 Unconditional €52.29
Shares granted, Management Board 17,413 – Conditional €51.75
Shares vested – (118,317)
Shares forfeited – (31,850)
BALANCE DECEMBER 31, 2017 47,058 306,535
In 2017, treasury shares were sold for the vesting of 118,317 restricted shares.
Options outstandingThe following table is a summary of changes in options outstanding under the 2014 long-term
incentive plan.
NUMBER OF OPTIONS
EXERCISE PRICE IN €
FAIR VALUE AT GRANT DATE
BALANCE JANUARY 1, 2015 –
Options granted, April 24, 2015 42,659 44.24 €17.33
BALANCE DECEMBER 31, 2015 42,659
Options granted, April 22, 2016 62,555 37.09 €12.64
BALANCE DECEMBER 31, 2016 105,214
Options granted, April 21, 2017 24,963 51.55 €14.57
BALANCE DECEMBER 31, 2017 130,177

137ANNUAL REPORT 2017
SHAREHOLDERS & GENERAL INFORMATIONFINANCIAL STATEMENTSGOVERNANCEPERFORMANCE REVIEWSTRATEGY & BUSINESSABOUT
The cost relating to stock options is measured at fair value on the grant date. The fair value for the
stock options granted in 2017 was determined using the Black-Scholes option valuation model with
the following weighted average assumptions:
2017
Expected life (years) 7
Risk-free interest rate 1.36%
Dividend yield 1.86%
Expected volatility 32.58%
Exercise price €51.55
Fair value per grant date €14.57
The expected volatility measured at the standard deviation of continuously compounded share
returns is based on statistical analysis of daily share prices over the last seven years.
At December 31, 2017, the aggregate intrinsic value of all options outstanding under the 2014 long-
term incentive plan is €7,338.
Share-based payments expensesThe grant date fair value of the stock options, the restricted shares and the performance shares
is expensed on a straight-line basis over the vesting period, based on the Company’s estimate
of stock options, restricted shares and performance shares that will eventually vest. The impact
of the true up of the estimates is recognized in the Consolidated statement of profit or loss in the
period in which the revision is determined. We recorded compensation expenses of €7,801 for 2017
(2016: €8,387).
NOTE 13. PROVISION FOR WARRANTYThe changes in the amount of provision for warranty are as follows:
DECEMBER 31,
2016 2017
BALANCE JANUARY 1 9,023 5,800
Charged to cost of sales 3,576 9,682
Deductions (4,065) (7,361)
Releases of expired warranty (2,906) (1,108)
Foreign currency translation effect 172 (451)
BALANCE DECEMBER 31 5,800 6,562
Costs of warranty include the cost of labor and materials to repair a product during the warranty
period. The main term of the warranty period is one year. The Company accrues for the estimated
cost of the warranty on its products shipped in the provision for warranty, upon recognition of the
sale of the product. The costs are estimated based on actual historical expenses incurred and
on estimated future expenses related to current sales, and are updated periodically. Actual warranty
costs are charged against the provision for warranty.
NOTE 14. ACCRUED EXPENSES AND OTHER PAYABLESAccrued expenses and other payables consist of the following:
DECEMBER 31,
2016 2017
Personnel-related items 24,051 29,456
Deferred revenue 9,389 9,879
Financing related items 1,175 5,146
Other 14,079 14,473
TOTAL ACCRUED EXPENSES AND OTHER PAYABLES 48,694 58,954
Personnel-related items comprise accrued management bonuses, accrued vacation days, accrued
wage tax, social securities and pension premiums. Deferred revenue consists of the revenue
relating to the undelivered elements of the arrangements. This part of revenue is deferred at their
relative selling prices until delivery of these elements. Financing related items comprises the accrual
for settlement of shares repurchased. Other includes accruals for VAT and other taxes and down
payments from customers.
NOTE 15. CREDIT FACILITYAs per December 31, 2017, ASMI was debt-free. ASMI may borrow under separate short-term
lines of credit with banks under an unsecured €150 million standby credit facility with a consortium
of banks.
Total short-term lines of credit amounted to €150 million on December 31, 2017. The amount
outstanding at December 31, 2017 was nil, so the undrawn portion totaled €150 million. The undrawn
portion represents the Company’s standby revolving credit facility of €150 million with a consortium
of banks. The facility will be available through December 16, 2021, with an extension option for up to
two years.

138ANNUAL REPORT 2017
SHAREHOLDERS & GENERAL INFORMATIONFINANCIAL STATEMENTSGOVERNANCEPERFORMANCE REVIEWSTRATEGY & BUSINESSABOUT
The credit facility of €150 million includes two financial covenants:
› minimum consolidated tangible net worth; and
› consolidated total net debt/total equity ratio.
These financial covenants are measured twice each year, at June 30 and December 31.
The minimum level of consolidated tangible net worth for the year ended December 31, 2017
required was €450 million, the consolidated tangible net worth as per that date was €1,462 million.
Consolidated tangible net worth is defined as the net assets, deducting any amount shown in respect
of goodwill or other intangible assets (including any value arising from any valuation of ASMPT).
Total equity is defined as the aggregate of:
› the amounts paid up on the issued common shares;
› share capital in excess of par value;
› retained earnings;
› accumulated other comprehensive income and loss; and
› deducting any amount shown in respect of goodwill or other intangible assets.
The net debt/total equity ratio should not exceed 1.5. For the year ended December 31, 2017, net
cash was €836 million and total equity amounted to €2,012 million. The Company is in compliance
with these financial covenants as of December 31, 2017.
ASMI does not provide guarantees for borrowings of ASMPT and there are no guarantees from
ASMPT to secure indebtedness of ASMI. Under the rules of the Stock Exchange of Hong Kong,
ASMPT is precluded from providing loans and advances other than trade receivables in the normal
course of business, to ASMI or its non-ASMPT subsidiaries.
NOTE 16. FINANCIAL INSTRUMENTS AND FINANCIAL RISK MANAGEMENT
FINANCIAL INSTRUMENTSFinancial instruments include:
DECEMBER 31,
2016 2017
Financial assets:
Cash and cash equivalents 378,157 836,461
Accounts receivable 137,020 163,135
Financial liabilities:
Accounts payable 60,910 79,349
The carrying amounts of cash and cash equivalents, accounts receivable and accounts payable
equal their fair values because of the short-term nature of these instruments.
Gains or losses related to financial instruments are as follows:
2016 2017
Interest income 3,095 1,683
Interest expense (1,096) (1,799)
Result from foreign currency exchange 13,032 (30,546)
Addition to allowance for doubtful accounts receivable (52) –
Fair value is the price that would be received to sell an asset or paid to transfer a liability in an orderly
transaction between market participants at the measurement date. ASMI uses the following fair value
hierarchy, which prioritizes the inputs to valuation techniques used to measure fair value into three
levels and bases the categorization within the hierarchy upon the lowest level of input that is available
and significant to the fair value measurement:

139ANNUAL REPORT 2017
SHAREHOLDERS & GENERAL INFORMATIONFINANCIAL STATEMENTSGOVERNANCEPERFORMANCE REVIEWSTRATEGY & BUSINESSABOUT
Level 1Quoted prices in active markets that are accessible at the measurement date for identical assets
and liabilities.
Level 2Inputs other than Level 1 that are observable, either directly or indirectly, such as quoted prices
for similar assets or liabilities, quoted prices in markets that are not active, or other inputs that are
observable or can be corroborated by observable market data for substantially the full term of the
assets or liabilities.
Level 3Unobservable inputs that are supported by little or no market activity and that are significant to the
fair value of the assets or liabilities.
There were no transfers between levels during the years ended December 31, 2017 and December
31, 2016.
FINANCIAL RISK FACTORSASMI is exposed to a number of risk factors: market risks (including foreign exchange risk), credit
risk, liquidity risk and equity price risk. The Company may use forward exchange contracts to hedge
its foreign exchange risk. The Company does not enter into financial instrument transactions for
trading or speculative purposes.
Foreign exchange riskASMI and its subsidiaries conduct business in a number of foreign countries, with certain transactions
denominated in currencies other than the functional currency of the Company (Euro) or one of its
subsidiaries conducting the business. The purpose of the Company’s foreign currency management
is to manage the effect of exchange rate fluctuations on income, expenses, cash flows and assets
and liabilities denominated in selected foreign currencies, in particular denominated in US dollars.
We may use forward exchange contracts to hedge our foreign exchange risk of anticipated sales
or purchase transactions in the normal course of business, which occur within the next twelve
months, for which we have a firm commitment from a customer or to a supplier. The terms of these
contracts are consistent with the timing of the transactions being hedged. The hedges related
to forecasted transactions are designated and documented at the inception of the hedge as cash
flow hedges, and are evaluated for effectiveness on a quarterly basis. The effective portion of the
gain or loss on these hedges is reported as a component of accumulated other comprehensive
income (loss) net of taxes in equity, and is reclassified into earnings when the hedged transaction
affects earnings.
Changes in the fair value of derivatives that do not qualify for hedge treatment, as well as the
ineffective portion of any hedges, are recognized in earnings. We record all derivatives, including
forward exchange contracts, on the statement of financial position at fair value in accrued expenses
and payables. Should contracts extend beyond one year, these are classified as long-term.
Furthermore, we might manage the currency exposure of certain receivables and payables using
derivative instruments, such as forward exchange contracts (fair value hedges) and currency
swaps, and non-derivative instruments, such as debt borrowings in foreign currencies. The gains
or losses on these instruments provide an offset to the gains or losses recorded on receivables and
payables denominated in foreign currencies. The derivative instruments are recorded at fair value
and changes in fair value are recorded in earnings under foreign currency exchange gains (losses)
in the Consolidated statement of profit or loss. Receivables and payables denominated in foreign
currencies are recorded at the exchange rate at the balance sheet date and gains and losses as a
result of changes in exchange rates are recorded in earnings under foreign currency exchange gains
(losses) in the consolidated statement of profit or loss.
We do not use forward exchange contracts for trading or speculative purposes. Financial assets
and financial liabilities are recognized on the Company’s Consolidated statement of financial position
when the Company becomes a party to the contractual provisions of the instrument.
To the extent that exchange rate fluctuations impact the value of the Company’s investments in its
foreign subsidiaries, they are not hedged. The cumulative effect of these fluctuations is separately
reported in consolidated equity. Reference is made to Note 11.
Per December 31, 2016 and December 31, 2017, there were no forward exchange
contracts outstanding.

140ANNUAL REPORT 2017
SHAREHOLDERS & GENERAL INFORMATIONFINANCIAL STATEMENTSGOVERNANCEPERFORMANCE REVIEWSTRATEGY & BUSINESSABOUT
The following table analyzes the Company’s sensitivity to a hypothetical 10% strengthening and 10%
weakening of the US dollar, Singapore dollar, Korean won and Japanese yen against the euro as of
December 31, 2016 and December 31, 2017. This analysis includes foreign currency-denominated
monetary items and adjusts their translation at year end for a 10% increase and 10% decrease
against the euro.
IMPACT ON FINANCIAL INSTRUMENTS
(EUR thousand) 2016 2017
10% increase of US dollar versus euro 36,166 35,843
10% decrease of US dollar versus euro (36,166) (35,843)
10% increase of Singapore dollar versus euro 276 (400)
10% decrease of Singapore dollar versus euro (276) 400
10% increase of Korean won versus euro 1,409 2,760
10% decrease of Korean won versus euro (1,409) (2,760)
10% increase of Japanese yen versus euro 676 737
10% decrease of Japanese yen versus euro (676) (737)
A hypothetical 10% strengthening or 10% weakening of any other currency against the euro as of
December 31, 2016 and December 31, 2017, would not result in a material impact on net earnings.
Interest riskWe are exposed to interest rate risk through our cash deposits. The Company does not enter into
financial instrument transactions for trading or speculative purposes or to manage interest rate
exposure. As per December 31, 2017, the Company had no debt and was not exposed to interest
rate risk on borrowings.
Credit riskFinancial instruments that potentially subject the Company to concentrations of credit risk consist
primarily of cash and cash equivalents, accounts receivable and derivative instruments. These
instruments contain a risk of counterparties failing to discharge their obligations. We monitor
credit risk and manage credit risk exposure by type of financial instrument by assessing the
creditworthiness of counterparties. We do not anticipate non-performance by counterparties given
their high creditworthiness.
Our customers are semiconductor device manufacturers located throughout the world. We perform
ongoing credit evaluations of our customers’ financial condition. We take additional measures
to mitigate credit risk when considered appropriate by means of down payments or letters of credit.
We generally do not require collateral or other security to support financial instruments with credit risk.
Concentrations of credit risk (whether on- or off-balance sheet) that arise from financial instruments
exist for groups of customers or counterparties when they have similar economic characteristics
that would cause their ability to meet contractual obligations to be similarly affected by changes
in economic or other conditions.
We derive a significant percentage of our revenue from a small number of large customers. The ten
largest customers accounted for approximately 83.1% of net sales in 2017 (2016: 78.5%). Included
in net sales are revenues of approximately €437 million (2016: €279 million) to customers contributing
more than 10% of total net sales. Sales to these large customers also may fluctuate significantly from
time to time depending on the timing and level of purchases by these customers. Significant orders
from such customers may expose the Company to a concentration of credit risk and difficulties
in collecting amounts due, which could harm the Company’s financial results.
We invest our cash and cash equivalents in short-term deposits, money market funds and derivative
instruments with high-rated financial institutions. We only enter into transactions with a limited
number of major financial institutions that have high credit ratings and we closely monitor the
creditworthiness of our counterparties. Concentration risk is mitigated by not limiting the exposure
to a single counter party.
The maximum credit exposure is equal to the carrying values of cash and cash equivalent, and
accounts receivable.
Liquidity riskOur policy is to maintain a strong capital base so as to maintain investor, creditor and market
confidence and to sustain future development of the business.
Our liquidity needs are affected by many factors, some of which are based on the normal on-going
operations of the business, and others that relate to the uncertainties of the global economy and
the semiconductor industry. Although our cash requirements fluctuate based on the timing and
extent of these factors, we believe that cash generated from operations, together with our principal
sources of liquidity are sufficient to satisfy our current requirements, including our expected capital
expenditures in 2018.

141ANNUAL REPORT 2017
SHAREHOLDERS & GENERAL INFORMATIONFINANCIAL STATEMENTSGOVERNANCEPERFORMANCE REVIEWSTRATEGY & BUSINESSABOUT
We intend to return cash to our shareholders on a regular basis in the form of dividend payments and,
subject to our actual and anticipated liquidity requirements and other relevant factors, share buybacks.
The following table summarizes the Company’s contractual and other obligations as at December 31,
2017.
TOTALLESS THAN
1 YEAR 1-3 YEARS 3-5 YEARSMORE THAN
5 YEARS
Accounts payable 79,349 79,349 – – –
Income tax payable 6,575 6,575 – – –
Accrued expenses and other payables 58,954 58,954 – – –
Operating leases 19,065 6,892 7,271 3,542 1,360
Pension liabilities 5,729 820 671 1,108 3,130
Purchase obligations:Purchase commitments to suppliers 111,627 107,793 3,790 27 17
Capital expenditure and other commitments 33,774 32,100 1,544 130 –
TOTAL CONTRACTUAL OBLIGATIONS 315,073 292,483 13,276 4,807 4,507
Total short-term lines of credit amounted to €150,000 at December 31, 2017. The amount outstanding
at December 31, 2017 was nil and the undrawn portion totaled €150,000. The standby revolving credit
facility of €150,000 with a consortium of banks will be available through December 16, 2021.
For the majority of purchase commitments, the Company has flexible delivery schedules depending
on the market conditions, which allows the Company, to a certain extent, to delay delivery beyond
originally planned delivery schedules.
Equity price riskThe shares of ASMPT, our 25.18% equity investment, are listed on the Hong Kong Stock Exchange.
If the fair value of an investment is less than its carrying value at the balance sheet date, the Company
determines whether the impairment is temporary or prolonged. The amount per share recognized
as per December 31, 2017 under equity accounting amounts to HK$66.47, whereas the level
1 fair value per share (being the market price of a share on the Hong Kong Stock Exchange) was
HK$108.90. Management concluded that, based on quantitative analysis no impairment of its share
in ASMPT existed as per December 31, 2017.
NOTE 17. COMMITMENTS AND CONTINGENCIESOn December 31, 2017, operating leases having initial or remaining non-cancelable terms in excess
of one year are as follows:
2016 2017
Not later than 1 year 6,365 6,892
Between 1 and 5 years 9,832 10,813
Later than 5 years 326 1,360
TOTAL 16,523 19,065
Operating lease obligations include leases of equipment and facilities. Lease payments
recognized as an expense were €7,179 for the year ended December 31, 2017 (2016: €6,913).
Per December 31, 2017, the Company had entered into purchase commitments with suppliers in the
amount of €107,793 for purchases within the next 12 months. Commitments for capital expenditures
and other commitments per December 31, 2017 were €32,100 within the next 12 months.
CHANGE OF CONTROL TRANSACTIONPursuant to our 1997 settlement agreement with Applied Materials, as amended and restated
in 1998, if we desire to effect a change of control transaction, as defined in the settlement agreement
which generally involves our operations and not our investment in ASMPT, with a competitor
of Applied Materials, we must first offer the change of control transaction to Applied Materials on the
same terms as we would be willing to accept from that competitor pursuant to a bona fide arm’s-
length offer made by that competitor.
NOTE 18. LITIGATIONASMI is a party to various legal proceedings incidental to its business. As is the case with other
companies in similar industries, the Company faces exposure from actual or potential claims and legal
proceedings. Although the ultimate result of legal proceedings cannot be predicted with certainty, it is
the opinion of the Company’s management that the outcome of any claim which is pending, either
individually or on a combined basis, will not have a material effect on the financial position of the
Company, its cash flows and result of operations.
In 2007, ASMI licensed Hitachi Kokusai under certain of its patents in the field of Atomic Layer
Deposition. The license agreement was renewed in 2012.
On August 30, 2017, ASMI initiated an arbitration with the American Arbitration Association against
Hitachi Kokusai for breach of the license agreement between the parties. At this point of time it is
unpredictable when the arbitration will be completed.

142ANNUAL REPORT 2017
SHAREHOLDERS & GENERAL INFORMATIONFINANCIAL STATEMENTSGOVERNANCEPERFORMANCE REVIEWSTRATEGY & BUSINESSABOUT
Following the expiration of the parties’ patent license agreement, ASMI filed, on December 1, 2017,
a suit for patent infringement against Hitachi Kokusai and its US subsidiary in the US District Court
for the Northern District of California. ASMI has asserted infringement of three of its patents and
is seeking both an injunction and monetary damages.
Hitachi Kokusai subsequently filed suit on December 1, 2017 for alleged patent infringement against
ASMI in the US District Court for the Northern District of California. Hitachi Kokusai has asserted
seven patents and also seeks an injunction and monetary damages. No specific monetary amount
has been requested to date.
Thereafter, on February 20, 2018, Hitachi Kokusai initiated litigation in the District of Oregon asserting
four patents against ASMI. ASMI is evaluating the allegations in the Oregon action.
More information on risk categories and factors is provided on page 58.
NOTE 19. SEGMENT DISCLOSUREThe Company organizes its activities in two operating segments, Front-end and Back-end. Operating
segments are reported in a manner consistent with the internal reporting provided to the Chief
Executive Officer (CEO), which is the Chief Operating Decision Maker (CODM).
The Front-end segment manufactures and sells equipment used in wafer processing, encompassing
the fabrication steps in which silicon wafers are layered with semiconductor devices. The segment
is a product-driven organizational unit comprised of manufacturing, service, and sales operations
in Europe, the United States, Japan, South Korea and Southeast Asia.
The Back-end segment manufactures and sells equipment and materials used in assembly and
packaging, encompassing the processes in which silicon wafers are separated into individual circuits
and subsequently assembled, packaged and tested. The segment is organized in ASM Pacific
Technology Ltd, in which the Company holds a substantial share of 25.18% interest, whilst the
remaining shares are listed on the Stock Exchange of Hong Kong. The segment’s main operations
are located in Hong Kong, the People’s Republic of China, Singapore, Malaysia and Germany.
The Back-end segment remains reported as a separate segment since the cease of control per
March 15, 2013. Since that date, the segment is reported as an equity method investment as the
CEO reviews this information as part of his CODM package.
Accordingly, the asset and result information regarding the operations that comprise the segment are
disclosed. The full financial results are reviewed by the CODM, the external reporting of the segment
are on an equity method investment basis. The total of all segments’ financial amounts are reconciled
to the corresponding amounts reported in the Consolidated financial statements, eliminations are
reflected in the reconciling column for amounts reported in excess of those amounts reflected in the
Consolidated financial statements.
YEAR ENDED DECEMBER 31, 2016
FRONT-END
BACK-END 100% DECONSOLIDATED TOTAL
Net sales 597,930 1,666,859 (1,666,859) 597,930
Gross profit 264,500 626,717 (626,717) 264,500
Result from operations 82,241 231,794 (231,794) 82,241
Interest income 3,095 – – 3,095
Interest expense (1,096) (22,055) 22,055 (1,096)Foreign currency exchange gains (losses), net 13,032 – – 13,032Result on investments in associates – – 40,488 40,488
Income tax expense (2,289) (41,477) 41,477 (2,289)
Net earnings (loss) 94,983 168,262 (127,774) 135,471
Cash flows from operating activities 91,412 229,000 (229,000) 91,412
Cash flows from investing activities (60,094) (123,336) 145,419 (38,011)Cash flows from financing activities (125,798) (65,054) 65,054 (125,798)
Cash and cash equivalents 378,157 261,629 (261,629) 378,157
Goodwill 11,270 52,359 (52,359) 11,270
Other intangible assets 100,179 69,909 (69,909) 100,179
Investments in associates – – 1,218,024 1,218,024
Other identifiable assets 422,919 1,529,060 (1,529,060) 422,919
Total assets 912,525 1,912,957 (694,933) 2,130,549
Total debt – 315,590 (315,590) –
Headcount 1) 1,670 14,360 (14,360) 1,670
1 Headcount includes employees with a fixed contract, and excludes temporary workers.

143ANNUAL REPORT 2017
SHAREHOLDERS & GENERAL INFORMATIONFINANCIAL STATEMENTSGOVERNANCEPERFORMANCE REVIEWSTRATEGY & BUSINESSABOUT
YEAR ENDED DECEMBER 31, 2017
FRONT-END
BACK-END 100% DECONSOLIDATED TOTAL
Net sales 737,401 1,993,734 (1,993,734) 737,401
Gross profit 305,895 802,305 (802,305) 305,895
Result from operations 113,187 389,046 (389,046) 113,187
Interest income 1,683 3,532 (3,532) 1,683
Interest expense (1,799) (18,488) 18,488 (1,799)Foreign currency exchange gains (losses), net (30,546) (1,542) 1,542 (30,546)Result on investments in associates – – 89,614 89,614
Result from sale of ASMPT shares – – 284,898 284,898
Income tax expense (4,635) (54,453) 54,453 (4,635)
Net earnings (loss) 77,890 318,095 56,417 452,402
Cash flows from operating activities 116,060 184,447 (184,447) 116,060
Cash flows from investing activities 606,304 20,694 15,764 642,762Cash flows from financing activities (267,865) (159,690) 159,690 (267,865)
Cash and cash equivalents 836,461 252,443 (252,443) 836,461
Goodwill 11,270 43,608 (43,608) 11,270
Other intangible assets 113,295 57,842 (57,842) 113,295
Investments in associates – – 730,552 730,552
Other identifiable assets 485,624 1,630,749 (1,630,749) 485,624
Total assets 1,446,650 1,984,642 (1,254,090) 2,177,202
Total debt – 258,462 (258,462) –
Headcount 1) 1,900 16,400 (16,400) 1,900
1 Headcount includes employees with a fixed contract, and excludes temporary workers.
The accounting policies used to measure the net earnings and total assets in each segment are
consistent to those used in the Consolidated financial statements. The measurement methods used
to determine reported segment earnings are consistently applied for all periods presented. There
were no asymmetrical allocations to segments.
Geographical information is summarized as follows:
YEAR ENDED DECEMBER 31,
2016 2017
(EUR thousand) NET SALESPROPERTY, PLANT
AND EQUIPMENT NET SALESPROPERTY, PLANT
AND EQUIPMENT
United States €145,119 €38,648 €199,498 €41,438
Europe 113,833 7,148 106,672 8,493
Asia 338,978 49,208 431,231 56,701
€597,930 €95,004 €737,401 €106,632
For geographical reporting, net sales are attributed to the geographical location in which the
customer’s facilities are located.
NOTE 20. INCOME TAXESThe components of income before income taxes consist of:
YEAR ENDED DECEMBER 31,
2016 2017
The Netherlands 77,645 381,618
Other countries 60,115 75,419
INCOME BEFORE INCOME TAXES 137,760 457,037
The income tax expense consists of:
YEAR ENDED DECEMBER 31,
2016 2017
Current:
The Netherlands (959) (1,666)
Other countries (2,221) (5,651)
(3,180) (7,317)
Deferred:
The Netherlands – 2,812
Other countries 891 (130)
INCOME TAX (EXPENSE) BENEFIT (2,289) (4,635)

144ANNUAL REPORT 2017
SHAREHOLDERS & GENERAL INFORMATIONFINANCIAL STATEMENTSGOVERNANCEPERFORMANCE REVIEWSTRATEGY & BUSINESSABOUT
The provisions for income taxes as shown in the Consolidated statements of profit or loss differ from
the amounts computed by applying the Dutch statutory income tax rate to earnings before taxes.
A reconciliation of the provisions for income taxes and the amounts that would be computed using
the Dutch statutory income tax rate is set forth as follows:
YEAR ENDED DECEMBER 31,
2016 2017
EARNINGS BEFORE INCOME TAXES FROM CONTINUING OPERATIONS 137,760 100.0% 457,037 100.0%
Income tax provision based on Dutch statutory income tax rate (34,440) 25.0% (114,259) 25.0%
Non-deductible expenses (3,044) 2.2% (2,998) 0.7%Foreign taxes at a rate other than the Dutch statutory rate (315) 0.2% (885) 0.2%
Recognition of net operating losses 692 (0.5%) (2,905) 0.6%Utilization of net operating losses, previously not recognized 12,192 (8.9%) 4,394 (1.0%)
Non-taxable income 1) 11,819 (8.6%) 102,450 (22.4%)Adjustments in respect of prior years' current taxes 1,935 (1.4%) (161) –
Other 2) 8,872 (6.4%) 9,729 (2.1%)
TAX INCOME / (EXPENSE) (2,289) 1.7% (4,635) 1.0%1 Non-taxable income mainly consists of revenues deriving from the share in income of investments and associates
which are exempted under the Dutch participation exemption.2 Other mainly consists of tax credits, withholding taxes, changes in (enacted) tax laws and revaluation of certain assets.
On June 8, 2009, the Singapore Economic Development Board (EDB) granted a Pioneer Certificate
to ASM Front-end Manufacturing Singapore Pte Ltd (FEMS), a principal subsidiary of the Group,
to the effect that profits arising from certain manufacturing activities by FEMS of Front-end equipment
will in principle be exempted from tax for a period of 10 years effective from July 1, 2008, subject
to fulfillment of certain criteria during the period.
Since 2011 the Dutch statutory tax rate is 25%. Taxation for other jurisdictions is calculated at the
rates prevailing in the relevant jurisdictions. The Company’s deferred tax assets and liabilities have
been determined in accordance with these statutory income tax rates.
Deferred income taxes consist of the following:
JANUARY
1, 2016
CONSOLIDATED STATEMENT OF
PROFIT OR LOSS EQUITYEXCHANGE
DIFFERENCESDECEMBER
31, 2016
Deferred tax assets:Reserves and allowances 1,911 95 – 128 2,134Depreciation 2,353 386 – 117 2,856Recognition net operating losses 6,545 692 – 20 7,257Other 754 925 – (7) 1,672
DEFERRED TAX ASSETS 11,563 2,098 – 258 13,919
Deferred tax liabilities:Capitalized development expenses (11,282) (1,207) – (581) (13,070)Other (50) – – 2 (48)
DEFERRED TAX LIABILITIES (11,332) (1,207) – (579) (13,118)
NET DEFERRED INCOME TAXES 231 891 – (321) 801
JANUARY
1, 2017
CONSOLIDATED STATEMENT OF
PROFIT OR LOSS EQUITYEXCHANGE
DIFFERENCESDECEMBER
31, 2017
Deferred tax assets:Reserves and allowances 2,134 (169) 366 (30) 2,301Depreciation 2,856 4,156 – (261) 6,751Recognition net operating losses 7,257 (2,771) – (60) 4,426Other 1,672 3,153 – (187) 4,638
DEFERRED TAX ASSETS 13,919 4,369 366 (538) 18,116
Deferred tax liabilities:Capitalized development expenses (13,070) (1,737) – 943 (13,864)Other (48) 50 – (2) –
DEFERRED TAX LIABILITIES (13,118) (1,687) – 941 (13,864)
NET DEFERRED INCOME TAXES 801 2,682 366 403 4,252

145ANNUAL REPORT 2017
SHAREHOLDERS & GENERAL INFORMATIONFINANCIAL STATEMENTSGOVERNANCEPERFORMANCE REVIEWSTRATEGY & BUSINESSABOUT
Based on tax filings, ASMI and its individual subsidiaries have net operating losses available
at December 31, 2017 of €114,341 to reduce future income taxes, mainly in the Netherlands.
The Company believes that realization of its net deferred tax assets is dependent on the ability of the
Company to generate taxable income in the future. Given the volatile nature of the semiconductor
equipment industry, past experience, and the tax jurisdictions where the Company has net operating
losses, the Company believes that there is currently sufficient evidence to recognize a deferred tax
asset in the amount of €4,426. Deferred tax assets for temporary differences are recognized in the
Netherlands, United States, Japan, South Korea and Singapore.
The amounts and expiration dates of the net operating losses for tax purposes are as follows:
EXPIRATION YEAR
TOTAL OF NET OPERATING LOSSES FOR TAX PURPOSES
NET OPERATING LOSSES FOR TAX PURPOSES THE
NETHERLANDS
NET OPERATING LOSSES FOR TAX PURPOSES OTHER COUNTRIES
2019 13,345 13,345 –
2020 204 – 204
2021 58,478 58,478 –
2022 26,815 26,815 –
2023 16 – 16
2026 11,456 11,456 –
2030 1,585 – 1,585
2035 2,442 – 2,442
TOTAL 114,341 110,094 4,247
The Company has not provided for deferred foreign withholding taxes, if any, on undistributed
earnings of its foreign subsidiaries. At December 31, 2017, the undistributed earnings of subsidiaries,
subject to withholding taxes, were approximately €39,375. These earnings could become subject
to foreign withholding taxes if they were remitted as dividends and/or if the Company should sell its
interest in the subsidiaries.
A summary of open tax years by major jurisdiction is as follows:
JURISDICTION
Japan 2013-2017
The Netherlands 2014-2017
Singapore 2013-2017
United States of America 1998-2017
South Korea 2012-2017
The calculation of the Company’s tax liabilities involves dealing with uncertainties in the application
of complex tax laws. The Company’s estimate for the potential outcome of any unrecognized tax
benefits is highly judgmental. Settlement of unrecognized tax benefits in a manner inconsistent with
the Company’s expectations could have a material impact on the Company’s financial position, net
earnings and cash flows. The Company is subject to tax audits in its major tax jurisdictions, and local
tax authorities may challenge the positions taken by the Company.
NOTE 21. SELECTED OPERATING EXPENSES AND ADDITIONAL INFORMATIONPersonnel expenses for employees were as follows:
DECEMBER 31,
2016 2017
Wages and salaries 119,438 142,141
Social security 14,239 14,131
Pension expenses 5,544 5,931
Share-based payment expenses 8,387 7,801
Restructuring expenses 3,132 782
TOTAL 150,740 170,786
Personnel expenses are included in cost of sales and in operating expenses in the Consolidated
statement of profit or loss.

146ANNUAL REPORT 2017
SHAREHOLDERS & GENERAL INFORMATIONFINANCIAL STATEMENTSGOVERNANCEPERFORMANCE REVIEWSTRATEGY & BUSINESSABOUT
The number of employees, exclusive of temporary workers, by geographical area at year-end was
as follows:
DECEMBER 31,
GEOGRAPHICAL LOCATION 2016 2017
Europe:
– the Netherlands 141 143
– EMEA 162 171
United States 535 555
Japan 212 228
South Korea 157 221
Singapore 340 395
Asia, other 123 187
TOTAL 1,670 1,900
The number of employees, exclusive of temporary workers, by function at year-end was as follows:
DECEMBER 31,
PER FUNCTION 2016 2017
Research and development 447 497
Manufacturing 296 361
Marketing and sales 252 268
Customer service 506 597
Finance and administration 169 177
TOTAL 1,670 1,900
NOTE 22. RESEARCH AND DEVELOPMENTResearch and development consists of the following:
YEAR ENDED DECEMBER 31,
2016 2017
Research and development expenses 101,536 114,093
Capitalization of development expenses (26,484) (38,615)
Amortization of capitalized development expenses 13,345 13,288
Research and development grants and credits (843) (326)
TOTAL RESEARCH AND DEVELOPMENT EXPENSES 87,554 88,440
Impairment of research and development related assets 3,575 4,337
TOTAL 91,129 92,777
The impairment expenses in 2016 and 2017 related to customer specific projects.
The Company’s operations in the Netherlands, Belgium and the United States receive research and
development grants and credits from various sources.

147ANNUAL REPORT 2017
SHAREHOLDERS & GENERAL INFORMATIONFINANCIAL STATEMENTSGOVERNANCEPERFORMANCE REVIEWSTRATEGY & BUSINESSABOUT
NOTE 23. EARNINGS PER SHAREBasic net earnings per common share is calculated by dividing net income attributable to common
shareholders by the weighted average number of common shares outstanding for that period.
The dilutive effect is calculated using the treasury stock method. The calculation of diluted net
income per share assumes the exercise of options issued under our stock option plans (and the
issuance of shares under our share plans) for periods in which exercises (or issuances) would have
a dilutive effect. The calculation of diluted net income per share does not assume exercise of options
(or issuance of shares) when such exercises (or issuances) would be anti-dilutive.
The calculation of basic and diluted net income per share attributable to common shareholders
is based on the following data:
DECEMBER 31,
2016 2017
Net earnings used for purposes of calculating net income per common share
NET EARNINGS FROM OPERATIONS 135,471 452,402
Basic weighted average number of shares outstanding during the year (thousands) 60,616 58,573Effect of dilutive potential common shares from stock options and restricted shares 637 752
DILUTIVE WEIGHTED AVERAGE NUMBER OF SHARES OUTSTANDING 61,253 59,325
Basic net earnings per share:
from operations 2.23 7.72
Diluted net earnings per share:
from operations 2.21 7.63
NOTE 24. BOARD REMUNERATIONThe remuneration of members of the Management Board has been determined by the
Supervisory Board.
During 2017, the Company considered the members of the Management Board and the Supervisory
Board to be the key management personnel. Total remuneration for key management personnel
in 2017 amounts to €3,637 (2016: €3,315).
The following table sets information concerning all remuneration from the Company (including
its subsidiaries) for services in all capacities to all current members of the Management Board
of the Company:
BASE COMPEN-
SATION BONUSES PENSIONS
SHARE-BASED
PAYMENT EXPENSES 1)
FRINGE BENEFITS TOTAL
Management Board:
C.D. del Prado
2017 637 549 111 785 65 2,147
2016 607 398 97 750 63 1,915
P.A.M. van Bommel
2017 416 289 85 398 47 1,235
2016 408 204 68 435 40 1,155
1 These amounts represent the vesting expenses related to the financial year.
SHORT-TERM INCENTIVE (CASH BONUS)Each year, a short-term incentive can be earned, based on achieving specific challenging targets.
These targets are based for 75% on company financial targets and for 25% on non-financial targets.
The on-target bonus percentage for the CEO is 100% of base salary, with a maximum pay-out
of 150% of base salary. The on-target bonus percentage for the other members of the Management
Board is 75% of base salary, with a maximum pay-out of 125% of base salary. For the year 2017,
the Management Board partially met the company financial targets and met the non-financial targets.

148ANNUAL REPORT 2017
SHAREHOLDERS & GENERAL INFORMATIONFINANCIAL STATEMENTSGOVERNANCEPERFORMANCE REVIEWSTRATEGY & BUSINESSABOUT
LONG-TERM INCENTIVE (STOCK OPTIONS/PERFORMANCE SHARES)The members of the Management Board are eligible to receive stock options and performance
shares under the ASMI 2014 long-term incentive plan for members of the Management Board
in order to focus on the long-term interest of the company. Stock options vest after three years
subject to continued employment and expire after seven years. Performance shares vest after three
years subject to meeting certain conditions. The members of the Management Board are required
to hold the vested performance shares for an additional two years; however, they are allowed to sell
a part of the unconditional shares after three years for tax purposes. The next grant of stock options
and restricted shares will take place in April 2018.
PENSION ARRANGEMENTAs of 2015, the members of the Management Board no longer participate in the industry wide pension
fund. They are offered participation in a defined contribution plan for their salary up to €103,317.
For their salary above €103,317, the members of the Management Board are compensated with
an amount equal to the employer pension contribution. The members of the Management Board have
the option to participate in a net pension plan offered by the company or to have the compensation
paid out in cash.
FRINGE BENEFITSFringe benefits cover compensation related to the use of a (company) car, a representation and
expense allowance, social security premium and premium for health and disability insurance.
OUTSTANDING OPTIONSThe following table shows the outstanding options to purchase ASMI common shares held by current
members of the Management Board, and changes in such holdings during 2017:
YEAR OF GRANTOUTSTANDING
JANUARY 1, 2017 GRANTED IN 2017 EXERCISED IN 2017 3)OUTSTANDING
DECEMBER 31, 2017EXERCISE
PRICE END DATE
C.D. del Prado 1) 2009 58,967 – (58,967) – € 12.79 Nov 30, 2017
C.D. del Prado 2) 2011 88,450 – – 88,450 € 18.93 Dec 31, 2018
C.D. del Prado 2) 2012 70,760 – – 70,760 € 22.93 Dec 31, 2019
C.D. del Prado 2) 2013 75,000 – – 75,000 € 23.73 Dec 31, 2020
C.D. del Prado 2) 2015 28,050 – – 28,050 € 44.24 Apr 24, 2022
C.D. del Prado 2) 2016 41,589 – – 41,589 € 37.09 Apr 22, 2023
C.D. del Prado 2) 2017 – 16,757 – 16,757 € 51.55 Apr 21, 2024
P.A.M. van Bommel 2) 2010 29,483 – (29,483) – € 13.80 July 1, 2017
P.A.M. van Bommel 2) 2011 62,504 – – 62,504 € 18.93 Dec 31, 2018
P.A.M. van Bommel 2) 2012 47,173 – – 47,173 € 22.93 Dec 31, 2019
P.A.M. van Bommel 2) 2013 53,000 – – 53,000 € 23.73 Dec 31, 2020
P.A.M. van Bommel 2) 2015 14,609 – – 14,609 € 44.24 Apr 24, 2022
P.A.M. van Bommel 2) 2016 20,966 – – 20,966 € 37.09 Apr 22, 2023
P.A.M. van Bommel 2) 2017 – 8,206 – 8,206 € 51.55 Apr 21, 2024
TOTAL 590,551 24,963 (88,450) 527,0641 Options are granted for a term of eight years, and become exercisable after a three year vesting period.2 Options are granted for a term of seven years and become exercisable after a three year vesting period.3 Options of C.D. del Prado were exercised on November 28, 2017 at a share price of €60.53 and options of P.A.M. van Bommel were exercised on April 25, 2017 at a share price of €55.22.
The fair value of options granted to current members of the Management Board was €14.57 in 2017. In 2017, 88,450 options to purchase ASMI common shares were exercised and 88,450 treasury
shares were sold for the exercise of these options.

149ANNUAL REPORT 2017
SHAREHOLDERS & GENERAL INFORMATIONFINANCIAL STATEMENTSGOVERNANCEPERFORMANCE REVIEWSTRATEGY & BUSINESSABOUT
OUTSTANDING PERFORMANCE SHARESThe following table shows the outstanding performance shares granted to members of the Management
Board in 2017 and held by members of the Management Board per December 31, 2017:
GRANT DATE STATUS
NUMBER OF SHARES AT
GRANT DATE
FAIR VALUE AT GRANT
DATEVESTING
DATE
C.D. del Prado April 24, 2015 Conditional 8,544 €43.21 April 24, 2018
P.A.M. van Bommel April 24, 2015 Conditional 4,450 €43.21 April 24, 2018
C.D. del Prado April 22, 2016 Conditional 11,070 €34.67 April 22, 2019
P.A.M. van Bommel April 22, 2016 Conditional 5,581 €34.67 April 22, 2019
C.D. del Prado April 21, 2017 Conditional 11,689 €51.75 April 21, 2020
P.A.M. van Bommel April 21, 2017 Conditional 5,724 €51.75 April 21, 2020
The shares will become unconditional after three years, depending on the achievement
of predetermined targets. The financial targets to be achieved are measured over a three-
year performance period and relate to a sales growth compared to market and an average EBIT
percentage performance measure. The Management Board members will hold the unconditional
shares for at least an additional two years; however, they are allowed to sell a part of the unconditional
shares after three years for tax purposes.
The following table sets forth information concerning all remuneration (base compensation,
no bonuses or pensions were paid) from the Company (including its subsidiaries) for services in all
capacities to all current and former members of the Supervisory Board of the Company:
YEAR ENDED DECEMBER 31,
2016 2017
Supervisory Board:
J.C. Lobbezoo 70.0 70.0
J.M.R. Danneels 1) 20.0 –
H.W. Kreutzer 52.5 52.5
M.C.J. van Pernis 52.5 52.5
U.H.R. Schumacher 50.0 50.0
S. Kahle-Galonske 2) – 30.5
TOTAL 245.0 255.51 Period January 1 to May 25, 20162 Period as of May 22, 2017
The remuneration of members of the Supervisory Board has been determined by the Annual General
Meeting of Shareholders.
No stock options or performance shares have been granted to members of the Supervisory Board.
NOTE 25. SHARE OWNERSHIP AND RELATED PARTY TRANSACTIONSThe ownership or controlling interest of outstanding common shares of ASMI by members of the
Management Board and Supervisory Board or members of their immediate family are as follows:
DECEMBER 31, 2016 DECEMBER 31, 2017
SHARES OWNED
PERCENTAGE OF COMMON SHARES
OUTSTANDINGSHARES OWNED
PERCENTAGE OF COMMON SHARES
OUTSTANDING
C.D. del Prado (member of the Management Board) 896,437 1.50% 918,684 1.64%
The Company has a related party relationship with its subsidiaries, equity accounted investees and
members of the Supervisory Board and the Management Board. Related party transactions, if any,
are conducted on an at arm’s length basis with terms comparable to transactions with third parties.

150ANNUAL REPORT 2017
SHAREHOLDERS & GENERAL INFORMATIONFINANCIAL STATEMENTSGOVERNANCEPERFORMANCE REVIEWSTRATEGY & BUSINESSABOUT
NOTE 26. PRINCIPLE AUDITOR’S FEES AND SERVICESKPMG Accountants NV has served as our external auditor for the years 2017 and 2016. The table
sets out the aggregate fees for professional audit services and other services rendered by the
external auditors and its member firms and/or affiliates in 2017 and 2016. The fees mentioned in the
table for the audit of the financial statements 2017 (2016) relate to the total fees for the audit of the
financial statements 2017 (2016), irrespective of whether the activities have been performed during
the financial year 2017 (2016). The following fees were charged by KPMG Accountants N.V. to the
company, its subsidiaries and other consolidated companies, as referred to in Section 2:382a(1) and
(2) of the Dutch Civil Code.
2016 2017
KPMG ACCOUNTANTS
NVKPMG
NETWORKKPMG TOTAL
KPMG ACCOUNTANTS
NVKPMG
NETWORKKPMG TOTAL
Audit fees 370 95 465 515 125 640Audit-related fees 30 – 30 – – –
Tax fees – – – – – –
Other fees – – – – – –
TOTAL 400 95 495 515 125 640
AUDIT COMMITTEE PRE-APPROVAL POLICIESThe Audit Committee has determined that the provision of services by KPMG described in the
preceding paragraphs is compatible with maintaining KPMG’s independence. All audit and permitted
non-audit services provided by KPMG during 2017 were pre-approved by the Audit Committee.
The Audit Committee has adopted the following policies and procedures for pre-approval of all audit
and permitted non-audit services provided by our external auditor:
Audit servicesManagement submits to the Audit Committee for pre-approval the scope and estimated fees for
specific services directly related to performing the independent audit of our Consolidated financial
statements for the current year.
Audit-related servicesThe Audit Committee may pre-approve expenditures up to a specified amount for services included
in identified service categories that are related extensions of audit services and are logically performed
by the auditors. Additional services exceeding the specified pre-approved limits require specific Audit
Committee approval.
Tax servicesThe Audit Committee may pre-approve expenditures up to a specified amount per engagement and
in total for identified services related to tax matters. Additional services exceeding the specified pre-
approved limits, or involving service types not included in the pre-approved list, require specific Audit
Committee approval.
Other servicesIn the case of specified services for which utilizing our external auditor creates efficiencies, minimizes
disruption, or preserves confidentiality, or for which management has determined that our external
auditor possesses unique or superior qualifications to provide such services, the Audit Committee
may pre-approve expenditures up to a specified amount per engagement and in total. Additional
services exceeding the specified pre-approved limits, or involving service types not included in the
pre-approved list, require specific Audit Committee approval.
NOTE 27. SUBSEQUENT EVENTSSubsequent events were evaluated up to March 16, 2018, which is the issuance date of this Annual
Report 2017. There are no subsequent events to report.
NOTE 28. OTHER CURRENT ASSETSOther current assets consist of the following:
DECEMBER 31,
2016 2017
Prepayments 10,277 8,322
VAT receivable 5,959 5,650
Amounts to be invoiced 3,536 4,132
Other current assets 3,077 961
TOTAL 22,849 19,065

151ANNUAL REPORT 2017
SHAREHOLDERS & GENERAL INFORMATIONFINANCIAL STATEMENTSGOVERNANCEPERFORMANCE REVIEWSTRATEGY & BUSINESSABOUT
NOTE 29. CORRECTION OF ERRORS
Correction of errorsDuring 2017, the Company discovered that the dilution effect was erroneously not included for the
goodwill and other intangible assets of the associate ASMPT. As a consequence, the value of the
investment in associate was overstated. The errors have been corrected by restating each of the
affected financial statement line items for prior periods.
The following table summarizes the impact.
Consolidated Statement of Financial Position
JANUARY 1, 2016
AS PREVIOUSLY
REPORTED ADJUSTMENTSAS
RESTATED
INVESTMENTS IN ASSOCIATES 1,180,839 (10,530) 1,170,309
Others 895,138 – 895,138
TOTAL ASSETS 2,075,977 (10,530) 2,065,447
EQUITY 1,948,379 (10,530) 1,937,849
Liabilities 127,598 – 127,598
TOTAL EQUITY & LIABILITIES 2,075,977 (10,530) 2,065,447
DECEMBER 31, 2016
AS PREVIOUSLY
REPORTED ADJUSTMENTSAS
RESTATED
INVESTMENTS IN ASSOCIATES 1,235,738 (17,714) 1,218,024
Others 912,525 — 912,525
TOTAL ASSETS 2,148,263 (17,714) 2,130,549
EQUITY 2,015,856 (17,714) 1,998,142
Liabilities 132,407 — 132,407
TOTAL EQUITY & LIABILITIES 2,148,263 (17,714) 2,130,549
SIGNINGAlmere
March 16, 2018
SUPERVISORY BOARDJ.C. Lobbezoo
H.W. Kreutzer
M.C.J. van Pernis
U.H.R. Schumacher
S. Kahle-Galonske
MANAGEMENT BOARDC.D. del Prado
P.A.M. van Bommel

152ANNUAL REPORT 2017
SHAREHOLDERS & GENERAL INFORMATIONFINANCIAL STATEMENTSGOVERNANCEPERFORMANCE REVIEWSTRATEGY & BUSINESSABOUT
COMPANY BALANCE SHEET DECEMBER 31,
(EUR thousand) NOTES 2016 2017
Non-current assetsProperty, plant and equipment, net 5 191 339
Goodwill, net 4 11,270 11,270
Other intangible assets, net 3 13,584 13,841
Investments in subsidiaries 2 1,801,500 1,373,070
Loans to subsidiaries 2 54,877 46,863
Other non-current assets 809 754
Deferred tax assets 6 5,000 7,812
TOTAL NON-CURRENT ASSETS 1,887,231 1,453,949
Current assetsLoans to subsidiaries 2 – 1,892
Amounts due from subsidiaries 6,196 880
Other current assets 755 827
Cash and cash equivalents 111,984 568,185
TOTAL CURRENT ASSETS 118,935 571,784
TOTAL ASSETS 2,006,166 2,025,733
EquityCommon shares 2,552 2,492
Capital in excess of par value 225,837 218,525
Treasury shares (151,477) (304,654)
Legal reservesTranslation reserve 229,488 53,754
Other legal reserves 1,291,445 778,608
Accumulated net earnings 264,826 810,385
Net earnings current year 135,471 452,402
TOTAL EQUITY 7 1,998,142 2,011,512
Current liabilitiesAccounts payable 2,299 1,320
Amounts due to subsidiaries 2,104 1,052
Accrued expenses and other payables 8 3,621 11,849
TOTAL CURRENT LIABILITIES 8,024 14,221
TOTAL EQUITY AND LIABILITIES 2,006,166 2,025,733
(before proposed appropriation of net earnings for the year)
ASM INTERNATIONAL NV FINANCIAL STATEMENTS

153ANNUAL REPORT 2017
SHAREHOLDERS & GENERAL INFORMATIONFINANCIAL STATEMENTSGOVERNANCEPERFORMANCE REVIEWSTRATEGY & BUSINESSABOUT
COMPANY STATEMENT OF PROFIT OR LOSSYEAR ENDED DECEMBER 31,
(EUR thousand) 2016 2017
Operating expenses:
Selling, general and administrative (24,911) (25,406)
Research and development (1,056) (2,038)
TOTAL OPERATING EXPENSES (25,967) (27,444)
RESULT FROM OPERATIONS (25,967) (27,444)
Finance income 2,894 1,371
Finance expense (958) (1,429)
Foreign currency exchange gain, net 2,294 4,618
Intercompany charging operating expenses 23,255 3,568
Sale of stake in associate – 15,791
RESULT BEFORE INCOME TAXES 1,518 (3,525)
Income taxes (225) 2,618
NET EARNINGS FROM HOLDING ACTIVITIES 1,293 (907)
Net earnings from subsidiaries 134,178 453,309
TOTAL NET EARNINGS 135,471 452,402

154ANNUAL REPORT 2017
SHAREHOLDERS & GENERAL INFORMATIONFINANCIAL STATEMENTSGOVERNANCEPERFORMANCE REVIEWSTRATEGY & BUSINESSABOUT
NOTES TO THE COMPANY FINANCIAL STATEMENTSNOTE 1. SUMMARY OF SIGNIFICANT ACCOUNTING POLICIESASM International NV (ASMI or the Company) is a Dutch public liability company. Statutory seat:
Versterkerstraat 8, 1322 AP Almere, the Netherlands.
The description of our activities and our structure, as included in the Notes to the Consolidated
financial statements, also apply to the Company financial statements.
The accompanying Company financial statements are stated in thousands of euro unless
otherwise indicated.
ACCOUNTING POLICIES APPLIEDThe financial statements of the Company included in this section are prepared in accordance with
Part 9 of Book 2 of the Dutch Civil Code. Section 362 (8), Book 2, Dutch Civil Code, allows companies
that apply IFRS as endorsed by the European Union in their consolidated financial statements to use
the same measurement principles in their Company financial statements. The Company has prepared
these Company financial statements using this provision.
Participating interests in group companiesInvestments in subsidiaries are stated at net asset value as we effectively exercise influence
of significance over the operational and financial activities of these investments. For a list of all
subsidiaries see Note 2 of the Consolidated financial statements.
NOTE 2. INVESTMENTS AND LOANS DUE FROM SUBSIDIARIES
INVESTMENTS IN SUBSIDIARIES
LOANS DUE FROM
SUBSIDIARIES TOTAL
BALANCE JANUARY 1, 2016 1,669,910 53,270 1,723,180
Net result of subsidiaries 134,178 – 134,178
Other comprehensive income investments (1,344) – (1,344)
Dividend received (45,982) – (45,982)
Capitalizations 3,400 – 3,400
Dilution 2,814 – 2,814
Foreign currency translation effect 38,524 1,607 40,131
BALANCE DECEMBER 31, 2016 1,801,500 54,877 1,856,377
Net result of subsidiaries 453,309 – 453,309
Other comprehensive income investments (2,844) – (2,844)
Dividend received (728,997) – (728,997)
Capitalizations 422 – 422
Disposal of investments (80) – (80)
Reclassification to current assets – (1,892) (1,892)
Dilution 606 – 606
Foreign currency translation effect (150,846) (6,122) (156,968)
BALANCE DECEMBER 31, 2017 1,373,070 46,863 1,419,933
Interest relates mainly to a subsidiary and is based on the Bank of America’s prime rate with a rise
of two percent points. The repayment schedule of the loan is as follows: 24 annual installments
of US$2 million, starting December 31, 2018, followed by a final installment of US$5.3 million
on December 31, 2043.

155ANNUAL REPORT 2017
SHAREHOLDERS & GENERAL INFORMATIONFINANCIAL STATEMENTSGOVERNANCEPERFORMANCE REVIEWSTRATEGY & BUSINESSABOUT
NOTE 3. OTHER INTANGIBLE ASSETSThe changes in the carrying amount of other intangible assets are as follows:
SOFTWAREPURCHASED TECHNOLOGY AND
OTHER INTANGIBLE ASSETS TOTAL
At cost:
BALANCE JANUARY 1, 2016 17,958 6,397 24,355
Additions 6,603 – 6,603
BALANCE DECEMBER 31, 2016 24,561 6,397 30,958
Additions 2,187 – 2,187
BALANCE DECEMBER 31, 2017 26,748 6,397 33,145
Accumulated amortization:
BALANCE JANUARY 1, 2016 12,798 2,929 15,727
Amortization for the year 443 1,204 1,647
BALANCE DECEMBER 31, 2016 13,241 4,133 17,374
Amortization for the year 1,261 669 1,930
BALANCE DECEMBER 31, 2017 14,502 4,802 19,304
Other intangible assets net:
DECEMBER 31, 2016 11,320 2,264 13,584
DECEMBER 31, 2017 12,246 1,595 13,841
Other intangible assets are amortized over their useful lives of three to seven years. Estimated
amortization expenses relating to other intangible assets are as follows:
SOFTWAREPURCHASED TECHNOLOGY AND
OTHER INTANGIBLE ASSETS TOTAL
2018 2,932 660 3,592
2019 4,325 660 4,985
2020 3,401 275 3,676
2021 1,588 – 1,588
Years thereafter – – –
TOTAL 12,246 1,595 13,841
NOTE 4. GOODWILLThe carrying amount of the goodwill is related to the acquisitions operations in the following
business units:
DECEMBER 31,
2016 2017
Thermal products business unit 2,611 2,611
Plasma products business unit 8,659 8,659
TOTAL 11,270 11,270

156ANNUAL REPORT 2017
SHAREHOLDERS & GENERAL INFORMATIONFINANCIAL STATEMENTSGOVERNANCEPERFORMANCE REVIEWSTRATEGY & BUSINESSABOUT
NOTE 5. PROPERTY, PLANT AND EQUIPMENTThe changes in the amount of property, plant and equipment are as follows:
LAND, BUILDINGS AND LEASEHOLD IMPROVEMENTS
FURNITURE AND FIXTURES TOTAL
At cost:
BALANCE JANUARY 1, 2016 47 276 323
Additions – 176 176
BALANCE DECEMBER 31, 2016 47 452 499
Additions – 177 177
BALANCE DECEMBER 31, 2017 47 629 676
Accumulated depreciation:
BALANCE JANUARY 1, 2016 47 235 282
Depreciation for the year – 26 26
BALANCE DECEMBER 31, 2016 47 261 308
Depreciation for the year – 29 29
BALANCE DECEMBER 31, 2017 47 290 337
Property, plant and equipment, net:
DECEMBER 31, 2016 – 191 191
DECEMBER 31, 2017 – 339 339
USEFUL LIVES IN YEARS:
Land, buildings and leasehold improvements 0-25
Furniture and fixtures 2-10
NOTE 6. DEFERRED TAX ASSETSBased on tax filings, ASMI has net operating losses available at December 31, 2017 of €110,094
to reduce future income taxes. The Company believes that realization of its net deferred tax assets
is dependent on the ability of the Company to generate taxable income in the future. Given the
volatile nature of the semiconductor equipment industry and past experience, the Company believes
that there is currently sufficient evidence to recognize a deferred tax asset in the amount of €7,812.

157ANNUAL REPORT 2017
SHAREHOLDERS & GENERAL INFORMATIONFINANCIAL STATEMENTSGOVERNANCEPERFORMANCE REVIEWSTRATEGY & BUSINESSABOUT
NOTE 7. EQUITYThe changes in equity are as follows:
LEGAL RESERVES
(EUR thousand)COMMON
SHARESCAPITAL IN EXCESS
OF PAR VALUETREASURY
SHARESACCUMULATED NET EARNINGS
NET EARNINGS CURRENT YEAR
TRANSLATION RESERVE
OTHER LEGAL RESERVES TOTAL EQUITY
BALANCE AS OF JANUARY 1, 2016 2,552 221,868 (84,000) 220,700 157,277 190,763 1,228,689 1,937,849
Appropriation of net earnings – – – 157,277 (157,277) – – –
Components of comprehensive income
Net earnings – – – – 135,471 – – 135,471
Other comprehensive income – – – – – 38,725 – 38,725
TOTAL COMPREHENSIVE INCOME (LOSS) – – – – 135,471 38,725 – 174,196
Compensation expense share-based payments – 8,387 – – – – – 8,387
Exercise stock options out of treasury shares – (2,591) 27,836 (10,536) – – – 14,709
Vesting restricted shares out of treasury shares – (1,827) 1,827 – – – – –
Purchase of common shares – – (97,140) – – – – (97,140)
Dividend paid to common shareholders – – – (42,673) – – – (42,673)
Increased retained earnings subsidiaries – – – (51,323) – – 51,323 –
Fair value accounting investments – – – 2,015 – – (2,015) –
Capitalized development expenses subsidiaries – – – (13,448) – – 13,448 –
Other movements in investments in associates:
Dilution – – – 2,814 – – – 2,814
BALANCE AS OF DECEMBER 31, 2016 2,552 225,837 (151,477) 264,826 135,471 229,488 1,291,445 1,998,142
Appropriation of net earnings – – – 135,471 (135,471) – – –
Components of comprehensive income
Net earnings – – – – 452,402 – – 452,402
Other comprehensive income – – – – – (175,734) – (175,734)
TOTAL COMPREHENSIVE INCOME (LOSS) – – – – 452,402 (175,734) – 276,668
Compensation expense share-based payments – 7,801 – – – – – 7,801
Exercise stock options out of treasury shares – (10,612) 23,904 – – – – 13,292
Vesting restricted shares out of treasury shares – (4,501) 4,501 – – – – –
Purchase of common shares – – (243,527) – – – – (243,527)
Cancellation of common shares out of treasury shares (60) – 61,945 (61,885) – – – –
Dividend paid to common shareholders – – – (41,470) – – – (41,470)
Increased retained earnings subsidiaries – – – 121,741 – – (121,741) –
Fair value accounting investments – – – 404,092 – – (404,092) –
Capitalized development expenses subsidiaries – – – (12,996) – – 12,996 –
Other movements in investments in associates:
Dilution – – – 606 – – – 606
BALANCE AS OF DECEMBER 31, 2017 2,492 218,525 (304,654) 810,385 452,402 53,754 778,608 2,011,512

158ANNUAL REPORT 2017
SHAREHOLDERS & GENERAL INFORMATIONFINANCIAL STATEMENTSGOVERNANCEPERFORMANCE REVIEWSTRATEGY & BUSINESSABOUT
COMMON SHARES, PREFERRED AND FINANCING PREFERRED SHARESThe authorized capital of the Company amounts to 110,000,000 common shares of €0.04 par value,
118,000 preferred shares of €40 par value and 8,000 financing preferred shares of €40 par value.
During the Annual General Meeting of Shareholders of May 22, 2017, the Board got approval
to cancel 1.5 million treasury shares. This became effective as per August 1, 2017.
As at December 31, 2017, 62,297,394 ordinary shares with a nominal value of €0.04 each were
issued and fully paid up, of which 6,157,241 ordinary shares are held by us in treasury. All shares
have one vote per €0.04 par value. Treasury shares held by the Company cannot be voted on.
As at December 31, 2017 no preferred shares are issued.
TREASURY SHARESWith respect to treasury shares, reference is made to Note 11 to the Consolidated financial statements.
OTHER LEGAL RESERVESLegal reserves include reserves regarding participating interests, capitalized development expenses
and the cumulative foreign currency translation effect on translation of foreign operations, and
is included in the accumulated other comprehensive income (loss).
The legal reserve for participating interests regarding retained earnings, which amounts to €679,686
(2016: €1,205,519), pertains to participating interests that are accounted for according to the equity
accounting method. The reserve represents the difference between the participating interest’ retained
profit and direct changes in equity, as determined on the basis of the Company’s accounting policies,
and the share thereof that the Company may distribute. As to the latter share, this takes into account
any profits that may not be distributable by participating interests that are Dutch limited companies
based on the distribution tests to be performed by the management of those companies. The legal
reserve is determined on an individual basis.
In accordance with applicable legal provisions, a legal reserve for the carrying amount of €98,922
(2016: €85,926) has been recognized for capitalized development and start-up costs.
Changes in legal reserves in 2016 and 2017 were as follows:
RESERVE FOR PARTICIPATING
INTERESTS, REGARDING
RETAINED EARNINGS
RESERVE FOR PARTICIPATING
INTERESTS, REGARDING
CAPITALIZED DEVELOPMENT
EXPENSES
OTHER LEGAL
RESERVES
BALANCE AS OF JANUARY 1, 2016 1,156,211 72,478 1,228,689Retained earnings subsidiaries and investments 51,323 – 51,323Fair value accounting investments (2,015) – (2,015)
Development expenditures – 13,448 13,448
BALANCE AS OF DECEMBER 31, 2016 1,205,519 85,926 1,291,445
Retained earnings subsidiaries and investments (121,741) – (121,741)Fair value accounting investments (404,092) – (404,092)
Development expenditures – 12,996 12,996
BALANCE AS OF DECEMBER 31, 2017 679,686 98,922 778,608
For more detailed information, reference is made to Note 11 to the Consolidated financial statements.

159ANNUAL REPORT 2017
SHAREHOLDERS & GENERAL INFORMATIONFINANCIAL STATEMENTSGOVERNANCEPERFORMANCE REVIEWSTRATEGY & BUSINESSABOUT
EMPLOYEE STOCK PLAN, OPTION PLAN AND EMPLOYEE RESTRICTED SHARES PLANThe Company has adopted various stock option plans and restricted share plans and has entered
into related agreements with various employees. For detailed information, reference is made to Note
12 to the Consolidated financial statements.
NOTE 8. ACCRUED EXPENSES AND OTHER PAYABLESAccrued expenses and other payables consist of personnel related items €4,425 (2016: €2,039),
financing related items €4,920 (2016: €949) and other €2,504 (2016: €633).
NOTE 9. SHARE OWNERSHIP OF THE MANAGEMENT BOARD AND SUPERVISORY BOARDWith respect to share ownership of the Management Board and Supervisory Board, reference
is made to Note 24 and 25 to the Consolidated financial statements.
NOTE 10. PERSONNELThe average number of employees of ASMI in full-time equivalents during 2017 was 19.8
(2016: 21.2). Salaries, social security charges and pension expenses amounted to €6,068, €232
and €534, respectively, for 2017 (2016: expenses of €5,370, €134 and €532, respectively). Further
information concerning the number of employees can be found in Note 21 to the Consolidated
financial statements.
For information on the parent company’s defined benefit pension plan, the remuneration
of the Management Board and the Supervisory Board and the parent company’s share-based
compensation plans, see Notes 12 and 24 to the Consolidated financial statements.
NOTE 11. COMMITMENTS AND CONTINGENCIESAt December 31, 2017, operating leases having initial or remaining non-cancelable terms in excess
of one year are as follows:
2016 2017
Not later than 1 year 170 162
Between 1 and 5 years 305 173
Later than 5 years – –
TOTAL 475 335
Lease payments recognized in the expenses were €195 for the year ended December 31, 2017
(2016: € 200).
With respect to certain Dutch subsidiaries, ASMI has assumed joint and several liability in accordance
with Article 403, Part 9 of Book 2 of the Dutch Civil Code.
ASMI forms a fiscal unity (tax group for corporate income tax purposes) together with its Dutch subsidiaries for purposes of Dutch tax laws and is as such jointly and severally liable for the tax debts of the unity. The tax unity consists of ASM International NV and the following subsidiaries:
› ASM Europe BV (operational company)
› ASM IP Holding BV (operational company)
› ASM United Kingdom Sales BV (operational company)
› ASM Germany Sales BV (operational company)
› ASM Pacific Holding BV (holding company)
› ASM Netherlands Holding BV (holding company)
NOTE 12. AUDITOR’S FEES AND SERVICESFor information regarding auditor’s fees and services we refer to Note 26 to the Consolidated
financial statements.

160ANNUAL REPORT 2017
SHAREHOLDERS & GENERAL INFORMATIONFINANCIAL STATEMENTSGOVERNANCEPERFORMANCE REVIEWSTRATEGY & BUSINESSABOUT
NOTE 13. CORRECTION OF ERRORS
CORRECTION OF ERRORSDuring 2017, the Company discovered that the dilution effect was erroneously not included for the
goodwill and other intangible assets of the associate ASMPT. As a consequence, the value of the
investment in associate was overstated. The Company also reclassified a long-term loan. The errors
have been corrected by restating each of the affected financial statement line items for prior periods.
The following table summarizes the impact.
Company Balance Sheet
JANUARY 1, 2016
AS PREVIOUSLY
REPORTED ADJUSTMENTSAS
RESTATED
INVESTMENTS IN SUBSIDIARIES 1,684,752 (14,842) 1,669,910
Loans to subsidiaries 48,958 4,312 53,270
Others 221,162 — 221,162
TOTAL ASSETS 1,954,872 (10,530) 1,944,342
EQUITY 1,948,379 (10,530) 1,937,849
Liabilities 6,493 — 6,493
TOTAL EQUITY & LIABILITIES 1,954,872 (10,530) 1,944,342
DECEMBER 31, 2016
AS PREVIOUSLY
REPORTED ADJUSTMENTSAS
RESTATED
INVESTMENTS IN SUBSIDIARIES 1,823,526 (22,026) 1,801,500
Loans to subsidiaries 50,565 4,312 54,877
Others 149,789 — 149,789
TOTAL ASSETS 2,023,880 (17,714) 2,006,166
EQUITY 2,015,856 (17,714) 1,998,142
Liabilities 8,024 — 8,024
TOTAL EQUITY & LIABILITIES 2,023,880 (17,714) 2,006,166
SIGNINGAlmere
March 16, 2018
SUPERVISORY BOARDJ.C. Lobbezoo
H.W. Kreutzer
M.C.J. van Pernis
U.H.R. Schumacher
S. Kahle-Galonske
MANAGEMENT BOARDC.D. del Prado
P.A.M. van Bommel

161ANNUAL REPORT 2017
SHAREHOLDERS & GENERAL INFORMATIONFINANCIAL STATEMENTSGOVERNANCEPERFORMANCE REVIEWSTRATEGY & BUSINESSABOUT
INDEPENDENT AUDITOR’S REPORTTo: the General Meeting of Shareholders and the Supervisory Board of ASM International N.V.
REPORT ON THE AUDIT OF THE FINANCIAL STATEMENTS 2017 INCLUDED IN THE ANNUAL REPORT OUR OPINIONIn our opinion:
› the accompanying consolidated financial statements give a true and fair view of the financial
position of ASM International N.V. as at December 31, 2017 and of its result and its cash flows for
the year then ended, in accordance with International Financial Reporting Standards as adopted
by the European Union (EU-IFRS) and with Part 9 of Book 2 of the Dutch Civil Code.
› the accompanying company financial statements give a true and fair view of the financial position
of ASM International N.V. as at December 31, 2017 and of its result for the year then ended in
accordance with Part 9 of Book 2 of the Dutch Civil Code.
WHAT WE HAVE AUDITEDWe have audited the financial statements 2017 of ASM International N.V. (“ASMI” or the “Company”)
based in Almere. The financial statements include the consolidated financial statements and the
ASM International N.V. company financial statements.
The consolidated financial statements comprise:
1 the consolidated statement of financial position as at December 31, 2017;
2 the following consolidated statements for 2017: the statement of profit or loss, the statement of
comprehensive income, the statement of changes in equity and the statement of cash flows; and
3 the notes comprising a summary of the significant accounting policies and other explanatory
information.
The company financial statements comprise:1 the company balance sheet as December 31, 2017;
2 the company statement of profit or loss for 2017; and
3 the notes comprising a summary of the accounting policies and other explanatory information.
BASIS FOR OUR OPINIONWe conducted our audit in accordance with Dutch law, including the Dutch Standards on Auditing.
Our responsibilities under those standards are further described in the ‘Our responsibilities for the
audit of the financial statements’ section of our report.
We are independent of ASM International N.V. in accordance with the EU Regulation
on specific requirements regarding statutory audits of public-interest entities, the Wet toezicht
accountantsorganisaties (Wta, Audit firms supervision act), the Verordening inzake de onafhankelijkheid
van accountants bij assurance-opdrachten (ViO, Code of Ethics for Professional Accountants,
a regulation with respect to independence) and other relevant independence regulations
in the Netherlands. Furthermore, we have complied with the Verordening gedrags- en beroepsregels
accountants (VGBA, Dutch Code of Ethics).
We believe the audit evidence we have obtained is sufficient and appropriate to provide a basis for
our opinion.
Independent auditor’s report

162ANNUAL REPORT 2017
SHAREHOLDERS & GENERAL INFORMATIONFINANCIAL STATEMENTSGOVERNANCEPERFORMANCE REVIEWSTRATEGY & BUSINESSABOUT
AUDIT APPROACH
SUMMARY
MATERIALITY
KEYAUDIT
MATTERS
GROUPAUDIT
Materiality of €5.5 million
3% of result before incometaxes adjusted for thenon-recurring gain on partialdisposal of an associatedcompany and fluctuatingimpact of foreign exchangeresults
Revenue recognition
Accounting for investmentin ASMPT (associate)
Accounting for incometax positions
Accounting for capitalizeddevelopment costs
94% of total assets
100% of revenue
UNQUALIFIED OPINION
Materiality
Based on our professional judgement we determined the materiality for the financial statements
as a whole at EUR 5.5 million (2016: EUR 5.0 million). The materiality is determined with reference
to result before income taxes adjusted for non-recurring gain on partial disposal of an associate and
fluctuating impact of foreign exchange results, of which it represents 3% (2016: 5%). We consider
result before income taxes adjusted for non-recurring gain on partial disposal of an associate and
fluctuating impact of foreign exchange results as the most appropriate benchmark because the
Company is a profit oriented company and the key users of the financial statements are focused
on profit. We have also taken into account misstatements and/or possible misstatements that in our
opinion are material for the users of the financial statements for qualitative reasons.
We agreed with the Supervisory Board that misstatements in excess of EUR 250,000 which are
identified during the audit, would be reported to them, as well as smaller misstatements that in our
view must be reported on qualitative grounds.
Scope of the group audit
ASM International N.V. is at the head of a group of components. The financial information of this
group is included in the consolidated financial statements of ASM International N.V.
Our group audit mainly focused on significant group entities where account balances are of significant
size, have significant risks of material misstatement to the Group associated with them or are
considered significant for other reasons.
Considering our ultimate responsibility for the opinion, we are also responsible for directing,
supervising and performing the group audit. In this context, we have determined the nature and
extent of the audit procedures to be carried out by component auditors. Decisive factors were the
significance and / or the risk profile of the group entities or operations (components). On this basis,
we selected components for which an audit of account balance had to be performed. Furthermore,
we have determined the nature and extent of the audit procedures that we perform at group level
and at the Shared Services Center (“SSC”).
Our procedures cover the significant operations in Japan, Korea, the Netherlands, Singapore and the
United States of America, all mainly through our audit procedures at the SSC, supplemented with
local audits of account balances. Furthermore, our procedures cover the (results from) investments
in associates, including the work performed by the non-KPMG member firm auditors on ASM Pacific
Technology Ltd (“ASMPT”). The remaining balances are covered by additional procedures
at group level.
We have sent detailed instructions to all component auditors, covering the significant areas that
should be covered (which included the relevant risks of material misstatement detailed below) and set
out the information required to be reported to the group auditor. We visited America, Singapore and
ASMPT in Hong Kong for site visits and file reviews and held various telephone calls with the auditors
of the components, to discuss the group audit, significant risks, audit approach and instructions,
as well as the audit findings and observations reported to the group auditor.

163ANNUAL REPORT 2017
SHAREHOLDERS & GENERAL INFORMATIONFINANCIAL STATEMENTSGOVERNANCEPERFORMANCE REVIEWSTRATEGY & BUSINESSABOUT
By performing the procedures mentioned above at group components, together with additional
procedures at group level, we have been able to obtain sufficient and appropriate audit evidence about
the group’s financial information to provide an opinion about the consolidated financial statements.
Our procedures as described above can be summarized as follows:
94%
6% 100%
REVENUETOTAL ASSETS
Covered by additional proceduresat the group level
Audit
Our key audit matters
Key audit matters are those matters that, in our professional judgement, were of most significance
in our audit of the financial statements. We have communicated the key audit matters to the
Supervisory Board. The key audit matters are not a comprehensive reflection of all matters discussed.
These matters were addressed in the context of our audit of the financial statements as a whole and
in forming our opinion thereon, and we do not provide a separate opinion on these matters.
REVENUE RECOGNITION
Description
Net sales is measured taking into account multiple element arrangements, for example a single sales transaction that combines the delivery of goods and rendering of (installation) services, as contracts with customers typically include separately identifiable components that are recognized based on the relative selling price. Furthermore, net sales is recognized when the risk and rewards of products and services have been transferred to the customer. Due to the multitude and variety of contractual terms, the different pricing elements and the risk of management override of controls, revenue recognition is considered to be complex and involves management judgement as it relates to the allocation of revenue to the various elements in sales contracts.
Our response
Our audit procedures included, among other things, assessing the appropriateness of the Company’s revenue recognition accounting policies relating to revenue recognition. We tested the effectiveness of the Company’s review controls in the sales process that would identify a misstatement as a result of revenue recognition in the incorrect period. We also assessed the existence and accuracy of the sales recorded by performing three-way match of sales using data analytics tools and completeness of sales by performing procedures in the cut-off period. We further assessed the adequacy of the net sales disclosures contained in the consolidated Company’s financial statements.
Our observation
The results of our procedures related to the accounting for revenue recognition are satisfactory.

164ANNUAL REPORT 2017
SHAREHOLDERS & GENERAL INFORMATIONFINANCIAL STATEMENTSGOVERNANCEPERFORMANCE REVIEWSTRATEGY & BUSINESSABOUT
ACCOUNTING FOR INVESTMENT IN ASMPT (ASSOCIATE)
Description
ASM International N.V. holds 25% of the shares in ASM Pacific Technology Ltd (“ASMPT”), an entity listed on the Hong Kong Stock Exchange. The investment in ASMPT is accounted for under the equity method. The accounting for the results of and investment in ASMPT is significant to our audit due to the book value of the investment.As at December 31, 2017, the Investments and associated companies amounted to EUR 731 million whilst the share in income from investments and associates amounted to EUR 90 million.
Our response
Our audit procedures included instructing the statutory auditor of ASMPT to perform an audit on the relevant financial information of ASMPT for the purpose of the consolidated financial statements of ASMI. During the year, we discussed the risk assessment and audit strategy of the statutory auditor, as well as any significant developments. Subsequently we performed a file review at the statutory auditor’s office. We evaluated management considerations on the impairment indicators of the investment in ASMPT. We also assessed reasonableness of the accounting for the partial disposal of ASMPT. We further assessed the adequacy of the Company’s disclosure in Note 6, Investments in associates.
Our observation
We found that accounting for investments in associated companies is acceptable. We noted that the dilution effect was erroneously not included for the goodwill and other intangible assets of ASMPT. As a consequence, the value of the investment in associate and retained earnings as at December 31, 2016 were overstated by EUR 18 million. The errors have been corrected by restating each of the affected financial statement line items for the prior period. Refer to Note 6, Investments in associates and Note 29, Correction of errors.
ACCOUNTING FOR INCOME TAX POSITIONS
Description
Income tax positions are significant to our audit because the assessment process is complex, includes a certain level of estimation uncertainty and the amounts involved are material to the financial statements as a whole. ASMI’s operations are subject to income taxes in various jurisdictions which results in complexities of transfer pricing and the applicability of various tax legislations. Furthermore, the Company has significant unrecognized net operating losses.As at December 31, 2017, the deferred tax assets amounted to EUR 18 million and the unrecognized net operating losses amounted to EUR 114 million.
Our response
We performed audit procedures on the completeness, existence and accuracy of the amounts recognized as current and deferred tax, including the assessment of correspondence with tax authorities and the evaluation of tax exposures. In addition, in respect of deferred tax assets, we assessed and tested management’s assumptions that substantiate the probability that deferred tax assets recognized in the balance sheet will be recovered through taxable income in future years and available tax planning strategies. During our procedures, we challenged, among other things, budgets, forecasts and application of tax laws. In addition, we performed a retrospective review on prior year management assumptions. In those components determined to be part of jurisdictions with a significant tax risk, we involved tax specialists to analyze the tax positions and to challenge the assumptions used to determine the tax positions. We also assessed the adequacy of the Company’s disclosure in Note 20, Income taxes.
Our observation
The results of our procedures related to the accounting for income tax positions are satisfactory.

165ANNUAL REPORT 2017
SHAREHOLDERS & GENERAL INFORMATIONFINANCIAL STATEMENTSGOVERNANCEPERFORMANCE REVIEWSTRATEGY & BUSINESSABOUT
ACCOUNTING FOR CAPITALIZED DEVELOPMENT COSTS
Description
Capitalized development costs of EUR 99 million are deemed significant to our audit, given the significance of the position per December 31, 2017, the rapid technological change in the industry, as well as the specific IFRS criteria that have to be met for capitalization. This involves management judgment, such as assessment of technical feasibility, intention and ability to complete the intangible asset, ability to use or sell the asset, generation of future economic benefits and the ability to measure the costs reliably. In addition, determining whether there is any indication of impairment of the carrying value of the intangible assets, requires management judgment and assumptions which are affected by future market or economic developments.
Our response
We have performed audit procedures over the accuracy and valuation of amounts recognized. Our audit procedures included assessing the appropriateness of the Company’s accounting policies relating to internal and external cost capitalization. We challenged the key assumptions used or judgements made in capitalizing development costs, the accuracy of costs included and the useful economic life attributed to the asset. In addition, we considered whether any indicators of impairment were present by understanding the business rationale and by challenging management judgments and assumptions on future market or economic developments. We also assessed the adequacy of the Company’s disclosure in Note 5, Other intangible assets.
Our observation
The results of our procedures related to the accounting for capitalized development costs are satisfactory.
REPORT ON THE OTHER INFORMATION INCLUDED IN THE ANNUAL REPORT In addition to the financial statements and our auditor’s report thereon, the annual report contains other information that consists of:
› Strategy and Business;
› Performance review;
› Governance;
› Other information pursuant to Part 9 of Book 2 of the Dutch Civil Code.
Based on the following procedures performed, we conclude that the other information:
› is consistent with the financial statements and does not contain material misstatements;
› contains the information as required by Part 9 of Book 2 of the Dutch Civil Code.
We have read the other information. Based on our knowledge and understanding obtained through
our audit of the financial statements or otherwise, we have considered whether the other information
contains material misstatements.
By performing these procedures, we comply with the requirements of Part 9 of Book 2 of the
Dutch Civil Code and the Dutch Standard 720. The scope of the procedures performed is substantially
less than the scope of those performed in our audit of the financial statements.
Management Board of ASM International N.V. is responsible for the preparation of the other
information, including the information as required by Part 9 of Book 2 of the Dutch Civil Code.
REPORT ON OTHER LEGAL AND REGULATORY REQUIREMENTSENGAGEMENTWe were engaged by the Annual General Meeting of Shareholders as auditor of ASM International N.V.
on May 21, 2014, as of the audit for the year 2015 and have operated as statutory auditor ever since
that financial year.
NO PROHIBITED NON-AUDIT SERVICESWe have not provided prohibited non-audit services as referred to in Article 5(1) of the EU Regulation
on specific requirements regarding statutory audits of public-interest entities.

166ANNUAL REPORT 2017
SHAREHOLDERS & GENERAL INFORMATIONFINANCIAL STATEMENTSGOVERNANCEPERFORMANCE REVIEWSTRATEGY & BUSINESSABOUT
DESCRIPTION OF RESPONSIBILITIES REGARDING THE FINANCIAL STATEMENTSRESPONSIBILITIES OF MANAGEMENT BOARD OF ASM INTERNATIONAL N.V. AND THE SUPERVISORY BOARD FOR THE FINANCIAL STATEMENTSManagement Board of ASM International N.V. is responsible for the preparation and fair presentation
of the financial statements in accordance with EU-IFRS and Part 9 of Book 2 of the Dutch Civil Code.
Furthermore, Management Board of ASM International N.V. is responsible for such internal control
as management determines is necessary to enable the preparation of the financial statements that
are free from material misstatement, whether due to fraud or error.
As part of the preparation of the financial statements, Management Board of ASM International N.V.
is responsible for assessing ASM International N.V.’s ability to continue as a going concern. Based
on the financial reporting frameworks mentioned, Management Board of ASM International N.V. should
prepare the financial statements using the going concern basis of accounting unless Management
Board of ASM International N.V. either intends to liquidate the ASM International N.V. or to cease
operations, or has no realistic alternative but to do so. Management Board of ASM International N.V.
should disclose events and circumstances that may cast significant doubt on the company’s ability
to continue as a going concern in the financial statements.
The Supervisory Board is responsible for overseeing the ASM International N.V.’s financial
reporting process.
OUR RESPONSIBILITIES FOR THE AUDIT OF THE FINANCIAL STATEMENTSOur objective is to plan and perform the audit engagement in a manner that allows us to obtain
sufficient and appropriate audit evidence for our opinion.
Our audit has been performed with a high, but not absolute, level of assurance, which means we may
not detect all material errors and fraud during our audit.
Misstatements can arise from fraud or error and are considered material if, individually or in the
aggregate, they could reasonably be expected to influence the economic decisions of users taken
on the basis of these financial statements. The materiality affects the nature, timing and extent of our
audit procedures and the evaluation of the effect of identified misstatements on our opinion.
A further description of our responsibilities for the audit of the financial statements is included
in appendix 1 of this auditor’s report. This description forms part of our auditor’s report.
Amstelveen, March 16, 2018
KPMG Accountants N.V.
R.P. Kreukniet RA
Appendix 1: Description of our responsibilities for the audit of the annual accounts

167ANNUAL REPORT 2017
SHAREHOLDERS & GENERAL INFORMATIONFINANCIAL STATEMENTSGOVERNANCEPERFORMANCE REVIEWSTRATEGY & BUSINESSABOUT
APPENDIX 1We have exercised professional judgement and have maintained professional scepticism throughout
the audit, in accordance with Dutch Standards on Auditing, ethical requirements and independence
requirements. Our audit included among others:
› identifying and assessing the risks of material misstatement of the financial statements, whether due
to fraud or error, designing and performing audit procedures responsive to those risks, and obtaining
audit evidence that is sufficient and appropriate to provide a basis for our opinion. The risk of not
detecting a material misstatement resulting from fraud is higher than the risk resulting from error, as
fraud may involve collusion, forgery, intentional omissions, misrepresentations, or the override of
internal control;
› obtaining an understanding of internal control relevant to the audit in order to design audit procedures
that are appropriate in the circumstances, but not for the purpose of expressing an opinion on the
effectiveness of the ASM International N.V.’s internal control;
› evaluating the appropriateness of accounting policies used and the reasonableness of accounting
estimates and related disclosures made by Management Board of ASM International N.V.;
› concluding on the appropriateness of Management Board of ASM International N.V.’s use of the
going concern basis of accounting, and based on the audit evidence obtained, whether a material
uncertainty exists related to events or conditions that may cast significant doubt on ASM International
N.V.’s ability to continue as a going concern. If we conclude that a material uncertainty exists, we
are required to draw attention in our auditor’s report to the related disclosures in the financial
statements or, if such disclosures are inadequate, to modify our opinion. Our conclusions are based
on the audit evidence obtained up to the date of our auditor’s report. However, future events or
conditions may cause a company to cease to continue as a going concern;
› evaluating the overall presentation, structure and content of the financial statements, including the
disclosures; and
› evaluating whether the financial statements represent the underlying transactions and events in
a manner that achieves fair presentation.
Because we are ultimately responsible for the opinion, we are also responsible for directing,
supervising and performing the group audit. In this respect we have determined the nature and extent
of the audit procedures to be carried out for group components. Decisive were the size and/or the
risk profile of the group components or operations. On this basis, we selected group components for
which an audit or review had to be carried out on the complete set of financial information or specific
items.
We communicate with the Supervisory Board regarding, among other matters, the planned scope
and timing of the audit and significant audit findings, including any significant findings in internal
control that we identify during our audit. In this respect we also submit an additional report
to the audit committee in accordance with Article 11 of the EU Regulation on specific requirements
regarding statutory audits of public-interest entities. The information included in this additional report
is consistent with our audit opinion in this auditor’s report.
We provide the Supervisory Board with a statement that we have complied with relevant ethical
requirements regarding independence, and to communicate with them all relationships and other
matters that may reasonably be thought to bear on our independence, and where applicable,
related safeguards.
From the matters communicated with the Supervisory Board, we determine the key audit matters:
those matters that were of most significance in the audit of the financial statements. We describe
these matters in our auditor’s report unless law or regulation precludes public disclosure about the
matter or when, in extremely rare circumstances, not communicating the matter is in the public
interest.

168ANNUAL REPORT 2017
SHAREHOLDERS & GENERAL INFORMATIONFINANCIAL STATEMENTSGOVERNANCEPERFORMANCE REVIEWSTRATEGY & BUSINESSABOUT
SHAREHOLDERS INFORMATION
> Interview with the CFO
> Share listing
> Shareholder returns
> Shares and shareholders’ rights
> Key dates
> Key figures
> Contact information
GENERAL INFORMATION
> Product description
> Declarations
> Other information
> Non-financial data glossary
> Definitions and abbreviations
> Locations worldwide
> Safe harbor statement
> Privacy statement
SHAREHOLDERS & GENERAL INFORMATION
CHAPTER PREVIEW

169ANNUAL REPORT 2017
CHAPTER PREVIEWThe company once again returned to solid growth in 2017, as we benefited from a recovery in the single-wafer ALD market with healthy demand in the logic/foundry segment, as well as substantially higher sales in the 3D-NAND segment of the memory market.
At the same time, we invested in a number of new areas which led to new tool wins in our epitaxy
and PECVD product lines. While these new tool wins strongly contributed to our sales growth
in 2017, the initial costs related to the launch of the new products in epitaxy and PECVD led to
a decrease in our gross margin.
SHAREHOLDER VALUE
The proposed dividend for 2018 will mark the eighth consecutive year that we have paid a
dividend. In 2012, 2013 and 2014, we paid a dividend of €0.50 per common share. In 2015
we paid a dividend of €0.60 per common share and in 2016 and 2017 we paid a dividend of
€0.70 per common share. We will propose to the forthcoming 2018 Annual General Meeting
of Shareholders, which will be held on May 28, 2018, to declare a dividend of €0.80 per
common share.
SHAREHOLDERS & GENERAL INFORMATIONFINANCIAL STATEMENTSGOVERNANCEPERFORMANCE REVIEWSTRATEGY & BUSINESSABOUT
SHAREHOLDERS INFORMATION
> Interview with the CFO
> Share listing
> Shareholder returns
> Shares and shareholders’ rights
> Key dates
> Key figures
> Contact information
SHAREHOLDERSINFORMATION
CHAPTER PREVIEW

170ANNUAL REPORT 2017
SHAREHOLDERS & GENERAL INFORMATIONFINANCIAL STATEMENTSGOVERNANCEPERFORMANCE REVIEWSTRATEGY & BUSINESSABOUT
INTERVIEW WITH THE CFOAs revenue returned to solid growth again in 2017, Chief Financial Officer Peter A.M. van Bommel explains the importance of continued investments to position the company for long term growth. In the following interview he discusses some of the key financial topics that impacted the company in 2017 and comments on the reduction of the stake in ASMPT that was executed during the year.
HOW WOULD YOU DESCRIBE ASMI’S FINANCIAL PERFORMANCE IN 2017?We returned to growth again in 2017 with 23% higher sales of €737 million, which is a new record
high. We benefited from a recovery in the single-wafer ALD market with healthy demand in the logic/
foundry segment and substantially higher sales in the 3D-NAND segment of the memory market.
We also made investments in new areas resulting in new tool wins in our epitaxy and PECVD product
lines. While these new tool wins strongly contributed to our sales growth in 2017, the initial costs
related to the launch of the new products in epitaxy and PECVD led to a decrease in our gross margin.
Operating expenses remained under control and decreased as a percentage of revenue from 30%
to 26%. Operating profit increased 38% with the operating margin improving to 15.3% (2016: 13.8%).
“WE ARE STEPPING UP INVESTMENTS TO PREPARE OUR COMPANY FOR THE NEXT STAGE OF GROWTH.”
Results from investments excluding amortization of intangible assets – reflecting our share
of ASMPT’s net profits – showed a strong increase of 66% to €112 million. This is the balance of,
on the one hand, a 89% increase in ASMPT’s net profits on a 100% basis and, on the other hand,
a reduction of our stake in ASMPT during the year from approximately 39% to approximately 25%.
In total, our normalized net profits increased by 17% to €190 million. This increase was impacted by a
negative currency translation effect of €31 million included in our financing costs. As we hold a substantial
part of cash balances in US dollars and other foreign currencies, the appreciation of the euro during
2017 led to this negative translation effect. In 2016, financing costs still included a translation gain of
€13 million. Apart from translation effects, the impact from exchange rate fluctuations on our relative
profitability is limited, as the currency exposure of our sales largely matches that of our cost base.
WHAT EXPLAINS THE DECREASE IN GROSS MARGINS IN 2017?Our gross margin dropped from 44.2% to 41.5% in 2017. This is fully explained by the initial costs
of the newly introduced products in our epitaxy and PECVD activities. Excluding this impact, our
gross margin would have been relatively stable in 2017. The gross margin was still steady at almost
44% in the first half but decreased, as we had announced with our second quarter results publication,
to approximately 40% in the second half. Following the tool wins that we announced earlier in 2017
our sales in the third and fourth quarter included multiple units of the new epitaxy and PECVD
Shareholders information
PETER A.M. VAN BOMMEL
Member of the Management Boardand Chief Financial Officer

171ANNUAL REPORT 2017
SHAREHOLDERS & GENERAL INFORMATIONFINANCIAL STATEMENTSGOVERNANCEPERFORMANCE REVIEWSTRATEGY & BUSINESSABOUT
systems. As these launches represent completely new products and applications, the first tools still
carry a lower gross margin, which is not unusual for new product penetrations in the market. This
is only a temporary effect. Margins on the new products are on track to improve and as a result
we expect the gross margin for the total company to normalize again in the course of the year.
On a structural basis our gross margin is healthy. Over time, we implemented several programs that
have improved the flexibility and efficiency of our manufacturing and supply chain operations. With
an ongoing strong cost focus throughout our organization, we expect to maintain gross margins
within a percentage range of low-to-mid 40s, barring a downturn in the semiconductor equipment
market. On a quarterly basis, gross margins will continue to be impacted by factors such as revenue
mix and utilization.
HOW HAS THE FREE CASH FLOW DEVELOPED IN 2017?Over the last several years, we have consistently generated a positive free cash flow. For the full
year 2017 free cash flow amounted to €32 million, approximately stable compared to 2016. The
development in free cash flow was held back by a rise in working capital and an increase in capex.
The rise in working capital is explained by higher accounts receivables due to the back-half weighted
character of sales in the fourth quarter of 2017, which was even more pronounced than in 2016.
In addition, inventories increased during 2017 and reflected our higher activity level including the
new products in epitaxy and PECVD. The underlying quality of working capital remained healthy.
Capital expenditure increased from €27 million to €44 million, largely related to the increase in our
R&D activities. We are stepping up investments to prepare our company for the next stage of growth.
In the last several years we could largely accommodate the increased demand within our existing
facilities. To grow to structurally higher levels we plan to increase investments in the forthcoming
periods. ALD continues to be an attractive growth market and in epitaxy and PECVD we now also
have good opportunities for further expansion. Investments include the construction of a new facility
and cleanroom in Korea and the construction of a new manufacturing facility in Singapore. After a first
impact in 2017 these investments will lead to a higher level of capital expenditure in 2018-2019.
ASMI REDUCED ITS STAKE IN ASMPT IN 2017. WHAT WAS THE FINANCIAL IMPACT?During the year we reduced our stake in ASMPT in two steps from approximately 39%
to approximately 25%. In April 2017 we sold a 4.9% stake in a partial secondary share placement for
proceeds of approximately €245 million. We used the proceeds for a new share €250 million buyback
program that we started in September last year. Last November, we sold another 9.1% stake
in ASMPT that generated proceeds of approximately €445 million. We intend to use approximately
€220 million of these proceeds for a capital return of €4 per common share. This capital return will
be effected to be free of dividend withholding tax and will be proposed to the AGM 2018. Moreover,
we plan to use €250 million for a new share buyback program. Our reported net earnings in 2017
included a total result of €285 million related to the stake sales in ASMPT.
CAN YOU COMMENT ON THE STRONG CASH POSITION OF THE COMPANY?The cash position of €836 million at the end of 2017 includes a large part of the cash proceeds
of the ASMPT stake sales that we have committed to return to our shareholders. Our overall financial
position continues to be healthy and enables us to continue investing in the growth of our business,
which remains our key priority. Over the past few years our cash position has remained above our
minimum target level of around €300 million. In line with our commitment to use excess cash for
the benefit of our shareholders, we completed during 2017 our third consecutive €100 million share
buyback program. We also started a new €250 million program that was 60% complete by the end
of 2017 and 97% complete on March 9, 2018. During 2017 we returned approximately €285 million
in total to shareholders in the form of dividends and share buybacks. This was up from €140 million
in 2016 and €116 million in 2015.
Looking at 2018, next to the tax-efficient capital return and the announced new €250 million share
buyback program, we will propose a dividend of €0.80 per share to the forthcoming AGM, which
is an increase of 14% compared to last year. We will also propose the cancellation of 6 million shares.
This will reduce the number of issued shares by almost 10%.
THIS YEAR ASMI DECIDED NOT TO PUBLISH A SEPARATE CORPORATE RESPONSIBILITY REPORT. CAN YOU EXPLAIN WHY?During the last three years we published separate Corporate Responsibility reports as we wanted
to highlight the progress we had made in strengthening corporate responsibility within our company.
Over the last several years, we stepped up our efforts to reduce our environmental footprint, further
strengthen our safety culture and strongly improve our Transparency Benchmark Evaluation score,
just to mention a few examples. This year we decided to combine the Corporate Responsibility report
and the Annual Report. While we recognize that a lot of work still needs to be done, we believe it is
an important first step towards integrated reporting. In this way, we aim to increase the relevance and
quality of our reporting for all our stakeholders and to further strengthen corporate responsibility in all
aspects of our activities.

172ANNUAL REPORT 2017
SHAREHOLDERS & GENERAL INFORMATIONFINANCIAL STATEMENTSGOVERNANCEPERFORMANCE REVIEWSTRATEGY & BUSINESSABOUT
SHARE LISTINGOur strategy aims to create sustainable value for all our stakeholders. As part of this strategy, we are committed to creating long-term shareholder value. This chapter provides information that is particularly relevant for shareholders and investors, including information related to the share listing and share price performance, dividends and share buybacks.
On December 31, 2017, the total number of issued common shares of ASMI amounted
to 62,297,394 compared to 63,797,394 at year-end 2016. The decrease was the result of the
cancellation of 1,500,000 treasury shares that was approved by the Annual Meeting of Shareholders
(AGM) on May 22, 2017, and became effective on August 1, 2017.
On December 31, 2017, we had 56,140,153 outstanding common shares excluding 6,157,241
treasury shares. This compared to 59,815,843 outstanding common shares and 3,981,551 treasury
shares at year-end 2016. Besides the cancellation of 1.5 million treasury shares in August 2017
the change in the number of treasury shares in 2017 was the result of approximately 4.4 million
repurchased shares and approximately 745,000 treasury shares that were used as part of share
based payments.
2017
As per January 1:
Issued shares 63,797,394
Treasury shares 3,981,551
Outstanding shares 59,815,843
Changes during the year:
Cancellation of treasury shares 1,500,000
Share buybacks 4,420,946
Treasury shares used for share based performance programs 745,256
As per December 31:
Issued shares 62,297,394
Treasury shares 6,157,241
Outstanding shares 56,140,153
On December 31, 2017, 55,783,384 of the outstanding common share were registered with
our transfer agent in the Netherlands, ABN AMRO Bank NV; and 356,769 were registered with our
transfer agent in the United States, Citibank, NA, New York.
MARKET CAPITALIZATIONThe market capitalization of ASMI at year-end 2017 was €3,165 million, based on the closing share
price of €56.37 at Euronext Amsterdam on December 29, 2017 and 56.1 million total outstanding
shares per year-end. The market capitalization at year-end 2016 was €2,551 million.

173ANNUAL REPORT 2017
SHAREHOLDERS & GENERAL INFORMATIONFINANCIAL STATEMENTSGOVERNANCEPERFORMANCE REVIEWSTRATEGY & BUSINESSABOUT
SHARE PERFORMANCEOn December 29, 2017, the closing price of ASMI’s shares on Euronext Amsterdam was €56.37.
The highest closing price during the year was €62.27, on November 21, 2017, and the lowest
was €42.07, on January 5, 2017. The average daily trading volume of ASMI shares on Euronext
Amsterdam in 2017 was 251,997. This compares to an average daily volume of 197,807 in 2016.
The graph below shows the performance of ASMI’s shares on Euronext. The total share return in this
graph is the performance of the share including dividends paid and capital returned over the period.
SHARE PRICE PERFORMANCE AND TOTAL SHARE RETURN %
Share price performance
Total return
180
160
140
120
100
80
60
40
20
0
-2020162013 2014 2015 2017
Following the voluntary delisting from Nasdaq in August 2015, our NY Registry Shares have been
eligible for trading on the over-the-counter (OTC) market in the United States under the symbol ASMIY.
Information on the trading and share price of our shares on the OTC Market in the United States can
be found on www.otcmarkets.com.

174ANNUAL REPORT 2017
SHAREHOLDERS & GENERAL INFORMATIONFINANCIAL STATEMENTSGOVERNANCEPERFORMANCE REVIEWSTRATEGY & BUSINESSABOUT
SHAREHOLDER RETURNSWe are committed to paying a sustainable dividend. Additionally, in recent years we have returned excess cash to the financial markets in the form of share buyback programs and an extraordinary return of capital.
DIVIDENDSASMI aims to pay a sustainable annual dividend. Annually, the Supervisory Board, upon proposal
of the Management Board, will assess the amount of dividend that will be proposed to the Annual
General Meeting of Shareholders (AGM). The decision that a dividend be proposed to the AGM will
be subject to the availability of distributable profits as well as retained earnings and may be affected
by our potential future funding requirements. Accordingly, dividend payments may fluctuate and
could decline or be omitted in any year.
The proposed dividend for 2018 will mark the eighth consecutive year that we have paid a dividend.
In 2012, 2013 and 2014, we paid a dividend of €0.50 per common share. In 2015 we paid a dividend
of €0.60 per common share and in 2016 and 2017 we paid a dividend of €0.70 per common share.
ASMI will propose to the forthcoming 2018 AGM, which will be held on May 28, 2018, to declare
a dividend of €0.80 per common share.
DIVIDEND TIMETABLEEx-dividend date shares Euronext and OTC US: May 30, 2018
Record date: May 31, 2018
Payment date: June 7, 2018
DIVIDEND PAID EUR
0.500.40
0.50 0.50
0.800.70 0.70
0.60
1.00
0.80
0.60
0.40
0.20
* Proposed.
20162011 2012 2013 2014 2015 2017 2018*
CAPITAL REPAYMENTIn addition to the proposed dividend, ASMI announced on February 28, 2018, that it intends
to propose to the 2018 AGM to distribute €4.00 per common share free of any withholding tax.
To this end it is proposed that the distribution is effected as a repayment of capital to the shareholders
by way of a reduction of the par value of the common shares. Moreover, on the same data ASMI
announced that it will propose to the 2018 AGM the cancellation of 6 million treasury shares.
In July 2013, ASMI distributed €4.25 per ordinary share to its shareholders. This followed on the sale
of 12% of the total shares in ASMPT in March 2013. The extraordinary return of capital in 2013 was
in addition to the dividend paid that year.

175ANNUAL REPORT 2017
SHAREHOLDERS & GENERAL INFORMATIONFINANCIAL STATEMENTSGOVERNANCEPERFORMANCE REVIEWSTRATEGY & BUSINESSABOUT
SHARE BUYBACKOn September 22, 2017, ASMI announced the start of a new share buyback program of its common
shares for the period 2017-2018. This program followed on ASMI’s announcement on April 24, 2017,
that the proceeds of approximately €245 million of the secondary share placement on that date
of a stake of approximately 5% in ASM Pacific Technology were intended to be used for a new share
buyback program. The 2017-2018 program will end as soon as the aggregate purchase price of the
common shares acquired by ASMI has reached €250 million, but ultimately on November 25, 2018.
ASMI strives to complete the program well before that date. The program will in any event take place
within the mandate given by the shareholders during the AGM of May 22, 2017.
This share buyback program will be ex ecuted by a third party. ASMI has the intention to reduce its
capital by cancelling the repurchased shares after having received approval from its shareholders.
The repurchase program is part of ASMI’s commitment to use excess cash for the benefit of its
shareholders. ASMI updates the market on the progress of the share buyback program on a weekly
base. This information will also be published on the ASMI website (www.asm.com).
As of December 29, 2017, we bought back approximately 2.6 million shares under the 2017-2018
program at an average price of €56.77 and for a total amount of €150 million. As of March 9, 2018,
a total of 4.26 million shares have been bought under this program at an average price of €56.93 for
an amount of €243 million.
In 2017, we also completed the €100 million share buyback program 2016-2017. This program
was announced on October 26, 2016 – initially for an amount of €50 million – and was increased
to €100 million as announced on March 2, 2017. Under the 2016-2017 share buyback program
that was completed on August 28, 2017, we repurchased 1,997,522 shares at an average price of
€50.06.
Furthermore, ASMI announced on February 28, 2018, that it plans to use €250 million for a new
share buyback program.
During the whole of 2017, we bought back a total of approximately 4.4 million shares at an average
share price of €54.27 and for a total value of approximately €240 million. This compares with a total
of approximately 2.7 million bought back in 2016 at an average price of €36.31 and for a total value
of €97 million.
The program announced in September 2017 is the fourth consecutive share buyback program. In addition to the 2016-2017 program the earlier programs were:
› The €100 million share buyback program 2015-2016 that was announced in October 2015.
This program started on November 26, 2015 and was completed on November 11, 2016. Under the
2015-2016 share buyback program 2,772,729 shares were repurchased at an average price of
€35.98; and
› The €100 million share buyback program 2014-2015 that was announced in October 2014.
This program started on November 24, 2014 and was completed on May 20, 2015. In total,
2,594,420 shares were repurchased at an average price of €38.55, for an amount of €100 million,
under this program.
During 2017, we returned approximately €285 million to shareholders in the form of dividends
and share buybacks. This was up from €140 million in 2016 and €116 million in 2015. Over the
2010-2017 period, we returned more than €1 billion to the financial markets through dividends, share
buybacks, return of capital, and buyback of convertible bonds.
CUMULATIVE CASH RETURNED TO MARKET EUR million
1,200
1,000
800
600
400
200
0
Share buybacks
Dividends
Return of capital
Buyback convertibles20162013201220112010 2014 2015 2017

176ANNUAL REPORT 2017
SHAREHOLDERS & GENERAL INFORMATIONFINANCIAL STATEMENTSGOVERNANCEPERFORMANCE REVIEWSTRATEGY & BUSINESSABOUT
SHARES AND SHAREHOLDERS’ RIGHTSOur shares are listed on the NYSE Euronext Stock Exchange in Amsterdam (symbol: ‘ASM’) where ASMI is included in the Midcap index. In the US, our shares, held in the form of New York Registry Shares, trade on the OTC market (symbol: ‘ASMIY’). Details about our shares and how our shareholders are able to exercise their rights, including information on our Annual and Extraordinary General Meetings of Shareholders, voting rights, and major shareholders in the company, are outlined below.
ANNUAL GENERAL MEETING OF SHAREHOLDERSASMI shareholders exercise their rights through Annual and Extraordinary General Meetings
of Shareholders. ASMI is required to convene an Annual General Meeting of Shareholders (AGM)
in the Netherlands each year, no later than six months after the end of the Company’s financial year.
Additional Extraordinary General Meetings of Shareholders may be convened at any time by the
Supervisory Board or the Management Board.
The convocation date is legally set at 42 days prior to the date of the AGM.
The record date is legally set at 28 days prior to the date of the AGM. Those who are registered
as shareholders at the record date are entitled to attend the meeting and to exercise other shareholder
rights. Shareholders may be represented by written proxy.
PUBLICATION IN ENGLISHThe Annual Report, the Financial statements and other regulated information such as defined in the
Dutch Act on Financial Supervision (Wet op het Financieel Toezicht), will solely be published in English
on the Company’s website (www.asm.com).
The draft minutes of the AGM are available on the Company’s website no later than three months
after the meeting. Shareholders may provide their comments in the subsequent three months.
Thereafter, the minutes are adopted.
2017 AGM OF ASMIOn May 22, 2017, ASMI held its AGM in Amsterdam, the Netherlands. The attendance rate was
73.0% of the total issued share capital of ASMI as per the registration date. In line with the ASMI
Boards’ recommendations, the shareholders approved all resolutions as proposed to the AGM.
The minutes of the AGM are published on the Company’s website.
VOTING RIGHTSIn the AGM, each ordinary share with a nominal value of €0.04 entitles the holder to cast one
vote, each financing preferred share with a nominal value of €40.00 entitles the holder to cast
one thousand votes and each preferred share with a nominal value of €40.00 entitles the holder
to cast one thousand votes. Presently, there are no preferred shares and financing preferred shares
outstanding. Treasury shares held by the Company cannot be voted on.
The authorized capital of the Company amounts to 110,000,000 shares of €0.04 par value common
shares, 118,000 shares of €40 par value preferred shares and 8,000 shares of €40 par value
financing preferred shares, of which 56,140,153 common shares, no preferred and no financing
preferred shares were outstanding as at December 31, 2017. All per December 31, 2017 outstanding
common shares were fully paid.
Financing preferred shares are designed to allow ASMI to finance equity with an instrument paying
a preferred dividend, linked to EURIBOR loans and government loans, without the dilutive effects
of issuing additional common shares.

177ANNUAL REPORT 2017
SHAREHOLDERS & GENERAL INFORMATIONFINANCIAL STATEMENTSGOVERNANCEPERFORMANCE REVIEWSTRATEGY & BUSINESSABOUT
The graph below provides an overview of the shareholders’ structure.
VOTING RIGHTS ASMI in %
Tokyo Electron
Schroders Plc
Eminence Capital, LLC
J.P. Morgan Chase & Co
Stichting ADP
Rest of shareholders
14.0
54.413.0
9.2
4.35.1
PREFERRED SHARESPreferred and financing preferred shares are issued in registered form only and are subject to transfer
restrictions. Essentially, a preferred or financing preferred shareholder must obtain the approval of the
Company’s Supervisory Board to transfer shares. If the approval is denied, the Supervisory Board
will provide a list of acceptable prospective buyers who are willing to purchase the shares at a cash
price to be fixed by consent of the Supervisory Board and seller within two months after the approval
is denied. If the transfer is approved, the shareholder must complete the transfer within three months,
at which time the approval expires.
Preferred shares are entitled to a cumulative preferred dividend based on the amount paid-up on
such shares. Financing preferred shares are entitled to a cumulative dividend based on the par value
and share premium paid on such shares.
STICHTING AGREEMENTASMI is party to an agreement with Stichting Continuïteit ASM International (Stichting), pursuant
to which Stichting is granted an option to acquire up to a number of our preferred shares
corresponding with a total par value equal to 50% of the par value of our common shares issued
and outstanding at the date of the exercise of the option. Stichting is a non-membership organization
organized under Dutch law. The objective of Stichting is to serve the interests of the Company.
For that objective, Stichting may, among other things, acquire, own, and vote our preferred shares
in order to maintain our independence and/or continuity and/or identity.
The members of the board of Stichting are:
› Dick Bouma, Retired Chairman Board Pels Rijcken & Droogleever Fortuijn;
› Rob Ruijter, former Chairman Supervisory Board Delta Lloyd; and
› Rinze Veenenga Kingma, President Archeus Consulting BV.
The purpose of above mentioned option is to protect the independence, the continuity and the
identity of ASMI against influences that are contrary to the interests of ASMI, its enterprise and the
enterprises of its subsidiaries and all stakeholders.
POWERSThe powers of the AGM are defined in our Articles of Association. The main powers of the shareholders are to:
› appoint, suspend, and dismiss members of the Management Board and Supervisory Board;
› adopt the financial statements;
› declare dividends;
› discharge the Management Board and Supervisory Board from responsibility for the performance of
their respective duties for the previous financial year;
› appoint the external auditors;
› adopt amendments to the Articles of Association;
› issue shares and grant subscriptions for shares;
› authorize the Management Board to issue shares and grant subscriptions for shares;
› withdraw pre-emptive rights of shareholders upon issuance of shares;
› authorize the Management Board to withdraw pre-emptive rights of shareholders upon issuance of
shares; and
› authorize the Management Board to repurchase or cancel outstanding shares.

178ANNUAL REPORT 2017
SHAREHOLDERS & GENERAL INFORMATIONFINANCIAL STATEMENTSGOVERNANCEPERFORMANCE REVIEWSTRATEGY & BUSINESSABOUT
MAJOR SHAREHOLDERSPursuant to the Dutch Financial Supervision Act (Wet op het financieel toezicht or WFT), legal entities
as well as natural persons must immediately notify the Dutch Authority for the Financial Markets
(AFM) when a shareholding equals or exceeds 3% of the issued capital. The AFM must be notified
again when this shareholding subsequently reaches, exceeds or falls below a threshold. This can
be caused by the acquisition or disposal of shares by the shareholder or because the issued capital
of the issuing institution is increased or decreased. Thresholds are: 3%, 5%, 10%, 15%, 20%, 25%,
30%, 40%, 50%, 60%, 75%, and 95%. The AFM incorporates the notifications in the public register,
which is available on its website. Failure to disclose the shareholding qualifies as an offense, and may
result in civil penalties, including suspension.
The following table sets forth information with respect to the ownership of our common shares as of
February 1, 2018, by each beneficial owner known to us of more than 3% of our common shares:
NUMBER OF SHARES PERCENT
NUMBER OF VOTING RIGHTS PERCENT 1)
Stichting ADP 2) 8,707,323 14.0% 8,707,323 14.0%
J.P. Morgan Chase & Co 3) 8,100,853 13.0% 8,100,853 13.0%
ASM International NV 4) 6,157,241 9.9% – –
Eminence Capital LP 5) 5,730,674 9.2% 5,730,674 9.2%
Schroders Plc 6) – – 3,172,577 5.1%
Tokyo Electron Ltd. 7) 2,699,000 4.3% 2,699,000 4.3%
1 Calculated on the basis of 62,297,400 issued common shares as of February 1, 2018, and without regard to options.2 The total capital interest of Stichting ADP is held indirectly actual, while of the 8,707,323 voting rights 8,704,284 are
held indirectly actual and 3,039 are held indirectly potential. Based on the AFM notification dated September 9, 2016.3 Of the share capital interest and voting rights held by J.P. Morgan Chase & Co, 423,022 shares are indirectly actual
and 7,677,831 are indirectly potential. Based on the notification filed with the AFM on November 2, 2017.4 On December 31, 2017, ASMI held 6,157,241 ordinary shares in treasury. Treasury shares held by the Company
cannot be voted on.5 All of the 5,730,674 shares and voting rights of Eminence Capital LP are held directly actual. Based on the notification
filed with the AFM on March 17, 2017.6 All of the 3,172,577 voting rights of Schroders Plc are held indirectly actual. Based on the notification filed with the
AFM on December 12, 2017.7 All of the 2,699,000 shares in capital interest and voting rights of Tokyo Electron Ltd are held directly actual. Based on
the notification filed with the AFM on July 1, 2013.
A ‘beneficial owner’ of a security includes any person who, directly or indirectly, through any contract,
arrangement, understanding, relationship, or otherwise has or shares (i) voting power which includes
the power to vote, or to direct the voting of, such security and/or (ii) investment power which includes
the power to dispose, or to direct the disposition, of such security. In addition, a person shall
be deemed to be the beneficial owner of a security if that person has the right to acquire beneficial
ownership of such security, as defined above, within 60 days, including but not limited to any right
to acquire: (i) through the exercise of any option, warrant or right; (ii) through the conversion of a
security; or (iii) pursuant to the power to revoke, or pursuant to the automatic termination of, a trust,
discretionary account, or similar arrangement.

179ANNUAL REPORT 2017
SHAREHOLDERS & GENERAL INFORMATIONFINANCIAL STATEMENTSGOVERNANCEPERFORMANCE REVIEWSTRATEGY & BUSINESSABOUT
KEY DATESOur key investor dates are listed below. An up-to-date investor calendar is available on our website.
ANNUAL GENERAL MEETING OF SHAREHOLDERSThe Annual General Meeting of Shareholders will be held on May 28, 2018.
APRIL 19, 2018Announcement of first quarter results 2018
JULY 24, 2018Announcement of second quarter results 2018
OCTOBER 31, 2018Announcement of third quarter results 2018
KEY FIGURESKEY FIGURES PER SHAREThe table below shows the key figures per share and other relevant share data for the last three years.
(EUR, except number of shares) 2015 2016 2017
Net earnings per share, diluted 2.50 2.21 7.63
Normalized net earnings per share, diluted 2.93 2.65 3.21
Dividend per share 0.60 0.70 0.70
Shareholders’ equity 31.58 33.70 35.83
Issued shares year-end (thousand) 63,797 63,797 62,297
Outstanding shares year-end (thousand) 61,706 59,816 56,140
Average outstanding shares basic (thousand) 62,114 60,616 58,573
Average outstanding shares diluted (thousand) 62,928 61,253 59,325
Closing share price Euronext Amsterdam
Year-end 36.16 42.64 56.37
High 45.91 43.05 62.27
Low 27.57 32.14 42.07
Market capitalization year-end (EUR million) 2,231 2,551 3,165

180ANNUAL REPORT 2017
SHAREHOLDERS & GENERAL INFORMATIONFINANCIAL STATEMENTSGOVERNANCEPERFORMANCE REVIEWSTRATEGY & BUSINESSABOUT
CONTACT INFORMATIONOPEN DIALOG AND TIMELY INFORMATIONWe maintain an open dialog with our shareholders and investors. We provide the financial markets
with accurate and timely information through, among other things, press releases, our annual
reports, quarterly earnings calls and webcasts and investor meetings. Investors can find up-to-date
and comprehensive information about the company and our shares on our website.
VICTOR BAREÑOAlmere, the Netherlands
T: +31 88 100 8500

181ANNUAL REPORT 2017
CHAPTER PREVIEWOur products include wafer processing deposition systems for single-wafer ALD, PECVD, epitaxy and batch diffusion/furnace systems. We are active in two technology segments within Atomic Layer Deposition (ALD) tools: thermal ALD and plasma enhanced ALD (PEALD). Within Chemical Vapor Deposition (CVD) we also offer two types of tools: single-wafer plasma enhanced CVD (PECVD) and batch low pressure CVD (LPCVD). And within our Epitaxy family, we offer Intrepid and Epsilon tools.
SHAREHOLDERS & GENERAL INFORMATIONFINANCIAL STATEMENTSGOVERNANCEPERFORMANCE REVIEWSTRATEGY & BUSINESSABOUT
GENERAL INFORMATION
> Product description
> Declarations
> Other information
> Non-financial data glossary
> Definitions and abbreviations
> Locations worldwide
> Safe harbor statement
> Privacy statement
GENERALINFORMATION
CHAPTER PREVIEW

182ANNUAL REPORT 2017
SHAREHOLDERS & GENERAL INFORMATIONFINANCIAL STATEMENTSGOVERNANCEPERFORMANCE REVIEWSTRATEGY & BUSINESSABOUT
General information
PRODUCT DESCRIPTIONOur products include wafer processing deposition systems for single-wafer ALD, PECVD, epitaxy and batch diffusion / furnace systems.
DEPOSITIONAPPLICATION
ASMI PRODUCTPLATFORM
ASMI PRODUCTS
TECHNOLOGY – PRODUCT MATRIX
ALD
PEALD
PECVD
DiffusionOxidationLPCVDALD
Epitaxy
XP1
XP81
XP81
Advance Series
XP1
Epsilon
Pulsar XP ALD systemEmerALD XP ALD system
Dragon XP8 PECVD system
A400 batch vertical furnace systemA412 batch vertical furnace system
Intrepid ES epitaxy
Epsilon 2000 single wafer epitaxy systemEpsilon 3200 single wafer epitaxy system
PROCESS APPLICATION
High-k gate dielectricMetal gate electrode
Spacer for multipatterningGate spacerEtch stop
Eagle XP8 PEALD system
Inter-layer dielectricSilicon nitride
Furnace:- Diffusion, oxidation- Polysilicon- Silicon nitride
Silicon channelStrain layer
1 The XP is our standard single wafer processing platform designed to accommodate multiple process application modules with common platform standards. In 2012 ASMI launched the XP8 high productivity platform for PECVD and PEALD, based on our common XP platform standard with an expanded configuration that enables integration of up to eight chambers on one wafer handling platform.
PRODUCT APPLICATIONS AND DESCRIPTIONSAtomic Layer Deposition (ALD)ASMI offers ALD tools in two technology segments: thermal ALD and plasma enhanced ALD
(PEALD).
Pulsar XP ALD systemPulsar XP is a 300mm thermal ALD tool designed for depositing extremely thin high-k dielectric
materials required for advanced transistor gates and other applications. Pulsar is the benchmark ALD
high-k gate dielectric tool for the industry. Up to four Pulsar process modules can be configured on a
Pulsar XP system.
EmerALD XP ALD systemEmerALD XP is a 300mm thermal ALD tool designed for depositing metal gate layers for advanced
high-k metal gate transistors and other applications. Up to four EmerALD process modules can
be configured on an EmerALD XP system.
Eagle XP8 PEALD systemEagle XP8 is a high-productivity 300mm tool for PEALD applications. The system can be configured
with up to four Dual Chamber Modules (DCM), enabling eight chambers in high-volume production
within a very compact footprint. The system is capable of a broad range of dielectric PEALD
processes, including low-temperature spacers for multiple patterning applications.
Advance series batch vertical furnaceThe Advance is our batch vertical furnace tool, available as the A412 for 300mm wafers and as the
A400 for smaller wafer sizes. Various thermal ALD films can be deposited on the batch furnace for
high productivity.
Chemical Vapor Deposition (CVD)We offer two types of CVD tools: single-wafer plasma enhanced CVD (PECVD) and batch low
pressure CVD (LPCVD).
Dragon XP8 PECVD systemDragon XP8 is a high-productivity 300mm tool for PECVD applications. The system can be configured
with up to four Dual Chamber Modules (DCM), enabling eight chambers in high-volume production
within a very compact footprint. Processes include a broad range of dielectric PECVD films for
applications such as interconnect dielectrics layers, passivation layers, and etch stop layers.
Advance series batch vertical furnaceThe Advance is our batch vertical furnace tool, available as the A412 for 300mm thermal LPCVD and
as the A400 for LPCVD on smaller wafer sizes. CVD applications on the furnace include polysilicon,
silicon nitride, and silicon oxide.

183ANNUAL REPORT 2017
SHAREHOLDERS & GENERAL INFORMATIONFINANCIAL STATEMENTSGOVERNANCEPERFORMANCE REVIEWSTRATEGY & BUSINESSABOUT
EpitaxyWe offer two families of Epitaxy tools: Intrepid and Epsilon.
Intrepid epitaxy systemIntrepid ES is a 300mm epitaxy tool using our XP platform, and is designed for depositing critical
transistor strain and channel layers. Processes include silicon (Si), silicon-germanium (SiGe),
silicon-carbon (SiC), and other silicon-based compounds. Up to four Intrepid process modules can
be configured on an Intrepid ES system.
Epsilon epitaxy systemThe Epsilon series is a single-wafer, single-chamber tool that deposits silicon-based materials for
many applications, ranging from high-temperature silicon for wafer manufacturing, to low-temperature
silicon, silicon-germanium (SiGe), silicon-carbon (SiC), and other silicon-based compounds. Epsilon
is the market leader for epitaxy applications in the analog and power devices market.
DiffusionWe offer batch vertical furnace tools for diffusion and oxidation applications.
Advance series batch vertical furnaceThe Advance is our batch vertical furnace tool series, available as the A412 for 300mm and as the
A400 for smaller wafer sizes. Atmospheric thermal applications on the furnace include diffusion
to introduce dopants in materials in controlled amounts, annealing to affect material properties
by heating to a specific temperature and oxidation to form silicon oxide.
Service and spare partsService and spare parts are important product offerings for our business. We provide service
support to our customers with technical service personnel who are trained to maintain our systems
at customers’ fabrication plants around the world. Our service team is located globally at regional
and local service centers to assure prompt availability.
We sell spare parts for our equipment from parts stocks located at global distribution centers.

184ANNUAL REPORT 2017
SHAREHOLDERS & GENERAL INFORMATIONFINANCIAL STATEMENTSGOVERNANCEPERFORMANCE REVIEWSTRATEGY & BUSINESSABOUT
DECLARATIONSCOMPLIANCE WITH DUTCH CORPORATE GOVERNANCE CODEThe Dutch Corporate Governance Code was last amended on December 8, 2016. As of 2018,
Dutch listed companies are required to report for the first time on compliance with the revised Code
for the financial year 2017. The full text of the Dutch Corporate Governance Code can be found
on the website of the Monitoring Commission Corporate Governance Code (www.mccg.nl).
ASMI applies the relevant principles and best practices of the revised Code applicable to the
Company, to the Management Board, and to the Supervisory Board, in the manner set out in the
Corporate Governance section, as long as it does not entail disclosure of commercially sensitive
information, as accepted under the Code.
ASMI agrees with principle 3.2.3 of the Code that in most circumstances a maximum severance
payment of one year for Management Board members is appropriate. However, we want to reserve
the right to agree to different amounts in case we deem this to be required by the circumstances. Any
deviations will be disclosed.
RESPONSIBILITY STATEMENTThe members of the Management Board state that, to the best of their knowledge, the statutory
financial statements prepared in accordance with IFRS-EU and Title 9 of part 2 of the Dutch Civil
Code as included in this Annual Report 2017 provide a true and fair view of the assets, liabilities,
financial position, and results of the Company and its subsidiaries included in the consolidated
statements and that the management report provides a true and fair view of the position and the
business of the Company and its subsidiaries, and the Annual Report 2017 provides a description
of the principal risks and uncertainties that the Company faces.
CORPORATE GOVERNANCE STATEMENTASMI complies with the Corporate Governance Code. All required information is part of this
Annual Report.
Corporate governance-related documents are available on our website. These include the Supervisory
Board Profile, Supervisory Board Rules, Management Board Rules, the Audit Committee Charter, the
Nomination, Selection and Remuneration Committee Charter, the Code of Ethics, the Whistleblower
Policy, the Anti-Fraud Policy, the Rules concerning Insider Trading, and the Remuneration Policy.
ARTICLE 10 EU TAKEOVER DIRECTIVE DECREEThe Management Board states that the information required under Article 10 of the EU Takeover
Directive Decree is disclosed in this Corporate Governance chapter to the extent that it is applicable
to ASMI.

185ANNUAL REPORT 2017
SHAREHOLDERS & GENERAL INFORMATIONFINANCIAL STATEMENTSGOVERNANCEPERFORMANCE REVIEWSTRATEGY & BUSINESSABOUT
OTHER INFORMATIONThe additional information below includes a brief summary of the most significant provisions of our
Articles of Association.
INFORMATION ON THE PROVISIONS IN THE ARTICLES OF ASSOCIATION RELATING TO THE APPROPRIATION OF PROFITThe Articles of Association of ASM International NV (the Company) provide the following with regard
to distribution of profit and can be summarized as follows:
› From the profits, distributions shall in the first place, if possible, be made on the preferred shares
equal to the EURIBOR-rate for six months’ loans, increased by one and a half, on the paid-up
amount which had to be paid on the preferred shares, weighted to the number of days to which this
was applicable. If profits are insufficient, the dividend will be paid from the reserves with priority over
any dividends. If the reserves are insufficient, the dividend deficit has to be made up in future years;
› Second, a dividend, if possible, is distributed on financing preferred shares. The dividend is a
percentage of the par value, plus share premium paid, on the financing preferred shares. The
percentage is determined by the Management Board, subject to approval of the Supervisory Board.
The percentage is related to the average effective yield on government loans with a weighted
average remaining term of no more than ten years, if necessary increased or decreased by no more
than three percent, subject to the then prevailing market conditions. If profits are insufficient, the
dividend shall be paid from the reserves. If the reserves are insufficient, the dividend deficit has to be
made up in future years;
› With the approval of the Supervisory Board, the Management Board will determine which part of the
profit remaining after adoption of the provisions of the previous paragraphs will be reserved.
The profit after reserving will be at the disposal of the Annual General Meeting of Shareholders;
› The Company may only make distributions to the shareholders and other persons entitled to profit
insofar as its equity exceeds the amount of the paid-up and called amounts of the share capital
increased with the reserves that must be kept by virtue of law; and
› Article 33, para 3 of the Articles of Association provides that dividend claims expire after the lapse
of five years.
THE PROPOSED APPROPRIATION OF THE RESULTIt is proposed that net earnings for the year 2017 are carried to the accumulated deficit/net earnings.
SPECIAL STATUTORY CONTROL RIGHTSArticle 27 of the Articles of Association provides that each common share gives the right to cast one
vote, each preferred financing share to cast one thousand votes, and each preferred share to cast
one thousand votes.
Article 29 of the Articles of Association provides that meetings of holders of preferred shares
or of financing preferred shares shall be convened as often and insofar as a decision of the meeting
of holders of preferred shares or financing shares desires this, and furthermore as often as the
Management Board and or the Supervisory Board shall decide to hold such a meeting. At the
meeting, resolutions will be passed with an absolute majority of the votes. In the event that there is a
tie of votes, no resolution will take effect.
The following resolutions and actions can only be taken on a proposal by the Management Board
and the Supervisory Board:
› the amendment of the Articles of the Company; and
› the dissolution of the Company.
STICHTING CONTINUÏTEIT ASM INTERNATIONALThe objective of Stichting Continuïteit ASM International (Stichting) is to serve the interests of the
Company. To that objective Stichting may, amongst others, acquire, own and vote on our preferred
shares in order to maintain our independence and/or continuity and/or identity.
The members of the board of Stichting are:
› Dick Bouma, retired Chairman Board Pels Rijcken & Droogleever Fortuijn;
› Rob Ruijter, Chairman Supervisory Board Delta Loyd;
› Rinze Veenenga Kingma, President Archeus Consulting BV.

186ANNUAL REPORT 2017
SHAREHOLDERS & GENERAL INFORMATIONFINANCIAL STATEMENTSGOVERNANCEPERFORMANCE REVIEWSTRATEGY & BUSINESSABOUT
SUBSEQUENT EVENTSSubsequent events were evaluated up to March 16, 2018, which is the issuance date of this
Annual Report 2017. There are no subsequent events to report.
ANNUAL REPORTThe Annual Report, prepared in accordance with International Financial Reporting Standards
(IFRS), is available free of charge by writing to our corporate offices, sending an email
to [email protected] or downloading the file through our website.

187ANNUAL REPORT 2017
SHAREHOLDERS & GENERAL INFORMATIONFINANCIAL STATEMENTSGOVERNANCEPERFORMANCE REVIEWSTRATEGY & BUSINESSABOUT
NON-FINANCIAL DATA GLOSSARYAll boundary scopes are for ASMI Front-end unless noted
INDICATORS DEFINITIONS SECTION COVERED
Staff (Employee) Employee is a person with a fixed contract excluding temporary labor. Definition may be varied by country per local and country labor law. The # of employees at the last day of the reporting period
People and society
Employees in R&D Employees on the last day of the reporting period whose work is directly related to the research and development of the product during the reporting year
Research and development
Patent filings Total number of patent applications filed and applied with patent offices globally by ASMI for the invention described Research and development
Employees based on nationalities The number of nationalities of employees on the last reporting day of the period People and society
Employees covered by collective bargaining agreements
% of employees that are covered by collective bargaining agreements per local labor requirement divided by the total number of employees at reporting year-end
People and society
Reported concerns from anonymous global reporting program SpeakUp!
The number of questions / remarks / concerns reported to the Ethics Office related to a potential violation of the Code of Conduct and Business Policies via reporting tool SpeakUp! in the reporting period
People and society
Voluntary turnover rate Turnover rate is the percentage of employees in a workforce that leave voluntarily during this reporting period People and society
Recordable injury rate The Recordable injury rate measures cases that require a response greater than first aid (or serious injuries) per 100 employees in reporting period
People and society
Injury rate The injury rate is a measure of all first aid or greater injuries per every 100 employees in reporting period People and society
Number (#) of employees completing bi-annual Ethics training
All employees ompleting the online compliance training courses bi-annually during our compliance month within the reporting year. We track # of employees and % of the total that completed the training. It is applicable to all employees
People and society
Ethics concerns reported from anonymous global reporting program SpeakUp!
The # of any ethics concerns reported by employees though our anonymous employee reporting channel SpeakUp!; that may be related to a potential violation of the Code of Conduct and Business Principles or Policies in the reporting year
People and society
Ethics concerns reported through other channels
The # of any ethics concerns reported by employees though other means including directly to management or the Compliance Officer, that may be related to a potential violation of the Code of Ethics and Business Principles or Policies in the reporting year
People and society

188ANNUAL REPORT 2017
SHAREHOLDERS & GENERAL INFORMATIONFINANCIAL STATEMENTSGOVERNANCEPERFORMANCE REVIEWSTRATEGY & BUSINESSABOUT
INDICATORS DEFINITIONS SECTION COVERED
Responsible Business Alliance (RBA) We adopted the industry standard RBA Code of Conduct. More detail about the code can be find at http://www.responsiblebusiness.org/standards/code-of-conduct/
Corporate Responsibility Strategy
Self-assessment Questionnaire (SAQ) risk rating/result
We adopted the RBA standard tool for risk assessment Self-Assessment Questionnaire (SAQ) to assess our own and supply chain risk. This rate apply to our own operation SAQ results with our major sites
Corporate Responsibility Strategy
Critical Suppliers Suppliers that are determined to be critical to our business either because the business spends, or critical components or critical materials, or strategic technical partnership
Supply chain
Supply chain spend by region Total amount of Euro spent with our global suppliers for the materials, components and services that are used to produce our products and services for our customers and for non-product related products services that enable our operations globally in the reporting period
Supply chain
Critical Supplier Commitment % Percent of critical suppliers that have acknowledge their commitment to RBA code or whose code of conduct is assessed to be acceptable as it covers the similar principles of the RBA Code of Conduct
Supply chain
Critical suppliers’ low medium risk rank based on Self-assessment Questionnaire (SAQ) result
Percent of critical supplies who completed the required Supplier Self-Assessment Questionnaire and resulted with low and medium risks Supply chain
Supply chain spends per region (in Euro and %)
Total Euro amount we spent and equivalent to the % of total spends with suppliers by each region Supply chain
Greenhouse Gas (GHG) emissions # of metric tons of CO2 equivalent emissions including both the direct CO2 equivalent emissions (scope 1) and indirect CO2 equivalent emissions (scope 2) in the reporting period
Environment
Water consumption Total amount of water consumption in cubic meters for the reporting period Environment
Landfill diversion rate The percentage of solid waste diverted from landfill via recycling and reuse efforts in the reporting period as generated at ASMI major Manufacturing, Engineering and R&D sites.
Environment

189ANNUAL REPORT 2017
SHAREHOLDERS & GENERAL INFORMATIONFINANCIAL STATEMENTSGOVERNANCEPERFORMANCE REVIEWSTRATEGY & BUSINESSABOUT
DEFINITIONS AND ABBREVIATIONSAENEAS: AENEAS is an association, established in 2006, providing unparalleled networking
opportunities, policy influence & supported access to funding to all types of RD&I participants in the
field of micro- and nanoelectronics enabled components and systems.
AGM: Annual General Meeting of Shareholders (AGM) is the annual general meeting of shareholders.
ALD: Atomic Layer Deposition (ALD) is a surface-controlled layer-by-layer process that results in
the deposition of thin films one atomic layer at a time. Layers are formed during reaction cycles by
alternately pulsing precursors and reactants and purging with inert gas in between each pulse.
BCP: Business Continuity Plan.
CAP: Corrective Action Plan.
CFSI: Conflict-Free Sourcing Initiative (http://www.conflictfreesourcing.org).
CMRT: The CFSI Conflict Minerals Reporting Template (CMRT) is an industry widely adopted standard
template used by companies to collect conflict minerals due diligence data.
Conflict Minerals/3TG: Tin, tantalum, tungsten and gold.
CONNECT!: ASMI’s internal newsletter.
COSO: The Committee of Sponsoring Organizations of the Treadway Commission (COSO) is a joint
initiative of five private sector organizations listed that is dedicated to providing thought leadership
through the development of frameworks and guidance on enterprise risk management, internal
control and fraud deterrence.
CR: Corporate Responsibility.
CVD: Chemical Vapor Deposition (CVD) is a chemical process used to produce high quality, high-
performance, solid materials. The process is often used in the semiconductor industry to produce thin
films. In typical CVD, the wafer (substrate) is exposed to one or more volatile precursors, which react
and/or decompose on the substrate surface to produce the desired deposit. Frequently, volatile by-
products are also produced, which are removed by gas flow through the reaction chamber.
DCM: Dual Chamber Module.
DFX: Term used interchangeably, where the X is a variable which can have one of many possible
values, such as design for manufacturability, power, variability, cost, yield, reliability, or sustainability
(DFS).
DRAM: Dynamic Random Access Memory.
DRC: The Democratic Republic of Congo.
ECO: Engineering change order.
EHS: Environmental, Health & Safety.
EICC: The Electronic Industry Citizenship Coalition (EICC) is the former name of the Responsible
Business Alliance (RBA). The RBA rebranded from EICC in 2017.
Epitaxy (EPI): Epitaxy is one of a portfolio of wafer processing technologies for which we provide
equipment. The word comes from the Greek epi meaning above, and taxis meaning in an ordered
manner. It involves the deposition of silicon or silicon compounds to form layers that help to continue
and perfect the crystal structure of the bare silicon wafer below. Epitaxy improves the electrical
characteristics of the wafer surface, making it suitable for highly complex microprocessors and memory
devices. Selective Epitaxy is an Epitaxy process that only deposits silicon or a silicon compound on
certain predetermined areas of the wafer.
FinFET: A Field Effect Transistor (FET) architecture that uses a raised channel, referred to as a fin, from
source to drain. A finFET is a considered a 3D transistor since the channel is in a vertical orientation.
FLBL: Forced Labor/Bonded Labor.
FMEA: Failure Mode Effects Analysis.

190ANNUAL REPORT 2017
SHAREHOLDERS & GENERAL INFORMATIONFINANCIAL STATEMENTSGOVERNANCEPERFORMANCE REVIEWSTRATEGY & BUSINESSABOUT
GES: ASMI’s Global Employment Standards.
GRI: The Global Reporting Initiative (GRI) is an international independent standards organization that
helps businesses, governments and other organizations understand and communicate their impacts
on issues such as climate change, human rights and corruption (www.globalreporting.org).
IC: Integrated Circuit.
IFRS: International Financial Reporting Standards.
ILO: International Labor Organization.
imec: imec is an internationally renowned research institute that performs research in different fields of
nanoelectronics. It is headquartered in Leuven, Belgium, and has offices in the Netherlands, Taiwan,
US, China, India, Nepal and Japan.
IoT: Internet of Things.
IP: Intellectual Property.
ISO 14001: The ISO 14001 Environment Management System (EMS) standard is an internationally
recognized environmental management standard.
NCG: New College Graduate (NCG).
NGOs: Non-Government Organizations.
LPCVD and Oxidation/Diffusion: Low Pressure Chemical Vapor Deposition (LPCVD) is a thermal
process that deposits various films at low pressure. LPCVD processes include polysilicon, silicon
nitride and silicon oxides. Diffusion (sometimes referred to as annealing) is a thermal treatment used
to move dopants, or impurities, and make dopants introduced by ion implantation electrically active.
Oxidation forms a silicon oxide layer on the wafer’s surface, which acts as an insulating or protective
layer over it.
NAND: A type of nonvolatile memory device technology which does not require power to retain its
data. NAND flash memory is used in mobile phones, USB memory drives, solid state drives and other
electronic products.
OECD: OECD (Organization for Economic Cooperation and Development) is an international
organization helping governments tackle the economic, social and governance challenges of
a globalized economy. It publishes guidance and frameworks such as OECD Due Diligence Guidance
for Responsible Supply Chains of Minerals from Conflict-Affected and High-Risk Areas.
PEALD: Plasma Enhanced ALD (PEALD) uses specific chemical precursors just like in thermal ALD.
However, it also makes use of cycling an RF-plasma to create the necessary chemical reactions in
a highly controlled manner.
PECVD: Plasma Enhanced Chemical Vapor Deposition (PECVD) is the CVD that utilizes plasma to
enhance chemical reaction rates of the precursors. PECVD processing allows deposition at lower
temperatures, which is often critical in the manufacture of semiconductors. The lower temperatures
also allow for the deposition of organic coatings, such as plasma polymers, that have been used for
nanoparticle surface functionalization.
PLC: Product Life Cycle.
R&D: Research and Development.
RBA: Responsible Business Alliance – Industry coalition seeking to create a industry-wide standards
on social, environmental and ethical issues in the industry supply chain. Rebranded from the
Electronics Industry Citizenship Coalition (EICC) in October 2017.
RCOI: Reasonable Country of Origin Inquiries (RCOI).
SAQ: Self-Assessment Questionnaire (SAQ) is one of the EICC’s standardized risk assessment tools.
SDG: United Nations Sustainable Development Goals.
SEAJ: Semiconductor Equipment Association Japan.
SEMI: Semiconductor Equipment and Materials International (SEMI) is a global industry association
of companies that provide equipment, materials and services for the manufacture of semiconductors,
photovoltaic panels, LED and flat panel displays, micro-electromechanical systems (MEMS), and
related micro and nanotechnologies.

191ANNUAL REPORT 2017
SHAREHOLDERS & GENERAL INFORMATIONFINANCIAL STATEMENTSGOVERNANCEPERFORMANCE REVIEWSTRATEGY & BUSINESSABOUT
LOCATIONS WORLDWIDEEUROPE
THE NETHERLANDSASM International NV (HEADQUARTERS)Versterkerstraat 8
1322 AP Almere
T: +31 88 100 8810
F: +31 88 100 8820
ASM Europe BVVersterkerstraat 8
1322 AP Almere
T: +31 88 100 8711
F: +31 88 100 8710
ASM IP Holding BVVersterkerstraat 8
1322 AP Almere
T: +31 88 100 8810
F: +31 88 100 8820
BELGIUMASM Belgium NVKapeldreef 75
3001 Leuven
T: +32 16 28 1639
FINLANDASM Microchemistry OyPietari Kalmin katu 1 F 2
00560 Helsinki
T: +358 9 525 540
FRANCEASM France SARL223 Rue des Bécasses
38920 Crolles
T: +33 4 7692 2824
F: +33 4 3892 0472
GERMANYASM Germany Sales BVBretonischer Ring 16
85630 Grasbrunn
T: +49 89 462 3650
F: +49 89 462 36566
IRELANDASM Services & Support Ireland LtdUnit 23, Hills Industrial Estate
Lucan, K78 P661
Co Dublin
T: +353 1 621 9100
F: +353 1 628 0206
ISRAELASM Services & Support Israel Ltd2 Hazaron St
Kiryat-Gat 82109
T: +972 8 612 3077
NORTH AMERICA
UNITED STATESASM America, Inc3440 East University Drive
Phoenix, AZ 85034
T: +1 602 470 5700
Regional Sales/Service Office97 East Brokaw Road
Suite 100
San Jose, CA 95112
T: +1 408 451 0830
Regional Service Office7235 NE Evergreen Parkway
Suite 200
Hillsboro, OR 97124
T: +1 503 629 1360
ASIA
CHINAASM China LtdA/N, 15F, No 720 Pudong Avenue
Shanghai 200120
T: +86 21 50 368 588
F: +86 21 50 368 878
JAPANASM Japan KK23-1, 6-chome Nagayama
Tama-shi
Tokyo 206-0025
T: +81 42 337 6311
F: +81 42 389 7555
Daini Technology Center7-2, 2-chome, Kurigi
Asao-ku, Kawasaki-shi
Kanagawa 215-0033
T: +81 44 712 3681
F: +81 44 712 3682
Kumamoto Service Center3F, Mayfair-Suizenji
21-30, 1-chome, Suizenji
Chuo-ku, Kumamoto-shi
Kumamoto, 862-0950
T: +81 96 387 7300

192ANNUAL REPORT 2017
SHAREHOLDERS & GENERAL INFORMATIONFINANCIAL STATEMENTSGOVERNANCEPERFORMANCE REVIEWSTRATEGY & BUSINESSABOUT
Nagaoka Factory392-1 Mishimashimbo
Nagaoka-shi
Niigata 940-2311
T: +81 258 42 2400
F: +81 258 41 2490
Yokkaichi Service Center3F, Kosco-Yokkaichi-Nishiura Building
5-10, 1-chome, Yasujima, Yokkaichi-shi
Mie 510-0075
T: +81 59 340 6100
F: +81 59 340 6099
MALAYSIAASM Services & Support Malaysia Sdn BhdSuite 17 and 18, First Floor
Incubator Block, Kulim Techno Centre
Kulim Hi-Tech Park
09000, Kulim
Kedah Darul Aman
T: +604 403 9330
F: +604 403 9332
SINGAPOREASM Front-End Manufacturing Singapore Pte Ltd543 Yishun Industrial Park A
Singapore 768765
T: +65 6512 2922
F: +65 6512 2966
ASM Wafer Process Equipment Singapore Pte Ltd543 Yishun Industrial Park A
Singapore 768765
T: +65 6512 2962
F: +65 6512 2961
SOUTH KOREAASM Korea LtdHead Office
SungKong-kwan 1 Dong
Cheonan Valley, ChungNam
Techno Park
136, Jiksan-ro, Jiksan-eup
Seobuk-ku, Cheonan-si
Chungcheongnam-do, 31035
T: +82 70 7596 7800
F: +82 41 5890 201
ASM Korea LtdBunDang Branch Office
10F, 1-Dong, 17, 228 St
Pankyo-ro, Bundang-ku
Sungnam-si
Gyeonggi-do, 13487
T: +82 70 7596 7788
F: +82 31 8016 9970
TAIWANASM Front-End Sales &Services Taiwan Co, LtdHsin-Chu Office
2F-5, No 1, Jinshan 8th St
East Dist, Hsinchu City 300
T: +886 3 666 7722
F: +886 3 564 8899
ASM Front-End Sales &Services Taiwan Co, LtdLin-Kuo Office
2F, No 50, Fuxing 3rd Rd
Guishan Dist, Taoyuan City 333
T: +886 3 211 5279
F: +886 3 328 5358
ASM Front-End Sales &Services Taiwan Co, LtdTai-Chung Office
Unit 6A, 6F, 168 Guoan Rd
Xitun Dist, Taichung City 407
T: +886 4 2465 1086
F: +886 4 2463 3707
ASM Front-End Sales &Services Taiwan Co, LtdTai-Nan Office
Rm 612, 6F, No 13, Guoji Rd
Xinshi Dist, Tainan City 744
T: +886 6 589 2368
F: +886 6 589 2710

193ANNUAL REPORT 2017
SHAREHOLDERS & GENERAL INFORMATIONFINANCIAL STATEMENTSGOVERNANCEPERFORMANCE REVIEWSTRATEGY & BUSINESSABOUT
SAFE HARBOR STATEMENTIn addition to historical information, some of the information posted or referenced herein or on the
website contains statements relating to our future business and/or results, including, among others,
statements regarding future revenue, sales, income, expenditures, sufficiency of cash generated
from operations, maintenance of interest in ASM Pacific Technology Ltd, business strategy, product
development, product acceptance, market penetration, market demand, return on investment
in new products, facility completion dates and product shipment dates, corporate transactions,
restructurings, liquidity and financing matters, outlooks, and any other non-historical information.
These statements include certain projections and business trends, which are ‘forward-looking’.
We caution readers that no forward-looking statement is a guarantee of future performance and that
actual results could differ materially from those contained in the forward-looking statements.
You can identify forward looking statements by the use of words like ‘may’, ‘could’, ‘should’,
‘project’, ‘believe’, ‘anticipate’, ‘expect’, ‘plan’, ‘estimate’, ‘forecast’, ‘potential’, ‘intend’, ‘continue’,
and variations of these words or comparable words.
Forward-looking statements do not guarantee future performance and involve risks and uncertainties.
You should be aware that our actual results may differ materially from those contained in the forward-
looking statements as a result of certain risks and uncertainties. These risks and uncertainties
include, but are not limited to, economic conditions and trends in the semiconductor industry and
the duration of industry downturns, currency fluctuations, the timing of significant orders, market
acceptance of new products, competitive factors, litigation involving intellectual property, shareholder
or other issues, commercial and economic disruption due to natural disasters, terrorist activity, armed
conflict or political instability, epidemics and other risks indicated in our most recently filed Statutory
Annual Report and other filings from time to time. The risks described are not the only ones. Some
risks are not yet known and some that we do not currently believe to be material could later become
material. Each of these risks could materially affect our business, revenues, income, assets, liquidity,
and capital resources. All statements are made as of the date of posting unless otherwise noted,
and we assume no obligation to update or revise any forward-looking statements to reflect future
developments or circumstances.
194ANNUAL REPORT 2017
SHAREHOLDERS & GENERAL INFORMATIONFINANCIAL STATEMENTSGOVERNANCEPERFORMANCE REVIEWSTRATEGY & BUSINESSABOUT
PRIVACY STATEMENT ASMI is committed to protecting the privacy of the users of this website. This policy describes how ASMI collects and uses personally identifying information of users of our website. If you choose to give us personal information, we will treat it according to this policy. ASMI encourages you to read this privacy policy and those of all websites you visit.
WHAT INFORMATION IS COLLECTEDIn general, when you visit our website and access information, you will remain anonymous. For
some services provided through our website, we will ask you to register using online registration
forms. A registration form will ask for information both about the company to be registered and
the individual employees who will use our online services as representatives of the company. For
some website services, you will be asked to provide a password and user identification. This
information is collected to confirm eligibility for use of the online services, to establish the identity
of the company and authorized users, and for business contact purposes. Some services available
on our website involve the purchase of ASMI equipment or spare parts by our customers. If you
elect to engage in e-commerce transactions on our website, you will be asked to provide information
necessary to facilitate transactions such as shipping address and payment instructions. In addition
to information you provide, ASMI may collect information about your use of our website that will help
ASMI improve its online services (for example, the pages you access on our sites, the name of your
Internet Service Provider, the site that referred you to the website, what browser you are using, your
IP address, etc.). This information may be used to analyze trends and statistics and monitor link
usage. If you choose to post messages in message areas or to provide feedback or send an email
to us, we may keep a record of that posting or correspondence. Information you disclose in a public
message area will naturally be available to and shared with other users of our website. ASMI will only
use your personal information in the ways specified when it was collected. We will not subsequently
change the way in which we use your personal information, unless you consent to the new usage.
HOW WE USE INFORMATIONASMI may use your personal information for ASMI’s own marketing purposes. This may include
providing you with information targeted to your interests. We will give you the opportunity
to elect not to receive direct-marketing materials from us. ASMI does not sell any personally
identifiable information.
SHARING INFORMATIONWe want to know you better so we can serve you better. However, the choice whether you want
this kind of service is up to you. You should know that your personally identifiable information
may be transferred from your home country to other ASMI companies around the world who may
communicate with you about our products or special offers you may find useful. Your data may
also be transferred to countries outside the European Union. When you place an order or otherwise
participate in an e-commerce transaction opportunity, we will use your personally identifiable
information to facilitate the transaction. ASMI may also maintain transaction history information
about our website users. The primary use of your information is to enable ASMI to deliver specific
services or products you request or to complete a transaction initiated by you. During the course
of completing a transaction initiated by you, ASMI may provide your contact or other information to a
trading partner or other party to the transaction (e.g. financier or bank).
DATA SECURITYASMI uses industry standard efforts to safeguard the confidentiality of your personally identifiable
information. Access to your personal information is limited to ASMI employees and authorized
third party agents (e.g. shipping companies) who need it to do their job. We only provide third
party agents with the minimum amount of information needed to complete the requested service
or transaction. We do not otherwise share your personal information with third parties, unless you
have granted us permission to do so. Unfortunately, it is impossible to absolutely guarantee the
security of data transmission over the internet or any wireless network. Therefore, although we take
reasonable measures to protect your information, ASMI cannot ensure the security of any information
you transmit to us or from online services and you do so at your own risk. Once we receive your
transmission, we will use industry standard efforts to ensure its security on our systems.

195ANNUAL REPORT 2017
SHAREHOLDERS & GENERAL INFORMATIONFINANCIAL STATEMENTSGOVERNANCEPERFORMANCE REVIEWSTRATEGY & BUSINESSABOUT
DATA RETENTIONASMI will not retain your personal information longer than is necessary for the purposes for which
it was collected.
LINKED WEBSITESWe provide links to third party websites. Since we do not control these third party websites,
we encourage you to review the privacy policies posted on these websites.
CHILDREN’S PRIVACY We do not knowingly collect personal information from children under the age of 13. If we learn that
we have personal information on a child under the age of 13, we will delete that information from
our systems.
USE OF COOKIESA “cookie” is an element of data that a website can send to your browser for possible storage on your
computer. Some areas of this Website may use cookies. Cookies help us provide a better user
experience by measuring which website areas are of greatest interest. Cookies may also be used
to store useful information that enables our website to remember you when you return. ASMI can
only read cookies produced by the website. If you choose to disable cookies in your browser, you
can still access most areas of our website. However, some areas of the website will not allow you
to complete certain activities if cookies are disabled. For example, our e-commerce site uses cookies
to process transactions. If you do not accept cookies, you will not be able to place an order on our
e-commerce site.
UNSUBSCRIBINGEach email newsletter has instructions on how to unsubscribe.
POLICY UPDATESAll updates to this policy will be posted here. Last update: April 9, 2015.
Please contact us at [email protected] if you have any questions about this privacy policy.

ASM International NVVersterkerstraat 81322 AP AlmereThe Netherlands
Published on March 16, 2018


![On the Expanding Earth and Shrinking Moon · The energy source of the expansion of the Earth and the shrinking of the Moon is not thermal in origin or ... [17] [18] to drive this](https://img.dokumen.tips/doc/110x75/5fb5494314662f389d38f824/on-the-expanding-earth-and-shrinking-moon-the-energy-source-of-the-expansion-of.jpg)