Embed Size (px)
Citation preview

Should school-level results of national assessments
be made public?
Atsuyoshi Morozumi
University of Nottingham∗
Ryuichi Tanaka
University of Tokyo†
September 29, 2019
Abstract
How national standardized assessments should be designed has been debated exten-
sively. This paper contributes to this debate by examining empirically how the public
disclosure of information on school-level assessment scores impacts student outcomes.
To this end, we highlight the policy reform in Japan in 2014, whereby the Ministry
of Education granted each municipality the discretion to decide whether to make as-
sessment results of each school within the municipality public. Utilizing the resulting
variations in the information disclosure system across municipalities, we show that the
disclosure of school-level test scores increases students’ average test scores, without
increasing the dispersion of individual scores among students. Inspecting the mecha-
nism, schools under accountability pressure make better use of diagnostic information
from assessments to improve teaching quality. Analysis further reveals that publishing
school-level results could also enhance students’ non-cognitive skills.
Keywords: National assessments, Student outcomes, School-level results, Information
disclosure, School accountability
JEL: D80, I20, I28
∗School of Economics, University of Nottingham, University Park, Nottingham NG7 2RD, UK. Email:
[email protected].†Institute of Social Science, University of Tokyo, 7-3-1 Hongo Bunkyo-ku Tokyo 113-0033, Japan, Email:
1

1 Introduction
National assessments are common across the world. For example, OECD (2015) report that
32 out of 38 OECD (and partner) countries conducted national assessments, a type of stan-
dardized student achievements tests which do not affect students’ progression through school
or certification, at the primary education level in 2015.1 While their main purpose is to raise
student achievements, say, by providing student diagnostic information with schools, a closer
look reveals that there are substantial variations in how they are conducted. Those variations
across assessments span various aspects, including the proportion of students who partic-
ipate, the range of subjects covered, and the frequency at which tests are conducted. In
this paper, we highlight one key variation on the level of assessment results which are made
available to the public, and investigate how this variation affects student outcomes.
To clarify, with national assessments being mainly used as a diagnostic tool, schools
and parents are usually informed of results of their students and a result of their child,
respectively. However, a country has to make a decision as to the level of the aggregation
of assessment results shared with the public (and media). While in theory the information
shared could be at the level of country/state, province/prefecture, municipality, school, or
even an individual student, an extensive debate has surrounded whether school-level results
should be made public. This controversy is reflected in the state where there are a mixture
of countries which disclose school-level results and which do not. For instance, the aforemen-
tioned OECD (2015) indicates that at the primary education level, only 14 of the OECD
countries (e.g., Australia, Chile, Netherlands) using national assessments published results
at the school level, while essentially all of them did so at the country level.
Various rationale for and against sharing school-level results with the public have been put
forward (see Rosenkvist (2010) for useful survey). To illustrate, arguments for it include 1)
increased transparency enhances school accountability, 2) enhanced accountability, in turn,
1As another type of a standardized test, OECD (2015) define national examinations as the ones whichhave a formal consequence for students, such as an impact on a student’s eligibility to progress to a highereducation level or to complete an officially-recognized degree.
2

may improve school management, and 3) competition across schools may promote teaching
quality. Meanwhile, arguments against it include 1) competition may creates bias towards
teaching for tests, 2) it is difficult to ensure the sound usage of information by the public,
and 3) a possibly ill-informed school ranking could be established. This debate on a possible
trade-off also applies to the case of Japan, a country featured in the following analysis. For
example, a survey by the Ministry of Education, Japan (MEXT (2013)) shows that in 2013
there was a stark disagreement among local education policymakers on the desirability of
school-level national assessment results being public.2 There, a popular argument for it was
that it helps a local authority be accountable for the performance of schools it manages,
whereas a key argument against it was that it could be used inappropriately to rank schools.
To contribute to this debate, this paper investigates empirically how the public disclosure
of school-level results of national assessments affects various student outcomes. To this end,
we use sixth-grade student-level data from the national assessment in Japan (called National
Assessment of Academic Ability). The main reason why the Japanese data, which span the
2007-2018 period, is useful in the current context is that the policy reform in 2014 granted
each municipality an authority to decide whether to make results of national assessments
public at the school level (there are 1,718 municipalities across Japan).3 Until the reform,
the only officially-published information on national assessment results was the one at the
country and prefecture level (there are 47 prefectures), while the reform immediately led
136 municipalities to make school-level average scores of each subject publicly available. Our
estimation exploits the resulting variations in the information disclosure system across mu-
nicipalities, highlighting the case of Saitama prefecture.4 The secondary reason why Japanese
data are useful is that information on national assessment scores is accompanied by students’
as well as schools’ responses to various survey questions. This set of information allows us
2The official name of Ministry of Education, Japan is Ministry of Education, Culture, Sports, Scienceand Technology, Japan (MEXT).
3There was no assessment in 2011, the year in which the Great East Japan Earthquake struck.4The reason why we focus on Saitama prefecture is elaborated below.
3

to consider channels through which the reform affected student outcomes, and also how it
affected not only cognitive but also non-cognitive skills of students.
Our results are summarized as follows. First, the public provision of school-level assess-
ment results increases the average test scores of students who attend schools whose results
are made public. This result holds regardless of the subject (Japanese and Mathematics)
and also the contents (basics and applications). Inspecting the mechanism, schools whose
results were made public indeed become more accountable, and explain their performances
better to the public. This increase in school accountability then coincides with the better
use of diagnostic information from assessments to improve teaching quality. Next, analyzing
possible trade-offs of the information disclosure, we investigate the possibility of students
with poor performance being left behind. We find that the within-school variance of test
scores rather falls particularly when contents of assessments are basics, suggesting that it is
poorly-performed students’ scores which increase relatively more. Further, we examine the
impact on students’ non-cognitive skills, to check if the improved test performance might be
offset by an adverse impact on them. Results show that there are no such adverse effects,
and there are even some positive impacts, for example, on students’ self-confidence. On bal-
ance, therefore, our results indicate that publishing school-level results may be a good design
feature of national assessments, at least from the perspective of student outcomes.
This paper is related to a number of works which analyze the role of large-scale (not
necessarily national-level) assessments as an accountability intervention tool. That is, while
the main use of such assessments is often to provide schools with student diagnostic infor-
mation, they can also be used to enhance school accountability. The most explicit way to
achieve this would be to link poor student achievements to punitive measures on schools.
In this context, Rockoff and Turner (2010) find that grading each school based on student
tests and linking it to rewards and punitive measures led to a swift significant increase in
student achievement in lowly-graded schools in New York City. Rouse et al. (2013) show
that in Florida, schools facing accountability pressure changed their instructional practices,
4

which, in turn, contributed to their gains in test scores.5 These results are further echoed by
a finding of other works that school accountability improves average student achievement in
US states, as summarized in Figlio and Loeb (2011).6
Also, there are papers which shed light on the role of information provision (rather than
explicit punitive measures) as an accountability-inducing device. For example, Andrabi et al.
(2017) find that in Pakistan information provision of school test scores increases subsequent
test scores, while increasing enrollment rate and reducing school fees. Camargo et al. (2018)
show that in Brazil the disclosure of school-level test results has a positive impact on student
performance only in private schools. Their interpretation is that this happens because only
school managers of private schools are subject to market incentives in the country. Further,
Koning and van der Wiel (2012) show that in Netherlands the publication of relative quality
ratings of secondary schools in a national newspapers increases test scores, particularly at
the lower support of performance distribution. Other papers such as Hastings and Weinstein
(2008) and Koning and van der Wiel (2013) rather emphasize how information provision of
school performances could affect parents’ (and students’) school choices in North Carolina,
US, and Netherlands, respectively.7
Further, while this paper shows that the public disclosure of school-level test results leads
to an increase in the average test scores in Japan, we also examine whether this positive
impact is offset by promoting inequity among students. In relation to this, some papers
investigate how the accountability inducing nature of large-scale assessments impacts the
distribution of student achievements. Dee and Jacob (2011), for example, examine the effects
of No Child Left Behind (NCLB) Act on the distribution of student achievements, and
find mixed effects depending on subjects and grades. Ahn and Vigdor (2014), considering
5Chiang (2009) also examines the mechanism through which accountability pressure affects student out-come, showing, for instance, that sanction threats raise school spending on instructional technology.
6Early related works include Hanushek and Raymond (2005), who show that while accountability mattersfor student achievements in the US, attaching consequence to performance has a particularly positive impacton achievement.
7Mizala and Urquiola (2013) examine whether information on schools’ value added, rather than absoluteoutcomes, affects parents’ school choices and schools’ market outcomes in Chile, and find that it does not.
5

the impact of sanctions incorporated into NCLB on students, find that while sanctions
particularly for low proficiency benefit lower-performing students, they do not result in
countervailing negative effects on higher-performing students. We also examine the possibility
that disclosing school-level results may prompt schools to be negligent in caring for student
outcomes beyond test scores, i.e., non-cognitive skills. This aspect of our paper is similar to
Blazar and Kraft (2017), who consider teachers’ impacts on students’ test scores, together
with impacts on non-cognitive skills.8
Overall, this paper contributes to the debate on the design of national assessments, by
investigating the impacts of disclosing school-level results on a range of student outcomes,
including the average test scores, the distribution of scores, and students’ non-cognitive skills.
The rest of the paper is organized as follows. Section 2 explains the background of the paper,
highlighting the educational policy reform in Japan in 2014. Section 3 explains the empirical
methodology, and Section 4 describes the data. Section 5 presents results. Last, Section 6
offers concluding remarks.
2 Background: Reform on national assessment in Japan
To explain details of the policy reform in 2014 on information disclosure of national assess-
ments, we first briefly review 1) how national assessments have been conducted in Japan,
and 2) how in general education policies are implemented at the local government level.
In Japan, national assessments have been conducted annually since 2007 in April each
year, targeting 6th and 9th grade students (the last years of elementary and junior high
schools, respectively).9 All students all over Japan (about 1.1 million students in each grade
as of 2017) participated in them, except for 2009, 2010, and 2012 when random sampling of
students (about 30%) took part. In 2011, however, the assessment was canceled altogether
8Blazar and Kraft (2017) call non-cognitive skills attitudes and behaviors.9Official name of the assessments is National Assessment of Academic Ability.
6

due to the impact of Great East Japan Earthquake.10 While the subjects assessed changed
year by year, Japanese and Mathematics have always been assessed for both grades.11 Fur-
ther, to assess separately students’ understanding of basics and their ability to apply them,
subjects are divided into two components of basics and applications.
While the Ministry of Education implements education policies which are applicable
throughout Japan, local governments are given a high degree of discretion, creating a wide
variety in the education system across them. One key feature of education policies at the
local level is that governors of 47 prefectures and mayors of 1,718 municipalities (which
are subordinate to prefectures) are not given an authority to conduct them on their own.
Instead, the board of education (BoE), an executive body of (usually) 5 members in each
of prefectures and municipalities, are responsible for designing and then implementing all
the education policies such as the establishment and abolishment of public schools, the
appointment and allocation of teachers, and the selection of textbooks.12 Accordingly, an
education policy announcement from the central authority of the Ministry of Education is
made to the BoEs at the prefecture-level, and then to the ones at the municipality level.
In November 2013, the Ministry of Education announced to BoEs that rules on informa-
tion disclosure of national assessments (National Assessment of Academic Ability) would be
changed from assessments conducted in April 2014. The key contents of this reform are that
it granted BoEs at the municipality level an authority to decide whether to make school-
level results of national assessments (within the municipality) available to the general public,
whereas BoEs at the prefecture level were allowed to make municipality-level results (within
the prefecture) publicly available. In contrast, until the previous assessments implemented in
April 2013, BoEs at the municipality level only had an option to disclose the municipality-
level assessment results of their own, while prefecture-level BoEs were obliged to publish
10In 2016, students in the area of Kumamoto (a prefecture located in the Kyushu region, a south part ofJapan) did not participate, due to the major earthquake happened in the area.
11In some years, natural science was also assessed.12This does not mean that governors and mayors do not have any influence on education policy making,
since they are responsible for budget execution of education policies in conjunction with other public policies.
7

their own prefecture-level results without an option of publishing municipality-level results.
Thus, the bottom line of this reform was that BoEs were given an authority to disclose more
disaggregated information on national assessment results to the public.
In what follows, we focus on the impact on student outcomes of the options granted to
municipality-level BoEs on the publication of school-level results. As an important clarifica-
tion, note that there are two alternative ways of making school-level results public. The first
is that municipality BoEs could publish assessment results of schools under their supervi-
sion altogether in one place, say, on their own websites. And, the second is that they could
instruct schools under their supervision to publish their own results, say, on their respective
school websites. According to the survey conducted by the Ministry of Education in Novem-
ber 2014, the reform prompted 32 municipality BoEs across Japan to publish school-level
average scores by subjects, and led 104 BoEs to instruct schools under their supervision to
make them public. We below exploit these resulting variations in the information disclosure
system across municipalities within a prefecture called Saitama, to estimate the impact of
publishing school-level assessment results on student outcomes.
3 Empirical methodology
Our benchmark model for empirical analysis is the following:
Yismt = β0 + β1 Tm + β2Aftert + β3(Tm ∗ Aftert) +Xismt γ1 + Zsmt γ2
+ Emt δ + εismt,
(1)
where Yismt represents test result of student i in school s located in municipality m in year t. In
the right hand side, Tm is a treatment dummy which takes the value of one if in municipality
m school-level results are published after 2014, the year of the reform. Aftert is a year
dummy variable, taking the value of one in years after 2014. Xismt is a vector containing
variables reflecting student’s home environment. In turn, Zmst are variables related to a
8

school environment. Last, Emt contains a various types of municipality education expenditure
per student averaged over past 3 years. We include three-year average of municipality-level
education expenditure since education spending from the third to fifth grade may particularly
matter for educational outcomes measured by test scores in sixth grade. Our main focus
below is the coefficient on the interaction between the treatment and after-reform dummies.
If disclosure of school-level information improves test results, β3 > 0.
Our identification strategy builds on the difference-in-differences estimator with the re-
gression equation above (Eq.1). Identifying assumption for the effect of disclosure of school-
level information on test scores is that the treatment status Tm is uncorrelated to the error
term εismt. One justification for the exogeneity of Tm is that the treatment status is de-
termined by the board of education of municipality, and thus the decision of disclosure
of school-level information is exogenously determined from the viewpoints of students and
schools. However, municipality-specific unobserved factors correlated to the treatment status
may affect student-level test scores. To account for this potential threat for identification, we
control school fixed effects capturing the effect of time-invariant municipality-specific unob-
served heterogeneity. In addition, although we calculate standard errors clustered at school
level in the benchmark case, we calculate standard errors clustered at municipality level too
as a robustness check, and account for the potential correlation of time-varying shocks across
years and schools within municipality. Moreover, as a test of the identifying assumption with
a difference-in-differences estimator, we test a parallel trend assumption by conducting event
study analysis.
4 Data
Our fundamental data source is student-level data of the National Assessment of Academic
Ability, Japan’s ongoing national assessment. As mentioned, this assessment has been con-
ducted annually since 2007 in April each year, targeting all 6th and 9th grade students,
9

except for 2009, 2010, and 2012 when random sampling of students (about 30%) took part
and 2011 due to the Great East Japan Earthquake. We use student-level information of
Japanese and Mathematics test scores, together with students’ responses to questionnaire
covering various aspects of 1) home environment, 2) studying behavior, and 3) non-cognitive
traits. Student-level test scores are available for Japanese and Mathematics, both of which
are further divided into scores on “basics” denoted as A (e.g., Japanese A) and “applications”
as B. Assessments are also accompanied by school questionnaires which covers various as-
pects of school environment such as the class size, the proportion of students receiving school
financial assistance (for students from low-income family), and the composition of teachers
with different years of experience.
We focus our analysis on 6th grade students in public primary schools in cities of Saitama
prefecture (population is about 7.3 million, the fifth-largest prefecture of Japan; Figure 1).
The reason for this choice is at least threefold. First, because education policies including
the recruitment and allocation of teachers within a prefecture is conducted by the board
of education (BoE) at the prefecture (not municipality) level, focusing on one prefecture
ensures the homogeneity of education policies implemented at the prefecture level. Second,
the availability of the student-level data is relatively high in Saitama. To explain, before we
asked for a permission from the Ministry of Education to use the student-level results of the
national assessments for this research, the Ministry had to ask first for a permission from
municipality BoEs all over Japan, to let the data to be used for research purposes (including
ours). In the end, a substantial proportion of them (almost 70 percent) did not allow their
data to be used (by researchers) with their municipality name revealed. This means that for
those municipalities, it is not possible to match with the treatment status of disclosure of
national assessment results. However, the majority of municipality-level BoEs in Saitama
prefecture agreed to provide data with their municipality names revealed, facilitating our
research: 33 out of the total of 40 cities within the prefecture agreed (82.5 percent, much
higher than the national average of 30 percent). Third, we focus on students in public primary
10
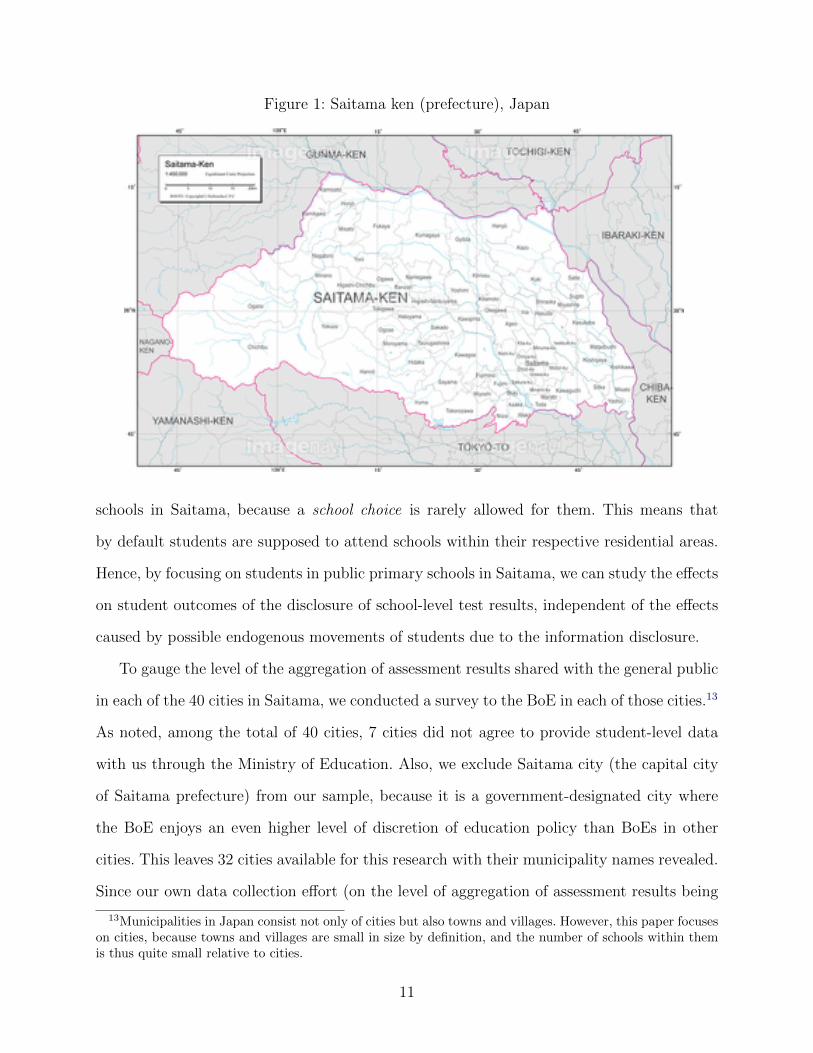
Figure 1: Saitama ken (prefecture), Japan
schools in Saitama, because a school choice is rarely allowed for them. This means that
by default students are supposed to attend schools within their respective residential areas.
Hence, by focusing on students in public primary schools in Saitama, we can study the effects
on student outcomes of the disclosure of school-level test results, independent of the effects
caused by possible endogenous movements of students due to the information disclosure.
To gauge the level of the aggregation of assessment results shared with the general public
in each of the 40 cities in Saitama, we conducted a survey to the BoE in each of those cities.13
As noted, among the total of 40 cities, 7 cities did not agree to provide student-level data
with us through the Ministry of Education. Also, we exclude Saitama city (the capital city
of Saitama prefecture) from our sample, because it is a government-designated city where
the BoE enjoys an even higher level of discretion of education policy than BoEs in other
cities. This leaves 32 cities available for this research with their municipality names revealed.
Since our own data collection effort (on the level of aggregation of assessment results being
13Municipalities in Japan consist not only of cities but also towns and villages. However, this paper focuseson cities, because towns and villages are small in size by definition, and the number of schools within themis thus quite small relative to cities.
11
made public) is ongoing, our baseline dataset currently consists of 19 cities for which the
information of treatment status is available by now (as of September 2019). Focusing on
assessments for 6th-grade students in these 19 cities from 2007 to 2018, observations are up
to 188,685 students.
In our analysis, treatment cities are defined as cities where school-level information of the
results of national assessments is available to the public after 2014. As emphasized, there are
two types of cities in a treatment group. We call treated cities as Type 1 if (municipality-
level) BoE publishes on their website the list of school-level average test scores by subjects.
We categorize Chichibu city and another city (call it X) in Type 1 treatment group.14 We call
cities as Type 2, if the BoE instruct schools under their supervision to publish school-level
scores on their respective school websites. We categorize Okegawa, Fukaya, and Sayama
cities as Type 2. The remaining 14 cities are cities where school-level information is not
available to the public throughout the sample period, thus categorized as a control group. In
the benchmark analysis below, we use only Chichibu, city X, and Okegawa as a treatment,
leaving Fukaya and Sayama out of our sample. This is because we could not verify the claim
of Fukaya’s BoE that they instruct all the public schools to publish their results on their
school websites.15 On Sayama city, the BoE could not confirm with us in which year they
started disclosing information on school-level results. That is, it has to be after 2014 (the year
of the reform), but they could not specify when. All in all, therefore, the following analysis
(at least in this version of the paper) covers 3 treatment cities and 14 control cities. To note,
however, key results below are robust even when Fukaya and Sayama cities are included as
a treatment.
We use data on education spending per student (decomposed into various components
of consumption and capital spending) in each municipality for each year, taken from the
School Basic Survey conducted by the Ministry of Education. Controlling for the detailed
information on education spending is useful, because even if student outcome improved in
14When we interviewed the BoE of city X, they asked us to keep their name anonymous.15We only managed to confirm the availability of school-level results for 5 out of 19 schools in Fukaya city.
12
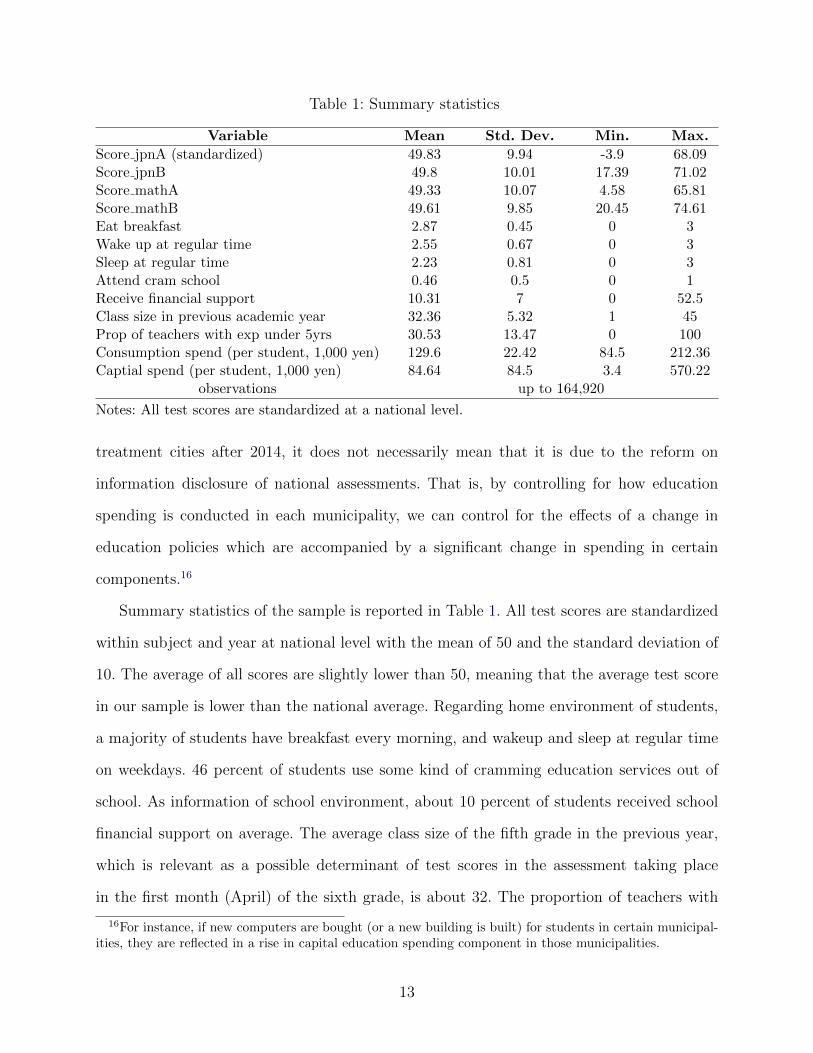
Table 1: Summary statistics
Variable Mean Std. Dev. Min. Max.
Score jpnA (standardized) 49.83 9.94 -3.9 68.09Score jpnB 49.8 10.01 17.39 71.02Score mathA 49.33 10.07 4.58 65.81Score mathB 49.61 9.85 20.45 74.61Eat breakfast 2.87 0.45 0 3Wake up at regular time 2.55 0.67 0 3Sleep at regular time 2.23 0.81 0 3Attend cram school 0.46 0.5 0 1Receive financial support 10.31 7 0 52.5Class size in previous academic year 32.36 5.32 1 45Prop of teachers with exp under 5yrs 30.53 13.47 0 100Consumption spend (per student, 1,000 yen) 129.6 22.42 84.5 212.36Captial spend (per student, 1,000 yen) 84.64 84.5 3.4 570.22
observations up to 164,920
Notes: All test scores are standardized at a national level.
treatment cities after 2014, it does not necessarily mean that it is due to the reform on
information disclosure of national assessments. That is, by controlling for how education
spending is conducted in each municipality, we can control for the effects of a change in
education policies which are accompanied by a significant change in spending in certain
components.16
Summary statistics of the sample is reported in Table 1. All test scores are standardized
within subject and year at national level with the mean of 50 and the standard deviation of
10. The average of all scores are slightly lower than 50, meaning that the average test score
in our sample is lower than the national average. Regarding home environment of students,
a majority of students have breakfast every morning, and wakeup and sleep at regular time
on weekdays. 46 percent of students use some kind of cramming education services out of
school. As information of school environment, about 10 percent of students received school
financial support on average. The average class size of the fifth grade in the previous year,
which is relevant as a possible determinant of test scores in the assessment taking place
in the first month (April) of the sixth grade, is about 32. The proportion of teachers with
16For instance, if new computers are bought (or a new building is built) for students in certain municipal-ities, they are reflected in a rise in capital education spending component in those municipalities.
13

teaching experience less than 5 years is 31 percent on average. As the municipality level
information, the average amount of consumption spending per student (an average of the
past three years) is about 130,000 JPY (1200 USD). Similarly, capital spending is about
85,000 JPY (786 USD).
5 Results
5.1 Impact of information disclosure on test scores
5.1.1 Baseline results
Table 2 summarizes the estimates of the coefficient on the interaction term between the
treatment dummy and the after dummy (i.e., difference-in-differences estimates; β3 in Eq.1)
for each subject (i.e., Japanese and Mathematics) and the content (i.e., A and B). Column
1 is for the estimates of the effect of information disclosure by regressing each test score
without control. All coefficients are statistically significant at 1 percent level. The magnitude
of the coefficients ranges from 1.144 (Mathematics B) to 1.394 (Japanese B). For example,
the coefficient for Japanese A implies that test score of Japanese A of 6th grade students
in public primary schools of treated cities increased by 1.334 points (i.e., 0.1334 standard
deviation) compared to those in control cities after the disclosure of test results in treated
cities (i.e., after 2014). The effects are larger for Japanese than mathematics.
The estimates reported from the second to fifth columns are ones with different sets of
controls. We sequentially add controls of year fixed effects (Column 2), student-level home
environment variables (Column 3), variables of school environment (Column 4), and school
fixed effects (Column 5). The estimates are stable regardless of the specification, and all
remain statistically significant at 1 percent level. These results indicate that the positive
effects of information disclosure are robust to the inclusion of a battery of controls including
school fixed effects.
14

Table 2: Coefficients on interaction between treatment and after-reform dummies
Dependent var. (1) (2) (3) (4) (5)
Japanese A 1.334*** 1.251*** 1.228*** 1.234*** 1.308***(5.092) (4.790) (4.679) (4.732) (5.660)
Japanese B 1.394*** 1.330*** 1.306*** 1.313*** 1.126***(6.106) (5.719) (5.539) (5.529) (5.052)
Mathematics A 1.167*** 1.114*** 1.095*** 1.133*** 0.776***(5.030) (4.757) (4.751) (4.870) (3.166)
Mathematics B 1.144*** 1.056*** 1.035*** 1.031*** 0.881***(4.938) (4.444) (4.343) (4.354) (3.934)
Year fixed effects No Yes Yes Yes YesStudent environment No No Yes Yes YesSchool environment No No No Yes YesSchool fixed effects No No No No YesObservations 164,920
Notes: Difference-in-differences estimates of β3 (cf. Eq.1). Robust t-statistics in parentheses. Clus-tered standard errors are used to adjust for correlation of error terms within school. *** p < 0.01,** p < 0.05, * p < 0.1.
5.1.2 Robustness checks
Focusing on borders of treated and control cities In the baseline results reported
in Table 2, we categorize all schools in treated cities in the treatment group and all schools
in control cities in the control group. However, comparison of schools located distantly may
suffer from confounding factors correlated to both test scores and municipality’s character-
istics. Thus, a cleaner comparison may be achieved by comparing schools in adjacent school
districts across borders of treated and control cities. As a robustness check, we restrict our
sample to students in schools located in adjacent school districts across borders of treated
and control cities. Column 1 of Table 3 reports the estimates of the effect of information
disclosure using the restricted sample of schools in adjacent school districts. They follow the
specification in Column 5 of Table 2 (i.e., with school fixed effects). Results show that the
benchmark results are robust to using data on students attending schools close to the border.
Interestingly, the coefficients are even larger than those reported in Table 2.
15

Table 3: Robustness checks (based on a model with school fixed effects)
Only borders Control past municipality avg Control past school avg
Japanese A 2.474*** 1.286*** 1.268***(5.036) (4.947) (3.973)
Japanese B 1.390*** 0.860*** 0.988***(3.277) (3.594) (3.608)
Mathematics A 1.452*** 0.542** 0.480(3.116) (2.005) (1.638)
Mathematics B 1.432*** 0.867*** 0.790***(3.573) (3.597) (2.856)
Year fixed effects Yes Yes YesStudent environment Yes Yes YesSchool environment Yes Yes YesSchool fixed effects Yes Yes YesObservations 29,895 142,909 128,159
Notes: Difference-in-differences estimates of β3 (cf. Eq.1). Robust t-statistics in parentheses. Clus-tered standard errors are used to adjust for correlation of error terms within school. *** p < 0.01,** p < 0.05, * p < 0.1.
Controlling for past municipality-level test scores Next, one may think that the
decision of information disclosure by municipality may be correlated with past results of
national assessments in the municipality. For example, the boards of education in munic-
ipalities with relatively low performance in the previous assessments may have a stronger
incentive to improve the results, by disclosing the school-level results and making schools
under their supervision more accountable for their own respective scores. Alternatively, they
may implement other education policies in response to the low performance. To address this
possibility, we estimate the same regression models (cf. Column 5 of Table 2) by additionally
controlling for the average test scores at municipality level in the previous year. Column 2
of Table 3 reports results. Although some of the coefficients are smaller than those reported
in Table 2, all remain positive and statistically significant.
Controlling for past school-level test scores Third, although our data do not have
a panel structure, it is possible to estimate a quasi-value-added model by including school-
level average test scores in the previous year as an additional control. Column 3 of Table
3 reports results. The difference-in-differences estimates are positive and significant except
16
for Mathematics A, suggesting that the benchmark results are still robust to the inclusion
of the average scores at the school level in the previous year for Japanese A and B, and
Mathematics B.
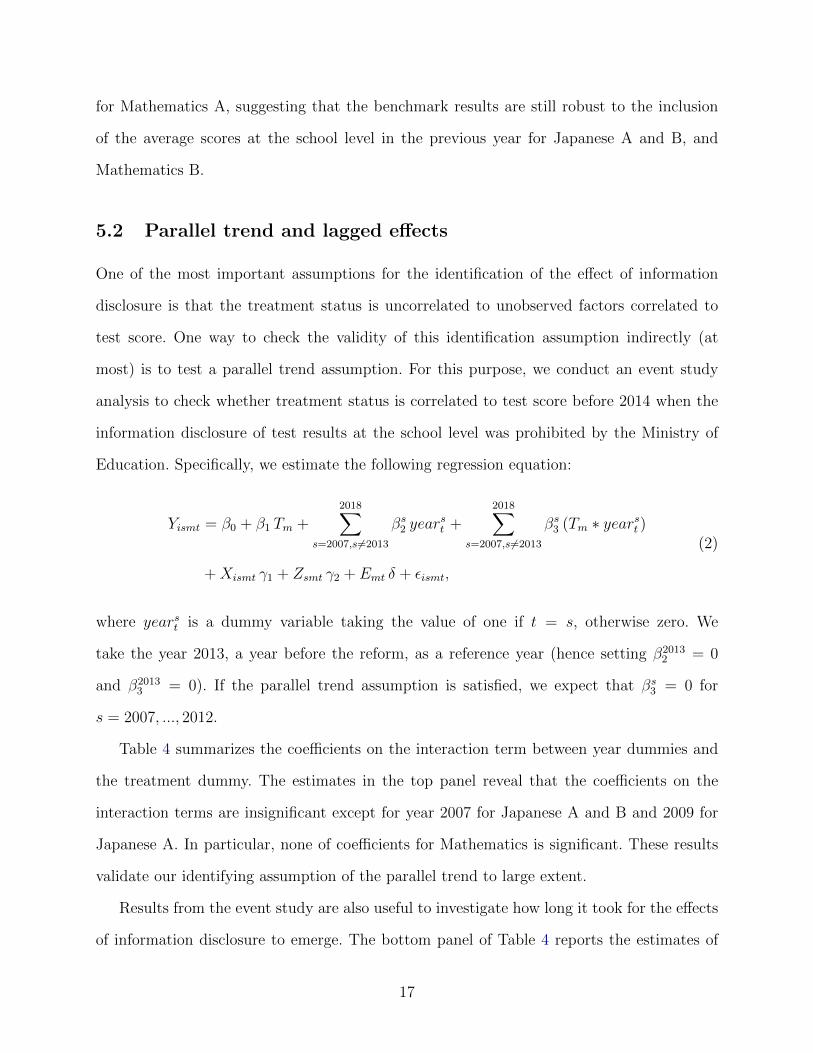
5.2 Parallel trend and lagged effects
One of the most important assumptions for the identification of the effect of information
disclosure is that the treatment status is uncorrelated to unobserved factors correlated to
test score. One way to check the validity of this identification assumption indirectly (at
most) is to test a parallel trend assumption. For this purpose, we conduct an event study
analysis to check whether treatment status is correlated to test score before 2014 when the
information disclosure of test results at the school level was prohibited by the Ministry of
Education. Specifically, we estimate the following regression equation:
Yismt = β0 + β1 Tm +2018∑
s=2007,s 6=2013
βs2 year
st +
2018∑s=2007,s 6=2013
βs3 (Tm ∗ yearst )
+Xismt γ1 + Zsmt γ2 + Emt δ + εismt,
(2)
where yearst is a dummy variable taking the value of one if t = s, otherwise zero. We
take the year 2013, a year before the reform, as a reference year (hence setting β20132 = 0
and β20133 = 0). If the parallel trend assumption is satisfied, we expect that βs
3 = 0 for
s = 2007, ..., 2012.
Table 4 summarizes the coefficients on the interaction term between year dummies and
the treatment dummy. The estimates in the top panel reveal that the coefficients on the
interaction terms are insignificant except for year 2007 for Japanese A and B and 2009 for
Japanese A. In particular, none of coefficients for Mathematics is significant. These results
validate our identifying assumption of the parallel trend to large extent.
Results from the event study are also useful to investigate how long it took for the effects
of information disclosure to emerge. The bottom panel of Table 4 reports the estimates of
17

Table 4: Pre-reform trend and lagged effects (based on a model with school fixed effects)
Japanese A Japanese B Mathematics A Mathematics B
Treat*year dum2007 -0.706* -1.493*** -0.232 -0.176(-1.752) (-3.620) (-0.497) (-0.445)
Treat*year dum2008 -0.537 -0.421 0.277 0.067(-1.359) (-1.192) (0.661) (0.170)
Treat*year dum2009 0.785** 0.141 0.545 0.281(2.093) (0.376) (1.454) (0.734)
Treat*year dum2010 -0.211 -0.315 0.810 0.607(-0.196) (-0.410) (0.951) (0.787)
Treat*year dum2012 0.070 0.409 -0.203 0.768(0.170) (0.795) (-0.372) (1.513)
Treat*year dum2014 1.704*** 1.137*** 0.562 0.986***(5.580) (3.429) (1.478) (3.086)
Treat*year dum2015 1.312*** 1.070*** 0.923** 0.848*(3.309) (2.942) (2.256) (1.905)
Treat*year dum2016 0.997*** 0.290 0.858** 0.715*(2.658) (0.729) (2.054) (1.719)
Treat*year dum2017 1.435*** 1.056** 1.606*** 1.281***(3.037) (2.344) (3.875) (2.858)
Treat*year dum2018 0.610 0.653 1.015** 1.265***(1.422) (1.485) (2.335) (3.255)
Notes: Estimates of βs3 (see Eq.2). Robust t-statistics in parentheses. Clustered standard errors areused to adjust for correlation of error terms within school. *** p < 0.01, ** p < 0.05, * p < 0.1.
the interaction terms for years from 2014 to 2018. Observe that for Japanese A and B,
and Mathematics B, the coefficients on the interaction term between year 2014 and the
treatment dummy are positive and statistically significant. These results suggest that the
effects of information disclosure emerged in a short time period, i.e., only a few months after
the Ministry of Education announced (in November 2013) that the reform on the information
disclosure would be implemented from the national assessments in April 2014 onwards. Also,
as suggested by the fact that the coefficients on the interaction between year 2017 and the
treatment dummy are all positive and significant, the effects of disclosing school-level results
on assessment scores persisted regardless of the subjects and contents.
18

5.3 Inspecting mechanism
5.3.1 School behavior
Acknowledging that the reform increased the average assessment scores in treatment cities
after 2014, how did it change schools’ behavior? To address this question, we investigate
school’s responses to survey questions accompanying national assessments. In particular, the
school questionnaire contains the following question on school accountability to parents and
the public:
To what extent did you explain your school’s results on the national assessments in the
previous year to parents and people in your district?
Further, it contains question on school’s use of national assessments as a diagnostic tool :
To what extent did you use analysis of your school’s performance in the previous year’s
national assessments to improve the teaching quality of your school?
To these questions, schools choose an answer from either 1) very well, 2) reasonably well, or
3) hardly.
Utilizing these questions (and answers), we investigate how the information disclosure of
school-level results affects the above aspects of schools’ behavior. Specifically, we estimate
the following regression model:
Ysmt = β0 + β1 Tm + β2Aftert + β3(Tm ∗ Aftert) +Xismt γ1 + Zsmt γ2
+ Emt δ + εsmt,
(3)
where Ysmt is school’s response to questions on school accountability and the use of national
assessments as a diagnostic tool. Xismt is school average of student environment variables.
Other variables are as defined in the reference analysis above, i.e., Eq.1.
Table 5 presents the estimates of the effect of information disclosure on school account-
ability and school’s use of assessment results as diagnostic tool. The structure of the table
19

Table 5: Reform and school behavior
Dependent var. (1) (2) (3) (4) (5)
Accountability 0.283*** 0.282*** 0.290*** 0.290*** 0.253**(3.432) (3.367) (3.509) (3.486) (2.321)
Diagnostic tool 0.177*** 0.171*** 0.177*** 0.175*** 0.176**(3.146) (3.028) (3.135) (3.093) (2.408)
Year fixed effects No Yes Yes Yes YesStudent environment No No Yes Yes YesSchool environment No No No Yes YesSchool fixed effects No No No No YesObservations 1,546 (1,748) for accountability (diagnostic tool)
Notes: Estimates of β3 (see Eq.3). Robust t-statistics in parentheses. Clustered standard errors areused to adjust for correlation of error terms within school. *** p < 0.01, ** p < 0.05, * p < 0.1.
follows Table 2, where different sets of controls are used. Observe that all the estimates are
positive and statistically significant. This indicates that the public disclosure of school-level
results of national assessments enhanced accountability of schools, and also made schools
use assessment results better to improve their teaching quality. These changes in school be-
haviors can thus be seen as a mechanism through which average assessment scores increased
in treatment cities.
However, one may also conjecture that the relative increase of test scores of students in
schools of treated cities may be driven by the strategic behavior of schools, and thus does
not necessarily reflect an improvement in student performance. One specific concern could
be that schools influence who sits in assessments, since schools in treated cities may have an
incentive to select students who they expect will perform well in assessments and discourage
others from sitting in them. To address this concern, we apply Eq.3 and estimate the effect
of the reform on the school-level take-up rate of assessments, calculated as the share of
students who took assessments to the total number of (6th-grade) students in the school.
Table 6 presents the estimates of the effect, confirming that the reform has an insignificant
effect on the take-up rate of assessments in all the specifications. The indication is thus that
schools did not go too far to make their performance look good.
20

Table 6: Reform and Take-up rate
Dependent var. (1) (2) (3) (4) (5)
Take-up rate 0.001 0.001 0.001 0.001 0.001(0.350) (0.244) (0.233) (0.372) (0.326)
Year fixed effects No Yes Yes Yes YesStudent environment No No Yes Yes YesSchool environment No No No Yes YesSchool fixed effects No No No No YesObservations 1,511
Notes: Estimates of β3 (see Eq.3). Robust t-statistics in parentheses. Clustered standard errors areused to adjust for correlation of error terms within school. *** p < 0.01, ** p < 0.05, * p < 0.1.
5.3.2 Student behavior
Having studied schools’ responses to the reform, we now turn to how students’ behaviors are
affected. To proceed, we investigate students’ responses to various questions which accom-
pany national assessments. While all the three subsequent questions are about Japanese for
illustration, equivalent questions were asked about Mathematics too.
First, we analyze how students may change their approach to assessments, by examining
their responses to the following question:
This year’s Japanese test contained a type of questions which required you to formulate
an answer in writing. To what extent did you attempt to answer them?
To this question, students choose their responses from 1) I attempted to answer all the
questions of this type as fully as possible, 2) I often gave up answering this type of questions
fully, and 3) I did not even begin to answer them. Next, on whether students understand
subjects, we focus on the following question:
Do you understand contents taught in Japanese classes?
Students’ possible answers to this are 1) Yes, 2) Yes, if I have to choose, 3) No, if I have to
choose, 4) No. Further, regarding whether students like subjects, we study responses to the
question:
Do you like studying Japanese?
21

Table 7: Reform and student behaviors (1)
Dependent var. (1) (2) (3) (4) (5)
Attempt Jpn 0.029** 0.031** 0.032** 0.034*** 0.031**(2.161) (2.353) (2.456) (2.599) (2.032)
Attempt Math 0.064*** 0.072*** 0.073*** 0.079*** 0.065**(2.698) (2.928) (3.001) (3.308) (2.419)
Understand Jpn 0.057*** 0.058*** 0.059*** 0.060*** 0.049***(3.289) (3.300) (3.746) (3.728) (2.899)
Understand Math -0.006 -0.005 -0.003 -0.001 0.011(-0.279) (-0.227) (-0.132) (-0.034) (0.460)
Like Jpn 0.099*** 0.098*** 0.100*** 0.101*** 0.082***(3.794) (3.718) (4.029) (4.053) (3.400)
Like Math -0.025 -0.023 -0.019 -0.017 -0.029(-0.959) (-0.894) (-0.774) (-0.669) (-1.137)
Year fixed effects No Yes Yes Yes YesStudent environment No No Yes Yes YesSchool environment No No No Yes YesSchool fixed effects No No No No YesObservations up to 164,912
Notes: Estimates of β3 (see Eq.4). Robust t-statistics in parentheses. Clustered standard errors areused to adjust for correlation of error terms within school. *** p < 0.01, ** p < 0.05, * p < 0.1.
Their possible answers are the same as the ones above.
Similar to the analysis on the reform and test scores (Eq.1), we estimate the following
regression model:
Yismt = β0 + β1 Tm + β2Aftert + β3(Tm ∗ Aftert) +Xismt γ1 + Zsmt γ2
+ Emt δ + εismt,
(4)
where Yismt is student’s response to questions on the approach to tests, understanding sub-
jects, and liking subjects. The remaining variables are defined as in Eq.1. Table 7 summarizes
the effects of the reform on student’s behaviors, i.e., the coefficient on β3 in Eq.4. On the
approach to tests, it is revealed that students attempted harder to answer questions which
required them to elaborate an answer, both in Japanese and Mathematics. On students’
understanding of subjects, students felt that they understood contents taught in Japanese
classes after the reform. Finally, students liked Japanese more after the reform than before.
22

Table 8: Reform and student behavior (2)
Dependent var. (1) (2) (3) (4) (5)
Talk to parents 0.024 0.043** 0.046*** 0.049*** 0.047***(1.377) (2.516) (3.090) (3.237) (2.669)
Year fixed effects No Yes Yes Yes YesStudent environment No No Yes Yes YesSchool environment No No No Yes YesSchool fixed effects No No No No YesObservations 133,406
Notes: Estimates of β3 (see Eq.4). Robust t-statistics in parentheses. Clustered standard errors areused to adjust for correlation of error terms within school. *** p < 0.01, ** p < 0.05, * p < 0.1.
We also consider the possibility that the reform affects student outcomes through parents.
This is possible to the extent that parents are affected by schools which appear to be more
accountable to them. To investigate this potential channel, we look at students’ response to
the question on communicating with parents at home on school matters. In particular, we
use students’ response to the following question:
Do you talk to your parents about what happens in school?
To this question, students’ responses are either 1) Yes, frequently, 2) Yes, rather frequently,
3) Yes, but not frequently, 4) Not at all. Table 8 shows results on the effect of the reform on
this aspect of student’s behavior. In all the specifications except for Column 1 without con-
trols, the effect is positive and statistically significant, indicating that the reform prompted
students to talk to parents about what happens in school more frequently. This result is con-
sistent with the possibility that the effect of the reform on student outcomes is materialized
partly through parents being affected by the reform.
5.4 Are there trade-offs?
The results reported so far indicate that the information disclosure of school-level results
of national assessment has a positive impact in that students’ test scores increase on aver-
age. One may, however, be concerned with possible “side effects” or “unintended effects”,
23

given that the reform induced more focus on schools’ average test scores. In this section, we
investigate two potential side effects, namely on the within-school variations of scores and
non-cognitive skills of students.
5.4.1 Impacts on within-school variations
Whereas the above evidence suggests that the reform increased school average test scores,
what about the within-school variance of scores? This is a reasonable concern, since if schools
have an incentive to improve average test scores, they may put an effort on improving test
results of a certain sub-group of students whose scores are seemingly easier to improve.
If this is the case, the positive effect of the reform may potentially be biased towards the
improvement of highly performing students so that the variance of test outcomes within a
school increases. This would be an adverse effect, since poorly performing students may be
left behind, promoting inequity among students.
To investigate this possibility, we estimate the effect of the reform on the within-school
variance of test scores. Table 9 summarizes results for each subject as well as content. The
estimated model is similar to Eq.3, with school fixed-effects controlled for (as in Column
5 of Table 5). Notice that all the estimates are negative, and statistically significant for
basic contents in particular (i.e., Japanese A and mathematics A). The implication is thus
that it is poorly-performing students’ scores which increase relatively more after the reform.
Overall, these results suggest that disclosing school-level results of national assessments did
not increase the disparity of test results among students within a school; it rather tended to
improve equity by reducing the disparity.17
17We estimate the effects of the reform on test scores using a quantile regression model similar to themodel of Eq.1, and find that the positive effects of the reform are observed strongly for students with lowand medium level of scores.
24

Table 9: Within-school variance by subjects and contents
Subjects Japanese A Japanese B Mathematics A Mathematics B(1) (2) (3) (4)
Treatment*After-reform -0.539*** -0.186 -0.355* -0.172(-3.063) (-1.205) (-1.748) (-1.428)
Year fixed effects Yes Yes Yes YesStudent environment Yes Yes Yes YesSchool environment Yes Yes Yes YesSchool fixed effects Yes Yes Yes YesObservations 2,307
Notes: Estimates of β3 (cf. Eq.3). Robust t-statistics in parentheses. Clustered standard errors areused to adjust for correlation of error terms within school. *** p < 0.01, ** p < 0.05, * p < 0.1.
5.4.2 Impacts on non-cognitive skills
Are there any adverse effects on non-test score outcomes of students induced by the reform?
One may think that schools with excessive focus on subject teaching would sacrifice the
nurture of non-cognitive traits of students on self-confidence and relationship with friends
and society. Here, we investigate how the reform affected (so-called) non-cognitive skills,
outcomes beyond test scores. For example, the aforementioned student questionnaire contains
a question related to students’ self-confidence:
Do you think you have virtues?
Also, it contains various questions on consideration for others, social interest, and friendship:
Do you think that bullying is unacceptable under any circumstances?
Are you interested in what happens in your district and society?
Do you enjoy meeting your friends at school?
Possible responses to these questions are 1) Yes, 2) Yes, if I have to choose, 3) No, if I have
to choose, and 4) No. Using the model of Eq.4, we estimate the effects of the reform on these
measures.
25

Table 10: Reform and student’s non-cognitive skills
Dependent var. (1) (2) (3) (4) (5)
Self confidence 0.032 0.034 0.034 0.034* 0.049**(1.428) (1.479) (1.597) (1.652) (2.145)
No bully 0.001 0.005 0.004 0.006 0.011(0.096) (0.425) (0.449) (0.566) (0.950)
Social interest 0.068*** 0.058*** 0.059*** 0.059*** 0.035*(3.179) (2.893) (3.216) (3.185) (1.847)
Fun friends -0.001 -0.002 -0.003 -0.002 -0.018(-0.114) (-0.132) (-0.253) (-0.188) (-1.520)
Year fixed effects No Yes Yes Yes YesStudent environment No No Yes Yes YesSchool environment No No No Yes YesSchool fixed effects No No No No YesObservations up to 164,845
Notes: Estimates of β3 (see Eq.4). Robust t-statistics in parentheses. Clustered standard errors areused to adjust for correlation of error terms within school. *** p < 0.01, ** p < 0.05, * p < 0.1.
Table 10 summarizes the estimates of the effects of the reform on non-cognitive measures.
Results show that the reform tends to have a positive effect on students’ self-confidence, par-
ticularly when school fixed effects are included (Column 5). Indeed, this may have something
to do with the reform increasing test scores. Although the reform hardly affects the percep-
tion of bullying and the happiness of meeting friends, it is significantly associated with a
larger interest in social issues. Admittedly, these results are hard to interpret. However, what
is important to observe is that there seems to be little indication that the reform had adverse
effects on the measures related to non-cognitive skills of students.
6 Concluding remarks
In this paper, we studied empirically the effects of information disclosure of national assess-
ment results at the school level on various outcomes of students, covering both test scores and
non-cognitive traits. To uncover the potential mechanisms through which the reform affects
students educational outcomes, we also investigated the effects of the reform on schools’ and
students’ behaviors. Results revealed that publishing school-level results of national assess-
26

ments increases test scores on average, regardless of the subjects and contents. This occurs
(at least) partly because schools become more accountable to the public, and utilize diag-
nostic information from assessments better to improve teaching quality. We also found that
students, in turn, attempt to answer assessment questions harder, understand subjects bet-
ter, like subjects more, and communicate more with parents on school matters. There was
little evidence for adverse effects on student outcomes, in that the within-school variance of
test scores tends to fall, and there is no adverse impact on students’ non-cognitive skills.
On balance, therefore, results indicate that publishing school-level results may be a good
design feature of national assessments. Although we do need more empirical evidence from
different institutional/cultural settings to generalize this indication, we hope that we offered
one comprehensive evidence to shed light on the ongoing debate on how national assessments
should be designed.
Acknowledgements
We thank Miguel Urquiola and seminar participants at University of Tokyo for their com-
ments. We also thank Yumiko Mitarai for her assistance in data collection. Any remaining
errors are our own responsibility.
27

References
Ahn, T. and J. Vigdor (2014): “The impact of no child left behind’s accountability
sanctions on school performance: Regression discontinuity evidence from North Carolina,”
NBER Working Paper 20511.
Andrabi, T., J. Das, and A. I. Khwaja (2017): “Report cards: The impact of providing
school and child test scores on educational markets,” American Economic Review, 107,
1535–1563.
Blazar, D. and M. A. Kraft (2017): “Teacher and Teaching Effects on students’ Atti-
tudes and Behaviors,” Educational Evaluation and Policy Analysis, 39, 146–170.
Camargo, B., R. Camelo, S. Firpo, and V. Ponczek (2018): “Information, market
incentives, and student performance: Evidence from a regression discontinuity design in
Brazil,” Journal of Human Resources, 53, 414–444.
Chiang, H. (2009): “How accountability pressure on failing schools affects student achieve-
ment,” Journal of Public Economics, 93, 1045–1057.
Dee, T. S. and B. Jacob (2011): “The impact of No Child Left Behind on Student
Achievement,” Journal of Policy Analysis and Management, 30, 418–446.
Figlio, D. and S. Loeb (2011): “School Accountability,” in Handbook of the Economics of
Education, ed. by E. A. Hanushek, S. Machin, and L. Woessmann, Amsterdam: Elsevier,
vol. 3, 383–421.
Hanushek, E. A. and M. E. Raymond (2005): “Does school accountability lead to
improved student performance?” Journal of policy analysis and management, 24, 297–
327.
28

Hastings, J. S. and J. M. Weinstein (2008): “Information, school choice, and aca-
demic achievement: Evidence from two experiments,” Quarterly Journal of Economics,
123, 1373–1414.
Koning, P. and K. van der Wiel (2012): “School responsiveness to quality rankings:
An empirical analysis of secondary education in the Netherlands,” De Economist, 160,
339–355.
——— (2013): “Ranking the schools: How school-quality information affects school choice
in the Netherlands,” Journal of the European Economic Association, 11, 466–493.
MEXT (2013): “Survey results on how current national assessment results should be han-
dled,” Document distributed in a third meeting of experts on national assessments (21
October 2013, document number 1-2).
Mizala, A. and M. Urquiola (2013): “School markets: The impact of information ap-
proximating schools’ effectiveness,” Journal of Development Economics, 103, 313–335.
OECD (2015): “Education at a Glance 2015: OECD Indicators,” OECD Publishing, Paris,
http://dx.doi.org/10.1787/eag-2015-en.
Rockoff, J. and L. J. Turner (2010): “Short-run impacts of accountability on school
quality,” American Economic Journal: Economic Policy, 2, 119–147.
Rosenkvist, M. A. (2010): “Using student test results for accountability and improvement:
A literature review,” OECD Education Working Papers, No. 54.
Rouse, C. E., J. Hannaway, D. Goldhaber, and F. David (2013): “Feeling the
Florida Heat? How low-performing schools respond to voucher and accountability pres-
sure,” American Economic Journal: Economic Policy, 5, 251–281.
29