Embed Size (px)
Citation preview

Short Course Challenges in Understanding Cloud
and Precipitation Processes and Their Impact on Weather and Climate
Darrel Baumgardner PhD.
Droplet Measurement Technologies [email protected]
February 18-22 3:30-4:30 pm
break 4:45-5:30 pm
Fifth Class

Subharthi ChowdhuriPadma KumariThara Prabhakaran G. Pandithurai Mahen Konwar
Sachin Patade
Savita Morwal J. R. Kulkarni Sudarsan C.G. Deshpande Rohini Bhalwankar Shivsai Dixit
Course Participants
Harikishan Gandham Gayatri Uranka Neelam Malap Mahesh Kumar Sachin Deshpande

References Baumgardner, D., J.L. Brenguier, A. Bucholtz, H. Coe, P. DeMott, T.J. Garrett, J.F. Gayet, M.
Hermann, A. Heymsfield, A. Korolev, M. Krämer, A. Petzold, W. Strapp, P. Pilewskie, J. Taylor, C. Twohy, M. Wendisch, 2011: Airborne Instruments to Measure Atmospheric Aerosol Particles, Clouds and Radiation: A Cook’s Tour of Mature and Emerging Technology, Atmos. Res., doi:10.1016/j.atmosres.2011.06.021.
Baumgardner, D., L. Avallone, A. Bansemer, S. Borrmann, P. Brown, U. Bundke, P.Y. Chuang,
D. Cziczo, P. Field, M. Gallagher, J.-F. Gayet, A. Heymsfield, A. Korolev1, M. Krämer, G. McFarquhar, S. Mertes, O. Möhler, S. Lance, P. Lawson, M. Petters, K. Pratt, G. Roberts, D. Rogers, O. Stetzer, J. Stith, W. Strapp, C. Twohy, M. Wendisch, 2011: In Situ, Airborne Instrumentation: Addressing and Solving Measurement Problems in Ice Clouds, Bull. Amer. Met. Soc., doi: 10.1175/BAMS-D-11-00123.1, 29-34
http://www.uni-leipzig.de/~meteo/en/forschung/airborne_workshop.php Pruppacher, H.R. and J.D. Klett, 1998: Microphysics of Clouds and Precipitation, Springer
Press, 994 pp. Wallace, J.M. and P.V. Hobbs, 2006: “Atmospheric Science: An Introductory Survey”, Second
Edition, Elsevier/Academic Press, Amsterdam, 480 pp.


1. How to know that CDP may suffer from fogging/dirt, how to put correction error induced due to the same ? or say misalignment caused in the optics ?
Comparison with other instruments. No correction possible. Look at DOF reject. 2. Can we calibrate number concentration in a CDP ? No. 3. Basic difference between a CDP and FSSP ? which one is superior ? what one can
do that other can not? CDP is much lighter and smaller and doesn’t have problems with shattering 4. Where exactly should we make measurement of CCN spectra below cloud base ?
What should be the distance from the cloud base ? How to decide ? 100-200 below 5. What is best way to calibrate CDP? Droplet generator or glass beads 6. Is it a good idea to shift the DSD to left (as always a tiny hump is there) and relate
with HWLWC ? Some of our analysis showed that this procedure gave a better fit with HWLWC. Any suggestions ? Underlying point is how to see if the sizing is right?
Not unless you have good justification, e.g. mis-calibration 7. Say when there are many droplets ( with high aerosol number), the artificial spectral
broadening may be seen. How to address this situation ? Is it more pronounced in FSSP ?
What do you mean by artificial broadening?

For LWC we use DMT-LWC. For cheking the performance of the CDP we compare CDP-LWC with DMT-LWC. But many times we observed that DMT-LWC values are -ve or lower than the CDP-LWC even after apllying the base line correction. How to decide LWC measurements obtained from DMT-LWC are acceptable or not? Computation of ALWC requires the cloud base information such as T, P and height. When we profile cloud from cloud top, most of the times the cloud base changes by the time the aircraft reaches the cloud base. In that case the ALWC may not be correct. In such cases how to go about it!

The “Ideal” suite of Instruments
Parameter Instrument Aircraft Data True Airspeed Latitude, Longitude, Altitude Pitch, Roll, Yaw, Heading
ADP-AIMS-20 (DMT)
Air Data Temperature Dew/Frost Point Pressure Winds – U,V, W
ADP-AIMS-20 (DMT)

Temperature, Relative Humidity and Wind Measurements in Clouds

Outline
For Winds, Temperature & Relative Humidity:
• Overview of needs/issues
• Review of existing instrumentation, both operational and “research-quality”
• Detailed measurement requirements

Measurements of Winds
• Needs:
– Measurements of winds on small scales to assess entrainment, vertical velocities; can be critical to supersaturation, particle growth
• Issues:
– Accurate measurements on necessary scales are difficult with existing sensors
– Wetting of sensor ports

Operational Instrumentation for Winds
• Typically a combination of INS/GPS and 5-port pressure measurements

Gust Probes
• Commonly used for flux and turbulence measurements (20 – 100 Hz response)
– Typically 5-hole pressure port system mounted on “sting” ahead of aircraft to avoid flow distortion caused by nose and fuselage

Issues for Wind Measurements
• Are there cloud effects on sensors?
• How well do we actually need to know winds? Are the existing instruments adequate in terms of accuracy and precision?
• New developments?

Cloud Effects on Wind Measurements
These seem to be limited to wetting and/or icing of pitot ports, rendering them ineffective

How well do we need to know winds?
• Focus on vertical winds
– Can be very small (0.01 m/s) in quiescent regions
– Lenschow et al. (1999) argue need to measure to better than 0.03 m/s in most cases to study entrainment
• Most current operational sensors do not achieve this, even under ideal conditions
• Ames MMS has precision; accuracy not clear
• Turbulence/gust probes generally not accurate enough

Wind Measurement Summary
• Current operational wind instrumentation is generally not adequate for measuring vertical velocities accurately. Precision may be sufficient.
• Water-clearing technologies would help in cloud (reverse air-flow)
• Gust probes work well on small scales, but performance degrades with increased air speed

Measurements of Temperature
• Needs: – Accurate measurements for interpretation of
microphysical processes, entrainment – few tenths ºC
• Issues: – Icing/wetting of thermometric sensors causes
underestimates of T
– Radiometric sensors have pathlength problems

Operational Instrumentation for Temperature
Thermometric (immersion) sensors are usually total air temperature probes – need good TAS measurements to obtain ambient air temperature

Research Instrumentation for Temperature
Radiometric sensors use the absorption features of CO2 (e.g. 4.25 µm) to determine air temperature

Issues for Temperature Measurements
• Thermometric sensors are affected by wetting and/or icing
• Radiometric sensors have varying pathlength and may be sensitive to aircraft motions, presence of liquid water in path
• How well do we need to know T? Are current instruments capable of providing this?

Issues for Thermometric Sensors
Affected by wetting and/or icing – Negative biases, typically 1-2 °C, but instances as large as
10 °C seen
– Even de-iced sensors and reverse-flow inlets can accumulate water
– Wetting in Rosemount probes is not necessarily complete, so cannot be easily corrected
Eastin et al. 2002

Issues for Radiometric Sensors
• At 4.25 µm, 90% of signal comes from within 10 m of aircraft; at 15 µm, within 200 m
– Geometry is problematic for looking at fine-scale structure (entrainment) – signal from 20-100 m
• At 15 µm, there is absorption by liquid water
• Data can be difficult to interpret when plane banks because signal can come from surface

Thermometric vs. Radiometric Temperature
Clear Air In-cloud
Lawson & Cooper, 1990
Op
hir
R
ose
mo
un
t
Reference = Reverse Flow

How well do we need to know T?
• For buoyancy and convection studies, ~0.3 K or better
• For microphysical studies, about 0.5 K
Wang & Sassen, 2002
ΔT =1 K
2-7%
1-4%
1-3%

Temperature Measurement Summary
• Operational temperature measurements are accurate enough for most needs
• All immersion sensors are problematic in cloud – wetting of sensors causes errors in T of ~ 1 °C. There is no resolution to this problem.
• Radiometric sensors better, but have pathlength issues that affect small-scale measurements
• Research-quality temperature measurements are adequately calibrated for most needs

Measurements of Relative Humidity
• Needs:
– Accurate measurements of RH (or Td or H2Ov) to understand extent of saturation
• Issues:
– Td measurements can be skewed by wetting of sensors
– Direct measurements of H2Ov can be altered by evaporation of cloud particles within instrument
– Calculations of RH affected by errors in T/Td/H2Ov
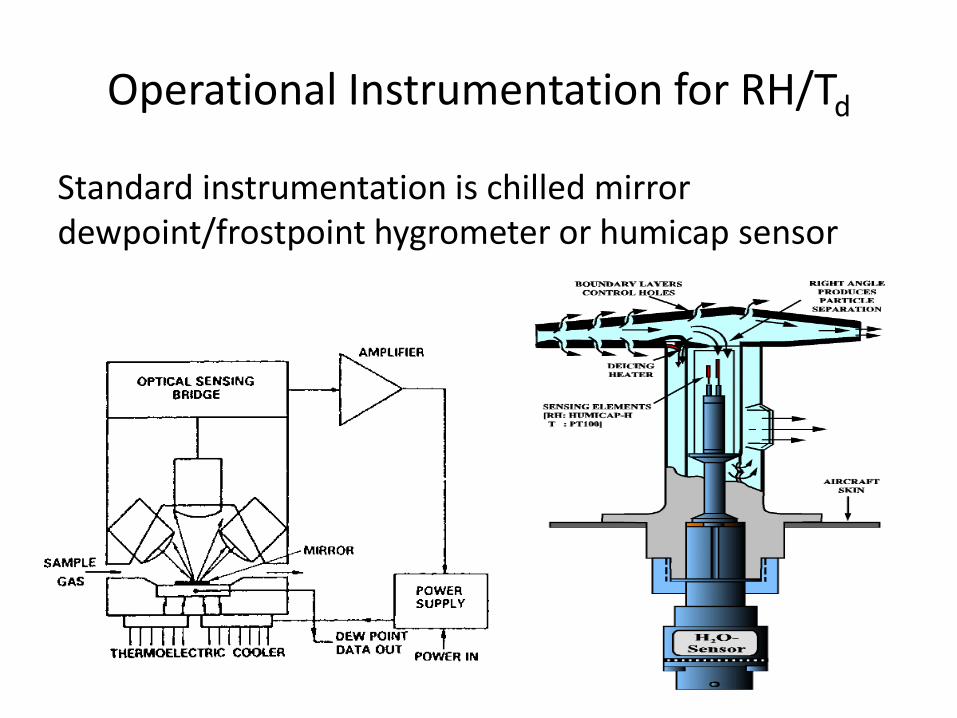
Operational Instrumentation for RH/Td
Standard instrumentation is chilled mirror dewpoint/frostpoint hygrometer or humicap sensor

Research Instrumentation for RH/Td
Technique Examples Accuracy Response Time
Lyman-alpha photofragment
Harvard WV, FISH, FLASH
6-10% 1 sec
Chilled mirror NOAA CFH 0.5 K (Td/f) [5%]
Varies with water
Tunable diode laser spectroscopy
JLH, DLH, OJSTER 5 % 0.1 - 1 sec
JLH on DC-8 CFH
Lyman-α
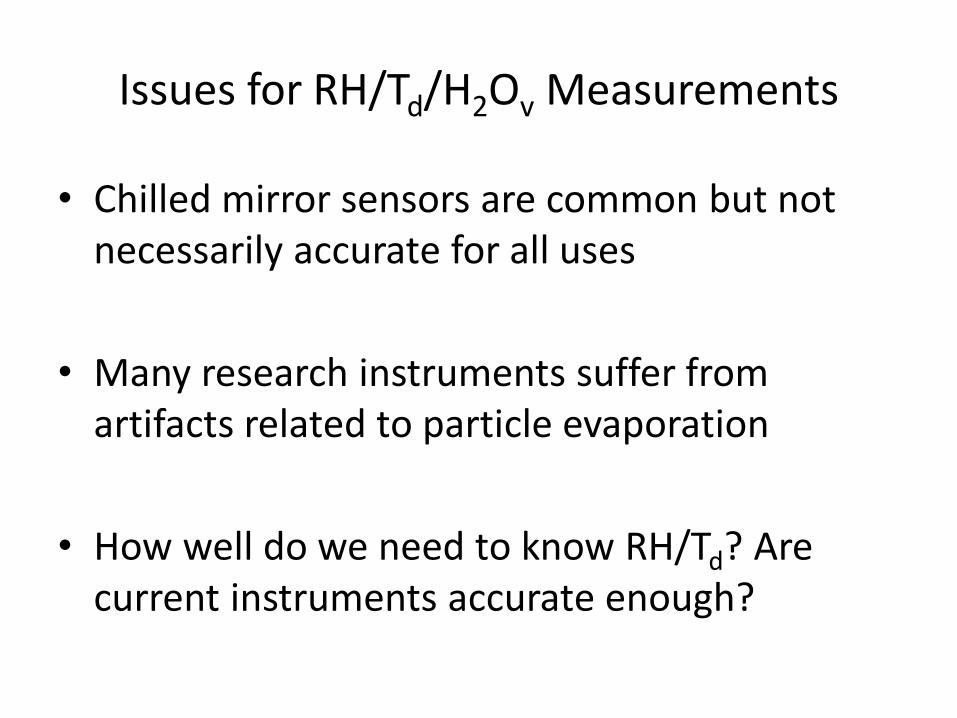
Issues for RH/Td/H2Ov Measurements
• Chilled mirror sensors are common but not necessarily accurate for all uses
• Many research instruments suffer from artifacts related to particle evaporation
• How well do we need to know RH/Td? Are current instruments accurate enough?

Issues with Chilled Mirror Sensors
• Errors of 1-2 °C above saturation in wet environments
– Inlets that inertially separate particles from gas help, but do not completely eliminate problem
• Ambiguity of water phase (frost/liquid) at temperatures between 0 and -30 °C
• Slow response time at low Td/f

Issues with Research Hygrometers
Many water vapor instruments have internal sampling, making them susceptible to errors from evaporation of ingested particles
Example: Harvard water vapor (HWV) • Subisokinetic flow (150 – 200 m/s decelerated to ~ 80 m/s) leads to heating of air by at least 10 °C

Measuring Water Accurately
Blind intercomparison held at AIDA chamber, Karlsruhe Core instruments were full participants Referenced to AIDA TDL Differences among instruments for WV > 10 ppm are ± 5-10%

Conversion of Td/f to RH
Formulations for vapor pressure over liquid water
Formulations for vapor pressure over ice
Figures from H. Voemel

RH/Td Measurement Summary
• Uncertainties in direct measurements of Td result from wetting of sensor and phase ambiguities at critical temperatures
• H2Ov measurements have reasonable level of accuracy for determining RH at higher Td/[H2O], but are not adequate at low T and low H2O
• Algorithms for conversion of Td to RH contribute some error, but less than that of measurements

Ice Nuclei Measurements

• Polarization-change discrimination of particle phase • Particle residence time in chamber of 10 -12 seconds • Parallel-plate chamber geometry • Self-contained compact refrigeration system: - Cold plate temperature to -70° C - Warm plate temperature to -40° C • Full computer control of all systems; automated operation for unattended measurements • Self-contained in a single rack, 59 cm wide x 73 cm deep x 167 cm high

• Subsystems
IN Chamber
Warm & Cold Refrigeration Assembly
Power Supply Filter Assembly
Flow Acquisition Box
Control Box
Detector & Optics

Idealized SPIN chamber schematic
Walls held at different temperatures (below freezing) When coated with ice this leads to gradients in temperature and vapor pressure between the walls Exponential relationship between temperature and saturation vapor pressure leads to super-saturated region with respect to ice and water (depending on wall temperatures) Pass particles through this region to see if they form ice crystals and count the ice crystals to determine ice nuclei concentration

Detector Assembly

Optics Assembly

Single Particle Imaging

Cloud Imaging Probe with Grayscale (CIP-GS)

Cloud Imaging Probe with Grayscale (CIP-GS)

Counterflow Virtual Impactor

Counterflow Virtual Impactor (CVI)
• Inertially impacts droplets into warm, dry, filtered air or N2
• Rejects gases, aerosol particles and hydrometeors smaller than approximately 5-6 μm with a counterflow airstream
• Residual particles are passed to downstream instruments
• Concentration enhancements of 30-50
SP2 AMS ATOFMS

3 μm water droplet
25 μm Xtal formed on IN

Counterflow Deflects droplet
Xtal inertia overcomes counterflow

Counterflow Deflects droplet
Heated, dry counterflow evaporates Xtal

Counterflow Deflects droplet
Leaving only the crystal residual

Q1:Can we do all nucleation modes in SPIN No, just homogeneous freezing and deposition nucleation Q2: How we can control the SS with respect to ice in SPIN Temperature difference across the plates Q3: How do the amount of SS needed for ice nucletion vary with aerosol diameter Similar to water but more complicated by shape Q4: Best possible way to profile a convective cloud ? 90-270, ascending with cloud to look at droplet activation/growth 90-270 descending to look at precipitation development Q5: AIMMS accuracy of vertical velocity ? and calibration ? See mfg specs but don’t know if these are validated Q6: Gust probe: is it the typical one used in any aircraft ? Is it also used for research applications ? Gust probe is only research Q7: can CVI inlet be used in ground measurements of cloud ? such as over a high ALtitude Lab ? Yes

Calibration and Data Analysis

Processing Hot-Wire LWC Data
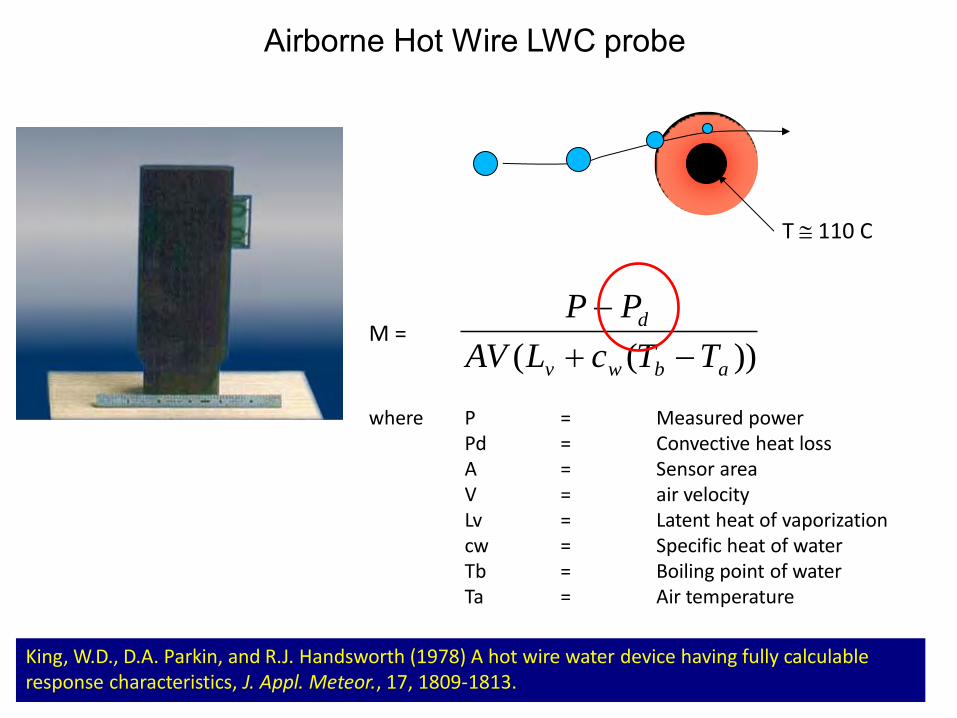
Airborne Hot Wire LWC probe
King, W.D., D.A. Parkin, and R.J. Handsworth (1978) A hot wire water device having fully calculable response characteristics, J. Appl. Meteor., 17, 1809-1813.
M = where P = Measured power Pd = Convective heat loss A = Sensor area V = air velocity Lv = Latent heat of vaporization cw = Specific heat of water Tb = Boiling point of water Ta = Air temperature
))(( abwv
d
TTcLAV
PP
T 110 C

The convective heat loss term has been empirically derived (Zukauskas and Ziugzda, 1985) and is related to the Reynolds number and Prandtl number by
Pd = A0πk(Ts - Ta)RexPry
K =Thermal conductivity = F(Twire), Twire = Wire Temperature Re = Reynolds number ~ F(Twire) Pr = Prandtl Number ~ F(Twire)
Sensitivity to hotwire temperature. Hotwire temperature must be determined empirically. M ~ P-PD In clear air, M = 0 when PD calculated correctly In clear air, M < 0 when PD too high (Twire too hot) In clear air, M > 0 when PD too low (Twire too cold)

Too Hot
OK Hotwire uncertainty ± 0.05

Too Hot
OK

CDP Calibration And Data Analysis

Finding the Optimum Scattering Angles
Outer Collection Angle
Inner Collection Angle
Nominal 4o – 12o

Step 1: Measure with as many sizes of glass beads as possible

Step 2: Run Mie calculations over range of collection angles until theoretical values match calibration beads.

The wrong choice of collection angles makes a very big difference. Each CDP can be slightly different because of the optical and mechanical tolerances
3 μm

Step 3: Use the optimized scattering angles to calculated the scattering cross sections for water, fit a smooth curve to these values and select the A/D thresholds for each size bin.

Problem: The Size Histograms Have Odd Bumps Solution: Adjust width of channels for more reasonable shape. Very small adjustments make very large differences. Justification: Measurement uncertainty of ±15%
Old New0.12 0.120.14 0.140.16 0.160.18 0.180.2 0.1950.22 0.220.24 0.240.26 0.260.28 0.280.3 0.30.35 0.350.4 0.40.45 0.450.5 0.50.55 0.550.6 0.6
ΔD=0.02ΔD=0.02
ΔD=0.015ΔD=0.025

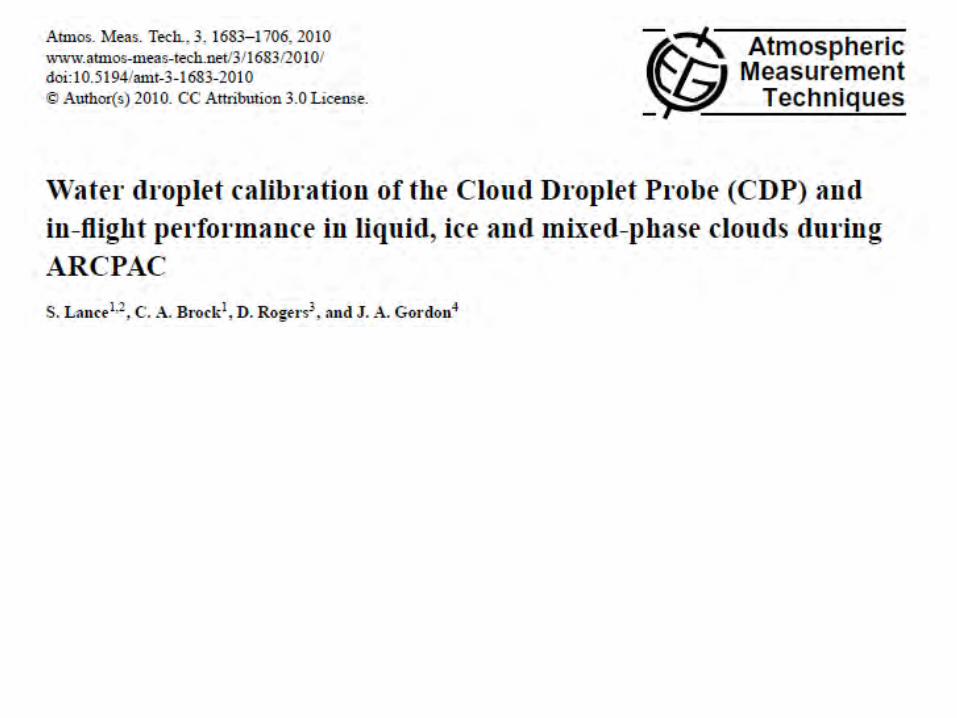
Water Droplet Calibration and In-Flight Performance of the DMT
Cloud Droplet Probe (CDP)
Sara Lance, Charles Brock -- NOAA
Joshua Gordon -- NIST
Dave Rogers -- NCAR

Generating Standardized Water Droplets for Calibration
40 um drops
Commercial Piezo-Electric device - Produces a jet of single drops - Reproducible Size AND Concentration

Evaporation Flow Tube
Control of droplet size by varying residence time

Evaporation Flow Tube
Control of droplet size by varying residence time
Dt ~ 2 second

Droplets in the sample volume of the
CDP
Droplet generator device

Gives the “True” drop size

Independent Verification of Drop Sizing (within the CDP sample volume)
dglare

CDP Sizing Results: Calibration with Water Droplets


CDP Sample Area Results: Calibration with Water Droplets
Calibrated Sample Area agrees well with the instrument specs
(0.3 mm2)

Calibration of the “Extended Sample Area” with Water Droplets
Qualified sample area
Extended sample area

Summary
• CDP sizing is correct to within 10%
• CDP sample area is correct to within 10%

CAS
CDP CIP* CIP CDP*
* = Modified

laser
beamdump
Qualifier
Sizer
open path length
sample area
CDP2 “Standard”
laser
beamdump
Qualifier
Sizer
open path length
sample area
CDP1 “Modified” (pinhole) X X

Extended sample area after installing
800 um pinhole on sizer
Qualified sample area
Modified CDP
Laboratory Calibration of the CDP Extended Sample Area
Standard CDP
Qualified sample area
Extended sample area
modified to reduce “coincidence errors”, which occur when multiple droplets pass through the sensitive region of the laser beam at the same time

Verifying Improved CDP Performance In-Flight
Modifications Reduce Undercounting Error e.g., for actual droplet concentrations of 800 cm-3 : Modified CDP measures ~600 cm-3
(25% undercounting) Standard CDP measures ~400 cm-3 (50% undercounting)

Verifying Improved CDP Performance In-Flight
Modifications Reduce Oversizing Error Droplet diameter is up to 30% larger for the Standard CDP (compared to the Modified CDP) Expect a linear relationship to concentration if modified CDP were perfect (i.e. no oversizing).

CDP/Hotwire Intercomparison
Summary of modified CDP performance : Reduced under-counting Reduced over-sizing Reduced over-estimate of LWC

Multimodal Size Distributions in Fog: Cloud Microphysics or Measurement Artifact?
Darrel Baumgardner
Central de Ciencias de la Atmosfera Universidad Nacional Autonoma de Mexico, Mexico City
Gregory L Kok
Droplet Measurement Technologies, Boulder, Colorado
Chen Ping
Handix Corporation, Boulder, Colorado
5th International Conference on Fog, Fog Collection and Dew 25 – 30 July 2010, Münster, Germany

Is this structure in the size distribution real?

Can the non-monotonic relationship between light scattering and size lead to artificial structure in the spectrum?

Actual 2 3 4 5 6 7 8 9 10 11 12 13 Measured 0-2 4-6 2-4 4-6 4-6 4-6 6-8 4-6 10-12 8-10 10-12 10-12
Non-monotonic relationship between scattering and size leads to under and over-sizing

Non-monotonic relationship between scattering and size leads measured distribution with different structure than ambient
10
8
6
4
2
0
Con
cent
ratio
n dN
/dD
p (c
m-3
m
-1)
454035302520151050
Diameter (m)
Simulated Measurement Simulated Ambient PSD

Ki(rj) = Fraction of particles of size, j, that are sized in channel I
N(rj) = Actual ambient concentration of particles of size j
yi = Concentration of particles with size I
m = Number of measured channels
n = Number of size categories in ambient size distributions

This is an example of measurements from an FM-100 with 20 channels.
6
5
4
3
2
1
0
Con
cent
ratio
n dN
/dD
p (c
m-3
m
-1)
2520151050
Diameter (m)

This is an example the estimated ambient distribution derived from the measurements.

Summary • Evaluation of the optical system of the FM-100 shows that the
theoretical response is a non-monotonic relationship between droplet diameter and scattered light.
• Simulations show that the FM-100 will distort the ambient size distribution as a result of this non-monotonic relationship.
• An inversion algorithm was demonstrated by which estimates of the ambient droplet population can be derived from the measured size distributions.
• In some cases the derived ambient distributions may contain structure that is hidden as a result of the FM-100 optical response.

Processing CIP Data Image Analysis

How do you define particle diameter?

In Ice Clouds the Shape of the Size Distribution Depends on the Definition of “Diameter”

True Airspeed Clock Errors

T7 T5T4 T3 T2T1 T0
T7 T5T4 T3 T2T1 T0
T7 T5T4 T3 T2T1 T0

Φ
X
Y
VH = (Airspeed Clock) (W/L) VT = Y*VH/W
W
L
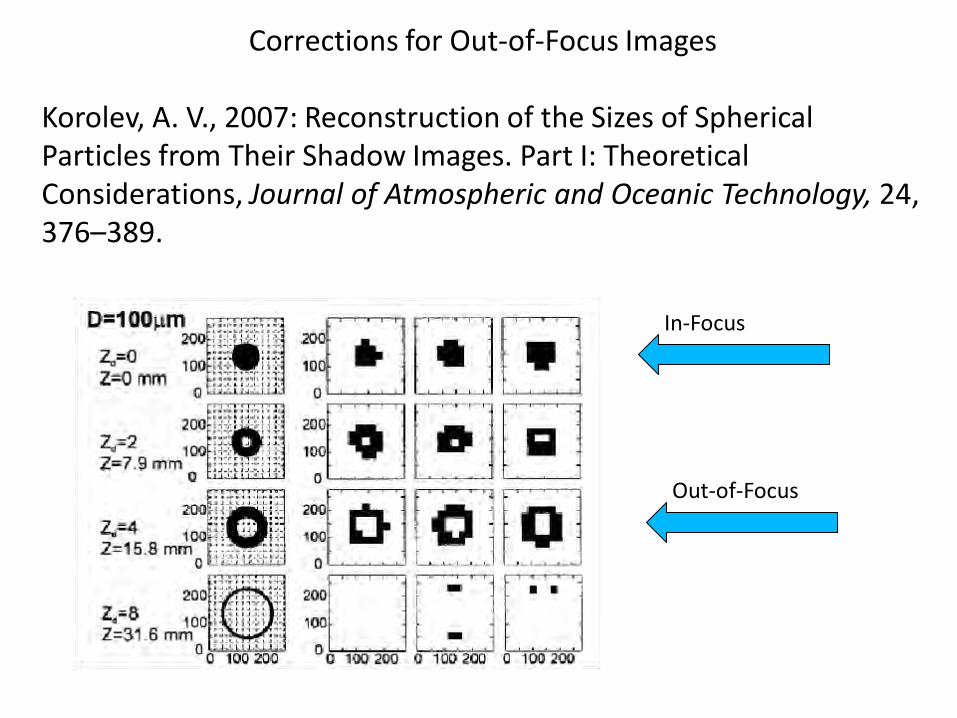
Corrections for Out-of-Focus Images
Korolev, A. V., 2007: Reconstruction of the Sizes of Spherical Particles from Their Shadow Images. Part I: Theoretical Considerations, Journal of Atmospheric and Oceanic Technology, 24, 376–389.
In-Focus
Out-of-Focus
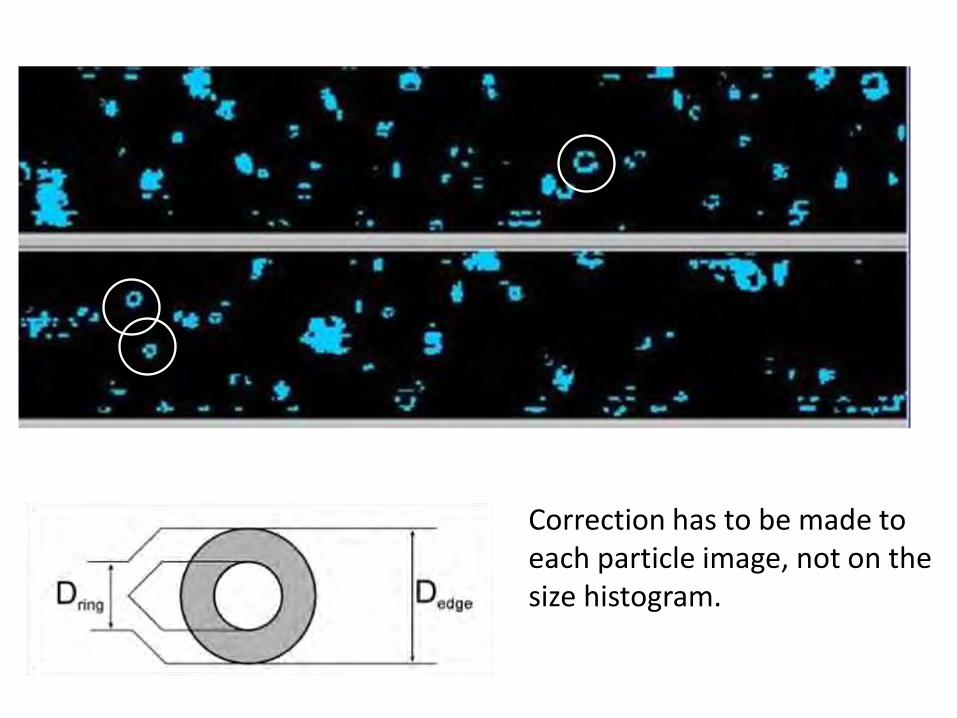
Correction has to be made to each particle image, not on the size histogram.

The effect of ice shattering on microphysical measurements
Sample volume

Imagery of shattered ice particles registered by OAP-2DP at 200m pixel resolution (highlighted in blue)
6.4mm

Concept of the probe arm redesign to mitigate shattering
Original design
Modification US Patent Application No. 12/415,314 Canadian Patent Application No. 2660753
Deflect shattered fragments away from the sample volume

Standard CIP arms Modified CIP arms

High Probability of Shattered Particle. Use interarrival times to filter (at your own risk!)
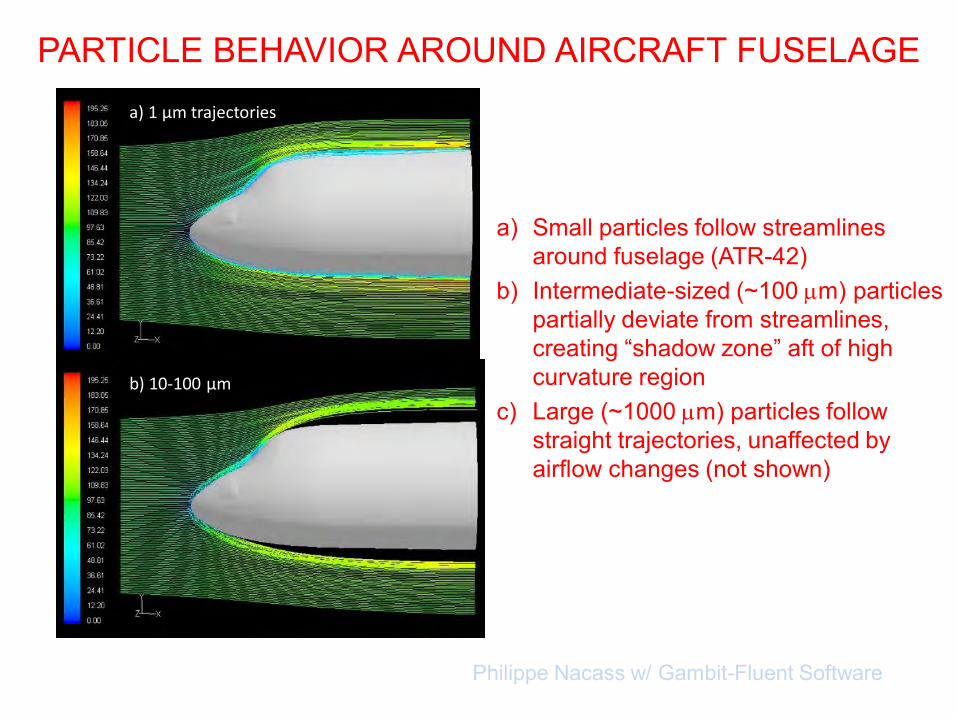
a) Small particles follow streamlines around fuselage (ATR-42)
b) Intermediate-sized (~100 m) particles partially deviate from streamlines, creating “shadow zone” aft of high curvature region
c) Large (~1000 m) particles follow straight trajectories, unaffected by airflow changes (not shown)
PARTICLE BEHAVIOR AROUND AIRCRAFT FUSELAGE
Philippe Nacass w/ Gambit-Fluent Software
a) 1 µm trajectories
b) 10-100 µm

Region of Enhancement
Shadow Zone

Flow distortion leads to size dependent biases in concentration

Thank you for your attention and interest.
I wish you successful measurements in clouds!