Embed Size (px)
Citation preview

Printed on 30% recycled paper.
COWL IT Z COUNT Y Grant No. G1200052
SHORELINE ANALYSIS REPORT
Shorelines in Cowlitz County and the Cities of Castle Rock, Kalama, Kelso, and Woodland
Prepared for:
Cowlitz County SMP Partnership
274th Avenue North
Kelso, WA 98626
Prepared by:
May 2014
This report was funded in part
through a grant from the
Washington Department of Ecology.

Cite this document as:
The Watershed Company and Parametrix. May 2014. Shoreline Analysis Report for
Shorelines in Cowlitz County and the Cities of Castle Rock, Kalama, Kelso, and
Woodland. Prepared for the Cowlitz-Shoreline Partnership, Kelso, WA.

i
TABLE OF CONTENTS
Page # 1 Introduction ................................................................................ 1
1.1 Background and Purpose .................................................................. 1
1.2 Shoreline Jurisdiction ........................................................................ 2
1.3 Study Area ........................................................................................... 4
1.3.1 Cowlitz County ................................................................................................. 4 1.3.2 City of Castle Rock .......................................................................................... 4 1.3.3 City of Kalama .................................................................................................. 5 1.3.4 City of Kelso ..................................................................................................... 5 1.3.5 City of Woodland ............................................................................................. 5
2 Summary of Current Regulatory Framework ........................... 5
2.1 Shoreline Management Act ................................................................ 5
2.2 Cowlitz County .................................................................................... 6
2.3 City of Castle Rock ............................................................................. 7
2.4 City of Kalama ..................................................................................... 8
2.5 City of Kelso ........................................................................................ 9
2.6 City of Woodland ................................................................................ 9
2.7 State Agencies and Regulations ....................................................... 9
2.8 Federal Regulations.......................................................................... 11
2.9 PacifiCorp Shoreline Management Plan ......................................... 13
3 Inventory and Analysis Methods ............................................ 15
3.1 Inventory Sources............................................................................. 15
3.2 Assessment Units ............................................................................. 24
3.3 Ecological Characterization ............................................................. 24
3.3.1 Data Sources, Assumptions, and Data Gaps ............................................. 24
Impervious Surfaces ....................................................................................... 25 Vegetation ...................................................................................................... 25 Frequently Flooded Areas .............................................................................. 26 Channel Migration Zone ................................................................................. 26 Wetlands ........................................................................................................ 27 Soils ................................................................................................................ 27 Geologically Hazardous Areas ....................................................................... 28 Fish and Wildlife Habitat Conservation Areas ................................................ 28 Shoreline Modifications .................................................................................. 28

ii
Water Quality .................................................................................................. 29 Aquifer Recharge Areas ................................................................................. 30
3.3.2 Functional Evaluation Approach, Rationale and Limitations ................... 30
Reach Delineation .......................................................................................... 30 Functions and Impairments ............................................................................ 33 Limitations ...................................................................................................... 42
3.3.3 Restoration Opportunities ............................................................................ 43
3.4 Land Use Characterization ............................................................... 43
3.4.1 Data Sources, Assumptions, and Data Gaps ............................................. 45
Current Land Use ........................................................................................... 45 Zoning............................................................................................................. 46 Comprehensive Plan ...................................................................................... 48 Existing and Potential Shoreline Public Access ............................................. 49 Water-oriented Uses ...................................................................................... 49 Historical or Archaeological Sites ................................................................... 51
3.4.2 Analysis of Future Land Use ........................................................................ 51
Comparative Analysis of Current Land Use ................................................... 51
4 Summary of County Ecosystem Conditions ......................... 54
4.1 Climate ............................................................................................... 54
4.2 Geography, Topography, Geology, and Drainage Patterns .......... 55
4.2.1 Columbia River .............................................................................................. 55 4.2.2 Lewis River ..................................................................................................... 56 4.2.3 Kalama River .................................................................................................. 57 4.2.4 Cowlitz Watershed ......................................................................................... 58 4.2.5 Mill, Abernathy, Germany Creeks ................................................................ 60 4.2.6 South Fork Chehalis River ............................................................................ 60
4.3 Ecosystem Context........................................................................... 60
4.3.1 Columbia River .............................................................................................. 64 4.3.2 Lewis River ..................................................................................................... 65 4.3.3 Kalama River .................................................................................................. 66 4.3.4 Cowlitz River .................................................................................................. 66 4.3.5 Mill, Abernathy, Germany Creeks ................................................................ 67 4.3.6 South Fork Chehalis River ............................................................................ 68
4.4 Major Land Use Changes and Current Shoreline Condition ........ 68

iii
4.4.1 Columbia River .............................................................................................. 68 4.4.2 Lewis River ..................................................................................................... 69 4.4.3 Kalama River .................................................................................................. 70 4.4.4 Cowlitz Watershed ......................................................................................... 71 4.4.5 Mill, Abernathy, Germany Creeks ................................................................ 73 4.4.6 South Fork Chehalis River ............................................................................ 73
5 Inventory and Analysis of Conditions .................................... 73
5.1 General Inventory and Analysis of Conditions .............................. 84
5.1.1 Utilities ............................................................................................................ 84 5.1.2 Public Access – Existing and Potential ...................................................... 84 5.1.3 Historic and Archeological Resources ....................................................... 85 5.1.4 Levees ............................................................................................................. 86 5.1.5 Potential Use Conflicts ................................................................................. 88
5.2 Columbia River Assessment Unit ................................................... 88
5.2.1 Ecological Characterization ......................................................................... 89
Critical Areas .................................................................................................. 89 Reach Scale Functions .................................................................................. 90 Restoration Opportunities............................................................................... 92
5.2.2 Land Use Characterization ........................................................................... 94
Current Land Use ........................................................................................... 94 Water-oriented Uses ...................................................................................... 95 Transportation and Utilities............................................................................. 97 Existing and Potential Shoreline Public Access ............................................. 97 Future Land Use ............................................................................................. 99
5.3 Lewis River Assessment Unit ........................................................ 102
5.3.1 Ecological Characterization ....................................................................... 102
Critical Areas ................................................................................................ 102 Reach Scale Functions ................................................................................ 103 Restoration Opportunities............................................................................. 105
5.3.2 Land Use Characterization ......................................................................... 106
Current Land Use ......................................................................................... 106 Water-oriented Uses .................................................................................... 107 Transportation and Utilities........................................................................... 108 Existing and Potential Public Access ........................................................... 109 Future Land Use ........................................................................................... 111

iv
5.4 Kalama River Assessment Unit ..................................................... 113
5.4.1 Ecological Characterization ....................................................................... 114
Critical Areas ................................................................................................ 114 Reach Scale Functions ................................................................................ 115 Restoration Opportunities............................................................................. 117
5.4.2 Land Use Characterization ......................................................................... 118
Current Land Use ......................................................................................... 118 Water-oriented Uses .................................................................................... 119 Transportation and Utilities........................................................................... 119 Existing and Potential Shoreline Public Access ........................................... 120 Future Land Use ........................................................................................... 121
5.5 Cowlitz River Assessment Unit ..................................................... 123
5.5.1 Ecological Characterization ....................................................................... 123
Critical Areas ................................................................................................ 123 Reach Scale Functions ................................................................................ 123 Restoration Opportunities............................................................................. 128
5.5.2 Land Use Characterization ......................................................................... 133
Current Land Use ......................................................................................... 133 Water-oriented Uses .................................................................................... 133 Transportation and Utilities........................................................................... 134 Existing and Potential Shoreline Public Access ........................................... 134 Future Land Use ........................................................................................... 137
5.6 Mill, Abernathy, Germany Creek Assessment Unit ..................... 139
5.6.1 Ecological Characterization ....................................................................... 140
Critical Areas ................................................................................................ 140 Reach Scale Functions ................................................................................ 141 Restoration Opportunities............................................................................. 142
5.6.2 Land Use Characterization ......................................................................... 143
Current Land Use ......................................................................................... 143 Water-oriented Uses .................................................................................... 144 Transportation and Utilities........................................................................... 144 Existing and Potential Shoreline Public Access ........................................... 145 Future Land Use ........................................................................................... 145
5.7 South Fork Chehalis River ............................................................. 147

v
5.7.1 Ecological Characterization ....................................................................... 148
Critical Areas ................................................................................................ 148 Reach Scale Functions ................................................................................ 148 Restoration Opportunities............................................................................. 148
5.7.2 Land Use Characterization ......................................................................... 149
Current Land Use ......................................................................................... 149 Water-oriented Uses .................................................................................... 150 Transportation and Utilities........................................................................... 150 Existing and Potential Shoreline Public Access ........................................... 150 Future Land Use ........................................................................................... 150
5.8 City of Castle Rock and UGA ......................................................... 150
5.8.1 Ecological Characterization ....................................................................... 152
Critical Areas ................................................................................................ 152 Reach Scale Functions ................................................................................ 152 Restoration Opportunities............................................................................. 155
5.8.2 Land Use Characterization ......................................................................... 155
Future Land Use (Assessment Unit Analysis) .............................................. 155 Potential Use Conflicts ................................................................................. 155 Transportation and Utilities........................................................................... 156 Existing and Potential Public Access ........................................................... 156 Reach Scale Analysis of Current Land Use, Water-dependent and Water–related uses, and Future Land Use .............................................................. 157
5.9 City of Kalama ................................................................................. 163
5.9.1 Ecological Characterization ....................................................................... 166
Critical Areas ................................................................................................ 166 Reach Scale Functions ................................................................................ 166 Restoration Opportunities............................................................................. 169
5.9.2 Land Use Characterization ......................................................................... 169
Future Land Use (Assessment Unit Analysis) .............................................. 169 Potential Use Conflicts ................................................................................. 170 Transportation and Utilities........................................................................... 170 Existing and Potential Public Access ........................................................... 170 Reach Scale Analysis of Current Land Use, Water-dependent and Water–related uses, and Future Land Use .............................................................. 171
5.10 City of Kelso .................................................................................... 177

vi
5.10.1 Ecological Characterization ....................................................................... 180
Critical Areas ................................................................................................ 180 Reach Scale Functions ................................................................................ 180 Restoration Opportunities............................................................................. 184
5.10.2 Land Use Characterization ......................................................................... 184
Future Land Use (Assessment Unit Analysis) .............................................. 184 Potential Use Conflicts ................................................................................. 185 Transportation and Utilities........................................................................... 185 Existing and Potential Public Access ........................................................... 185 Reach Scale Analysis of Current Land Use, Water-dependent and Water–related uses, and Future Land Use .............................................................. 186
5.11 City of Woodland and UGA ............................................................ 198
5.11.1 Ecological Characterization ....................................................................... 200
Critical Areas ................................................................................................ 200 Reach Scale Functions ................................................................................ 200 Restoration Opportunities............................................................................. 203
5.11.2 Land Use Characterization ......................................................................... 203
Future Land Use (Assessment Unit Analysis) .............................................. 203 Potential Use Conflicts ................................................................................. 205 Transportation and Utilities........................................................................... 205 Existing and Potential Public Access ........................................................... 205 Reach Scale Analysis of Current Land Use, Water-dependent and Water–related uses, and Future Land Use .............................................................. 206
5.12 Restoration Opportunities Applicable to All Assessment Units 212
6 Shoreline Management Options and Recommendations ... 214
6.1 Environment Designations ............................................................ 214
6.1.1 Background .................................................................................................. 214 6.1.2 Methodology ................................................................................................ 222 6.1.3 Recommendations ...................................................................................... 223
6.2 General Policies and Regulations ................................................. 224
6.2.1 Archaeological and Historic Resources ................................................... 224 6.2.2 Critical Areas ................................................................................................ 224
Options for designation, rating and classification of critical areas. .............. 224

vii
6.2.3 Buffer Options .............................................................................................. 227
Wetland Regulations .................................................................................... 228 Riparian Buffers ........................................................................................... 231
6.2.4 Flood Hazard Reduction ............................................................................. 236 6.2.5 Public Access .............................................................................................. 236 6.2.6 Shoreline Vegetation Conservation ........................................................... 237
Water Quality, Stormwater, and Nonpoint Pollution ..................................... 237
6.3 Shoreline Modification Provisions ................................................ 237
6.3.1 Shoreline Stabilization ................................................................................ 237 6.3.2 Piers and Docks ........................................................................................... 238 6.3.3 Fill .................................................................................................................. 239 6.3.4 Breakwaters, Jetties, Groins and Weirs .................................................... 239 6.3.5 Dredging and Dredge Material Disposal ................................................... 239 6.3.6 Shoreline Habitat and Natural Systems Enhancement Projects ............ 239
6.4 Shoreline Uses ................................................................................ 240
6.4.1 Agriculture .................................................................................................... 240 6.4.2 Aquaculture .................................................................................................. 240 6.4.3 Boating Facilities ......................................................................................... 240 6.4.4 Commercial Development .......................................................................... 240 6.4.5 Forest Practices ........................................................................................... 241 6.4.6 Industry ......................................................................................................... 241 6.4.7 In-stream Structural Uses ........................................................................... 241 6.4.8 Mining ........................................................................................................... 242 6.4.9 Recreational Development ......................................................................... 242 6.4.10 Residential Development ............................................................................ 242 6.4.11 Transportation and Parking ........................................................................ 243 6.4.12 Utilities .......................................................................................................... 243
6.5 Restoration Plan ............................................................................. 243
7 References .............................................................................. 244
8 List of Acronyms and Abbreviations .................................... 250
APPENDIX A Cowlitz County Assessment of Shoreline Jurisdiction
APPENDIX B Shoreline Inventory Map Folio – County
APPENDIX C Shoreline Inventory Map Folio – Cities
APPENDIX D Cowlitz County Comprehensive Plan Map

viii
APPENDIX E Cowlitz County Zoning Maps
APPENDIX F Functional Analysis Scoring Results by Reach
APPENDIX G Demand for Water-oriented Uses
APPENDIX H Longbell Log Pond Determination Letter
APPENDIX I City of Castle Rock Supplemental Inventory

ix
LIST OF FIGURES
Page #
Figure 3-1. Example of reach break scenario where no parcel is mapped waterward of the city/UGA boundary. In this case, lands to centerline of river are under the City’s jurisdiction and included in the City reach. .................... 31
Figure 3-2. Example of reach break scenario where a mapped parcel occurs waterward of a city/UGA boundary and landward of the OHWM. In this case, lands to centerline of the river are under the County’s jurisdiction and included in the nearest County reach. .............................................. 32
Figure 4-1. Map of Water Resource Inventory Areas in Cowlitz County (Source: Washington Department of Ecology, GIS Technical Services). .............. 55
Figure 5-1. Map of Columbia River Assessment Unit (in green). ............................... 89
Figure 5-2. Columbia River Assessment Unit 2012 land use distribution (Source: Cowlitz County Assessor’s Office). .......................................................... 95
Figure 5-3. Millennium Bulk Terminals Longview site (Source: Cowlitz County). ...... 96
Figure 5-4. Shoreline public access at Abernathy Creek (Source: WDFW). ............. 98
Figure 5-5. Boat ramp at Willows Grove Park (Source: Cowlitz County). .................. 99
Figure 5-6. Permit issuance data for Columbia River Assessment Unit (Source: Cowlitz County). .................................................................................... 101
Figure 5-7. Map of Lewis River Basin Assessment Unit (in aqua). .......................... 102
Figure 5-8. Lewis River Assessment Unit 2012 land use distribution (Source: Cowlitz County Assessor’s Office). .................................................................... 107
Figure 5-9. Lower Lewis River along SR 530 east of Woodland (Source: TWC). ... 109
Figure 5-10. Shoreline public access at Island River (Source: WDFW). ................... 110
Figure 5-11. Public boat launch and parking lot at Yale Park (Source: TWC). .......... 111
Figure 5-12. Permit issuance data for Lewis River Assessment Unit (Source: Cowlitz County). ................................................................................................. 113
Figure 5-13. Map of Kalama River Basin Assessment Unit (in brown). ..................... 114
Figure 5-14. Kalama River Assessment Unit 2012 land use distribution (Source: Cowlitz County Assessor’s Office). ........................................................ 119
Figure 5-15. Shoreline public access at Beginners Hole (Source: WDFW). .............. 120
Figure 5-16. Shoreline public access at Pritchard’s (Source: WDFW). ..................... 121
Figure 5-17. Permit issuance data for Kalama River Assessment Unit (Source: Cowlitz County). ................................................................................................. 122
Figure 5-18. Map of Cowlitz River Assessment Unit (in purple). ............................... 123
Figure 5-19. Cowlitz River Assessment Unit 2012 land use distribution (Source: Cowlitz County Assessor’s Office). ........................................................ 133
Figure 5-20. The BNSF Railroad along Cowlitz River north of Castle Rock (Source: TWC). .................................................................................................... 134
Figure 5-21. Shoreline public access at Olequa Creek (Source: WDFW). ................ 136

x
Figure 5-22. Shoreline public access at Silver Lake (Source: WDFW). ..................... 136
Figure 5-23. Permit issuance data for Cowlitz River Assessment Unit (Source: Cowlitz County). ................................................................................................. 139
Figure 5-24. Map of Mill, Abernathy, and Germany Creek Assessment Unit (in yellow). ............................................................................................................... 140
Figure 5-25. Mill, Abernathy, Germany Creeks Assessment Unit 2012 land use distribution (Source: Cowlitz County Assessor’s Office). ....................... 144
Figure 5-26. Permit issuance data for Mill, Abernathy, Germany Creeks Assessment Unit (Source: Cowlitz County). .............................................................. 147
Figure 5-27. Map of South Fork Chehalis Assessment Unit. ..................................... 148
Figure 5-28. South Fork Chehalis River Assessment Unit 2012 land use distribution (Source: Cowlitz County Assessor’s Office). ......................................... 150
Figure 5-29. Map of City of Castle Rock shoreline jurisdiction. ................................. 151
Figure 5-30. Maps of City of Kalama shoreline jurisdiction (continued). .................... 164
Figure 5-30. Maps of City of Kalama shoreline jurisdiction (continued). .................... 165
Figure 5-31. Map of City of Kelso shoreline jurisdiction (1 of 2). ............................... 178
Figure 5-31. Map of City of Kelso shoreline jurisdiction (2 of 2). ............................... 179
Figure 5-32. Map of City of Woodland shoreline jurisdiction. ..................................... 199

xi
List of Tables Page #
Table 2-1. Use matrix for the PacifiCorp Shoreline Management Plan shoreline classifications. ......................................................................................... 14
Table 3-1. Shoreline inventory elements and information sources. .......................... 16
Table 3-2. Criteria for determining reach breaks. ..................................................... 32
Table 3-3. Summary of reaches per assessment unit. ............................................. 33
Table 3-4. Key shoreline ecological functions evaluated. ......................................... 34
Table 3-5. Description of shoreline functions and common sources of human disturbance. ............................................................................................. 35
Table 3-6. Summary of functional scoring approach. ............................................... 39
Table 3-7. Functional score ranking by indicator metric. .......................................... 41
Table 3-8. Zoning designations in the City of Kalama. ............................................. 47
Table 3-9. Zoning designations in the City of Woodland. ......................................... 48
Table 3-10. Water-oriented uses definitions and examples. ....................................... 50
Table 4-1. Summaries of Cowlitz County subbasins from the Lower Columbia Salmon Recovery and Fish and Wildlife Subbasin Plan (2010). ............. 61
Table 4-2. Priority species and habitats in Cowlitz County (WDFW 2010). .............. 61
Table 4-3. Threatened and endangered plant species in Cowlitz County. ............... 63
Table 5-1. Summary of shoreline inventory by assessment unit. ............................. 75
Table 5-2. Category 2 waterbodies (waters of concern) by assessment unit. .......... 81
Table 5-3. Category 4 waterbodies (polluted waters that do not require a total maximum daily load) by assessment unit. ............................................... 82
Table 5-4. Category 5 waterbodies (polluted waters that require a total maximum daily load) by assessment unit. ............................................................... 83
Table 5-5. Places on the Washington State Historic Register within shoreline jurisdiction. ............................................................................................... 86
Table 5-6. Functional scores for reaches in Cowlitz River Assessment Unit. ........... 91
Table 5-7. Restoration opportunities in the lower Columbia River and estuary. ....... 93
Table 5-8. Existing shoreline public access locations in the Columbia River Assessment Unit. ..................................................................................... 97
Table 5-9. Columbia River Assessment Unit: significant land use change 2002-2012. ............................................................................................................... 100
Table 5-10. Functional scores for reaches in Lewis River Assessment Unit. ........... 104
Table 5-11. Restoration opportunities in the North Fork Lewis River. ...................... 106
Table 5-12. Existing shoreline public access locations in the Lewis River Basin Assessment Unit. ................................................................................... 109
Table 5-13. Lewis River Assessment Unit: significant land use change 2002-2012. 112
Table 5-14. Functional scores for reaches in Kalama River Assessment Unit. ........ 116
Table 5-15. Restoration opportunities in the Kalama River. ..................................... 117

xii
Table 5-16. Existing shoreline public access locations in the Kalama River Assessment Unit. ................................................................................... 120
Table 5-17. Kalama River Assessment Unit: significant land use change 2002-2012. ............................................................................................................... 121
Table 5-18. Functional scores for reaches in Cowlitz River Assessment Unit. ......... 125
Table 5-19. Restoration opportunities in the Cowlitz River Assessment Unit. .......... 129
Table 5-20. Existing shoreline public access locations in the Cowlitz River Assessment Unit. ................................................................................... 135
Table 5-21. Cowlitz River Assessment Unit: significant land use change 2002-2012. ............................................................................................................... 138
Table 5-22. Functional scores for reaches in Mill, Abernathy, Germany Creeks Assessment Unit. ................................................................................... 141
Table 5-23. Restoration opportunities in Mill, Abernathy, and Germany Creeks. ..... 143
Table 5-24. Existing shoreline public access locations in the Mill, Abernathy, and Germany Creek Assessment Unit. ........................................................ 145
Table 5-25. Mill, Abernathy, Germany Creeks Assessment Unit: significant land use change 2002-2012. ................................................................................ 146
Table 5-26. Functional scores for reaches in South Fork Chehalis River Assessment Unit. ....................................................................................................... 148
Table 5-27. Functional scores for reaches in City of Castle Rock Assessment Unit. 153
Table 5-28. Summary of reach characteristics in the Castle Rock Assessment Unit (see Section 3.4.2 for methodology) ...................................................... 154
Table 5-29. Castle Rock Assessment Unit: significant land use change 2002-2012. ............................................................................................................... 155
Table 5-30. Public access opportunities in the Castle Rock Assessment Unit. ........ 156
Table 5-31. Functional scores for reaches in City of Kalama Assessment Unit. ...... 167
Table 5-32. Summary of reach characteristics in the City of Kalama Assessment Unit. ............................................................................................................... 168
Table 5-33. City of Kalama Assessment Unit: Significant land use change 2002-2012. ............................................................................................................... 169
Table 5-34. Ten year permit history in the City of Kalama. ....................................... 170
Table 5-35. Public access opportunities in the Kalama Assessment Unit. ............... 170
Table 5-36. Functional scores for reaches in City of Kelso Assessment Unit. ......... 181
Table 5-37. Summary of reach characteristics in the City of Kelso Assessment Unit. ............................................................................................................... 183
Table 5-38. City of Kelso Assessment Unit: land use change 2002-2012. ............... 184
Table 5-39. Ten-year permit history in the City of Kelso. .......................................... 184
Table 5-40. Public access opportunities in the Kelso Assessment Unit. .................. 185
Table 5-41. Functional scores for reaches in City of Woodland Assessment Unit. .. 200
Table 5-42. Summary of reach characteristics in the City of Woodland Assessment Unit. ....................................................................................................... 202
Table 5-43. City of Woodland Assessment Unit: significant land use change 2002-2012. ...................................................................................................... 203
Table 5-44. Ten-year permit history in the City of Woodland. .................................. 204

xiii
Table 5-45. Public access opportunities in the Woodland Assessment Unit. ........... 205
Table 5-46. Restoration opportunities applicable to all Assessment Units. .............. 212
Table 6-1. Comparison of existing and ecology shoreline environment designations. ............................................................................................................... 216
Table 6-2. Cowlitz County Wetland Buffer Regulations Summary. ........................ 229
Table 6-3. Castle Rock Wetland Buffer Regulations Summary. ............................. 229
Table 6-4. Kelso Wetland Buffer Regulations Summary. ....................................... 230
Table 6-5. Kalama Wetland Buffer Regulations Summary. .................................... 230
Table 6-6. Woodland Wetland Buffer Regulations Summary. ................................ 231
Table 6-7. Comparison of functions of stream and lake buffer widths. ................... 233
Table 6-8. Riparian Buffer Regulations. .................................................................. 235


The Watershed Company and Parametrix May 2014
1
SHORELINE ANALYSIS REPORT
COWLITZ COUNTY AND THE C ITIES OF CASTLE ROCK , KALAMA , KELSO , AND WOODLAND
1 INTRODUCTION
1.1 Background and Purpose Cowlitz County (County) and the Cities of Castle Rock, Kalama, Kelso, and
Woodland obtained a grant from the Washington Department of Ecology
(Ecology) in 2012 to complete a comprehensive update of their Shoreline Master
Programs (SMPs), prepared through a coordinated process. One of the first steps
of the update process is to inventory and characterize the County and City
shorelines as defined by the State’s Shoreline Management Act (SMA) (RCW
90.58). This analysis was conducted in accordance with the Shoreline Master
Program Guidelines (Guidelines, Chapter 173-26 WAC) and project Scope of
Work promulgated by Ecology, and the analysis addresses all unincorporated
areas within the County and the incorporated Cities of Castle Rock, Kalama,
Kelso, and Woodland. Under these Guidelines, the County must identify and
assemble the most current, applicable, accurate and complete scientific and
technical information available.
This shoreline inventory and analysis will describe existing conditions,
characterize ecological functions, and describe existing and anticipated land use
in the shoreline jurisdiction. This assessment of current conditions will serve as
the baseline of ecological and land use conditions, and this assessment could
serve as a basis for comparison for adaptive management in future SMP updates.
The Guidelines require that the County and Cities demonstrate that their
updated SMPs yield “no net loss” in shoreline ecological functions relative to the
baseline (current condition) due to their implementation. By describing and
inventorying existing conditions, this analysis will be used to help inform the
development of appropriate SMP policies, regulations, and environment
designations to help meet the “no net loss” goal.

Cowlitz County Shoreline Analysis Report
2
1.2 Shoreline Jurisdiction As defined by the Shoreline Management Act of 1971, shorelines include certain
waters of the state plus their associated “shorelands.” At a minimum, the
waterbodies designated as shorelines of the state are streams whose mean annual
flow is 20 cubic feet per second (cfs) or greater, lakes whose area is greater than
20 acres, and all marine waters. Shorelands are defined as:
“those lands extending landward for 200 feet in all directions as
measured on a horizontal plane from the ordinary high water mark;
floodways and contiguous floodplain areas landward 200 feet from such
floodways; and all wetlands and river deltas associated with the streams,
lakes, and tidal waters which are subject to the provisions of this
chapter…Any county or city may determine that portion of a one-
hundred-year-floodplain to be included in its master program as long as
such portion includes, as a minimum, the floodway and the adjacent land
extending landward two hundred feet therefrom… Any city or county
may also include in its master program land necessary for buffers for
critical areas [RCW 90.58.030(d), RCW 90.58.030(d)(i). and RCW
90.58.030(d)(ii)]”
The ordinary high water mark is:
“that mark that will be found by examining the bed and banks and
ascertaining where the presence and action of waters are so common and
usual, and so long continued in all ordinary years, as to mark upon the
soil a character distinct from that of the abutting upland, in respect to
vegetation as that condition exists on June 1, 1971, as it may naturally
change thereafter, or as it may change thereafter in accordance with
permits issued by a local government or the department: PROVIDED,
That in any area where the ordinary high water mark cannot be found,
the ordinary high water mark adjoining salt water shall be the line of
mean higher high tide and the ordinary high water mark adjoining fresh
water shall be the line of mean high water” (RCW 90.58.030(2)(c)).
The upstream limit of shoreline jurisdiction for streams and rivers is that point
where the mean annual flow becomes less than 20 cfs. Ecology GIS data
(Suggested Shoreline Points, 2010) was consulted to verify the upstream limits of
stream and river shoreline jurisdiction based on the USGS’s 1998 study of the 20
cfs cut-off (Kresch 1998 ). The 1998 USGS study has resulted in some expansion

The Watershed Company and Parametrix May 2014
3
of shoreline jurisdiction, both in terms of including new waterbodies as well as
extending jurisdiction further upstream than previously mapped. For example,
Studebaker Creek (above Castle Lake), South Coldwater Creek, Coldwater
Creek, Outlet Creek, and South Fork Mill Creek have all been designated as 20
cfs streams at some point along their watercourse. Similarly, an additional 5
lakes, beyond those listed in WACs 173-20-180 and 173-20-190, are also
considered Shorelines of the State based on the 20-acre criterion and the NHD
GIS polygons. These include: Coldwater and Castle Lakes, located within
federally owned land; Swift Number Two Forebay, which connects Swift
Reservoir with Yale Lake; and Kress Lake, a 24.6-acre lake and former gravel
mine located within the City of Kalama’s urban growth area. Longbell Log Pond,
located within Longview’s planned annexation boundary, though physically
meeting the criterion for a lake under Shoreline jurisdiction, was determined not
to be a shoreline lake by the Department of Ecology (Appendix H).
In total, this shoreline inventory has mapped 697 miles of streams, rivers, and
lakes which meet shoreline jurisdiction criteria. The total acreage of upland
shorelands is 48.6 square miles; this includes floodways and associated wetlands.
Federal lands make up 6.6 percent of that acreage, or 2,064 acres total. The
federal entities that own the majority of the federal land are the U.S. Forest
Service (USFS) and the National Park Service (NPS). State owned lands occupy
another 11.4 percent of the total shoreline acreage, or 3,555 acres.
All streams and rivers which have mean annual flow of 1,000 cfs or greater are
considered Shorelines of Statewide Significance. This applies to the entirety of
the Columbia River, Cowlitz River, Lewis River, and mainstem Toutle River, and
to the Kalama River downstream from the National Forest boundary. All lakes
greater than 1,000 acres are also considered Shorelines of Statewide Significance.
Merwin Lake, Yale Reservoir, and Silver Lake (each listed in WAC 173-20-190)
meet this criterion. For Shorelines of Statewide Significance, the Shoreline
Management Act (SMA) sets specific preferences for uses and calls for a higher
level of effort in implementing its objectives. A discussion of the entire
jurisdiction assessment and determination process can be reviewed in full in
Appendix A of this report. The proposed jurisdiction boundaries can be found in
Appendices B and C, Figure 1.

Cowlitz County Shoreline Analysis Report
4
1.3 Study Area The study area for this report includes all land currently within proposed
shoreline jurisdiction of the County or Cities. Further, the study area includes
relevant discussion of the contributing watersheds. Cowlitz County and its cities
are not required to plan following the Growth Management Act (GMA)(RCW
36.70A.040), and as such the cities are not required to establish Urban Growth
Areas (UGAs) and Urban Growth Boundaries (UGBs). Thus, when UGAs and
UGBs are discussed in this report, the terms are used to describe planning areas
that have been established through agreements with the County, or are
geographic areas provided in regional data from the Cowlitz-Wahkiakum
Council of Governments (CWCOG), and are not established under the GMA.
1.3.1 Cowlitz County
Cowlitz County encompasses 1,166 square miles and is located in the south-
central part of Washington. The southern border of the County is defined by the
Columbia and Lewis Rivers. The County is bordered to the southwest by the
State of Oregon, to the southeast by Clark County, to the west by Wahkiakum
County, to the north by Lewis County, and to the east by Skamania County. The
County includes portions of four Water Resource Inventory Areas (WRIAs),
including the western portion of the Lewis Watershed (WRIA 27), the Cowlitz
Watershed (WRIA 26), the eastern tributaries in the Grays-Elochoman Watershed
(WRIA 25), and the southern portion of the Chehalis Watershed (WRIA 23).
The County is predominantly rural in nature, with unincorporated areas
comprising most of the land area. Incorporated areas of the County include the
cities of Castle Rock, Kalama, Kelso, and Woodland, participating in this regional
SMP, as well as the City of Longview. Cowlitz County is also home to the
Cowlitz Indian Tribe.
1.3.2 City of Castle Rock
Castle Rock is the northernmost City in Cowlitz County. Located approximately
31 miles east of Mount St. Helens, the City is situated on the Cowlitz River,
approximately 1 mile downstream from its confluence with the Toutle River.
The City covers an area of 1.91 square miles, with a population of 1,982 people in
the 2010 US Census. The City of Castle Rock and Cowlitz County have an Urban
Growth Management agreement. The City’s Urban Growth Area includes
approximately 1.25 square miles of unincorporated land, with a population of
approximately 160 people.

The Watershed Company and Parametrix May 2014
5
1.3.3 City of Kalama
The City of Kalama is situated on the Columbia River, near the mouth of the
Kalama River. The City covers an area of 2.74 square miles, and has a population
of 2,344 people, according to the 2010 US Census. The City has adopted an
Urban Growth Boundary that includes approximately 2.52 square miles, with a
population of approximately 500 people.
1.3.4 City of Kelso
The City of Kelso is located at the confluence of the Columbia and Cowlitz
Rivers, and includes a portion of the Coweeman River and a portion of Owl
Creek. The western border is shared with the City of Longview. The City covers
8.4 square miles, with a population of 11,925, according to the 2010 US Census.
Although the City of Kelso does not have an official Urban Growth Area, the
assessment unit area for the purposes of this report for Kelso includes an
additional 4.48 square miles of unincorporated land. This land is identified by
the Cowlitz-Wahkiakum Council of Governments Geographic Information
System as a planning area for Kelso.
1.3.5 City of Woodland
The City of Woodland is located on the Lewis River, near its confluence with the
Columbia River. A portion of the City extends into Clark County. The City,
covering 4.32 square miles (including a 2011 annexation of 483 acres), has a
population of 5,509 according to the 2010 US Census, of which 5,426 live in the
Cowlitz County and 83 live in Clark County. The City’s Urban Growth
Boundary includes 50 acres of unincorporated land, with an estimated
population of 80 people using an average of 2.67 people per household.
2 SUMMARY OF CURRENT REGULATORY FRAMEWORK
2.1 Shoreline Management Act The Shoreline Management Act of 1971 brought about many changes for local
jurisdictions. The legislative findings and policy intent of the SMA states:
“There is, therefore, a clear and urgent demand for a planned,
rational, and concerted effort, jointly performed by federal, state, and
local governments, to prevent the inherent harm in an uncoordinated
and piecemeal development of the state's shorelines (RCW
90.58.020).”

Cowlitz County Shoreline Analysis Report
6
While protecting shoreline resources by regulating development, the SMA is also
intended to provide balance by encouraging water-dependent or water-oriented
uses while also conserving or enhancing shoreline ecological functions and
values. SMPs will be based on state guidelines, but should be tailored to the
specific conditions and needs of the local community.
2.2 Cowlitz County Cowlitz County adopted its first Shoreline Master Program in 1977. Shoreline
uses, developments, and activities regulated under the critical areas regulations
are also subject to the County’s Comprehensive Plan, County Code, and various
other provisions of County, state and federal laws.
The current Shoreline Master Program designations for Cowlitz County
(including the Cities of Castle Rock, Kalama, Kelso, and Woodland) are briefly
described below.
Urban: The Urban Shoreline District includes shoreline areas suitable for
intensive recreation, residential, industrial, and commercial development.
Rural: The Rural Shoreline District includes shoreline areas with soil and
land areas suitable for intensive agriculture, capable of recreation site
development, public access, and limited residential development.
Conservancy: The Conservancy Shoreline District consists of shoreline
areas containing natural resources that can be harvested and naturally
replenished. This includes areas which, because of flooding, slide prone
soils, or other natural parameters, are not suitable for intensive
agriculture or high density use.
Natural: The Natural Shoreline District consists of shoreline areas with
unique features that would be severely affected by human intrusions.
The County Comprehensive Plan, adopted by the Board of County
Commissioners on November 1, 1976, is a statement of policies and goals that
guides growth and development throughout the County. All other development
ordinances, including land use, subdivision, and environmental regulations must
be consistent with the Comprehensive Plan. The County is currently in the final
phases of the process of drafting its Comprehensive Plan Update.

The Watershed Company and Parametrix May 2014
7
The Final Vision Report (MPC and EA Blumen 2010) of the proposed
Comprehensive Plan states, “We value our strengths: our historic rural and small
town character and our irreplaceable natural environment – mountains, forests,
agricultural and mineral lands; streams, lakes and shorelines; and plentiful clean
air and water. Conservation of these features contributes to our economic well-
being, sense of place and relationship to nature.”
County regulations applicable to critical areas were adopted in 1996, and
subsequently revised in 2009 to be consistent with Growth Management Act
(GMA) requirements to update comprehensive land use plans and development
regulations every 7 years [note that Cowlitz County does not plan under the
GMA; WAC 365-196-030(1)(c)]. In those regulations, the County specifies fish
and wildlife conservation buffers ranging from 50 to 150 feet depending on the
category of stream/waterbody (CCC Title 19), with Type S waterbodies (i.e.
Shorelines of the State) having a 150-foot buffer. The regulations require wetland
buffers between 25 and 300 feet based on wetland classification, level of habitat
functions, and the intensity of the proposed land use (CCC Title 19). Many
shoreline and wetland areas within the County contain buffers of the required
widths. Smaller buffers are found where developments existed prior to the
critical areas regulations or where buffers of different widths were previously
established in approved site plans or protected critical area easements. Section
6.2.2 provides an evaluation of these regulations in terms of meeting the criteria
of the Shoreline Guidelines (WAC 173-26).
Cowlitz County is not subject to other provisions of the State’s Growth
Management Act, which only apply to the largest and fastest growing counties in
the state; therefore, Urban Growth Areas (UGAs) are not established on a
County-wide basis, although specific UGAs have been established in association
with incorporated cities, as described below.
Each of the incorporated cities below has adopted the existing Cowlitz County
Shoreline Master Program.
2.3 City of Castle Rock The City updated its Comprehensive Plan in 2006. Citing the significance of
lands both within the City limits and in the surrounding area of influence, the
Plan extends beyond the City limits to address the area within a designated
Urban Growth Boundary. Cowlitz County and the City of Castle Rock entered

Cowlitz County Shoreline Analysis Report
8
into an Urban Growth Area (UGA) interlocal agreement in 1984. “The Urban
Growth Boundary defines the area around Castle Rock (including the city limits)
within which urban-density development is encouraged and is planned for
service by public sewer and water systems. The boundary also marks the
boundary in which urban residential infilling of vacant land is encouraged,
where annexation by the city is logical, and where coordination of services and
land use decisions is obtained in conjunction with Cowlitz County.” The
Environment Element of the Comprehensive Plan states, “Natural amenities
including the Cowlitz River, forested hillsides, riverfront property, abundant fish
and wildlife and many other factors all contribute significantly to the City’s
atmosphere and success. This chapter attempts to balance protection of critical
areas and other natural amenities with the goals and policies found throughout
the comprehensive plan.”
The City updated its Critical Areas Regulations in 2002. Critical Areas
Regulations specify fish and wildlife habitat conservation buffers ranging from
150 to 250 feet depending on the category of stream/waterbody and mass
wasting potential (CRMC 18.10.130). The regulations require wetland buffers
between 25 and 300 feet based on wetland classification and the intensity of the
proposed land use (CRMC 18.10.120). Section 6.2.2 provides an evaluation of
these regulations in terms of meeting the criteria of the Shoreline Guidelines
(WAC 173-26).
2.4 City of Kalama The Kalama City Council adopted a revised Kalama Comprehensive Plan on
December 7, 2005. The City of Kalama is beginning to develop a growth
management area similar to an official Urban Growth Boundary to help guide its
growth and development. The Comprehensive Plan includes nine general goals
to balance economic growth with environmental protection.
Chapter 15.02 of the Kalama Municipal Code addresses Critical Areas Protection.
Revised in 2004, Critical Areas Protection Regulations specify fish and wildlife
habitat conservation buffers ranging from 25 to 250 feet depending on the
category of stream/waterbody and mass wasting potential (KMC 15.02.130). The
regulations require wetland buffers between 25 and 300 feet based on wetland
classification and the intensity of the proposed land use (KMC 15.02.120).
Section 6.2.2 provides an evaluation of these regulations in terms of meeting the
criteria of the Shoreline Guidelines (WAC 173-26).

The Watershed Company and Parametrix May 2014
9
2.5 City of Kelso The Comprehensive Plan for the City of Kelso was adopted in 1980, with chapter
updates in 1987 and 1992. Goals in the Comprehensive Plan are directed toward
ensuring economic growth and security, public access, and environmental
protection. The City is currently in the process of updating its Comprehensive
Plan and Development Regulations.
Critical Areas Regulations in the City of Kelso were updated in 1997. Minimum
wetland buffers range from 50 to 200 feet, depending on category (KMC
18.20.080). Specific buffers are not established for Fish and Wildlife
Conservation Areas, although development performance standards are
identified to limit development impacts on Fish and Wildlife Conservation
Standards (KMC 18.20.090). Section 6.2.2 provides an evaluation of these
regulations in terms of meeting the criteria of the Shoreline Guidelines (WAC
173-26).
2.6 City of Woodland The City of Woodland is subject to provisions of the GMA because a small
portion of its city limits is in Clark County, a GMA county. The Woodland
Urban Growth Management Program was adopted in 1981, and it was last
updated in 2002.
The City’s Critical Areas Regulations were updated in 2006. Standard wetland
buffer widths range from 25 feet to 300 feet, depending on wetland category,
habitat functions, and intensity of proposed land use (WMC 15.08.350). Riparian
Habitat Area widths range from 100 feet to 250 feet depending on stream type
and mass wasting potential (WMC 15.08.730-1). Section 6.2.2 provides an
evaluation of these regulations in terms of meeting the criteria of the Shoreline
Guidelines (WAC 173-26).
2.7 State Agencies and Regulations Aside from the Shoreline Management Act, State regulations most pertinent to
development in the County and Cities’ shorelines include the State Hydraulic
Code, the Growth Management Act (Critical Area provisions), State
Environmental Policy Act, tribal agreements and case law, Watershed Planning
Act, Water Resources Act, and Salmon Recovery Act. A variety of agencies (e.g.,
Washington Department of Ecology, Washington Department of Fish and
Wildlife, Washington Department of Natural Resources) are involved in

Cowlitz County Shoreline Analysis Report
10
implementing these regulations. The Department of Ecology reviews all
shoreline projects that require a shoreline permit, but has specific regulatory
authority over shoreline conditional use permits and shoreline variances. Other
agency reviews of shoreline developments are typically triggered by in- or over-
water work, discharges of fill or pollutants into the water, or substantial land
clearing.
Depending on the nature of the proposed development, state regulations can
play an important role in the design and implementation of a shoreline project,
ensuring that impacts to shoreline functions and values are avoided, minimized,
and/or mitigated. During the comprehensive SMP update, the County and Cities
will consider other state regulations to ensure consistency as appropriate and
feasible with the goal of streamlining the shoreline permitting process. A
summary of some of the key state regulations and/or state agency responsibilities
follows.
Section 401 Water Quality Certification: Section 401 of the federal Clean
Water Act allows states to review, condition, and approve or deny certain federal
permitted actions that result in discharges to State waters, including wetlands.
In Washington, the Department of Ecology is the State agency responsible for
conducting that review, with their primary review criteria of ensuring that State
water quality standards are met. Actions within streams or wetlands within the
shoreline zone that require a Section 404 permit (see Section 2.8) will also need to
be reviewed by Ecology.
Washington Department of Natural Resources: Washington Department of
Natural Resources (WDNR) is charged with protecting and managing use of
state-owned aquatic lands. Toward that end, water-dependent uses waterward
of the ordinary high water mark require review by WDNR to establish whether
the project is on state-owned aquatic lands. Certain project activities, such as
single-family or two-party joint-use residential docks, on state-owned aquatic
lands are exempt from these requirements. WDNR recommends that all
proponents of a project waterward of the ordinary high water mark contact
WDNR to determine jurisdiction and requirements.
Watershed Planning Act: The Watershed Planning Act of 1998 (Chapter 90.82
RCW) was passed to encourage local planning of local water resources,
recognizing that there are citizens and entities in each watershed that “have the
greatest knowledge of both the resources and the aspirations of those who live

The Watershed Company and Parametrix May 2014
11
and work in the watershed; and who have the greatest stake in the proper, long-
term management of the resources.”
Cowlitz County is within four watershed basins. The planning staff from the
County and the City of Kelso were involved in the development of the Grays-
Elochoman and Cowlitz Watershed Management Plan (WRIA 25-26) and the
Salmon-Washougal and Lewis Watershed Management Plan (WRIA 27-28).
Over a period from 1999 to 2004, this Planning Unit undertook an assessment of
water resource conditions, commissioned a series of technical memoranda on
water resource issues and solutions, and oversaw preparation of the
Management Plan. The Plans were completed in July 2006.
Hydraulic Code: Chapter 77.55 RCW (the Hydraulic Code) gives the Washington
Department of Fish and Wildlife (WDFW) the authority to review, condition, and
approve or deny “any construction activity that will use, divert, obstruct, or
change the bed or flow of State waters.” These activities may include stream
alteration, culvert installation or replacement, pier and bulkhead repair or
construction, among others. WDFW can condition projects to avoid, minimize,
restore, and compensate adverse impacts.
Water Pollution Control Act: Chapter 90.48 RCW establishes the State’s policy
“to maintain the highest possible standards to insure the purity of all waters of
the State consistent with public health and public enjoyment thereof, the
propagation and protection of wild life, birds, game, fish and other aquatic life,
and the industrial development of the State, and to that end require the use of all
known available and reasonable methods by industries and others to prevent
and control the pollution of the waters of the State of Washington.” The
Department of Ecology is the agency charged with crafting and implementing
rules and regulations in accordance with this legislation.
2.8 Federal Regulations Federal regulations most pertinent to development in the County and Cities’
shorelines include the Endangered Species Act, the Clean Water Act, and the
Rivers and Harbors Appropriation Act. Other relevant federal laws include the
National Environmental Policy Act, Anadromous Fish Conservation Act, Clean
Air Act, and the Migratory Bird Treaty Act. A variety of agencies (e.g., U.S.
Army Corps of Engineers [Corps], National Marine Fisheries Service, U.S. Fish
and Wildlife Service) are involved in implementing these regulations, but review

Cowlitz County Shoreline Analysis Report
12
by these agencies of shoreline development in most cases would be triggered by
in- or over-water work, or discharges of fill or pollutants into the water.
Depending on the nature of the proposed development, federal regulations can
play an important role in the design and implementation of a shoreline project,
ensuring that impacts to shoreline functions and values are avoided, minimized,
and/or mitigated. During the comprehensive SMP update, the County and Cities
will consider other federal regulations to ensure consistency as appropriate and
feasible with the goal of streamlining the shoreline permitting process. A
summary of some of the key federal regulations and/or federal agency
responsibilities follows.
Section 404: Section 404 of the federal Clean Water Act provides the Corps,
under the oversight of the U.S. Environmental Protection Agency, with authority
to regulate “discharge of dredged or fill material into waters of the United States,
including wetlands” (http://www.epa.gov/owow/wetlands/pdf/
reg_authority_pr.pdf). The extent of the Corps’ authority and the definition of
fill have been the subject of considerable legal activity. As applicable to the
County’s shoreline jurisdiction, however, it generally means that the Corps must
review and approve most activities in streams and wetlands. These activities
may include wetland fills, stream and wetland restoration, and culvert
installation or replacement, among others. Similar to SEPA requirements, the
Corps is interested in avoidance, minimization, restoration, and compensation of
impacts.
Section 10: Section 10 of the federal Rivers and Harbors Appropriation Act of
1899 provides the U.S. Army Corps of Engineers (Corps) with authority to
regulate activities that may affect navigation of “navigable” waters. Designated
“navigable” waters in Cowlitz County include the Columbia River, including
Burke, Coal Creek, Fisher Island, and Martin Island Sloughs and Carrolls
Channel, Lewis River (lower 18 miles, including Horseshoe Lake), Cowlitz River
(35.5 miles), Kalama River (lower 4 miles), Abernathy Creek (lower 0.3 mile), and
Coweeman River and Sloughs (lower 4 miles). Accordingly, proposals to
construct new or modify existing over-water structures (including bridges), to
excavate or fill, or to “alter or modify the course, location, condition, or capacity
of” navigable waters must be reviewed and approved by the Corps.
Federal Endangered Species Act (ESA): Section 9 of the ESA prohibits “take”
of listed species. Take has been defined in Section 3 as: “harass, harm, pursue,

The Watershed Company and Parametrix May 2014
13
hunt, shoot, wound, kill, trap, capture, or collect, or to attempt to engage in any
such conduct.” The take prohibitions of the ESA apply to everyone, so any
action that results in a take of listed fish or wildlife would be a violation of the
ESA and is strictly prohibited. Per Section 7 of the ESA, activities with potential
to affect federally listed or proposed species and that either require federal
approval, receive federal funding, or occur on federal land must be reviewed by
the National Marine Fisheries Service (NOAA Fisheries) and/or U.S. Fish and
Wildlife Service (USFWS) via a process called “consultation.” Activities
requiring a Section 10 or Section 404 permit also require such consultation if
these activities occur in waterbodies with listed species. Since the listing of
chinook salmon, coho salmon, chum salmon, sockeye salmon, steelhead trout,
and bull trout as Threatened under the ESA, the Corps, NOAA Fisheries and
USFWS have jointly developed a number of Regional General Permits (RGPs) or
programmatic consultations to streamline permitting of projects in waterbodies
containing listed fish (e.g. RGP 8: Restoration on Forest Service Lands).
Clean Water Act: The federal Clean Water Act has a number of programs and
regulatory components, but of particular relevance to Cowlitz County is the
National Pollutant Discharge Elimination System (NPDES) program. In
Washington State, the Department of Ecology has been delegated the
responsibility by the U.S. Environmental Protection Agency for managing
implementation of this program. The County is engaged in compliance with the
NPDES Phase II Municipal Stormwater General Permit requirements that
address stormwater system discharges to surface waters.
2.9 PacifiCorp Shoreline Management Plan As a part of its Federal Energy Regulatory Commission relicensing process,
PacifiCorp developed a Shoreline Management Plan in 2008 for the three major
reservoirs in the upper Lewis River. The PacifiCorp Shoreline Management Plan
applies to lands extending from the OHWM to the elevation 10 feet above the
OHWM. PacifiCorp owns many of the lands within the Shoreline Management
Plan boundary area, and it holds flowage easements on the other lands.
The PacifiCorp Shoreline Management Plan does not impose a duty or regulation
on Cowlitz County and has not been developed to meet the "No Net Loss"
standard, as required of the updated Shoreline Master Program plans;
nevertheless, the PacifiCorp plan has many parallels that are consistent with the
Shoreline Management Act requirements. The plan identifies three shoreline

Cowlitz County Shoreline Analysis Report
14
classifications: Integrated Use, Project Works, and Resource Management. The
majority of shoreline area is designated as Resource Management classification.
The Plan identifies permitted and prohibited uses in each shoreline classification.
The PacifiCorp use matrix is replicated in Table 2-1, below.
Table 2-1. Use matrix for the PacifiCorp Shoreline Management Plan shoreline classifications.
Uses and Facilities Integrated Use Resource Management Project Operations
Multi-boat slips YES NO NO Community Docks YES NO NO Single Family docks YES NO NO Retaining walls YES NO NO
Shoreline stabilization measures YES Only natural or bio
control measures allowed
NO
Boat ramps YES NO NO Marine trestles, railways, trams & lifts YES NO NO
Moorings YES YES NO Dredging YES NO NO Log booms YES YES NO Structures to accommodate municipal/agricultural water withdrawal & discharges
YES YES NO
Structures to accommodate private/residential water withdrawal YES YES NO
Scientific Instrumentation YES YES YES Vegetation removal YES YES NO Vegetation plantings YES YES NO Stairways & walkways YES YES NO Footpaths YES YES NO Public Recreation Sites YES NO NO Fish/wildlife support activities & devices YES YES YES
≤ 50% In kind repair or replacement of Permitted Use within existing footprint
YES YES YES
Temporary Uses YES YES YES

The Watershed Company and Parametrix May 2014
15
3 INVENTORY AND ANALYSIS METHODS
3.1 Inventory Sources Development of a shoreline inventory is intended to record the existing or
baseline conditions to aid in the development of shoreline master program
provisions and to ensure the adopted regulations provide no net loss of shoreline
ecological functions. At a minimum, local jurisdictions shall gather the inventory
elements listed in the Guidelines, to the extent information is relevant and
readily available. Collected information included Watershed Resource Inventory
Area (WRIA) documents, Cowlitz County studies, City documents, scientific
literature, personal communications, aerial photographs, internet data,
Geographic Information Systems (GIS) data from a variety of data providers.
Historical aerial photographs were consulted to compare past and present
conditions to assess the changes that have occurred in the County’s shorelines
and assess the cumulative impacts of existing development. Table 3-1 lists those
relevant inventory elements for which data is available for the County and Cities’
shorelines. The table also describes the information collected for each of the
required inventory elements. Map figures are provided in the Map Folio
(Appendices B and C), and they depict the various inventory pieces listed in the
table, as well as additional analysis. Data gaps and limitations are discussed
further in Section 3.2.

Cowlitz County Shoreline Analysis Report
16
Table 3-1. Shoreline inventory elements and information sources.
Inventory Element Information Gathered Data Source Use/Assumptions/Limitations
Land Use Patterns
Current land use and land ownership
Cowlitz County, Parcel data 2012
Useful in assessing existing intensity and type of development at broad scale planning level (Figure 2, Appendices B and C)
Gross scale characterization (e.g., urban, forest, rural/ag)
Identifies publicly owned land by agency (e.g., USFS, WA Parks, County, City) (See Land Ownership, Figure 3, Appendix B and Figure 5 Appendix C)
Identifies existing vacant lands (see Analysis of Future Land Use, Section 3.4.2, as well as Figure 4, Appendix B and Figure 6 Appendix C).
Zoning
Cowlitz County
Latest County zoning data is not available in GIS format, so a scanned copy of the official County zoning map is used for the map folio. (See Appendix E)
Shoreline jurisdiction is not indicated on the County zoning map.
City of Castle Rock, 2012 City zoning applies only within city limits, and does not include UGAs (See Figure 4, Appendix C) City of Kalama, 2007
City of Kelso, 2009 City of Woodland, 2005
Future land use (Comprehensive Plan)
Overall
Useful in planning to accommodate future land use changes at broad scale planning level
Based on area-wide categorization- includes roads, easements, and utilities

The Watershed Company and Parametrix May 2014
17
Inventory Element Information Gathered Data Source Use/Assumptions/Limitations
Cowlitz County
County is presently undergoing an update of its Comprehensive Plan
Official County Comprehensive Plan Map is not available in GIS, so an electronic version of the official County Comprehensive Plan map is used for the map folio (Appendix D).
Shoreline jurisdiction is not indicated on the County comprehensive plan map.
City of Castle Rock, 2006 Data reflect future land use planning with the City
limits and UGB.
City of Kalama, 2005 Data reflect future land use planning within City limits
only; data do not include UGB area.
City of Kelso, 2009
Data reflects future land use planning within City limits only; data do not include UGB area.
The City is currently in the process of updating its Comprehensive Plan and Development Regulations.
City of Woodland, 2011 Data reflect future land use planning with the City
limits and UGB.
Existing SMP Cowlitz County, 1976
Cities have all adopted Cowlitz County SMP. Existing SMP will be revised. Existing Environment Designations Map is not
included in the Inventory maps.

Cowlitz County Shoreline Analysis Report
18
Inventory Element Information Gathered Data Source Use/Assumptions/Limitations
Public Access Areas
Parks Cowlitz County, WA
Regional Trail System
Boat Launches (handheld and motorized)
Public Lands Forest Service Lands Utilities corridors
Cowlitz County (Parks, Boat launches)
Cowlitz County, Cities of Longview, Kelso, Kalama, Woodland, and Castle Rock,
Washington State Parks and Recreation, 2012
USDA Forest Service, 1999
Includes established parks and recreation sites County boat launch data has been updated to be
consistent with County parks master plan document Public lands data from DNR is dated 2009 and might
not be up-to-date. Trail data depicts general location of existing and
proposed trails as adopted in the Cowlitz Regional Trails Plan, current through April, 2012.
Mapping of public access areas does not include all WDFW water access sites which are depicted on the WDFW website. Notes have been added to public access descriptions within Chapter 5.
Impervious Surfaces
General impervious surface
NOAA Coastal Change Analysis Program (satellite imagery interpretation at 30-m resolution, developed to meet an 85% accuracy specification), 2006
Based on interpretation of multispectral imagery at 30 x 30 meter cell resolution (Figure 6, Appendix B and Figure 8 Appendix C).
Useful for broad scale assessment of impervious surface coverage
Data captures impervious surfaces (e.g., rooftops, roads, parking lots), but may not capture areas with reduced infiltration potential (e.g., compacted areas)
May overestimate or underestimate impervious surface coverage
Not useful for accurate characterization of fine scale data (e.g., City or parcel level)

The Watershed Company and Parametrix May 2014
19
Inventory Element Information Gathered Data Source Use/Assumptions/Limitations
Vegetation
Terrestrial vegetation type and land cover
Forest Cover (Cities and UGAs only)
Unincorporated Cowlitz County: NOAA Coastal Change Analysis Program (satellite imagery interpretation at 30-m resolution, developed to meet an 85% accuracy specification), 2006
Cities and unincorporated areas within Urban Growth Boundaries: Forested vegetation digitized based on 2011 NAIP aerial photography
Based on interpretation of multispectral imagery at 30 x 30 m cell resolution (Figure 7 Appendix B and Figure 9 Appendix C)
Useful for broad scale assessment of vegetation coverage
Not useful for accurate characterization of fine scale data (e.g., City or parcel level, species composition)
For cities and UGBs, visual interpretation of satellite imagery is confounded by the presence of shadows, which may result in a slight overestimate of total forested area.
Frequently Flooded Areas
Floodplains Floodways
Unincorporated Cowlitz County: FEMA, Q3, 1996, GIS data from Department of Ecology
Incorporated Cities: Draft Digital Flood Insurance Rate Map (DFIRM) FEMA, 2010, GIS data from CWCOG
Q3 map does not reflect the most current flooding conditions (Figure 8 Appendix B).
The draft DFIRM has not been finalized, and the County is contesting the draft DFIRM because of inaccuracies in specific areas, but it does represent the most recent attempt to capture existing flooding conditions (Figure 10 Appendix C).
Channel Migration Zone
Floodplains Natural and artificial
barriers to channel movement
Roads
Unincorporated Cowlitz County: FEMA, Q3, 1996, GIS data from Department of Ecology
Incorporated Cities: Draft Digital Flood Insurance Rate Map (DFIRM) FEMA, 2010, GIS data from CWCOG
Channel migration zone (CMZ) data is not available; therefore the 100 year floodplain was used as a proxy for the CMZ except where areas are separated from the channel by a legally existing artificial structure (Figure 9 Appendix B and Figure 11 Appendix C).
Visual spot checks of aerial photos were used to identify locations where historic migration extends outside the floodplain (e.g. Toutle River sediment plain).

Cowlitz County Shoreline Analysis Report
20
Inventory Element Information Gathered Data Source Use/Assumptions/Limitations
Wetlands Potential wetlands
U.S. Fish and Wildlife Service National Wetland Inventory, 2012 (based on 1979 delineation) USDA NRCS Hydric Soils map, 1989
Useful for broad scale assessment of soil conditions and potential wetlands (Figure 10 Appendix B and Figure 12 Appendix C)
NWI mapping based on interpretation of multi-spectral imagery
Hydric soils based on broad scale soil mapping, not mapped in inventory because NWI tends to be more accurate.
Many wetlands are not identified by NWI or hydric soils mapping; mapped wetlands may not meet wetland criteria.
Not to be used in place of site-specific studies
Surface water
Surface water flowlines (includes streams, rivers, canals, ditches, springs, seeps, and artificial water paths) Waterbodies (includes lakes, ponds, reservoirs, swamps, and marshes)
USGS, National Hydrography Dataset (NHD), 2011
Small, intermittent or ephemeral streams may not be identified in data (Figure 11 Appendix B and Figure 13 Appendix C)
Upper Chehalis River (drainage basin) is excluded from this dataset
Interactive map includes stream typing http://fortress.wa.gov/dnr/app1/fpars/viewer.htm
Surficial Geology Geologic classifications WA Department of Natural Resources, Division of Geology and Earth Resources, Surface Geology, June 2010
Based on broad scale geologic classifications (Figure 12 Appendix B and Figure 14 Appendix C)
Useful for broad scale assessment of geologic conditions
Not to be used in place of site-specific studies
Soils Soil types USDA NRCS (SSURGO), 1989
Based on broad scale soil mapping (Figure 13 Appendix B and Figure 15 Appendix C)
Useful for broad scale assessment of soil conditions Not to be used in place of site-specific studies Per County Code, aquifer recharge areas are
determined by mapped soil type.

The Watershed Company and Parametrix May 2014
21
Inventory Element Information Gathered Data Source Use/Assumptions/Limitations
Geologically hazardous areas
Slope stability Landslide hazard
areas Seismic and tsunami
hazard areas
Washington Department of Natural Resources, Geology and Earth Sciences Division, 2010
Useful for broad scale assessment of geologically hazardous areas (Figure 14 Appendix B and Figure 16 Appendix C)
Specific type of geohazard (e.g., steep slope, seismic hazard) is not mapped
Data are primarily DNR derived landslide hazard areas.
Requires site-specific review to verify presence/absence of geohazards
WDFW Priority Habitats & Species (PHS)
Priority fish, priority wildlife, priority habitats
Intertidal vegetation
WA Department of Fish and Wildlife, PHS, 2010
WA Department of Fish and Wildlife, SalmonScape, 2012
Mapping of PHS information is presented in three maps to depict habitat regions, species and fish presence (Figures 15-17 Appendix B and Figures 17-19 Appendix C).
WDFW maps do not capture every priority species location or habitat, particularly for rare species or species that use shoreline habitats seasonally or intermittently
Absence of mapping information does not indicate absence of a particular species
The number of documented species may reflect the relative amount of past survey efforts
New data will need to be obtained at the time of a project application
Interactive PHS and salmonid data available at http://wdfw.wa.gov/mapping/phs/ and http://wdfw.wa.gov/mapping/salmonscape/
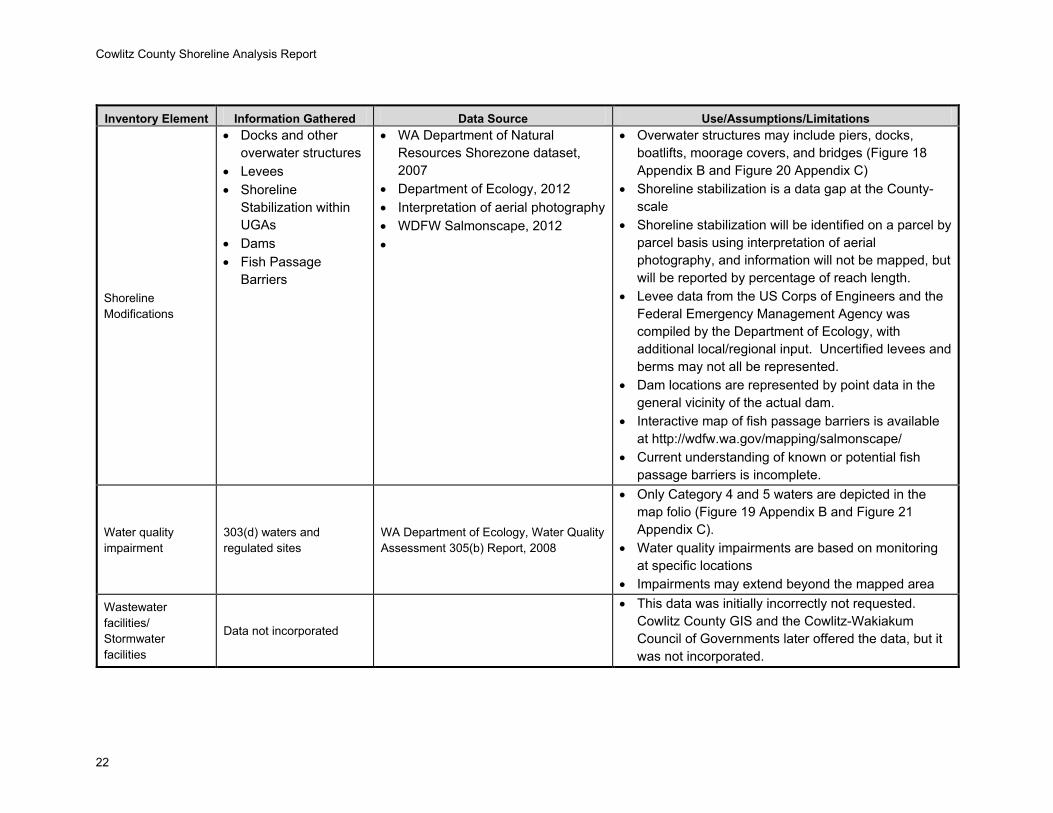
Cowlitz County Shoreline Analysis Report
22
Inventory Element Information Gathered Data Source Use/Assumptions/Limitations
Shoreline Modifications
Docks and other overwater structures
Levees Shoreline
Stabilization within UGAs
Dams Fish Passage
Barriers
WA Department of Natural Resources Shorezone dataset, 2007
Department of Ecology, 2012 Interpretation of aerial photography WDFW Salmonscape, 2012
Overwater structures may include piers, docks, boatlifts, moorage covers, and bridges (Figure 18 Appendix B and Figure 20 Appendix C)
Shoreline stabilization is a data gap at the County-scale
Shoreline stabilization will be identified on a parcel by parcel basis using interpretation of aerial photography, and information will not be mapped, but will be reported by percentage of reach length.
Levee data from the US Corps of Engineers and the Federal Emergency Management Agency was compiled by the Department of Ecology, with additional local/regional input. Uncertified levees and berms may not all be represented.
Dam locations are represented by point data in the general vicinity of the actual dam.
Interactive map of fish passage barriers is available at http://wdfw.wa.gov/mapping/salmonscape/
Current understanding of known or potential fish passage barriers is incomplete.
Water quality impairment
303(d) waters and regulated sites
WA Department of Ecology, Water Quality Assessment 305(b) Report, 2008
Only Category 4 and 5 waters are depicted in the map folio (Figure 19 Appendix B and Figure 21 Appendix C).
Water quality impairments are based on monitoring at specific locations
Impairments may extend beyond the mapped area
Wastewater facilities/ Stormwater facilities
Data not incorporated
This data was initially incorrectly not requested. Cowlitz County GIS and the Cowlitz-Wakiakum Council of Governments later offered the data, but it was not incorporated.

The Watershed Company and Parametrix May 2014
23
Inventory Element Information Gathered Data Source Use/Assumptions/Limitations
Restoration opportunities
Site-specific and general projects
EDT reaches, LCFRB (2010) Habitat Work Schedule
(hws.ekosystem.us) Local staff provided information
Identification of restoration opportunities is underway and are preliminarily reported in Chapter 5.
Mapping of restoration opportunity locations are not included in this map set.
This report will provide a preliminary look at restoration opportunities; however, restoration opportunities are not limited to those identified in this report, and restoration opportunities will be pursued further in the Shoreline Restoration Plan.
Historical Sites Historical places available as point data, but not mapped in inventory
WA Department of Archaeology and Historic Preservation, Washington State Heritage Register, 2009
Data not mapped in shoreline inventory report Data represent only known sites; additional,
presently unknown sites may exist

Cowlitz County Shoreline Analysis Report
24
3.2 Assessment Units For the purpose of describing the shoreline inventory, analysis, and
characterization, the County was divided by major river basin or watershed into
various assessment units; because the Columbia River extends across three out of
the four watersheds in the County, the Columbia River is addressed as a separate
assessment unit. Similarly, because the Lewis River and Kalama River each
consist of distinct basins entering the Columbia River, these two river basins will
be addressed separately. The Cowlitz River Assessment Unit includes both the
Toutle and Coweeman Rivers. Furthermore, because the scale of land use
distinctions and management decisions is finer on the city-scale compared to the
county-scale, each participating city and unincorporated areas identified by the
Cowlitz-Wahkiakum Council of Governments as its Urban Growth Boundary
(UGB) are addressed as separate assessment units. As described above, only the
city of Castle Rock has an official UGB. The UGB areas shown for Kelso,
Woodland, and Kalama are for general planning purposes. Based on this
approach, County shorelines were divided into the following 10 assessment
units.
1- Columbia River
2- Lewis River
3- Kalama River
4- Cowlitz River
5- Mill, Abernathy, and Germany Creeks
6- South Fork Chehalis River
7- City of Castle Rock and UGB
8- City of Kalama and UGB
9- City of Kelso and UGB
10- City of Woodland and UGB
The assessment unit discussions and calculations do not include data for the
incorporated area of Longview, which is engaged in a separate SMP update
process.
3.3 Ecological Characterization
3.3.1 Data Sources, Assumptions, and Data Gaps
The following discussion identifies assumptions and limitations for each of the
inventory elements, and may provide a brief Countywide or watershed-wide

The Watershed Company and Parametrix May 2014
25
narrative where qualitative descriptions provide more information than
quantitative measures. Despite data gaps and limitations, a substantial quantity
of information is available for the shorelines of Cowlitz County to aid in the
development of the inventory and analysis report, as well as the shoreline master
program.
Impervious Surfaces
Impervious surface data was generated using NOAA’s C-CAP classification
(2006) of multispectral satellite imagery with 30x30-meter cell resolution. Given
the relatively broad spatial resolution of the data, in cases where only a portion
of cell coverage is impervious surface, the impervious surfaces may or may not
be detected. With this limitation in mind, a comparison of impervious surface
coverage among reaches provides useful information on broad scale spatial
trends in impervious surface coverage.
Vegetation
The countywide vegetation data was generated using multi-spectral satellite
imagery with 30x30-meter cell resolution. Spectral data was classified using
NOAA’s C-CAP classification. Maps of vegetative cover are found in
Appendices B and C (Land Cover). Similar to the impervious surface coverage,
the classification may over or under represent coverage when the type of
coverage within cells is mixed. Documented non-vegetated areas in shorelines
are open water, bare land, and perennial ice/snow. Because the ordinary high
water mark changes over time, particularly in large, dynamic river systems,
water is occasionally included within the total shoreline area used for the
calculation of vegetation coverage. Any area identified as “Water” was excluded
from the calculation of vegetation coverage.
The spatial resolution of the C-CAP data provides a good foundation for broad
scale assessment of vegetation coverage. Its utility is higher in rural areas where
vegetative cover is more uniform over broad areas compared to more developed
Urban Growth Areas. In order to provide a more accurate representation of
vegetative functions in incorporated cities and their UGBs, forested vegetation
within UGBs was identified by visual interpretation of satellite imagery. While
this data provides increased accuracy compared to the C-CAP data, visual
interpretation is confounded by the presence of shadows, which may result in a
slight overestimate of total forested area.

Cowlitz County Shoreline Analysis Report
26
Frequently Flooded Areas
For all practical purposes, “frequently flooded areas” are those areas within the
100-year floodplain. Floodplain and floodway maps were developed using
FEMA’s Q3 map for unincorporated Cowlitz County. FEMA released a
preliminary update to the digital Flood Insurance Rate Map (DFIRM) for Cowlitz
County in May of 2012, and the draft DFIRM map results in an expansion of
floodplain and floodway area compared to the presently adopted Q3 map. In
developing the draft DFIRM, FEMA concentrated its efforts in the populated
areas, thus the data is more accurate in the more highly developed areas such as
the cities. However, based on potential concerns about mapping in less densely
populated unincorporated areas, the County has contested the draft DFIRM
map, and, therefore, the draft DFIRM was not used to represent frequently
flooded areas in unincorporated areas of the County (including unincorporated
UGA areas). Within the incorporated cities, FEMA’s draft DFIRM data was
acceptable to the cities and used per the direction of city staff. When future
releases are available from FEMA the County will evaluate the area currently
using the Q3 data and will determine whether to adopt the new DFIRM
elevations at that time.
Channel Migration Zone
Channel Migration Zone data is not available for shorelines within Cowlitz
County. For the purpose of this analysis report, the 100-year floodplain data, as
described above, is being used as a proxy for the CMZ extent with the following
conditions per WAC 173-26-221(3)(b):
Within incorporated municipalities and urban growth areas:
o Where available data indicates areas separated from the active
river channel by legally existing artificial channel constraints that
limit channel movement, those areas are excluded from the
channel migration zone.
o All areas separated from the active channel by a legally existing
artificial structure(s) that is likely to restrain channel migration,
including transportation facilities, built above or constructed to
remain intact through the one hundred-year flood, will not be
considered to be in the channel migration zone.
In areas outside incorporated municipalities and urban growth areas,
channel constraints and flood control structures built below the one

The Watershed Company and Parametrix May 2014
27
hundred-year flood elevation do not necessarily restrict channel
migration and are included in the channel migration zone unless
demonstrated otherwise.
Where a visual spot check of aerial photos identifies historic migration
outside the floodplain, those areas are considered within the channel
migration zone. This is specific to the Toutle River where the sediment
plain is a clear expansion of the Q3 FEMA floodplain. The CMZ was
adjusted to expand to the outer edge of the sediment plain in the Toutle
River.
In general – we expect that this approach may slightly over-estimate the CMZ in
flatter lowland areas and slightly under-estimate the CMZ in high gradient
mountainous areas.
Wetlands
Wetland mapping was assembled from the National Wetlands Inventory (NWI).
Cowlitz County has not completed a County-wide inventory of potential
wetlands and therefore the NWI dataset is being used as the most relevant and
useful information. The NWI dataset was based on many factors, including soil
inventories and aerial interpretations. Although it is very comprehensive and is
fairly accurate in approximating wetland locations, it is acknowledged that many
wetlands, especially small wetlands, are not identified by NWI. Likewise, some
areas identified as NWI wetlands may not meet truly meet wetland criteria.
Additionally, some wetlands may have been filled and others created as
mitigation since the data was last updated. Whether or not they are captured by
this mapping effort, actual wetland conditions that may or may not be found on
a site will determine shoreline jurisdiction (as a potential shoreline associated
wetland) on a site-specific basis.
Soils
Soil data are derived from the Natural Resource Conservation Service (NRCS)
national soil survey. The Soils Survey Geographic (SSURGO) database was used
in the analysis of functions to characterize soil erodibility, ranging from slight to
very severe for off-road and off-trail uses. The survey also provides available
water supply within the first meter of soil depth, which is calculated as the total
volume of water in milliliters that should be available to vegetation when the soil
is at field capacity. Finally, the forest productivity index provides soil-based
information on the volume of wood fiber that is likely to be produced by the

Cowlitz County Shoreline Analysis Report
28
most important tree species. Each of these calculations is based on soil
characteristics, and not on climate or specific location, so the indices provide a
broad scale sense of soil characteristics, but they are not useful at a site scale, and
the actual conditions of a site may function differently than predicted by the
indices based on actual rainfall, aspect and location.
Geologically Hazardous Areas
Maps of geologically hazardous areas were developed using WDNR data.
Presumably, WDNR based those designations on topographic information and
soil types as catalogued by the Natural Resources Conservation Service (NRCS).
The presence of geologically hazardous areas in shorelines can be a factor in
determining suitability of the area for certain activities, including restoration and
development. Human safety is an important concern for development in
geologically hazardous areas. In addition, geologically hazardous areas can be
important sources of large woody debris and sediment to the aquatic system, the
latter to the benefit or detriment of aquatic life.
Fish and Wildlife Habitat Conservation Areas
WDFW Priority Habitat and Species maps are presented as three separate units:
Habitat Regions (species or habitat ranges by area), Habitat Species (precise
species locations; and Fish (fish species location by waterbody and extent
presence upstream).
These maps do not capture every priority species location or habitat in shoreline
jurisdiction, particularly rare species or species that use the water for foraging
and drinking, but that nest or den farther from the shoreline. Absence of
mapping information does not indicate that a particular species does not or could
not utilize the shoreline or adjacent lands. Furthermore, the number of
documented species may reflect the relative amount of past survey efforts rather
than the presence or absence of suitable habitat.
Shoreline Modifications
Shoreline modifications are human-caused alterations to the natural water’s
edge. The most common types of shoreline modifications include overwater
structures and shoreline armoring.
The Washington Department of Natural Resources (DNR) has digitized piers and
other in-water structures such as boatlifts, boathouses, and moorage covers for

The Watershed Company and Parametrix May 2014
29
some waterbodies, such as Silver Lake. However, some waterbodies, such as
Horseshoe Lake, have not been included in this dataset.
Although not technically overwater structures, boat ramps are also included in
the DNR dataset for overwater structures. The dataset does not differentiate
between each of these various types of overwater structures; therefore, reporting
of overwater cover encompasses more than just piers, docks, and floats.
Countywide data were not available for shoreline stabilization in Cowlitz
County. However, data from the Department of Ecology does identify the
locations of levees.
For the purpose of the shoreline analysis, but not included in the shoreline
inventory maps the proportion of shoreline stabilization and the presence and
type of overwater structures was estimated on a parcel by parcel basis within
UGAs using visual interpretation of aerial photography. Such estimates are
likely to underestimate total shoreline stabilization, particularly bioengineered
shoreline stabilization measures that are not apparent from an overhead aerial
view. Estimates of overwater structures do not include bridges, and results will
also likely underestimate the actual number of structures because some
structures may be obscured by tree cover or have been installed more recently
that the aerial photograph.
Water Quality
As a requirement of Section 303(d) of the federal Clean Water Act that all
waterbodies be “fishable and swimmable,” Ecology classifies waterbodies into
five categories:
Category 1: Meets tested standards,
Category 2: Waters of concern,
Category 3: No data,
Category 4: polluted waters that do not require a TMDL, and
Category 5: polluted waters requiring a TMDL.
Individual waterbodies are assigned to particular “beneficial uses” (public water
supply; protection for fish, shellfish, and wildlife; recreational, agricultural,
industrial, navigational and aesthetic purposes). Waterbodies must meet certain
numeric and narrative water quality criteria established to protect each of those
established beneficial uses. Waterbodies may provide more than one beneficial
use, and may have different levels of compliance with different criteria for those

Cowlitz County Shoreline Analysis Report
30
beneficial uses in different segments of the stream or lake. As a result, many
waterbodies may be on the 303(d) list for more than one parameter, and listings
may occur in several distinct reaches of a given waterbody.
As presented in the Water Quality map of Appendices B and C, only Category 4
and 5 waters are depicted. For more information on specific waterbodies and
their water quality classifications, Ecology provides an interactive on-line viewer
at the following website: http://apps.ecy.wa.gov/wqawa2008/viewer.htm.
Aquifer Recharge Areas
Aquifer recharge areas were mapped showing areas of moderate and sever
sensitivity. Mapped areas represent known areas of aquifer recharge, but areas
not identified as sensitive aquifer recharge areas may also have close
groundwater connections to aquifer areas.
3.3.2 Functional Evaluation Approach, Rationale and Limitations
A GIS-based quantitative method was developed to characterize the relative
performance of relevant watershed ecological processes and functions by
shoreline reach, as outlined in WAC 173-26-201(3)(d)(i). This assessment used
the available information gathered as part of the Shoreline Inventory and applied
a standardized ranking criterion for each independent shoreline reach to provide
a consistent methodological treatment among reaches. These numerical results
will ensure consistent and well-documented treatment of all reaches when
assessing existing ecological conditions and reduce observer bias associated with
the subjective assignment of ecological value. The numerical results are intended
to complement the inventory information in Chapters 3 and 4 and the brief
narrative discussions developed using the available data. Functional scores
should not be viewed as an absolute measure of existing ecological function.
Reach Delineation
In order to assess shoreline functions at a local scale, the ten assessment units
within the county were broken into discrete reaches based on a review of maps
and aerial photography. Initial breaks were made at city boundaries and UGBs.
The following methods were used to determine where to divide reaches when
city boundaries or UGBs generally parallel but are located landward of the
mapped OHWM. It should be noted that when a municipal boundary and
mapped extent of shoreline jurisdiction end at the OHWM, that jurisdiction’s
regulatory authority extends past the OHWM to the centerline of each lake and
river per RCW 35.21.160.

The Watershed Company and Parametrix May 2014
31
If no parcel is mapped waterward of a city’s boundary, the area
waterward of the city boundary to the centerline of the stream is included
in the City’s shoreline reach and jurisdiction and addressed in the
City/UGB assessment unit (See example in Figure 3-1).
If a mapped parcel occurs waterward of a city’s boundary and/or UGB
and landward of the OHWM, that area is included in the unincorporated
County assessment unit and is under the County’s jurisdiction and
included in the nearest County reach (See example in Figure 3-2).
Figure 3-1. Example of reach break scenario where no parcel is mapped waterward of the city/UGA boundary. In this case, lands to centerline of river are under the
City’s jurisdiction and included in the City reach.
City

Cowlitz County Shoreline Analysis Report
32
Figure 3-2. Example of reach break scenario where a mapped parcel occurs waterward of a city/UGA boundary and landward of the OHWM. In this case, lands to centerline of the river are under the County’s jurisdiction and included in the nearest
County reach.
Once divided by urban growth areas, and incorporated areas, the following
criteria were used to determine reach break locations for riverine and lacustrine
shorelines. Changes in land use patterns (e.g., adjacent land use patterns,
zoning, shoreline uses, and ownership) were weighted heavily in determining
reach break locations in recognition that the intensity and type of land use will
affect shoreline ecological conditions. Furthermore, functional analysis outcomes
will be more relevant for future determination of appropriate shoreline
environment designations if the reach breaks occur at likely transition points in
environment designations. In addition to land use, physical drivers of shoreline
processes were used to establish an overall framework for determining reach
break locations. Criteria for determining reach break locations are provided in
Table 3-2.
Table 3-2. Criteria for determining reach breaks.
Factors weighed in determining reach break
location Riverine Lacustrine 1 Changes in land use1 Changes in land use1
2 Changes in vegetation (coverage and type) Significant wetland areas2
3 Significant wetland areas2 Stream/River confluences
County
City

The Watershed Company and Parametrix May 2014
33
Factors weighed in determining reach break
location Riverine Lacustrine
4 Changes in channel confinement, slope, and upland topography
Changes in vegetation (coverage and type)
5 Tributary confluences Changes in topography 6 Artificial barriers (levees, dikes)
1 Reach breaks are generally identified at the nearest parcel boundary, except with large parcels, where physical or ecological factors changed notably within a single parcel.
2 In general, reach breaks are positioned to avoid dividing large wetlands.
Maps of reach breaks throughout the county are provided in Appendices B and
C. As the Shoreline Master Program Update moves forward for each
jurisdiction, reaches may need to be consolidated or split further based on
additional reach specific information. Additionally, jurisdictions may choose to
rename reaches for implementation purposes. As such, shoreline reaches in
adopted Shoreline Master Programs may not be equal to those in this report. A
summary of the number of reaches in each assessment unit is provided in Table
3-3.
Table 3-3. Summary of reaches per assessment unit.
Assessment unit Number of Reaches Columbia River 35 Lewis River 55 Kalama River 46 Cowlitz River 127 Mill, Abernathy, Germany Creeks 22 South Fork Chehalis River 1 City of Castle Rock and UGA 12 City of Kalama and UGA 11 City of Kelso and UGA 25 City of Woodland and UGA 6
Functions and Impairments
The analysis of reach functions was based on the four major function categories
identified in the Department of Ecology’s guidelines: hydrologic, hyporheic,
shoreline vegetation, and habitat. The four primary functional categories were
further broken down into relevant functions which were used to evaluate reach
performance (Table 3-4). A description of these functions as well as noting areas
of typical human disturbance are listed in Table 3-5.

Cowlitz County Shoreline Analysis Report
34
Table 3-4. Key shoreline ecological functions evaluated.
Ecological Functions 1. Hydrologic Functions Erosion processes Transport of water and sediment Attenuating flow/wave energy Development of pools riffles, gravel bars, and off-channel habitat 2. Hyporheic Functions Removing excess nutrients and toxic compounds Water storage Support of vegetation Maintenance of base flows 3. Vegetative Functions Temperature regulation Provision of LWD and other organic matter Filtering excess nutrients, fine sediment, and toxic substances Slowing riverbank erosion; bank stabilization Attenuating flow/wave energy 4. Habitat Functions Wetland and riparian habitat Physical space and conditions for life history
Priority habitat regions and species Food production and delivery
Shoreline vegetation Terrestrial subsidies to the aquatic environment
Hyporheic functions are generally dependent on directional flow, and therefore,
hyporheic functions are less meaningful in lake environments. For these reasons,
hyporheic functions were not evaluated for lake shorelines.
The available information gathered County-wide in the Shoreline Inventory was
used to determine the performance and relative rank score of these functions.
Assessment of each function using this approach is based upon quantitative data
results derived from the GIS inventory information described in Chapter 3.

The Watershed Company and Parametrix May 2014
35
Table 3-5. Description of shoreline functions and common sources of human disturbance.
Hydrology Hyporheic Habitat Vegetative Erosion Processes Sediment transport is an integral process to building and maintaining instream habitat features. Metered sediment delivery typically occurs through bank erosion, landslides, and bedload transport. In Cowlitz County, the eruption of Mount St. Helens introduced massive quantities of sediment to many basins and watersheds.
Transport of Water and Sediment Transport of water and sediment in streams is controlled by local climate, geology, basin topography, land cover, and ocean climate patterns. Stream hydrology is closely related to the proportion of native vegetation in a watershed and the amount of impervious surface.
Wave and Flow Attenuation Floodplain areas provide a transition between upland and riverine or lacustrine habitats. Vegetated floodplains help slow and disperse flood flows. The extent to which local conditions affect flow is related to the position of a reach within a watershed and the size of the floodplain or wetland area relative to watershed size.
Development of Pools, Riffles, Gravel Bars, and Off-Channel Habitats Channel form, including meander formation and floodplain development affects the distribution and dimensions of aquatic habitats, such as pools and riffles. Large woody debris (LWD) recruitment from mature tree cover influences stream channel morphology and habitat complexity. Accumulations of LWD affect bank stability, scour, bar formation, and may also induce rapid channel adjustments and assists in pool formation. Mid-channel islands and off-channel habitats provide important high-flow refugia for fish and wildlife.
Removing Excess Nutrients Within shallow alluvial soils adjacent to streams, nutrients and toxic compounds may be filtered or removed by uptake, especially in floodplain areas.
Water storage Storage of peak flows is provided by floodplains, off channel areas and large wetland complexes; these features serve to reduce peak flows and contribute to summer low flows.
Support of Vegetation Hyporheic flow helps support broad forested floodplains. Maintenance of Base Flows Groundwater from shallow aquifers is often a substantial component of base flows in low-precipitation periods. The mixing of surface and groundwaters that occurs in the hyporheic zone also helps moderate stream temperatures.
Wetland/Riparian Habitats A nearly continuous riparian zone is the typical natural condition in the Pacific Northwest. Larger and wider riparian communities tend to have more complex vegetation communities and more habitat types. Wetlands adjacent to streams provide an important habitat niche for a variety of species, particularly amphibians.
Shoreline Vegetation Native forests filter upland pollutants, control hydrologic characteristics, and provide habitat for fish and wildlife. Shading and microclimate effects from riparian forest cover helps maintain cool water temperatures suitable for native fish.
Priority Habitats and Species Some areas support important or rare species assemblages or habitat features that require an elevated level of protection to ensure that these natural features are conserved.
Physical Space for Life History Many aquatic species, including some species of salmon, rely heavily on off–channel areas, for rearing. Riparian forested habitats are particularly important for breeding, foraging, and rearing of many terrestrial species. Landscape connectivity, both longitudinal (up- and downstream) and lateral (from aquatic to upland, terrestrial zones), is a critical component of habitat functions.
Shade Riparian vegetation helps maintain cool water temperatures through provision of shade and creation of a cool and humid microclimate over the stream.
LWD/Organic inputs Riparian vegetation provides a source of large woody debris recruitment, and provides organic matter which is important to the ecosystem in the form of leaves, branches, and terrestrial insects.
Removing Excess Nutrients Densely vegetated areas encourage infiltration of surface water. Nutrients and contaminants in subsurface water are filtered out of the soil and taken up by the roots of plants.
Shoreline Stabilization The root structure of woody vegetation stabilizes shoreline soils and prevents excessive erosion.

Cowlitz County Shoreline Analysis Report
36
Sources of human disturbance Armored shorelines prevent natural erosion and sediment delivery processes. Shoreline armoring can accelerate erosion of adjacent properties and eliminate shoreline complexity.
Steep areas with highly erodible soils are particularly sensitive to destabilization and excessive erosion when vegetation is removed. Excess erosion of fine sediments fills pools and eliminates suitable spawning substrate.
Loss of mature native forests and wetlands affects the timing, rate, magnitude, and duration of stream flows. An increase in impervious surfaces results in increased frequency and intensity of flooding. Changes in flow volume or frequency can alter channel morphology and the sediment balance of the stream.
Dam regulation affects the timing, duration, and frequency of flood events, as well as sediment transport.
Impervious surfaces reduce infiltration, increasing surface flows. The net result is a reduction in shallow groundwater and hyporheic flows capable of maintaining summer low flows in streams and rivers.
Levees that limit channel migration and floodplain area also restrict hyporheic activity.
Loss of mature native forests and wetlands limits the availability of suitable habitat for aquatic and terrestrial species. Impervious surfaces lead to higher stream erosion rates, increases in sedimentation, and changes in substrate. Excessive fine sediment delivered to channels can suffocate salmonid eggs, inhibit emergence of fry from gravels, decrease feeding success, increase physiological stress, and through adsorption, may facilitate the transport and persistence of chemical contaminants.
Clearing of LWD for agriculture or urban development limits channel complexity. Roads and upland development limit lateral habitat connectivity.
Dams interrupt longitudinal habitat connectivity. Interruption of sediment sources from dams may interrupt the normal process of streambank erosion and deposition, which create diversity in channel form and suitable instream habitat function. Substrate removal through dredging of depositional areas such as deltas may limit the development of instream and upland habitat features. In water structures interrupt the longitudinal flow of sediment and alter habitat associations.
Clearing and grading for development often results in the removal of significant vegetation. Impervious surfaces related to roadways, driveways and parking areas tend to produce hydrocarbon pollutants and heavy metals. Depending on management activities, even pervious surfaces such as lawns and pastures can substantially increase nutrients from fertilizers and pollutants and toxins through herbicides and pesticides.
Armored shorelines can isolate the river or lake from potential sources of large woody debris recruitment.

The Watershed Company and Parametrix May 2014
37
For each of the parameters used in the function assessment, the quantitative data
was sorted into five categories, with 1 representing “low” function and 5
representing “high” function (e.g., vegetation coverage 0-5% = 1, >5-25% = 2, >25-
50% = 3, >50-75=4, and >75% = 5). The sorting of quantitative data into scoring
categories was based on best professional judgment related to known impacts of
different parameters and distribution of data. Tables 3-6 and 3-7 provide a
description of the metrics and how each data layer contributed to each functional
score; a full list of scores for each function is provided in Appendix F.
Once scores were assigned to each function, they were averaged for each of the
four major functional categories. The mean of each major function was
calculated to provide a simple standardized tool useful for inter-reach functional
comparison. The functional score is derived from a standardized numerical
process that formalizes and enables a basis for comparison of ecological
functions among reaches.

Cowlitz County Shoreline Analysis Report
38
This page intentionally left blank.

The Watershed Company and Parametrix May 2014
39
Table 3-6. Summary of functional scoring approach.
Category Data
Hydrologic Hyporheic (Riverine Only) Habitat Vegetative
Mod
erat
ed S
edim
ent
Del
iver
y
Tran
spor
t of s
edim
ent
and
wat
er (r
iver
ine
only
)
Wav
e an
d/or
flow
at
tenu
atio
n
Dev
elop
men
t of p
ools
, rif
fles,
gra
vel b
ars,
off-
chan
nel h
abita
ts
(riv
erin
e on
ly)
Rem
ove
exce
ss
nutr
ient
s an
d to
xic
com
poun
ds
Wat
er s
tora
ge
Supp
ort o
f veg
etat
ion
Sedi
men
t sto
rage
and
m
aint
enan
ce o
f bas
e flo
ws
Wet
land
/ripa
rian
habi
tat
Shor
elin
e ve
geta
tion
Dire
ct s
hore
line
alte
ratio
ns
Prio
rity
habi
tats
/spe
cies
Phys
ical
Spa
ce a
nd
cond
ition
s fo
r Life
H
isto
ry
Shad
e (te
mpe
ratu
re
regu
latio
n)
LWD
and
oth
er o
rgan
ic
recr
uitm
ent
Abi
lity
to re
mov
e nu
trie
nts,
fine
sed
imen
t, an
d to
xic
subs
tanc
es
Shor
elin
e so
il st
abili
zatio
n
Wav
e/flo
w a
ttenu
atio
n
Method to summarize metrics into a functional score If levees or locks present, 1, else
average of values
Value, except that mid-channel
islands score 5 Average of metrics
Max value Value Average of scores Value Average of scores
If levee present, 1, else average
Hydro features
Floodplain % Area X (riverine) X X X X X X
Area of wetlands % Area X Floodway % Area
Habitat
Priority habitat regions % Area X Priority species- Terrestrial #/reach X Priority species- Aquatic and Fish Distribution
#/reach X
Alterations
Overwater structures #/reach X
Levees Presence/ Absence X X X X X
303d listings - by Category 5,4,2,1 Highest
category in reach
Vegetation
Vegetation - total vegetation not including developed, cultivated, or bare (CCAP) % Area
% within floodplain (riverine)
% within
floodplain X X X % within
floodplain
Vegetation -% evergreen forest (CCAP) % Area X Vegetation - CCAP upland tree/forest cover for County; digitized tree cover data for UGAs
% Area X
Vegetation - % CCAP tree/shrub for County; digitized tree cover data for UGAs
% Area X X X X
Soils, geology,
topography
Soils - Erosion Hazard Severely or Very Severely Erodible % Area X X
Soils- Erosion Hazard Slightly Erodible % Area X
Soils - Available Water Supply (0-100cm) Average
AWS X
Soils - Forest Productivity Cubic ft/Acre/Yr
X

Cowlitz County Shoreline Analysis Report
40
Category Data
Hydrologic Hyporheic (Riverine Only) Habitat Vegetative
Mod
erat
ed S
edim
ent
Del
iver
y
Tran
spor
t of s
edim
ent
and
wat
er (r
iver
ine
only
)
Wav
e an
d/or
flow
at
tenu
atio
n
Dev
elop
men
t of p
ools
, rif
fles,
gra
vel b
ars,
off-
chan
nel h
abita
ts
(riv
erin
e on
ly)
Rem
ove
exce
ss
nutr
ient
s an
d to
xic
com
poun
ds
Wat
er s
tora
ge
Supp
ort o
f veg
etat
ion
Sedi
men
t sto
rage
and
m
aint
enan
ce o
f bas
e flo
ws
Wet
land
/ripa
rian
habi
tat
Shor
elin
e ve
geta
tion
Dire
ct s
hore
line
alte
ratio
ns
Prio
rity
habi
tats
/spe
cies
Phys
ical
Spa
ce a
nd
cond
ition
s fo
r Life
H
isto
ry
Shad
e (te
mpe
ratu
re
regu
latio
n)
LWD
and
oth
er o
rgan
ic
recr
uitm
ent
Abi
lity
to re
mov
e nu
trie
nts,
fine
sed
imen
t, an
d to
xic
subs
tanc
es
Shor
elin
e so
il st
abili
zatio
n
Wav
e/flo
w a
ttenu
atio
n
Method to summarize metrics into a functional score If levees or locks present, 1, else
average of values
Value, except that mid-channel
islands score 5 Average of metrics
Max value Value Average of scores Value Average of scores
If levee present, 1, else average
Geology- Quaternary alluvium % Area X
Slope <15% % Area X
(Reverse scoring)
X
Slope >40% % Area X

The Watershed Company and Parametrix May 2014
41
Table 3-7. Functional score ranking by indicator metric.
Indicator Metric Unit of Measure
Ranking score
1 2 3 4 5
Floodplain % Area 0-5 5-25 25-50 50-75 75-100
Area of wetlands % Area 0-5 5-25 25-50 50-75 75-100
Floodway % Area 0-5 5-25 26-50 50-75 76-100
Priority habitat areas % Area 0-5 5-25 25-50 50-75 75-100
Priority species- Terrestrial #/reach 0 NA 1-2 NA 3+
Fish and Priority species- Aquatic #/reach 0 1-3 4-6 7-9 10+
Overwater structures #/reach 6+ NA 1-5 NA 0
Levees Presence/ Absence
Present NA NA NA NA
303d listings - by Category 5,4,2,1
Highest category in reach
5 4 NA 2 1
Vegetation – total not including developed, cultivated, or bare
% Area 0-10 10-25 25-50 50-75 75-100
Vegetation – conifer % Area 0-10 10-25 25-50 50-75 75-100 Vegetation – upland (tree/forest cover)
% Area 0-5 5-25 25-50 50-75 75-100
Vegetation – tree/shrub % Area 0-10 10-25 25-50 50-75 75-100 Soils – Highly Erodible % Area 80-100 60-80 40-60 20-40 0-20 Soils – Slightly Erodible % Area 0-20 20-40 40-60 60-80 80-100 Soils – Available Water Supply (AWS)
Average AWS 0-7.54 7.54-11.71
11.71-16.39
16.39-23.99
23.99+
Soils – Forest Productivity Index
Cubic ft/Acre/Yr 0-86 86-114 114-143 143-172 172+
Geology – Quaternary alluvium and Quaternary younger alluvium
% Area 0-20 21-40 41-60 61-80 81-100
Slope <15% % Area 0-20 20-40 40-60 60-80 80-100 Slope >40% % Area 30+ 20-30 10-20 5-10 0-5
Within UGAs, additional data was collected using assessor data and analysis of
aerial photography to calculate average parcel size, width, depth, setback width of
the primary structure, average width of shoreline vegetated area, and vegetative
density of the shoreline vegetated area. The setback was measured from the
primary structure to the OHWM of the waterbody. The average depth of vegetated
area was also measured. In many cases, the average depth of vegetated area was
measured as a greater distance than the recorded setback. This would come up in a
parcel where a house or structure in a large tax lot would have vegetation
surrounding the building. An estimate of vegetative condition was assigned on a

Cowlitz County Regional Shoreline Analysis Report
42
parcel-by-parcel basis using a simple scale from 1 to 5, 1 being no vegetation to 5
being majority vegetated with some structure other than all grass. The metrics were
averaged for all parcels within a reach to provide an overall characterization of the
reach.
Limitations
This evaluation was limited by the quality and availability of inventory data.
Therefore, limitations presented in Section 3.1 also apply to this evaluation.
The evaluation approach did not take into account that some areas naturally may
function “lower” or “higher” than others, not because of any anthropogenic
alteration or natural disturbance, but simply because of the combined effects of a
particular locale’s geology, aspect, or topography. For example, many functions
operate “better” in this evaluation approach when there is a floodplain to capture
sediments or store water, but there are a number of drainages in steep areas that do
not have floodplains. This results in some areas with developed floodplains scoring
as well as undeveloped reaches in steeper areas in an assessment unit.
Nevertheless, despite this limitation, average scores for functional categories in
areas with similar topography and channel confinement are generally consistent
with the intuitive hypothesis that more highly developed areas score lower than
areas that are generally less altered or protected under public ownership and
established management plans.
In evaluating shoreline functions, the area of shoreline impacts and conditions
assessed was generally limited to the area of shoreline jurisdiction. In many cases,
shoreline impacts may occur at a site due to ecological and geomorphological
processes that are disturbed at a remote site upstream, further inland, or up-
current. This evaluation approach may not identify all of the functional responses
occurring as a result of impacts to upstream or nearby areas.
The approach does not weigh shoreline ecological potential with the opportunity to
perform a given function based on site-specific conditions. For example, the
analysis assessed the ability of a shoreline to store water, but it did not consider the
frequency of flooding downstream and the corresponding significance of such a
function.
Finally, the ordinary high water mark (OHWM) used in the analysis is not an
accurate, surveyed line; therefore, it occasionally is located waterward of the actual
ordinary high water mark. In highly dynamic, braided reaches like the South Fork

The Watershed Company and Parametrix May 2014
43
Toutle River, the mapped OHWM may not correspond with the presently existing
channel location. The analysis in these reaches may underestimate water and
sediment storage functions.
3.3.3 Restoration Opportunities
Potential restoration opportunities were identified based on input from Cowlitz
County and the participating cities and existing restoration planning document
recommendations including the Lower Columbia Salmon Recovery and Fish and
Wildlife Subbasin Plan (LCFRB 2010), the Salmon and Steelhead Limiting Factors
Reports, the Habitat Work Schedule (hws.ekosystem.us), and other salmon
recovery lead entity planning documents. Many of these restoration planning
documents include protection of intact functions and processes as an integral
component to restoration planning. Therefore, although protection is distinct from
restoration at the site level, restoration opportunities presented in this document
also include opportunities to protect high functioning areas.
In many cases, the LCFRB recommendations apply broadly to watershed areas (for
example, “Protect existing rearing habitat to ensure no further degradation.”). In
this case, the functional analysis in this report can be used to identify high
functioning areas that could benefit from protection (through regulatory or
voluntary measures), as well as low to moderately functioning areas that may
benefit from restoration actions.
Restoration opportunities are not limited to those identified in this report, and
restoration opportunities will be pursued further in the Shoreline Restoration Plan.
3.4 Land Use Characterization This shoreline inventory reviews current and planned land use within shoreline
jurisdiction to provide a basis to establish a compatible use pattern over the 20-year
planning period of the SMP and to identify current or planned preferred uses in
shoreline jurisdiction that should be protected or promoted to meet SMA goals for
water-oriented uses, shoreline access, and ecological protection.
The SMA promotes the following use preferences (RCW 90.58.020) for shorelines of
statewide significance (identified in Section 1.2) in the stated order:
1. Recognize and protect the statewide interest over local interest;
2. Preserve the natural character of the shoreline;
3. Result in long term over short term benefit;

Cowlitz County Regional Shoreline Analysis Report
44
4. Protect the resources and ecology of the shoreline;
5. Increase public access to publicly owned areas of the shorelines;
6. Increase recreational opportunities for the public in the shoreline;
7. Provide for any other element as defined in RCW 90.58.100 deemed
appropriate or necessary.
For all other shorelines of the state, the following use preferences apply:
1. Reserve appropriate areas for protecting and restoring ecological functions
to control pollution and prevent damage to the natural environment and
public health. In reserving areas, local governments should consider areas
that are ecologically intact from the uplands through the aquatic zone of the
area, aquatic areas that adjoin permanently protected uplands, and
tidelands in public ownership. Local governments should ensure that these
areas are reserved consistent with constitutional limits.
2. Reserve shoreline areas for water-dependent and associated water-related
uses. Harbor areas, established pursuant to Article XV of the state
Constitution, and other areas that have reasonable commercial navigational
accessibility and necessary support facilities, such as transportation and
utilities, should be reserved for water-dependent and water-related uses
that are associated with commercial navigation unless the local
governments can demonstrate that adequate shoreline is reserved for future
water-dependent and water-related uses and unless protection of the
existing natural resource values of such areas preclude such uses. Local
governments may prepare master program provisions to allow mixed-use
developments that include and support water-dependent uses and address
specific conditions that affect water-dependent uses.
3. Reserve shoreline areas for other water-related and water-enjoyment uses
that are compatible with ecological protection and restoration objectives.
4. Locate single-family residential uses where they are appropriate and can be
developed without significant impact to ecological functions or
displacement of water-dependent uses.
5. Limit nonwater-oriented uses to those locations where the above described
uses are inappropriate or where nonwater-oriented uses demonstrably
contribute to the objectives of the Shoreline Management Act [WAC 173-26-
201(2)(d)(v)].

The Watershed Company and Parametrix May 2014
45
3.4.1 Data Sources, Assumptions, and Data Gaps
Current Land Use
Existing land use information provides a baseline understanding of land use
intensity, character, and land cover found within the shoreline jurisdiction.
Existing land use data for Cowlitz County shoreline jurisdiction was obtained from
Cowlitz County’s parcel data. County land use types were aggregated into broader
land use categories for the purpose of conveying information relevant to the
Shoreline Management Act priorities, including single-family residential and water-
dependent uses. Aggregated land use categories include the following:
single-family residential,
multi-family residential,
commercial,
industrial,
undeveloped,
railroad,
airport,
right-of-way,
ports,
auto parking,
diking right-of-way,
public/education/assembly
church,
open space,
agriculture,
fishing activities,
forestland, and
other.

Cowlitz County Shoreline Analysis Report
46
Parcels not characterized as resource lands (open space, agriculture, forestland,
fishing activities, or other land use not associated with likely future
development), nor publicly held and with an assessed improvement value of less
than $10,000 were identified as vacant. Lands in PacifiCorp ownership were also
excluded from the vacant lands assessment. These parcels provide an indication
of the distribution of potentially developable areas within the County.
Current Land Use information is presented in Figure 2, Appendices B and C.
Zoning
Cowlitz County
The most current County zoning data is not available in GIS format, a scanned
copy of the official County zoning map is included in the map folio.
The County’s zoned areas include three basic types of zoning districts.
Residential zoning districts are intended primarily to preserve and
protect housing and related developments and activities.
Commercial zoning districts are areas set aside mainly for retail trade,
services, and business activity.
Industrial zoning districts are reserved for manufacturing, assembly,
processing, and related activities.
City of Castle Rock
Zoning districts within the City of Castle Rock include:
Low-density Residential
High Density Residential
Highway Business
Retail Business
Mixed Use Commercial/Industrial
Industrial
Parks, Recreation, and Open Space
City of Kalama
A description of zoning designations from the City of Kalama Municipal Code
(CKMC 17.16.010) is provided in Table 3-8 below.

The Watershed Company and Parametrix May 2014
47
Table 3-8. Zoning designations in the City of Kalama.
Description Symbol Typical Uses Low-density residential district
R-1 Single family dwellings and associated public and quasi-public uses.
High density residential district
R-2 Single family, two family, triplexes and associated public and quasi-public uses per Section 17.22.020(B).
Medium density residential district
R-3 Four-plexes, multi-family apartments, boarding houses, etc., and associated public and quasi-public uses per Section 17.24.020(C).
Central business district C-1 Retail activities, motels, service stations, etc. Highway Commercial C-2 Regional commercial centers, automobile-oriented services, and
manufacturing uses. Industrial district I-1 Manufacturing, warehousing, and wholesale sales. Recreational district Rec. Areas devoted to facilities and equipment for recreational
purposes such as swimming, playgrounds, marinas, parks, and other similar uses.
Residential district for mobile homes
R--MH Single family and associated public and quasi-public uses.
Single-family large lot R-1(LL) Single-family dwellings; agricultural and forestry activities and limited public and quasi-public uses per Section 17.21.020(E). Large-lot estates are limited to the R-1 zone only.
Single-family small lot SF-SL Single-family dwellings, and associated public and quasi-public uses per Section 17.20.030(B) on small lot less than the standard lot size assigned the underlying residential zone, subject to site plan approval, allowable in all residential zones.
City of Kelso
A description of zoning designations in the City of Kelso Municipal Code is
provided below (CKMC 17.20.020).
RSF-15, residential single-family 15 zone allows fifteen-thousand-square-
foot minimum lot area per dwelling unit at a maximum density of
approximately three units per acre;
RSF-10, residential single-family 10 zone allows ten-thousand-square-foot
minimum lot area per dwelling unit at a maximum density of
approximately four units per acre;
RSF-5, residential single-family 5 zone allows five-thousand-square-foot
minimum lot area per dwelling unit at a maximum density of
approximately eight units per acre;
RMF, residential multifamily zone allows one-thousand-three-hundred-
fifty-square-foot minimum lot area per dwelling unit at a maximum
density of approximately thirty-two units per acre;
OPN, open space zone;

Cowlitz County Shoreline Analysis Report
48
CTC, town center commercial zone;
CWK, west Kelso commercial zone;
CNH, neighborhood service center commercial zone;
CSR, specialty retail and services commercial zone;
CMR, major retail commercial zone;
ILM, light manufacturing industrial zone;
IGM, general manufacturing industrial zone;
PO, airport overlay zone;
DDO, downtown design guidelines overlay zone
City of Woodland
Zoning designations in the City of Woodland are identified in Woodland
Municipal Code (WMC 17.12.010), reproduced in the Table 3-9 below.
Table 3-9. Zoning designations in the City of Woodland.
Code Zoning Designation
LDR Low-density residential districts (LDR-6, LDR-7.2, LDR-8.5, LDR-10
MDR Medium density multifamily residential district
HDR High density multifamily residential district
FW Floodway use district
C-1 Central business district
C-2 Highway commercial use district
C-3 Neighborhood commercial use district
I-1 Light industrial use district
I-2 Heavy industrial use district
Comprehensive Plan
Comprehensive Plan data provides a source of information on future land use
changes on a broad scale basis. Future land use categories are based on
Comprehensive Plan designations and are reported in distinct locally adopted
categories. Future land use data is based on area-wide classifications, which
includes roads and other features in the coverage area; this tends to make the
calculated proportional coverage of future land use areas seem greater than
existing land use area calculations for the same area.
The Comprehensive Plan establishes the overall direction and guidance for
location of future growth in the County and cities. It does this, in part, through
establishing land use designations which are applied to property throughout the

The Watershed Company and Parametrix May 2014
49
County that describe the types of uses that can occur on these properties. The
Comprehensive Plans for the Cities of Castle Rock and Woodland apply to lands
within city limits, as well as to lands outside of the adopted city limits, but
within the UGA.
Cowlitz County
The County is presently undergoing an update of its Comprehensive Plan.
Existing comprehensive plan data is not available in electronic format; rather the
official comprehensive plan map is a paper copy that was scanned and included
in Appendix D. A draft comprehensive plan map is expected in February 2014;
at that time, the new plan and map data will be referenced in developing SMP
environment designations, policies, and regulations.
City of Castle Rock, City of Kalama. City of Kelso, City of Woodland
Comprehensive plan designations in the City of Castle Rock and the City of
Woodland reflect anticipated future land use in the city limits, as well as in
unincorporated areas in the Cities’ UGAs. Comprehensive plan designations in
the City of Kalama and the City of Kelso apply only within city limits.
Existing and Potential Shoreline Public Access
Existing, formally established recreational areas with shoreline public access are
identified in Chapter 5 of this document in the Existing and Potential Shoreline
Public Access sections and on Public Access Maps in Appendices B and C.
Recreational areas identified include those provided by local, state, and federal
government agencies, as well as private recreational areas that are open to the
general public.
Potential shoreline public access opportunities were principally gathered by
reviewing pertinent park and recreation planning documents (e.g. the Cowlitz
County Comprehensive Park Plan Update). However, the planning documents
reviewed did not cover the full range of park and recreation areas (e.g. a
planning document for WDFW Water Access Sites in Cowlitz County was
unavailable). Therefore, the sections on potential shoreline public access
opportunities may not include all future plans by from all stakeholders.
Water-oriented Uses
According to Ecology’s SMP Guidelines (173-26-020(41) WAC), “water-oriented
use means a use that is water-dependent, water-related, or water-enjoyment, or a
combination of such uses.” The Shoreline Management Act promotes uses that
are “unique to or dependent upon use of the state's shoreline” as well as “ports,

Cowlitz County Shoreline Analysis Report
50
shoreline recreational uses including but not limited to parks, marinas, piers, and
other improvements facilitating public access to shorelines of the state, industrial
and commercial developments which are particularly dependent on their
location on or use of the shorelines of the state and other development that will
provide an opportunity for substantial numbers of the people to enjoy the
shorelines of the state.” (RCW 90.58.020)
Definitions and examples of water-oriented uses are included in Table 3-10
below.
Table 3-10. Water-oriented uses definitions and examples.
Water-Oriented Use Definitions Examples "Water-dependent use" means a use or portion of a use which cannot exist in a location that is not adjacent to the water and which is dependent on the water by reason of the intrinsic nature of its operations. (WAC 173-26-020(39))
Examples of water-dependent uses may include marine terminals of ship cargo loading areas, ferry and passenger terminals, marinas, aquaculture, float plane facilities and sewer outfalls.
"Water-related use" means a use or portion of a use which is not intrinsically dependent on a waterfront location but whose economic viability is dependent upon a waterfront location because: (a) The use has a functional requirement for a waterfront location such as the arrival or shipment of materials by water or the need for large quantities of water; or (b) The use provides a necessary service supportive of the water-dependent uses and the proximity of the use to its customers makes its services less expensive and/or more convenient. (WAC 173-26-020 (43))
Examples of water-related uses may include warehousing of goods transported by water, seafood processing plants, hydroelectric generating plants, gravel storage when transported by barge, oil refineries where transport is by tanker, log storage, and potentially agriculture.
"Water-enjoyment use" means a recreational use or other use that facilitates public access to the shoreline as a primary characteristic of the use; or a use that provides for recreational use or aesthetic enjoyment of the shoreline for a substantial number of people as a general characteristic of the use and which through location, design, and operation ensures the public's ability to enjoy the physical and aesthetic qualities of the shoreline. In order to qualify as a water-enjoyment use, the use must be open to the general public and the shoreline-oriented space within the project must be devoted to the specific aspects of the use that fosters shoreline enjoyment. (WAC 173-26-020 (40))
Primary water-enjoyment uses may include, but are not limited to, parks, piers and other improvements facilitating public access to the shorelines of the state; and general water-enjoyment uses may include, but are not limited to restaurants, museums, aquariums, scientific/ecological reserves, and resorts/hotels.
The following current land use categories (from the categories mapped on
Appendices B and C, Figure 2, Current Land Use) are particularly likely to
include uses that meet the definition of water-oriented uses in Table 3-10:

The Watershed Company and Parametrix May 2014
51
Ports
Fishing Activities
Recreation
Industrial
Commercial
Transportation
However, a comprehensive inventory of water-oriented uses in the County could
not be assembled from available data sources. The major reason for this is that
whether a particular use meets the definition as “water-dependent,” “water-
related,” or “water-enjoyment” is not always immediately apparent and often
determined on a case-by-case basis. For example, a restaurant with an expansive
view of the Columbia River would likely qualify as a water-enjoyment use;
however, a restaurant with windows oriented towards a road would likely not
qualify.
Therefore, the Water-oriented Uses sections in Chapter 5 of this document
should not be considered comprehensive. These sections only selectively identify
certain water-oriented uses (either significant or more obvious). More
specifically, these sections identify only certain water-dependent and water-
related uses. Water-enjoyment uses are discussed in the sections titled Existing
and Potential Shoreline Public Access. A more thorough review of water-
oriented uses will be considered in the development of the SMP based on public
input.
Water-dependent and water-related uses were not mapped in the shoreline
inventory map folio; however, many water-enjoyment uses are shown on Public
Access maps in Appendices B and C.
Historical or Archaeological Sites
Historical sites that may fall within shoreline jurisdiction in Cowlitz County
(excluding the City of Longview) were identified using the Washington State
Department of Archaeology and Historic Preservation’s WISAARD searchable
cultural database.
3.4.2 Analysis of Future Land Use
Comparative Analysis of Current Land Use
A comparative analysis of land use data for the years 2002 and 2012 was
conducted in order to identify changes in land use type and intensity over a ten-
year period.

Cowlitz County Shoreline Analysis Report
52
Parcel data from 2002 and 2012 from the Cowlitz County Assessor’s Office
provided basic attributes for comparison, including parcel or tax identification
number, location, improvement value, and land use description. The
comparative analysis was based on attributes contained in the data and assigned
by the County Assessor. Each dataset is believed to be adequate to provide a
general snapshot of development conditions for each year.
Due to differences in the structure and attributes contained in each dataset,
minor adjustments were made in order to facilitate a direct comparison of land
use between years. Specific land use types for each year were aggregated into 20
general land use categories:
Unclassified
Airport
Auto Parking
Agriculture
Church
Commercial
Diking Right-of-Way
Fishing Activities
Forestland
Industrial
Multi-Family Residential
Open Space
Other
Ports
Public/Education/Assem
bly
Recreation
Single Family Residential
Transportation
Undeveloped Land
Utilities

The Watershed Company and Parametrix May 2014
53
Analysis was limited to the portion of each parcel occurring within shoreline jurisdiction
or potentially associated wetlands. Parcels were filtered and clipped by overlaying
digital geospatial data and grouped by shoreline assessment unit. To resolve
discrepancies in parcel geometry between the 2002 and 2012 datasets, records were
cross-referenced by tax id number, ensuring that each parcel would be assigned to the
same assessment unit across comparative years. Land use categories are presented by
assessment unit as percent of total acreage for each unit.
The total area of vacant lands was also calculated for 2002 and 2012 using the same
methodology as used in the Shoreline Inventory, where parcels not characterized as
resource lands (open space, agriculture, forestland, fishing activities, or other land use
not associated with likely future development), nor publicly held and with an assessed
improvement value of less than $10,000 were identified as vacant. Lands in PacifiCorp
ownership were also excluded from the vacant lands assessment.
Because the undeveloped land category is a land use type designated by the Assessor,
whereas vacant lands are lands outside of resource and publicly owned lands that fall
below a specific improvement value, it is possible to have disparate trends in
undeveloped and vacant lands.
Comparative analysis results are presented as the change in percent of total acreage
from 2002 to 2012. Due to changes in parcel shape and area, the total acreage of some
assessment units varied between the two analysis years by an average of 1.3 percent.
Permit History Data Analysis Methodology
A review of shoreline development permits previously issued by Cowlitz County was
undertaken in order to better understand the type and extent of recent development
actions occurring in the County, and to help anticipate future trends in shoreline land
use changes and shoreline modifications. The development permits reviewed were
limited to those issued between 2001 and 2011, the most recent ten-year period for which
data was available.
The permit history data provided by Cowlitz County for this purpose came in two basic
database formats. One database format had permits dating to the late 1970s and was
organized by permit type and waterbody. The other database format had permits from
the 2001 to 2011 time period and was organized by application year. While these two
databases had some overlap, they were not mutually inclusive. Therefore, the two

Cowlitz County Shoreline Analysis Report
54
databases were cross-referenced to assemble an all-inclusive permit database for the
time period from 2001 to 2011.
Permits were then classified by the type of shoreline use (e.g. residential, commercial) or
shoreline modification (e.g. bank stabilization, boat launch) permitted. Where a single
permit application involved multiple uses or modifications, a single permit was counted
in each applicable use or modification category. Permits were recorded by year the
permit was issued (not the application date). When the data did not state the year a
permit was issued, it was assumed that the permit was issued the same year as the
application.
Notably, the permit data reflect all permits issued in any area under the jurisdiction of
Cowlitz County, including unincorporated urban growth areas, at the time the permit
was issued. Therefore, permit data for unincorporated UGAs is reported in the permit
totals for the unincorporated County assessment units rather than the City assessment
units. It is also worth noting that shoreline exemptions are generally not captured in the
permit data. Therefore, no data on the type and extent of development actions exempt
from shoreline permits (such as single-family residential housing development or single-
family residential bulkhead construction) are available. Moreover, any unpermitted
development is not reflected in the data.
4 SUMMARY OF COUNTY ECOSYSTEM CONDITIONS
The Lower Columbia Salmon Recovery and Fish and Wildlife Subbasin Plan (LCFRB
2010) provides detailed descriptions of each of the watersheds and major subbasins
within Cowlitz County. The information presented below is drawn from this plan, with
additional information and details specific to Cowlitz County shorelines added where
applicable.
4.1 Climate The climate in Cowlitz County is typical of the West Coast marine areas with mild, wet
winters and warm, dry summers. Annual precipitation varies from 45 inches near Kelso
to over 150 inches on Mount Rainier, Adams, and St. Helens (Wade 2000a), and
precipitation is concentrated in the period between October and March. Snow and
freezing temperatures are common at higher elevations. Rain-on-snow events in
intermediate elevations can result in significant flooding events.

The Watershed Company and Parametrix May 2014
55
4.2 Geography, Topography, Geology, and Drainage Patterns Portions of four major watersheds are located within Cowlitz County, the Lewis
watershed, the Cowlitz Watershed, the Grays/Elochoman Watershed, and the Chehalis
Watershed. Generally, these watersheds are identified by the state as Water Resource
Inventory Areas (WRIA). A map of the WRIAs within Cowlitz County is provided in
Figure 4-1. Table 4-1 provides a summary of subbasins and WRIAs within Cowlitz
County, as well as anadromous salmonids associated with each basin. Priority wildlife
species and habitats in Cowlitz County are identified in Table 4-2, and rare plant species
in Cowlitz County are listed in Table 4-3. Note that not all listed species or habitats
necessarily occur within shoreline jurisdiction in the county.
Figure 4-1. Map of Water Resource Inventory Areas in Cowlitz County (Source:
Washington Department of Ecology, GIS Technical Services).
4.2.1 Columbia River
The Columbia River estuary was formed by the forces of glaciation, volcanism,
hydrology, and erosion and accretion of sediments. The Cascade mountain range was
formed 50 to 35 million years ago, at which time, uplift of the Rocky Mountains
combined with subduction of the oceanic plates of the Pacific Ocean, creating the flow

Cowlitz County Shoreline Analysis Report
56
path for the River (Simenstad et al. 2011). Subsequent glaciation restructured and
expanded the extent of the Columbia River basin (Simenstad et al. 2011). Near the end
of the last glacial period, the Missoula Floods shaped the physical landscape,
transporting and depositing silt, sand, and gravel that now form much of the landscape
in the Columbia River basin (Simenstad et al. 2011). Volcanism, lava flows, and lahars
occurring in the Holocene period, have contributed much of the bedload of the lower
Columbia River (Simenstad et al. 2011). Circulation of sediments and nutrients
throughout the lower river and estuary are driven by river hydrology and coastal
oceanography. Sea level rise since the late Pleistocene period has submerged river
channels and caused deposition of coarse and fine sands (Marriott et al. 2001), which
shape today’s shallow estuarine habitats.
The hydrology of the Columbia River Basin reflects the interaction of topography
geology, and climate. Most of the drainage of the Columbia River falls as snow in the
Rocky Mountains and in the Cascade Range (Simenstad et al. 2011). Annual peak
discharges occur in the spring (April to June), and generally result from snowmelt in the
interior subbasin. Historically, flood flows peaked at 1.2 million cfs (Simenstad et al.
2011). Today, as a result of dam regulation, the highest flows occur from April to June,
with discharge at the mouth of the river ranging from 100,000 to 500,000 cfs (Neal 1972,
Marriott et al. 2002). The lower basin, where precipitation generally occurs as rain,
contributes to peak winter discharges (Simenstad et al. 2011).
Within Cowlitz County, the Columbia River transitions from a confined valley to the
east into broad bottomlands to the west. The River includes large, mid-channel islands
with forested and scrub-shrub wetlands, distributary channels and sloughs, and
floodplains.
Tidal impacts in water level have been observed as far upstream as Bonneville Dam (RM
146) during low flow, reversal of river flow has been measured as far upstream as Oak
Point, west of Longview (RM 53) (LCFRB 2010). The mean daily tidal fluctuation is
approximately 3 feet in Cowlitz County near the City of Kelso (Johnson 2010). The
extent of saltwater intrusion is limited to the River downstream from Harrington Point
(RM 23) (LCFRB 2010).
4.2.2 Lewis River
The Lewis basin developed as a result of volcanic, glacial, and erosional processes.
Intermittent eruptions of Mt. St. Helens and Mt. Adams over the last 400,000 years have
provided volcanic material that has formed the Lewis River basin. More recent
pyroclastic flows and lahars have shaped the current landscape (LCFRB 2010). Steep

The Watershed Company and Parametrix May 2014
57
slopes resulting from glaciation, combined with the abundance of volcanic material,
have created a high potential for erosion throughout the basin (LCFRB 2010).
A series of three dams and three reservoirs, Lake Merwin, Yale Lake, and Swift
Reservoir, are located in the upper portion of the Lewis River Basin. Below Merwin
Dam, the Lewis River flows through a steep canyon for approximately 4 miles. The
lower twelve miles of River flow through a broad alluvial valley, where the River is
extensively channelized. Tidal influence extends to approximately RM 11 (LCFRB 2010).
Precipitation is primarily rainfall dominated, but much of the upper basin receives
abundant snowfall, and experiences rain-on-snow zone events. As a result, the basin is
subject to winter freshets and flooding, although dam operations moderate peak flows
(LCFRB 2010).
4.2.3 Kalama River
The topography of the upper subbasin is mountainous, leveling out in the lower eight
miles. The geology of the Kalama River subbasin have been extensively shaped by
volcanic activity of Mt. St. Helens in the last 20,000 years (USFS 1996 cited in Wade
2000b). Steep slopes and erodible material allow for the significant mass wasting
potential in the upper watershed (Wade 2000b). Keefe et al. (2004) summarized geologic
data presented in Washington Department of Natural Resource’s Geologic Map of
Washington – Southwest Quadrant (Walsh et al., 1987) as follows:
“The upper Kalama River flows through volcaniclastic deposits of pyroclastic
flows, lahars, and debris avalanches, from its headwaters downstream to below
Bush Creek near river mile (RM) 30 (Walsh et al. 1987). These deposits produce
fine sediments that are typically composed of fine to medium size grains. There
are isolated lahar areas distributed as patches throughout the middle Kalama
River section, containing mixtures of cobble and boulders supported by a matrix
of sand or mud.”
Merrill Lake formed when these lahar deposits from Mt. St. Helens blocked the historic
stream valley.
Keefe et al. (2004) go on to describe the geology of the Lower Kalama River Basin:
Between RM 30 and Marietta Falls, near RM 6, the mainstem flows through fine
grained igneous, Lower Oligocene to upper Eocene andesite flows. Most of the
tributaries to the Kalama River entering below upper Kalama Falls also flow
through the same fine grained igneous andesite flow material as the middle

Cowlitz County Shoreline Analysis Report
58
mainstem river (Walsh et al. 1987; Foster 1983). Below Marietta Falls, the Kalama
River flows through predominantly alluvial deposits containing sand and
gravel.”
Hydrology is driven by rainfall from fall through spring as only a small portion of the
basin is above the snowline. Tidal influence of the Columbia extends up to
approximately Modrow Bridge at RM 2.8 (Wade 2000b). Tidal elevations at the mouth
of the Kalama River vary from 6 to 14 feet (Powers and Tyler 2009).
4.2.4 Cowlitz Watershed
The Cowlitz River watershed originates in steep, volcanic peaks of Mount Rainier,
Mouth Saint Helens, and Mount Adams. The eastern part of the Cowlitz River valley is
located in the Cascade physiographic province, and it is characterized by a deeply cut
trough and flat bottomlands, and terraces (Wade 2000a). The river flows west through a
valley heavily influenced by alpine glaciers, where the river has moderate relief and
broad floodplain areas (Wade 2000a).
Wade (2000) described the geology of the Cowlitz Watershed as follows,
“During the Pleistocene (3 million years to 8,000 years ago) several alpine
glaciers moved down the Cowlitz River valley depositing till and outwash
(glacial river sand and gravel deposits). These glaciers, 1000 feet thick or more,
cut down into the former river channel and underlying bedrock (Coombs 1989 as
cited in Harza 1999c). At least six alpine glacial advances have been documented.
Glacial outwash sands and gravels form terraces in the vicinity of the Cowlitz
River and were deposited by streams from the melting alpine glaciers located up
the valley. Silt-loam loess, representing windblown glacial silt, blankets large
areas of the basin (Crandall and Miller 1974 as cited in Harza 1999c). The
thickness of the loess varies from a few feet to 20 feet.
Following deposition of the youngest glacial deposits, approximately 13,000 to
25,000 years ago, the Cowlitz River eroded and reworked the glacial deposits.
The resulting alluvial deposits range from coarse boulders to cobbly gravel to
fine sand and silty sand. Thick alluvium is generally confined to the area of the
immediate Cowlitz River flood plain (Harza 1999c).”
The 1980 eruption of Mt. St. Helens is an important factor in soil composition and
channel form. The Corps predicts that without dredging operations, the bed elevation of
the Cowlitz River will rise between 0 to 2 feet near the Toutle River confluence, and
between 3 to 5 feet in downstream areas (Corps 2002). A rise in water surface elevations

The Watershed Company and Parametrix May 2014
59
related to the sedimentation is expected to be approximately 1.5 feet downstream from
the Toutle River confluence (Corps 2002).
Soils derived from the volcanic deposits range from gravelly coarse sands to silt loams.
As a result of its geology and soils, the Cowlitz watershed is prone to potentially severe
erosion. In fact, 83 percent of the land in the watershed would be highly erodible if
vegetative cover was removed (Wade 2000a). Over 81 percent of the land with severe to
very severe erosion hazard is in commercial forest use (USSCS 1974 cited in Wade
2000a).
The hydrologic regime is driven by a mix of rainfall at lower elevations and snowmelt
from the headwaters. A few major tributaries drain glaciers on Cascade peaks and
contribute glacial meltwater during the summer months (Wade 2000a). The majority of
peak flows occur between November and February, as a result of winter rain or rain-on-
snow events.
Three major hydroelectric projects have been constructed on the mainstem Cowlitz
River. Cowlitz Falls Dam, Mossyrock Dam, and Mayfield Dam in Lewis County are
maintained for flood control and hydropower production. Mayfield Dam and
Mossyrock Dam are operated by Tacoma Power, and Cowlitz Falls Dam, a smaller, run-
of-the-river dam, is operated by Public Utility District No. 1 of Lewis County.
Historically, the portion of the stream inundated by the three reservoirs was made up of
a series of deep canyons. Today, dam operations limit the frequency and intensity of
flood flows and result in higher flows during the summer low-flow period. In
November 1997, an agreement was reached between Tacoma Power and the
Washington Department of Fish and Wildlife regarding flow operations intended to
protect salmon and steelhead resources in the lower Cowlitz mainstem.
The Toutle and Coweeman Rivers are unregulated, contributing to flow variability in
the lower Cowlitz River. The annual hydrograph of the Toutle River has been altered
since the Mt. St. Helens eruption, in part because sediment load in the river and its
floodplains reduced the capacity of the river, and in part because deforestation resulting
eruption reduced infiltration capacity, creating a flashier system (Tetra Tech 2007).
Silver Lake, the largest lake in Cowlitz County, was formed approximately 2,500 years
ago, when lahars from Mt. St. Helens blocked the drainage of Outlet Creek (Cowlitz
Conservation District 1994). A control structure was built in the 19070’s to moderate
seasonal fluctuations in the lake level and accommodate increasing development along
the Lake’s shorelines (Cowlitz Conservation District 1994).

Cowlitz County Shoreline Analysis Report
60
4.2.5 Mill, Abernathy, Germany Creeks
The Mill/Abernathy/Germany subbasin is a low elevation system with an average slope
of 21 percent (Wade 2002). The subbasin is comprised primarily of volcanic (85 percent)
and sedimentary and metamorphic rocks (13 percent) (Wade 2002). Given the lower
elevation of these watersheds, the hydrologic regime is driven by rainfall, with peak
flows occurring during winter months. Less than 10 percent of the watershed area is
within the rain-on-snow zone (Wade 2002). Wade (2002) provides a detailed description
of soils in the subbasin.
4.2.6 South Fork Chehalis River
Tectonic and glacial activity gave rise to the Chehalis River valley. During the
Pleistocene period, glacial drift from the Cascade and Olympic mountains and the Puget
lobe of the Cordilleran Ice Sheet drained to the ocean through the Chehalis River valley
(Gendazsek 2011). Recent alluvium overlies much of the glacial deposits (Gendazsek
2011).
The Chehalis River system is a low gradient, and therefore, slow moving river compared
to other large rivers in Washington State. Its headwaters drains four mountain ranges
(or hills), including the western side of the Willapa Hills, the Black Hills, the west side of
the Cascade Range, and the lower south slopes of the Olympic Range. As a result of the
low elevation headwaters, precipitation primarily falls in the form of rain, although
snowfall in the upper elevations of the watershed allows for floods relating to rain-on-
snow events. Mean annual (1971–2000) precipitation ranges from more than 250 in. in
the headwaters of the Wynoochee and Humptulips Rivers to 43 in. near the cities of
Chehalis and Centralia (PRISM 2011 cited in Gendazsek 2011). The majority of
precipitation generally falls between October and March (Gendazsek 2011).
The lower South Fork Chehalis has a low gradient from its mouth until RM 16.8. In the
upper South Fork, within Cowlitz County, the river narrows substantially as it flows
through steep terrain.
4.3 Ecosystem Context The Lower Columbia River and tributaries can be considered a distinct ecosystem region
within the entire Columbia River watersheds. The complexity of topography, stream
gradient, flow and other features, however, tends to distinguish ecological functions of
the Columbia River and tributaries. The Lower Columbia River itself functions largely
as an estuary. Tributaries tend to function more as headwater streams. Portions of four
major watersheds are located within Cowlitz County, the Lewis watershed, the Cowlitz
Watershed, the Grays/Elochoman Watershed, and the Chehalis Watershed. Generally,

The Watershed Company and Parametrix May 2014
61
these watersheds are identified by the state as Water Resource Inventory Areas (WRIA).
A map of the WRIAs within Cowlitz County is provided in Figure 4-1. Table 4-1
provides a summary of subbasins and WRIAs within Cowlitz County, as well as
anadromous salmonids associated with each basin.
Table 4-1. Summaries of Cowlitz County subbasins from the Lower Columbia Salmon Recovery and Fish and Wildlife Subbasin Plan (2010).
Subbasin Strata WRIA County(s)
Watershed Area
Elevation (max)
Historic Anadromous Stream Miles
Focal Species1
Mill, Abernathy, Germany
Coast 25 Cowlitz, Wahkiakum
100 mi2 1300 ft 110 CHF, Chum,
Coho, STW Cowlitz (lower)
Cascade 26
Cowlitz, Lewis 440 mi2 1,000 ft 360 CHF, Chum,
Coho, STW Cowlitz (upper)
Lewis, Pierce, Skamania
1,400 mi2 14,000 ft 110 CHF, CHS, STW, Coho
Coweeman Cowlitz 200 mi2 3,000 ft 90 CHF, STW, Chum, Coho,
Toutle Cowlitz 510 mi2 8,000 ft 310 CHF, CHS, STW, Chum, Coho,
Kalama Cascade 27
Cowlitz 210 mi2 8,000 ft 120 CHF, CHS, Chum, Coho,
STW, STS North Fork Lewis
Clark, Cowlitz, Skamania
830 mi2 12,000 ft 100 CHF, CHS, Chum, Coho,
STW, STS, BT
1 CHF= fall Chinook, CHS= spring Chinook, STW= winter steelhead, STS= summer steelhead, BT= bull trout
Table 4-2. Priority species and habitats in Cowlitz County (WDFW 2010).
Species/ Habitats State Status Federal Status
Habitats
Aspen Stands Biodiversity Areas and Corridors Herbaceous Balds Old-Growth/Mature Forest Oregon White Oak Woodlands West Side Prairie Riparian

Cowlitz County Shoreline Analysis Report
62
Species/ Habitats State Status Federal Status Freshwater Wetlands & Fresh Deepwater
Instream Caves Cliffs Snags and Logs Talus
Fishes
Pacific Lamprey Species of Concern River Lamprey Candidate Species of Concern Green Sturgeon Threatened White Sturgeon Olympic Mudminnow Sensitive Leopard Dace Candidate Mountain Sucker Candidate Eulachon Candidate Threatened Bull Trout Candidate * Threatened *
Chinook Salmon Candidate Threatened (Upper Columbia Spring run is Endangered)
Chum Salmon Candidate Threatened
Coastal Res./ Searun Cutthroat Species of Concern
Coho Threatened – Lower Columbia
Kokanee Pink Salmon Steelhead Trout Candidate ** Threatened ** Sockeye Salmon Candidate
Amphibians
Cascade Torrent Salamander Candidate Dunn's Salamander Candidate Larch Mountain Salamander Sensitive Species of Concern Van Dyke's Salamander Candidate Species of Concern Western Toad Candidate Species of Concern
Reptiles Pacific Pond Turtle (also known as Western Pond Turtle) Endangered Species of Concern
Birds
Western grebe Candidate Great Blue Heron Cavity-nesting ducks: Wood Duck, Barrow’s Goldeneye, Common Goldeneye, Bufflehead, Hooded Merganser
Nonbreeding concentrations of: Barrow's Goldeneye, Common Goldeneye, Bufflehead
Harlequin Duck

The Watershed Company and Parametrix May 2014
63
Species/ Habitats State Status Federal Status Trumpeter Swan Tundra Swan Waterfowl Concentrations Bald Eagle Sensitive Species of Concern Golden Eagle Candidate Northern Goshawk Candidate Species of Concern Peregrine Falcon Sensitive Species of Concern Sooty Grouse Wild Turkey Sandhill Crane Endangered Nonbreeding concentrations of: Charadriidae, Scolopacidae, Phalaropodidae
Band-tailed Pigeon Yellow-billed Cuckoo Candidate Candidate Spotted Owl Endangered Threatened Vaux’s Swift Candidate Pileated Woodpecker Candidate Purple Martin Candidate Slender-billed White-breasted Nuthatch Candidate Species of Concern
Mammals
Harbor Seal Roosting Concentrations of: Big-brown Bat, Myotis bats, Pallid Bat
Townsend’s Big-eared Bat Candidate Species of Concern Fisher Endangered Candidate Marten Wolverine Candidate Candidate Columbian Black-tailed Deer Columbian White-tailed Deer Endangered Endangered Elk
Invertebrates Blue-gray Taildropper Candidate Valley Silverspot Candidate Species of Concern
Table 4-3. Threatened and endangered plant species in Cowlitz County.
Scientific Name Common Name Status1 Historic Record2
Agoseris elata Tall agoseris WS
Cimicifuga elata var. elata Tall bugbane SC, WS H
Corydalis aquae-gelidae Clackamas corydalis SC, WS
Erythronium revolutum Pink fawn-lily WS

Cowlitz County Shoreline Analysis Report
64
Euonymus occidentalis var.
occidentalis Western wahoo WS
Isoetes nuttallii Nuttall's quillwort WS
Physostegia parviflora Western false dragonhead WS H
Poa laxiflora Loose-flowered bluegrass WS
Poa nervosa Wheeler's bluegrass WS
Salix sessilifolia Soft-leaved willow WS
Sidalcea nelsoniana Nelson's checker-mallow FT, WE
1 Listing status: FT = Federal threatened, FE = Federal endangered, FC = Federal candidate, FS = Federal species of concern, WE = Washington endangered, WT = Washington threatened, WS = Washington sensitive.
2 H indicates that most recent record in the County was before 1977.
In addition to rare plant species identified in Table 4-3, the following rare plant
communities have also been documented to occur in Cowlitz County.
Pacific Silver Fir / Oval-leaf Blueberry
Noble Fir Forest
Bluejoint Reedgrass
Sitka Sedge
Western Inflated Sedge
Shore Sedge
Northwest Territory Sedge
Creeping Spikerush
Idaho Fescue Community
Mid-elevation Freshwater Wetland WC
Lodgepole Pine / Kinikinnick
Douglas-fir - Western Hemlock / Swordfern
Douglas-fir / Beaked Hazel / Swordfern
Oregon White Oak / Oval-leaf Viburnum - Poison-oak
Sitka Willow
Western Hemlock / Swordfern
Western Hemlock / Oval-leaf Blueberry
4.3.1 Columbia River
The Columbia River is the largest river in the Pacific Northwest, and the fourth largest
river in the United States by volume. The Columbia River watershed originates in
Canada, and the drainage area of over 258,000 square miles includes areas of
Washington, Oregon, Montana, Idaho, Wyoming, and Nevada.
Cowlitz County is located along the lower Columbia River, in the tidal freshwater
subsystem. The Willamette River is the largest tributary to the lower Columbia River.

The Watershed Company and Parametrix May 2014
65
Major tributaries originating in the Cascades include the Lewis, Kalama and Cowlitz
Rivers in Cowlitz County, as well as the Sandy River in Oregon and the Washougal
River, in Washington. Major Coast Range tributaries include the Elochoman and Grays
Rivers, the Lewis and Clark, Young, and Clatskanie Rivers in Oregon.
The Columbia River Estuary and Lower Columbia Subbasin support an abundance of
fish and wildlife species. Columbia River populations compose 12 of the 26
evolutionary significant units of Pacific salmon protected under the Endangered Species
Act of 1973 (Bottom et al. 2005).
Estuaries provide a variety of functions critical to a variety of species. Estuarine habitats
also provide young salmonids with a productive feeding area, protection from large
piscivorous predators, and an area where smolts can undergo the physiological changes
necessary to acclimate to the saltwater environment. The natural structure including
sinuous channels, overhanging vegetation, and undercut banks in these habitats offers
high densities of insect prey and potential refuge from predators (McIvor and Odum
1988). The connectedness of these habitats likely determines the extent to which juvenile
salmonids access the spectrum of available estuarine habitats (Beamer et al. 2005).
Smelt (eulachon) in the Northwest Pacific Ocean depend on the lower Columbia River
and its tributaries to support the largest known spawning run, which historically
represented half of the species’ abundance. The mainstem of the lower Columbia River
provides spawning and incubation sites, as well as a migratory corridor to spawning
areas in the tributaries. Spawning grounds are typically in the lower reaches of larger
rivers. Eggs commonly adhere to sand or pea-sized gravel. Eggs found in areas of silt or
organic debris reportedly suffer much higher mortality (NMFS 2011).
4.3.2 Lewis River
The Lewis River is part of WRIA 27, which covers 1,310 square miles, including the
eastern portion of Cowlitz County. Originating on the slopes of Mount Adams and
Mount St. Helens, the Lewis River has two major forks, the North Fork, which forms the
southeastern boundary of Cowlitz County, and the East Fork, which is located in
Skamania and Clark Counties. The North Fork Lewis River includes three significant
impoundments: Swift Reservoir (RM 47.9), Yale Reservoir (RM 34.2), and Merwin Lake
(RM 19.5). The northern shorelines of Yale Reservoir and Merwin Lake are located in
Cowlitz County, and Swift Reservoir is located to the east in Skamania County. Major
tributaries to the Lower Lewis include the EF Lewis, Cougar Creek, and Speelyai Creek.
The majority of WRIA 27 is in managed forest lands, primarily concentrated in the
upper watershed.

Cowlitz County Shoreline Analysis Report
66
Anadromous fish species in WRIA 27 include chum salmon, coho salmon, Chinook
salmon, steelhead, bull trout, and sockeye salmon. Each of these anadromous salmonid
species are federally listed as threatened under the Endangered Species Act with the
exception of sockeye, which are rare in the county. Merwin Dam at RM 19.5, is a
complete barrier to for anadromous fish passage (LCFRB 2010). Below Merwin Dam,
the lower North Fork flows through a deep canyon until it opens to a broad alluvial
valley at RM 12 (LCFRB 2010). Tidal influence extends up to RM 11 (LCFRB 2010).
The Lewis River has produced very large smelt runs periodically. During spawning,
eulachon typically move upstream about 16 km (10 miles; to Eagle Island), but they have
been observed upstream to the Merwin Dam (NMFS 2011).
4.3.3 Kalama River
The Kalama River originates on the southwest slope of Mt. St. Helens, from the Dryer
Glacier, and flows 44 miles west-southwest to the Columbia River. Nearly all of the 205
square mile drainage area is within Cowlitz County. Shorelines of the State in the
Kalama River basin include the North Fork Kalama River, Fossil, Langdon, Elk, Jacks,
Arnold, Gobar, and Wild Horse Creeks. Dry Creek and Merrill Lake are also shorelines
of the state within the Kalama River basin.
The lower basin is low gradient. Historically, Lower Kalama Falls blocked most
anadromous passage at RM 10. A fish ladder, constructed in 1936, allows passage above
the falls; however, only steelhead and excess spring chinook are passed above the lower
falls by Washington Department of Fish and Wildlife (WDFW) (Wagemann 1999,
personal comm. cited in Wade 2000b). Above RM 10 the river flows in a narrow valley.
An impassable falls blocks all anadromous passage at RM 35 (Wade 2000b). Many of the
tributaries to the Kalama have steep gradients, with only the lower portions of the
streams accessible to anadromous fish.
The extent of smelt spawning within the Kalama River is from the confluence with the
Columbia River to the confluence with Indian Creek (NMFS 2011).
4.3.4 Cowlitz River
The Cowlitz River drains approximately 2,480 square miles over a distance of 151 miles.
Originating on the west slope of the Cascade Mountain Range and draining portions of
Mount Rainier, Mount Adams and Mount St. Helens, the River flows west, then south to
its confluence with the Columbia River at Kelso. The Toutle and Coweeman Rivers are
the largest tributaries of the Cowlitz River. Other tributaries to the Cowlitz River that
qualify as shorelines of the state in Cowlitz County include Olequa, Arkansas,

The Watershed Company and Parametrix May 2014
67
Delameter, and Ostrander Creeks. Two major dams, Mayfield dam and Mossyrock
dam, occur in Lewis County on the Upper Cowlitz River.
The Toutle River originates on Mt. St. Helens, with headwaters near 8,000 feet in
elevation, and drains the north and west sides of the mountain, flowing westward to its
confluence with the Cowlitz River at RM 20. The subbasin includes three main
drainages, the North Fork Toutle, the South Fork Toutle, and the Green River. Much of
the upper basin is within the Mt. St. Helens National Volcanic Monument. Other
shorelines of the state along the Toutle River include the following: Shultz, Studebaker,
Coldwater, Maratta, Hoffstadt, Bear (2), Deer, Alder, Wyant, Hemlock, Outlet, Johnson,
Harrington, Trouble, and Coldspring Creeks. Castle Lake, Coldwater Lake, and Fawn
Lake each drain to the North Fork Toutle River. Silver Lake drains to the mainstem
Toutle River via Outlet Creek.
The Coweeman River originates in the cascade foothills around 3,000 feet in elevation.
Principal tributaries that are shorelines of the state include Goble, Mulholland, and
Baird Creeks. The Coweeman River joins the mainstem Cowlitz at RM 1.7.
The 1980 eruption of Mount St. Helens had a significant influence on watershed
conditions including significant effect on fisheries populations and their habitats in the
North and South Fork Toutle River watersheds (Jones and Salo 1986). Debris flows
buried a 23 square mile area to an average depth of 150 feet, including more than 27
miles of anadromous stream habitat (Jones and Salo 1986).
Populations of anadromous salmon, although present, are substantially reduced from
historic numbers. Sturgeon and pacific lamprey are present in the lower reaches in
reduced numbers, and smelt runs still occur cyclically. The Cowlitz River is likely the
most productive and important spawning river for smelt within the Columbia River
system. Spawning adults typically move upstream about 26 km (16 miles) to Castle Rock
or beyond to the confluence with the Toutle River and are occasionally sighted as far as
80 km (50 miles) upstream (NMFS 2011).
4.3.5 Mill, Abernathy, Germany Creeks
Mill, Abernathy, and Germany Creeks are a part of WRIA 25 (the Grays/Elochoman
watershed). The watershed consists of several small, low elevation, rain dominated
systems that experience tidal influences from the Columbia. In addition to the above
listed Creeks, Cameron Creek and Ordway Creek occur in WRIA 25 in Cowlitz County.
The upper reaches of the Elochoman River also extend into the westernmost portion of
Cowlitz County.

Cowlitz County Shoreline Analysis Report
68
Focal salmonid species include chum, coho, winter steelhead, and fall Chinook. Salmon
and steelhead numbers have declined to only a fraction of historical levels and
extinction risks are significant for all focal species. Returns of winter steelhead and coho
include both natural and hatchery produced fish. Natural fall Chinook spawning
returns have been highly influenced by the release of Spring Creek Hatchery stock
released at the Abernathy Creek NFH which was discontinued in 1995. Fall Chinook
hatchery strays continue to be present in the subbasin.
4.3.6 South Fork Chehalis River
A portion of the northwestern corner of Cowlitz County forms the headwaters of the
South Fork Chehalis River. The River flows north into Lewis County where it joins the
North Fork Chehalis River before heading west toward Grays Harbor. Other tributaries
to the mainstem Chehalis River include the Newaukum, Skookumchuck, Black, Satsop,
and Wynoochee Rivers.
The South Fork Chehalis River is used by fall and spring Chinook salmon, coho salmon,
cutthroat, and steelhead (Grays Harbor County Lead Entity 2011).
4.4 Major Land Use Changes and Current Shoreline Condition
4.4.1 Columbia River
Human influences have resulted in substantial changes to the shorelines of the
Columbia River. The most significant changes to the River’s shorelines have resulted
from European settlement following the Lewis and Clark expedition in the early 1800s.
Grazing and farming activities along the estuarine floodplain for expanded between the
early 1800s through the early 1900’s. Extensive diking of the shorelines occurred to
protect agricultural fields from flooding, and as a consequence, large areas of the
floodplain were isolated from the river.
Concurrent with the expansion of agriculture, commercial fishing, processing, and
canning emerged as major industrial activities on the Columbia. The commercial fishing
industry led to the extensive construction of canneries, warehouses, fish traps, and other
similar structures along the shores and in the river (Christy and Putera 1992,
Lichatowich 1999). The piles associated with many derelict structures are still present
today in many places along the River. Timber production and transport also developed
during this period, shaping the vegetative landscape.
Today, the Columbia River Basin supports significant water-dependent or water-
oriented commercial and industrial uses including pulp mills, aluminum plants, and
commercial fishing (see Appendix G, Demand for Water-oriented Uses). Agriculture is

The Watershed Company and Parametrix May 2014
69
also a significant land use in the basin. Recreational activities include fishing, boating,
and hiking.
Flow regulation and diking in the Columbia River have eliminated or limited tidal
inundation and disconnected the river from its floodplain, limiting natural disruptions
that form new wetlands and create shifting mosaics of wetland habitats (Bottom et al.
2005). Furthermore, channel dredging and flow regulation in the Columbia River have
combined to consolidate the river current into a single channel and reduce flow through
peripheral wetland and marsh habitats (Bottom et al. 2005). The combination of dikes
and water flow regulation has contributed to a 62 percent loss in the shallow water
habitat available to juvenile Chinook salmon in the lower estuary (Kukulka and Jay
2003).
The 21 dams built in the Columbia and Snake Rivers since 1933 have substantially
altered the Columbia River hydrograph. Dam operations have reduced the frequency of
spring freshets, which historically aided the migration of juvenile salmon and helped
maintain floodplain habitat connectivity. Today, over-bank flows and associated large
woody debris recruitment and sediment transport processes have been substantially
reduced.
Historic and ongoing dredging operations are responsible for maintaining a viable
navigation channel to support five deep-water ports (two in Cowlitz County), which
transport 30 million tons of goods annually. However, the dredge operations also have
limited the natural formation of new estuarine marshes (Bottom and Simenstad 2001).
Today, hundreds of fish and wildlife species reside in or migrate through the Lower
Columbia River and its estuary. Current wild populations of salmon in the Columbia
River basin represent only 12 percent of their historic numbers (Bottom et al. 2005). The
period of estuarine residency provides opportunities for juvenile salmon (particularly
fall Chinook salmon). Shallow water habitats may provide spatial separation from
aquatic predators that reside in deeper waters, improved protection from predators
through higher turbidity levels (Gregory and Levings 1998), as well improved foraging
capacity (Levings et al. 1991). In the Lower Columbia, salmonids are impacted by
primarily impacted by disconnected or lost habitats. Predation impacts from Caspian
terns and northern pikeminnow are also significant.
4.4.2 Lewis River
Three dams in the upper watershed have significant effects throughout the basin. The
dams block access to approximately 80 percent of historic steelhead spawning habitat.

Cowlitz County Shoreline Analysis Report
70
Per provisions in the FERC settlement agreement (PacifiCorp 2004), PacifiCorp began a
program in 2011 to reintroduce anadromous fish to 170 miles of habitat upstream of the
dams. The dams affect peak flows and baseflows, restrict downstream transport of
LWD, and affect natural sediment transport processes. To offset habitat impacts
resulting from continued operation of its hydroelectric projects on the Lewis River,
PacifiCorp Energy manages 10,085 acres around the reservoirs in accordance with the
Lewis River Shoreline Management Plan (PacifiCorp 2008a) and the Lewis River
Wildlife Habitat Management Plan (PacifiCorp 2008b). The Wildlife Habitat Plan
includes goals, objectives, actions, and monitoring plans for habitats within the managed
area (PacifiCorp, 2008b). Despite sediment retention above the dams, landslides below
the dams on the North Fork Lewis River appear to provide sufficient spawning gravels
to the lower North Fork (Steel et al. 2007).
Levees were built in the lower Lewis River in an effort to control flooding. The first
successful levee was built near Woodland in 1921 (Steel et al. 2007). Today, the lower
seven miles of the Lewis River are disconnected from the floodplain as a result of
extensive diking and levee construction (Wade 2000). Riparian vegetation is largely
lacking in the lower River as a result of levees and floodplain development (Wade 2000).
The upper watershed is heavily-forested and largely managed for public and private
industrial timber production. However, in recent years, the area has seen increased
demand for recreational use and residential development (EA Engineering in Wade
2000). Road densities in the basin range from 4.96 miles/square mile in the lower North
Fork below Merwin Dam (Lewis County GIS 1999 cited in Wade 2000b) to as low as 2.01
miles/square mile in the upper portions of the watershed on Forest Service lands (USFS
1995c cited in Wade 2000b).
Most of the Upper North Fork is within the Gifford Pinchot National Forest or the Mt.
St. Helens National Volcanic Monument. The majority of the headwaters of the basin
are forested and in public ownership; active logging was common until the 1980s, but
current logging activities are greatly reduced. Current vegetation in the Upper North
Fork Lewis watershed is a mix of early, mid, and late seral stage forests, various aged
clear-cuts, native grasslands, shrubs, burned areas, and rock and snow in the higher
elevations (Steel et al. 2007). Agriculture and residential uses dominate the lower valley.
The only urban area in the subbasin is the City of Woodland.
4.4.3 Kalama River
The watershed is heavily-forested and approximately 96 percent of the Kalama River
Watershed is owned and managed by private timber companies. Most of the watershed

The Watershed Company and Parametrix May 2014
71
was logged in the 1960s through the early 1980s. As a result, existing forest stands are
young, and an extensive road network (1,292 miles of roads) covers the forestry lands,
with a road density of 5.75-miles/square mile of area (Lewis County GIS 1999 cited in
LCFRB 2010). Although the banks of the Kalama River are generally considered to be
stable, the proportion of fine sediment in the River substrate is likely related to past
forestry practices and road densities (Wade 2000). The upper watershed is within the
Mount St. Helens National Volcanic Monument, which is primarily managed for natural
resource conservation.
Stand replacing fires, which burned large portions of the basin between 1902 and 1952,
have had lasting effects on basin hydrology, sediment transport, soil conditions, and
riparian function. Large Woody Debris (LWD) is limited throughout the mainstem river
and all of the major tributaries, and given the degraded nature of existing riparian
conditions, future recruitment of LWD is also limited (Wade 2000).
The City of Kalama is the only urban area in the subbasin. Extensive industrial
development has occurred within the historic floodplains in the lower two miles of the
Kalama, especially to the west of I-5 (see Appendix G, Demand for Water-oriented
Uses). Most of the lower river has been channelized and diked to facilitate this
development. Given the naturally steep topography of the Kalama River throughout
much of the basin, isolation of floodplain habitats in the lower river exacerbates a
natural limiting factor (Wade 2000). Residential development has increased along the
lower river as well. The lower ten miles of the Kalama River are impaired by high water
temperatures.
4.4.4 Cowlitz Watershed
Forestry is by far the most dominant land use for all subbasins within the Cowlitz
watershed. Forestry activities have the potential to affect temperature and hydrologic
regime in the watershed. Despite a history of logging, the watershed still includes
several areas of mature forests. Within Cowlitz County, nearly 20 percent of the
watershed’s shorelines are in agricultural use.
The construction of Mayfield and Mossyrock Dams contributed to the decline of
anadromous fish populations. Historically, all of the spring Chinook salmon, 46 percent
of the fall Chinook salmon, 77 percent of the coho salmon and 80 percent of the
steelhead were estimated to have spawned in the upper watershed (GAIA 1994 cited in
Dammers et al. 2002). The construction of the two dams effectively cut off any use of the
upper watershed by anadromous salmon. In 1994, a trap and haul program began to
reintroduce anadromous salmonids to the watershed above the dam complex. Today,

Cowlitz County Shoreline Analysis Report
72
adults collected at the hatchery complex below the dams are trucked upstream and
released to spawn naturally, and juveniles produced at the hatchery are released in the
upper watershed to produce additional smolts.
The 1980 eruption of Mt. St. Helens dramatically degraded the habitat conditions of the
Toutle River system and the mainstem Cowlitz River below the mouth of the Toutle.
Melted ice, ash, and pumice eroded down the Toutle Valley into the Cowlitz River, and
carried coarse sandy material and debris to the Columbia River. The eruption wiped out
areas of existing forests, which are now recovering in young vegetative conditions.
Following the eruption, the debris flows filling the rivers caused concern for potential
flooding of the Cities of Castle Rock, Kelso, and Longview. In response to this concern,
the U.S. Army Corps of Engineers (Corps) removed over 74 million cubic yards of
material from the Cowlitz River. Floodplain areas along portions of the lower Cowlitz
and Toutle Rivers were filled with the fine sediment from dredge spoils. In order to
limit future downstream sedimentation and associated flood risk in the North Fork
Toutle River, the Corps constructed a sediment retention structure (SRS) on the North
Fork Toutle River. The 125 foot tall and 2,200 foot long SRS totally blocked volitional
upstream access to as many as 50 miles of habitat for anadromous fish (Corps 2007).
Despite the SRS, a significant quantity of sediment is continuing to move through the
Toutle system into the Lower Toutle and Lower Cowlitz Rivers. Because of continued
filling of the sediment retention structure, the Corps is planning to raise the height of the
spillway by 10 feet within the next year in order to reduce downstream sediment
delivery and provide additional flood control measures in the Cowlitz River
downstream of the Toutle confluence (Corps 2012).
Also following the eruption of Mount St. Helens, two new shoreline lakes, Coldwater
Lake and Castle Lake, were created by lahars blocking the North Fork Toutle channel.
In order to prevent catastrophic failure of the new earthen berms that formed these
lakes, the Corps of Engineers constructed hardened spillway channels at their outlets.
The mainstem Cowlitz and many tributaries have experienced losses in key habitat areas
and habitat diversity for most salmonid life-stages due to channel simplification and
diking. Below the confluence with the Toutle River, the Cowlitz River channel is
extensively armored and diked, and most of the floodplain has been filled with deposits
from the eruption of Mt. St. Helens (Wade 2000). Grazing, agriculture, forestry, and
residential and commercial development have contributed to a reduction in riparian
function, increased bank instability, and added fine sediments. The watershed includes a
significant area of highly erodible soils. The greatest erosion problems occur as a result

The Watershed Company and Parametrix May 2014
73
of ground disturbance from road building and other activities associated with logging.
Water quality is generally good within the Cowlitz River, but elevated water
temperatures and turbidity are a concern in the Coweeman watershed.
Incorporated urban areas include the Cities of Kelso, Longview, and Castle Rock.
4.4.5 Mill, Abernathy, Germany Creeks
The upper watershed area is heavily-forested and largely managed for public and
private industrial timber production. Historic logging contributed to the degradation of
riparian and instream habitat, although riparian and forest conditions are recovering.
The middle reaches have considerable agricultural and development impacts, including
limited vegetated riparian areas and disconnected floodplains. The lower reaches of
Germany Creek flows through predominantly agricultural land uses, and the Creek is
somewhat entrenched. Large woody debris has the potential to restore a more natural
channel form, but large woody debris has been periodically removed from the Creek by
local residents (Wade 2002). Floodplain connectivity throughout lower Mill Creek has
been impaired by historic splash damming, which has resulted in an incised channel
along most of the lower 1.5 miles (Wade 2002). Similarly, the lower five miles of
Abernathy Creek are incised and confined by adjacent roads and railroads (Wade 2002).
Excessive fine sediment has been observed in lower Germany Creek; the source of fine
sediment may be a combination of adjacent agricultural erosion and upstream mass
wasting (Wade 2002).
4.4.6 South Fork Chehalis River
Dominant land use in the upper South Fork is commercial forestry, and agricultural uses
predominate in the lower river. Both agricultural and forestry uses have resulted in
significant alterations to the shorelines of the South Fork Chehalis River. Today,
riparian vegetation is limited in extent and maturity compared to historic conditions
(Grays Harbor County Lead Entity 2011). The South Fork contributes to high sediment
loads in the mainstem Chehalis River; these sediment loads are likely related to a high
density of forest roads and logging practices that affect headwater streams, as well as
erosion associated with agriculture (Grays Harbor County Lead Entity 2011). Culverts
throughout the South Fork Chehalis River present fish passage barriers for anadromous
salmonids (Grays Harbor County Lead Entity 2011).
5 INVENTORY AND ANALYSIS OF CONDITIONS
The following section discusses conditions and characteristics of each shoreline
assessment unit with respect to both ecological characterization (physical processes,

Cowlitz County Shoreline Analysis Report
74
landscape conditions, shoreline modifications, priority habitats and species use, water
quality, etc.) and land use characterization (land use changes, development potential,
and existing and potential public access). This includes an evaluation of existing
ecological functions provided at a reach scale (as described in Chapter 3). In addition,
identification of general restoration opportunities is provided. A more comprehensive
restoration plan for the County will be prepared as a separate document later.
Table 5-1 expands upon the relevant required inventory elements, providing specific
detail and data for each assessment unit. Unless otherwise noted, Table 5-1 considers
only information available within the boundaries of shoreline jurisdiction of each
assessment unit. Following Table 5-1, additional tables are provided which report water
quality listings which are identified by Ecology’s 303(d) listing (see Tables 5-2 through 5-
4).

The Watershed Company and Parametrix May 2014
75
Table 5-1. Summary of shoreline inventory by assessment unit.
Assessment unit
Unit Shoreline
Area (Acres –
excluding open water)
Unit Length (Miles)
Inventory Elements
Land Use Patterns1, 2 Impervious Surfaces Vegetation1, 3
Levees (County/Cities)
Armoring (Cities)
(% of shoreline length)
Overwater Structures (#)
Floodplain, Floodway, and
Channel Migration
Hazard Area
Parks and Public Lands Critical Areas
Columbia River 2,505 59.1
Current Land Use: Agriculture: 19.6%
Diking Right-of-Way: 1.1% Industrial: 9.9%
Other: 1.4% Ports: 0.7%
Single Family Residential: 3.5% Transportation: 2.7%
Undeveloped Land: 43.7% Not Classified (e.g., Water, ROW):
16.6%
4.5%
Cultivated: 2.6% Deciduous Forest:
1.0% Developed Open
Space: 1.1% Grassland: 7.2%
Developed: 10.3% Palustrine Emergent
Wetland: 17.6% Palustrine Forested
Wetland: 23.2% Palustrine
Shrub/Scrub Wetland: 14.3%
Pasture/Hay: 11.7% Shrub/Scrub: 2.3%
Unconsolidated Shore: 5.2%
Levees: 30,367 LF – 9.7%
Riverine: Bridge: 6
Building: 2 Dock\Pier: 36
Other: 8
Floodplain: 75.3%
Floodway: <0.0% Channel
migration zone area: 73.6%
19 acres – 0.6% parks
160 acres – 5.5% public lands
County Line
Park Kalama
Sportsman's Park Area
Willow Grove Park
Wetlands: 1,649 acres – 65.8% Geologic Hazard Areas: 4 acres – 0.1%
Priority Habitat Areas: Bald Eagle: 57 acres
Biodiversity Areas and Corridor: 33 acres Canada Goose: 362 acres
Cavity-nesting Ducks: 313 acres Cliffs/bluffs: 55 acres
Great Blue Heron: 7 acres Islands: 597 acres
Oak Woodland: 3 acres Roosevelt Elk: 143 acres
Waterfowl Concentrations: 978 acres Wetland Habitats: 142 acres
Lewis River 2,288 44.0
Current Land Use: Diking Right-of-Way: 1.1%
Forestland: 19.5% Recreation: 7.1%
Single Family Residential: 8.7% Undeveloped Land: 41.8%
Utilities: 12.4% Not Classified (e.g., Water, ROW):
7.9%
2.0%
Deciduous Forest: 9.8%
Evergreen Forest: 39.3%
Grassland: 2.6% Developed: 5.3%
Mixed Forest: 12.4% Palustrine Emergent
Wetland: 3.8% Palustrine Forested
Wetland: 8.2% Palustrine
Shrub/Scrub Wetland: 5.0%
Pasture/Hay: 2.0% Shrub/Scrub: 7.2%
Levees: 23,136 LF –
10.0%
Riverine: Bridge: 8
Buoy\Float: 8 Dock\Pier: 47
Other: 15
Floodplain: 23.5%
Floodway: 0% Channel
migration zone area: 23.5%
259 acres – 10.9% parks
625 acres – 26.3% public lands and PacifiCorp lands
Beaver Bay
Campground Merwin Park Saddle Dam
Park Speelyai Bay
Park Yale Park Gifford Pinchot
National Forest
Wetlands: 305 acres – 13.3% Geologic Hazard Areas: 32 acres – 1.4%
Priority Habitat Areas: Bald Eagle: 206 acres
Cavity-nesting Ducks: 33 acres Elk: 2,027 acres
Mule and Black-tailed Deer: 78 acres Oak Woodland: 10 acres
Snag-rich Areas: 48 acres Waterfowl Concentrations: 18 acres

Cowlitz County Shoreline Analysis Report
76
Assessment unit
Unit Shoreline
Area (Acres –
excluding open water)
Unit Length (Miles)
Inventory Elements
Land Use Patterns1, 2 Impervious Surfaces Vegetation1, 3
Levees (County/Cities)
Armoring (Cities)
(% of shoreline length)
Overwater Structures (#)
Floodplain, Floodway, and
Channel Migration
Hazard Area
Parks and Public Lands Critical Areas
Kalama River 4,054 115.8
Current Land Use: Fishing Activities: 1.3%
Forestland: 70.9% Industrial: 1.3%
Single Family Residential: 5.2% Undeveloped Land: 16.7%
Not Classified (e.g., Water, ROW): 3.6%
1.1%
Deciduous Forest: 7.3%
Evergreen Forest: 55.5%
Grassland: 1.7% Developed: 2.0%
Mixed Forest: 10.4% Palustrine Emergent
Wetland: 1.4% Palustrine Forested
Wetland: 8.6% Palustrine
Shrub/Scrub Wetland: 3.6%
Shrub/Scrub: 8.0%
Levees: 3,662 LF – 0.6%
Riverine: Bridge: 11
Dock\Pier: 19
Lakes: Dock\Pier: 8
Floodplain: 18.6%
Floodway: 0% Channel
migration zone area: 17.0%
491 acres – 11.9% parks
649 acres – 15.8% public lands
Kress Lake Merrill Lake
Campground Gifford Pinchot
National Forest Kalama
Sportsman's Park Area
Wetlands: 451 acres – 11.1% Geologic Hazard Areas: 52 acres – 1.3%
Priority Habitat Areas: Bald Eagle: 306 acres
Cavity-nesting Ducks: 105 acres Elk: 3,504 acres Islands: 6 acres
Oak Woodland: 0 acres Snag-rich Areas: 127 acres
Waterfowl Concentrations: 0 acres Wetland Habitats: 105 acres
Cowlitz River 16,230 379.5
Current Land Use: Agriculture: 2.4% Forestland: 43.7%
Single Family Residential: 10.4% Undeveloped Land: 39.7%
Not Classified (e.g., Water, ROW): 1.7%
1.3%
Bare Land: 1.5% Deciduous Forest:
5.9% Evergreen Forest:
23.5% Grassland: 3.6% Developed: 2.6%
Mixed Forest: 8.3% Palustrine Emergent
Wetland: 4.7% Palustrine Forested
Wetland: 7.8% Palustrine
Shrub/Scrub Wetland: 8.1%
Pasture/Hay: 3.7% Shrub/Scrub: 17.0%
Unconsolidated Shore: 9.5%
Levees: 14,865 LF – 0.7%
Riverine: Bridge: 27
Dock\Pier: 2 Other: 1
Lakes:
Bridge: 5 Building: 3
Dock\Pier: 94 Fill: 11
Other: 5
Floodplain: 32.8%
Floodway: <0.0% Channel
migration zone area: 30.6 %
2,066 acres – 12.2% parks
4,159 acres – 24.6%
Riverside Park Seaquest State
Park Coldwater Lake
Facilities Gifford Pinchot
National Forest
Wetlands: 4,906 acres – 30.2% Geologic Hazard Areas: 1,660 acres – 9.8%
Priority Habitat Areas: Bald Eagle: 1,940 acres
Cavity-nesting Ducks: 173 acres Elk: 11,766 acres
Mule and Black-tailed Deer: 828 acres Roosevelt Elk: 1,199 acres Snag-rich Areas: 69 acres
Waterfowl Concentrations: 2,010 acres Wetland Habitats: 31 acres

The Watershed Company and Parametrix May 2014
77
Assessment unit
Unit Shoreline
Area (Acres –
excluding open water)
Unit Length (Miles)
Inventory Elements
Land Use Patterns1, 2 Impervious Surfaces Vegetation1, 3
Levees (County/Cities)
Armoring (Cities)
(% of shoreline length)
Overwater Structures (#)
Floodplain, Floodway, and
Channel Migration
Hazard Area
Parks and Public Lands Critical Areas
Mill, Abernathy, Germany Creeks
2,745 57.6
Current Land Use: Forestland: 23.5%
Other: 2.8% Ports: 5.6%
Single Family Residential: 23.2% Undeveloped Land: 37.7%
Not Classified (e.g., Water, ROW): 3.4%
2.3%
Cultivated: 1.9% Deciduous Forest:
14.8% Evergreen Forest:
12.5% Grassland: 2.0% Developed: 4.3%
Mixed Forest: 12.3% Palustrine Emergent
Wetland: 6.0% Palustrine Forested
Wetland: 17.1% Palustrine
Shrub/Scrub Wetland: 10.5%
Pasture/Hay: 9.6% Shrub/Scrub: 6.8%
Levees: 6,417 LF – 2.1%
Riverine: Bridge: 3
Dock\Pier: 2
Floodplain: 31.4%
Floodway: 0% Channel
migration zone area: 30.4%
0 acres – 0% parks 192 acres- 6.5%
public lands
Wetlands: 912 acres – 33.2% Geologic Hazard Areas: 42 acres – 1.4%
Priority Habitat Areas: Biodiversity Areas and Corridor: 806 acres
Cavity-nesting Ducks: 819 acres Roosevelt Elk: 1,769 acres
Waterfowl Concentrations: 270 acres Wetland Habitats: 562 acres
South Fork Chehalis River
121 2.5
Current Land Use: Forestland: 98.3%
Not Classified (e.g., Water, ROW): 1.7%
0.5%
Deciduous Forest: 33.5%
Evergreen Forest: 14.2%
Mixed Forest: 15.7% Palustrine Emergent
Wetland: 1.5% Palustrine Forested
Wetland: 8.9% Palustrine
Shrub/Scrub Wetland: 7.0%
Shrub/Scrub: 18.6%
Levees: 0 LF - 0%
0
Floodplain: 0% Floodway: 0%
Channel migration zone
area: 0%
0 acres – 0%
Wetlands: 0 acres – 0% Geologic Hazard Areas: 0 acres – 0%
Priority Habitat Areas: Roosevelt Elk: 121 acres

Cowlitz County Shoreline Analysis Report
78
Assessment unit
Unit Shoreline
Area (Acres –
excluding open water)
Unit Length (Miles)
Inventory Elements
Land Use Patterns1, 2 Impervious Surfaces Vegetation1, 3
Levees (County/Cities)
Armoring (Cities)
(% of shoreline length)
Overwater Structures (#)
Floodplain, Floodway, and
Channel Migration
Hazard Area
Parks and Public Lands Critical Areas
City of Castle Rock
170 6.6
Comprehensive Plan Zoning: Commercial: 1.1%
HDR: 2.9% Heavy Commercial/ Light Industrial:
3.4% Industrial: 17.5%
Mixed-use Commercial/ Industrial: 1.4%
Public / Quasi-Public: 3.3% Recreational/Open Space: 42.8%
River: 9.6% SFR: 6.1%
Not Classified (e.g., Water, UGA): 11.2%
12.6%
Cultivated: 3.1% Deciduous Forest:
2.2% Developed Open
Space: 2.0% Evergreen Forest:
2.1% Grassland: 1.4%
Developed: 28.1% Palustrine Emergent
Wetland: 22.3% Palustrine Forested
Wetland: 3.0% Palustrine
Shrub/Scrub Wetland: 4.0%
Pasture/Hay: 23.5% Shrub/Scrub: 1.6%
Unconsolidated Shore: 2.6%
Levees: 3,532 LF – 10.1%
Armoring: 4.5%
Riverine: Bridge: 2
Other:1
Floodplain: 49.8%
Floodway: 24.4% Channel
migration zone area: 38.5%
12 acres – 6.7% parks
Castle Rock Fairgrounds
Lions Pride Community Park
Mt. St. Helens Motorcycle Club
The Rock Community Park
Al Helenberg Memorial Boat Launch
Wetlands: 17 acres – 10.1% Geologic Hazard Areas: <0 acres – 0.1%
Priority Habitat Areas: Bald Eagle: 2 acres
Current Land Use: Public/Education/Assembly: 1.2%
Recreation: 2.7% Single Family Residential: 8.8%
Transportation: 5.2% Undeveloped Land: 39.1%
Not Classified (e.g., Water, ROW): 41.4%
City of Kalama 214 6.6
Comprehensive Plan Zoning: Public/Quasi-Public Overlay: 4.9%
Industrial & Public/Quasi-Public Overlay: 12.4%
Not Classified (e.g., Water, ROW, UGA): 82.0%
1.1%
Bare Land: 1.1% Developed Open
Space: 1.8% Evergreen Forest:
1.3% Grassland: 3.8%
Developed: 25.6% Palustrine Emergent
Wetland: 18.8% Palustrine Forested
Wetland: 20.6% Palustrine
Shrub/Scrub Wetland: 11.5%
Pasture/Hay: 1.8% Shrub/Scrub: 1.8%
Unconsolidated Shore: 6.7%
Levees: 9,744 LF – 27.9%
Armoring: 31%
Riverine: Bridge: 3
Dock\Pier: 16 Fill: 4
Other: 4
Floodplain: 61.7%
Floodway: 0.4% Channel
migration zone area: 1.9%
20 acres – 6.8% parks
Kress Lake Lions Club Field Marine Park Camp Kalama Kalama Marina
Wetlands: 76 acres – 35.7% Geologic Hazard Areas: 0 acres – 0%
Priority Habitat Areas: Canada Goose: <0 acres
Cavity-nesting Ducks: 59 acres Oak Woodland: 9 acres
Wetland Habitats: 49 acres
Current Land Use: Commercial: 5.6% Industrial: 41.6%
Ports: 9.7% Recreation: 3.5%
Single Family Residential: 9.7% Undeveloped Land: 17.0%
Not Classified (e.g., Water, ROW): 11.2%

The Watershed Company and Parametrix May 2014
79
Assessment unit
Unit Shoreline
Area (Acres –
excluding open water)
Unit Length (Miles)
Inventory Elements
Land Use Patterns1, 2 Impervious Surfaces Vegetation1, 3
Levees (County/Cities)
Armoring (Cities)
(% of shoreline length)
Overwater Structures (#)
Floodplain, Floodway, and
Channel Migration
Hazard Area
Parks and Public Lands Critical Areas
City of Kelso 882 21.5
Comprehensive Plan Zoning: Commercial: 9.0%
High Dens Res: 2.1% Industrial: 48.1%
Low Dens Res: 1.5% Open: 3.5%
Not Classified (e.g., Water, ROW): 35.7%
10.2%
Deciduous Forest: 1.2%
Developed Open Space: 6.9%
Evergreen Forest: 1.5%
Grassland: 5.2% Developed: 18.3% Mixed Forest: 1.4% Palustrine Emergent
Wetland: 19.5% Palustrine Forested
Wetland: 24.6% Palustrine
Shrub/Scrub Wetland: 13.3%
Pasture/Hay: 2.5% Shrub/Scrub: 1.9%
Unconsolidated Shore: 1.1%
Levees: 43,405 LF – 38.3% of
Assessment Unit 65% of City
Limits Armoring:
25,866 LF – 22.8%
Riverine: Bridge: 17 Other: 2
Floodplain: 69.3% of
Assessment Unit Floodway: 9.1% of Assessment
Unit Channel
migration zone area: 49.6%
12 acres – 1.2%
Tam O’Shanter Park
Coweeman River Trail
Cowlitz River Trail
Three Rivers Golf Course
Wetlands: 463 acres –52.6% Geologic Hazard Areas: 34 acres – 3.4%
Priority Habitat Areas: Elk: 41 acres
Oak Woodland: 2 acres Waterfowl Concentrations: 444 acres
Wetland Habitats: 202 acres
Current Land Use: Commercial: 1.5%
Diking Right-of-Way: 3.2% Multi-Family Residential: 1.5%
Open Space: 2.1% Recreation: 2.8%
Single Family Residential: 9.5% Transportation: 11.9%
Undeveloped Land: 52.2% Not Classified (e.g., Water, ROW):
13.6%
City of Woodland
237 3.8*
Comprehensive Plan Zoning: Commercial: 8.0%
Floodway and Open Space: 18.5% High Density Residential: 14.1% Low-density Residential: 34.5% Public/Quasi Public/Institutional:
11.8% Not Classified (e.g., Water, ROW):
13.0%
17.9%
Bare Land: 2.8% Deciduous Forest:
2.2% Developed Open
Space: 18.3% Grassland: 2.0%
Developed: 35.3% Mixed Forest: 1.2% Palustrine Emergent
Wetland: 5.3% Palustrine Forested
Wetland: 7.2% Palustrine
Shrub/Scrub Wetland: 8.7%
Pasture/Hay: 8.1% Shrub/Scrub: 2.2%
Unconsolidated Shore: 1.0%
Levees: 3,633 LF – 18.0%
Armoring: 8%
Riverine: Dock\Pier: 3
Lakes:
Dock\Pier: 12
Floodplain: 52.3%
Floodway: 32.5% Channel
migration zone area: 42.9%
6 acres – 2.2%
Horseshoe Lake Park
Wetlands: 56 acres – 23.8% Geologic Hazard Areas*: 0 acres – 0%
Priority Habitat Areas: Cavity-nesting Ducks: 2 acres
Current Land Use: Airport: 3.8% Church: 2.2%
Commercial: 2.8% Multi-Family Residential: 4.6%
Recreation: 2.2% Single Family Residential: 28.3%
Undeveloped Land: 27.2% Not Classified (e.g., Water, ROW):
27.6%
1 Only uses and coverages that occupy greater than 1% of the shoreline area are listed.
2 Land use pattern source information is described in Section 3.4.1. Categories shown here have been aggregated in some cases.
3 Vegetation data was classified using NOAA’s C-CAP classification. Maps of vegetative cover are found in Appendices B and C (Land Cover).

Cowlitz County Shoreline Analysis Report
80
This page intentionally left blank.

The Watershed Company and Parametrix May 2014
81
Table 5-2. Category 2 waterbodies (waters of concern) by assessment unit.
Assessment unit Waterbody pH
Tem
pera
ture
Ars
enic
Mer
cury
Che
mic
al
Com
poun
ds,
incl
udin
g pe
stic
ides
Feca
l Col
iform
Tota
l Dis
solv
ed
Gas
DD
T/D
DE
Columbia River
Columbia River X X X X X X
Lewis River
Lewis River X Merwin lake X Swift Creek #2 Power Canal
X
Yale Lake X Kalama River Kalama River X
Cowlitz Watershed
Alder Creek Arkansas Creek Baird Creek Coweeman River Cowlitz River X Delameter Creek Goble Creek Green River X Herrington Creek Hoffstadt Creek Ostrander Creek Schultz Creek Silver Lake X Toutle River Turner Creek
Mill, Abernathy, Germany Creeks
Abernathy Creek X Cameron Creek Coal Creek Germany Creek X Mill Creek X
South Fork Chehalis
River
South Fork Chehalis River

Cowlitz County Shoreline Analysis Report
82
Table 5-3. Category 4 waterbodies (polluted waters that do not require a total maximum daily load) by assessment unit.
Assessment unit Waterbody
Dio
xin
Tota
l D
isso
lved
G
as
Tem
pera
ture
Feca
l C
olifo
rm
Columbia River Columbia River X X
Lewis River
Lewis River Merwin lake Swift Creek #2 Power Canal Yale Lake
Kalama River Kalama River
Cowlitz Watershed
Alder Creek Arkansas Creek Baird Creek Coweeman River Cowlitz River Delameter Creek Goble Creek Green River Herrington Creek Hoffstadt Creek Ostrander Creek Schultz Creek Silver Lake Toutle River Turner Creek
Mill, Abernathy, Germany Creeks
Abernathy Creek X Cameron Creek X Coal Creek Germany Creek X X Mill Creek X
South Fork Chehalis River
South Fork Chehalis River

The Watershed Company and Parametrix May 2014
83
Table 5-4. Category 5 waterbodies (polluted waters that require a total maximum daily load) by assessment unit.
Assessment unit Waterbody pH
Tem
pera
ture
Ars
enic
Mer
cury
Che
mic
al
Com
poun
ds,
incl
udin
g pe
stic
ide
PCB
s
Columbia River Columbia River X X X X X
Lewis River
Lewis River Merwin lake Swift Creek #2 Power Canal Yale Lake
Kalama River Kalama River
Cowlitz Watershed
Alder Creek X Arkansas Creek X Baird Creek X Coweeman River X Cowlitz River X X X X Delameter Creek X Goble Creek X Green River Herrington Creek X Hoffstadt Creek X Mulholland Creek X Ostrander Creek X Schultz Creek X Silver Lake X Toutle River Turner Creek X
Mill, Abernathy, Germany Creeks
Abernathy Creek X Cameron Creek Coal Creek X Germany Creek X Mill Creek X
South Fork Chehalis River South Fork Chehalis River

Cowlitz County Shoreline Analysis Report
84
5.1 General Inventory and Analysis of Conditions
5.1.1 Utilities
Utilities are generally discussed in the assessment unit sections that follow.
However, the Bonneville Power Administration (BPA) is currently evaluating
potential routes for a new 500-kilovolt transmission line to reinforce the power
grid in southwest Washington. The line would travel between potential new
substations at Castle Rock, Washington and Troutdale, Oregon (a distance of
approximately 70 miles). This project has the potential to occur in multiple
assessment units, depending upon the alignment alternative selected. A final
agency decision regarding the project, including the potential alignment, is
scheduled for 2014.
5.1.2 Public Access – Existing and Potential
Shoreline public access, as defined in the Washington Administrative Code
(WAC 173-26-221(4)(a)), includes “the ability of the general public to reach,
touch, and enjoy the water’s edge, to travel on the waters of the state, and to
view the water and the shoreline from adjacent locations.” Shoreline public
access is probably most often thought of in terms of physical access to the
shoreline, such as via a trail, dock, boat ramp, or other access way. However,
public access can also be visual, such as from a viewing tower or through a view
corridor between buildings.
Protecting public access to shorelines is one of the three major policy goals of the
Shoreline Management Act.
The 2010 Cowlitz County Comprehensive Park Plan Update (Cowlitz Parks Plan)
is the guidance document for park and recreation facilities in Cowlitz County,
including shoreline public access facilities. In the Vision/Mission Statement and
Goals section, the Cowlitz Parks Plan sets forth the following shoreline-related
goals:
“Create, maintain, and enhance shoreline accessibility”
“Provide additional public access the banks of local rivers and lakes”
Later in the document’s Summary Findings and Conclusions, the following
statements are made relating to Cowlitz County shorelines in general:
“During the summer season there can be extensive public use of
shorelines along area rivers. Shoreline access is also important year-round

The Watershed Company and Parametrix May 2014
85
for fishing. Wherever possible, undeveloped shoreline areas should be
kept open for public use.”
“Merwin, Yale and Swift reservoirs and parks operated by Pacific Power
& Light Company (PP&L) are providing extensive and valuable
recreation facilities to the Southwest Washington region. Cowlitz County
should continue to work with PP&L to meet community needs.”
Additionally, in the Demands Assessment, the Cowlitz Parks Plan contains other
statements that are generally applicable to shorelines in Cowlitz County:
“Shoreline access: There is an ongoing need for more access to river
shorelines. Demand for boating access for the Columbia and Cowlitz
Rivers continues to be a priority. Access to bank fishing in the Columbia,
Cowlitz, Lewis and Kalama Rivers is an ongoing need as well.”
“Camping: Existing campgrounds throughout the county particularly
along the Lewis and Columbia Rivers operate at capacity through the
summer months. … There is a need for increased facilities that could be
addressed through public/private partnerships.”
Regarding potential shoreline public access projects, in its list of Target Projects,
the Cowlitz Parks Plan includes the following:
2020
“Purchase property to develop a park in the south portion of Cowlitz
County that would provide river access (including boat launch), walking
trails, playground equipment and sports fields and an outdoor
venue/amphitheater (possible gazebo).”
This project is mentioned here as the project could occur in any one of several
assessment units. Other projects and statements made in the Cowlitz Parks Plan
that apply only in a specific area of the shoreline are presented in the assessment-
unit-specific sections that follow.
5.1.3 Historic and Archeological Resources
The historical sites identified in Table 5-5 likely represent only a subset of the
historic and archeological resources that occur in Cowlitz County shorelines.
Due to the wealth of cultural resources, the State of Washington Department of
Archaeology and Historic Preservation requires cultural resources assessments

Cowlitz County Shoreline Analysis Report
86
when development or activities are proposed that may affect archaeological or
historic resources. Three out of the four historic and archaeological sites listed in
Table 5-5 are bridges that are still in use today. These bridges are maintained to
ensure structural integrity and to continue to support traffic needs. Once these
bridges are no longer structurally viable, they will likely be removed, rebuilt,
and/or replaced. Measures that allow maintenance of historic bridges are likely
to help prolong the lives of these structures.
Table 5-5. Places on the Washington State Historic Register within shoreline jurisdiction.
Register Name Address Longview Bridge Spans Columbia River Modrow Bridge Modrow Road Over the Kalama River Stella Blacksmith Shop 8530 Ocean Beach Highway1 Yale Bridge Spans Lewis River on WA 502
1 Map resolution is not sufficient to determine if location is within shoreline jurisdiction.
5.1.4 Levees
Cowlitz County features an extensive system of levees. Levees in the county
range in height from just 1 foot to over 20 feet and are publicly and privately
owned. There is no known comprehensive inventory of the entire County levee
system.
The County features six diking, drainage, or flood control districts that contain
levees. These special districts are as follows:
Cowlitz County Drainage Improvement District No. 1 (North Kelso)
Cowlitz County Consolidated Diking Improvement District No. 3 (South
Kelso)
Cowlitz County Consolidated Diking Improvement District No. 2
(Woodland)
Cowlitz County Diking Improvement District No. 15 (Willow Grove)
Lexington Flood Control Zone District (Lexington)
Cowlitz County Consolidated Diking Improvement District No. 1
(Longview)

The Watershed Company and Parametrix May 2014
87
These special districts maintain and repair their own levees. The Corps has
inspected and improved the levees in these special districts many times over the
years. Private levees are privately maintained and repaired.
Levees along rivers in these special districts require certification to be accredited
by FEMA. A certified levee is one that meets and continues to meet minimum
design, operation, and maintenance standards as specified in 44 CFR 65.10. The
design criteria and structural requirements outlined in paragraphs (b)(1) through
(7) must be certified by a registered professional engineer or a federal agency
responsible for levee design.
Certification is not sought for public dikes inside of river levees, dikes along
creeks, or private levees/dikes. To date, the Cowlitz River levee in Castle Rock is
the only levee that has been certified in the county. However, all of the special
districts are actively working towards certifying their levees (though Cowlitz
County Diking Improvement District No. 15 has yet to sign an agreement with
either the Corps or a private consultant). Figure 18 of the County map folio
shows public levees that are currently certified or in the process of being
certified.
Levees currently certified or undergoing certification are held to the standards in
44 CFR 65.10. Private levees are held to standards applied through the
development permit approval process. Additional flood control structures likely
exist throughout the County but are not well inventoried. For example, City-
specific information provided by the City of Castle Rock (Appendix I) documents
the presence of a flood control berm to the northeast of the Green Acres
development and north of Castle Rock High School.
The special districts rely on State Environmental Policy Act (SEPA) notification
from the County and Cities to consider if development proposed in proximity to
a levee, dike, or drainage ditch could have an impact. This notification typically
works if a special district owns the parcel the levee, dike, or drainage ditch is on;
however, if the levee, dike, or drainage district is located on an easement,
notification through SEPA is less reliable.
When a special district is notified of a development application that may affect a
levee, the district reviews it against Corps guidelines. The special districts do not
have additional guidelines beyond those of the Corps. If a special district
becomes aware of construction taking place next to a levee, dike, or ditch without

Cowlitz County Shoreline Analysis Report
88
prior knowledge, the district will work with that property owner and the
jurisdiction to bring the project into compliance with district requirements.
5.1.5 Potential Use Conflicts
In general, comprehensive plan designations limit potential conflicts between
neighboring uses. Although there is potential for future use conflict, particularly
in land use zones that provide a wide variety of land uses, the proposed SMP
will provide guidance and a regulatory framework to minimize or avoid future
use conflicts in shoreline jurisdiction.
The areas within County jurisdiction where potential use conflicts are the most
possible include areas anticipated for water-oriented industrial uses. These areas
are largely established contiguous areas of the Columbia River shoreline in the
Longview area (generally extending from Barlow Point to the Cowlitz River;
Columbia 7, and 9 through 17), the Kalama area (from south of Carrol’s Channel
to near the Todd Road interchange; Columbia 27 through 30), and the Woodland
area (in the Martin’s Bar area south of Burke Island and the Austin Point area
north of the Lewis River; Columbia 35 through 38).
In the Kalama area, a recreational use along the north shore of the Kalama River
has co-existed with port use without apparent conflicts. The residential area
south of the Port of Kalama is reasonably well buffered from port uses by
distance but experiences some conflicts when access across the rail corridor is
blocked by train movement. The port and industrial facilities in the Woodland
area are generally bounded by open space, although a recreational vehicle park
abuts the Martins Bar area and is located between two areas zoned Heavy
Manufacturing. This use is not allowed by existing zoning and may continue if
legally non-conforming or be phased out into a conforming water-oriented use in
the future.
See Appendix G, Demand for Water-oriented Uses, for further discussion of
industrial uses in the region.
5.2 Columbia River Assessment Unit The Columbia River Assessment Unit includes 2,505 acres along just over 59
miles of estuarine/riverine Columbia River shoreline (Figure 5-1). A summary of
shoreline characteristics is provided in Table 5-1.

The Watershed Company and Parametrix May 2014
89
Figure 5-1. Map of Columbia River Assessment Unit (in green).
5.2.1 Ecological Characterization
Critical Areas
The Columbia River shoreline area includes extensive palustrine and riverine
tidal channels. Approximately 66 percent of the shoreline is identified as

Cowlitz County Shoreline Analysis Report
90
wetland by the National Wetland Inventory, and approximately 75 percent of the
shoreline is within the River’s floodplain. Approximately 10 percent of the
River’s shorelines are leveed within Cowlitz County, and another unknown
portion are armored with rip-rap. Largely as a result of this armoring, as well as
the regulated water levels in the Columbia River, a mapped floodway is not
present in the assessment unit.
Priority bird species documented to use the Columbia River shorelines in
Cowlitz County include bald eagles, osprey, peregrine falcons, waterfowl
concentrations, cavity nesting ducks, Canada goose, and great blue heron.
Roosevelt Elk have been documented to use Columbia River shorelines. The
Columbia River is used by all species of salmon for rearing and migration to and
from spawning grounds.
Reach Scale Functions
In general, the islands and confluences of major river mouths with the Columbia
River provide some of the least altered shoreline habitats in the assessment unit.
Ecological vegetative and hydrologic functions remain primarily intact on Fisher
and Cottonwood Islands (Reaches 8 and 22, respectively). Both Fisher and
Cottonwood Islands are designated as Corps dredge disposal sites with
deposition areas inland of the riparian vegetation area.
WDFW has identified important habitat areas as including:
Cottonwood Island as a habitat area for Columbian white-tailed deer and
a heron rookery.
Martin Island and Burke Island support good habitat despite their
agricultural use.
A large, high-quality wetland complex near Burke Slough
Between Caples Road and Austin Point, a system of backwater sloughs
provides excellent habitat.
A robust riparian habitat area south of Austin Point (WDFW 2013a).
Other high functioning reaches include undeveloped wetland areas south of the
Cowlitz River mouth (Reach 41) and near the mouths of the Kalama (Reach 24)
and Lewis Rivers (Reach 39).

The Watershed Company and Parametrix May 2014
91
WDFW has identified important smelt spawning areas in the Columbia River in
the following areas:
From the western county line, eastward to approximately Bunker Hill
Road.
Near Barlow Point.
The mouth of the Kalama River contains documented smelt occurrences.
WDFW also owns some of this land near the Kalama River mouth.
The Lewis River, from the confluence with the Columbia River upstream
to the Merwin Dam is designated critical habitat for smelt by the National
Marine Fisheries Service (WDFW 2013a).
Lower scoring reaches in the Columbia River represent areas of intensive
transportation (Port and railroad) infrastructure with levees, overwater
structures, limited shoreline vegetation, and extensive impervious surfaces.
Industrial reaches (Reaches 9-11) and Port of Kalama (Reaches 28-30) properties
have some of the lowest vegetative and habitat scores on the Columbia River.
Table 5-6. Functional scores for reaches in Cowlitz River Assessment Unit.
Waterbody Label Hydrologic Overall
Hyporheic Overall
Habitat Overall
Vegetative Overall
Columbia River Columbia 01 2 2 3 2
Columbia River
Columbia 02 3 2 3 3
Columbia 03 3 3 3 3
Columbia 04 2 3 3 3
Columbia 05 1 2 2 2
Columbia 06 1 4 3 3
Columbia 07 1 3 4 4
Columbia 08 3 3 4 5
Columbia 09 1 3 2 2
Columbia 10 1 2 3 2
Columbia 11 2 3 1 2
Columbia 12 2 3 2 2
Columbia 13 3 4 4 3
Columbia 14 1 4 2 3
Columbia 15 1 4 2 2
Columbia 16 1 4 2 2
Columbia 17 3 4 4 4

Cowlitz County Shoreline Analysis Report
92
Waterbody Label Hydrologic Overall
Hyporheic Overall
Habitat Overall
Vegetative Overall
Columbia River
Columbia 19 3 4 4 4
Columbia 21 3 3 4 4
Columbia 22 4 4 4 4
Columbia 23 2 3 3 3
Columbia 24 3 4 4 4
Columbia 25 3 4 3 3
Columbia 26 1 3 3 2
Columbia 31 3 4 4 4
Columbia 32 2 3 3 3
Columbia 33 2 4 4 3
Columbia 34 1 3 3 2
Columbia 35 2 4 3 3
Columbia 36 1 3 3 3
Columbia 37 1 4 4 3
Columbia 38 2 4 3 3
Columbia 39 3 4 5 5
Columbia 40 4 3 4 4
Owl Creek Columbia 41 3 4 5 4
Restoration Opportunities
Habitat restoration priorities identified in the 6-year Habitat Work Schedule and
Lead Entity Strategy (2010) for the lower Columbia River and Estuary that are
applicable to potential actions within Cowlitz County shorelines include:
1. Restoring subbasin valley floodplain function and stream habitat
diversity
2. Managing forests to protect and restore watershed processes
3. Addressing immediate risks with short-term habitat fixes
The Lower Columbia River Estuary Partnership has recently updated its
Management Plan for the Lower Columbia River (LCREP), which includes
several programmatic and project recommendations (LCREP 2011).
Key actions identified by LCREP to address restoration, land use, and water
quality improvement include the following:
Identify and prioritize habitat types and attributes that should be
protected or conserved.

The Watershed Company and Parametrix May 2014
93
Protect, conserve, and enhance priority habitats, particularly wetlands, on
the mainstem of the lower Columbia River and in the estuary.
Monitor status and trends of ecosystem conditions.
Establish and maintain Columbia River flows to meet ecological needs of
the lower Columbia River and estuary.
Avoid the introduction of non-native invasive species.
Manage human-caused changes in the river morphology and sediment
distribution within the Columbia River channel to protect native and
desired species.
Develop floodplain management and shoreland protection programs.
Reduce and improve the water quality of stormwater runoff and other
non-point source pollution.
Ensure that development is ecologically sensitive and reduces carbon
emissions.
Expand and sustain regional monitoring of toxic and conventional
pollutants.
Reduce conventional pollutants.
Clean up, reduce, or eliminate toxic contaminants, particularly
contaminants of regional concern.
Provide information about the lower Columbia River and estuary that
focuses on water quality, endangered species, habitat loss and restoration,
biological diversity, and climate change to a range of users.
Create and implement education and volunteer opportunities for citizens
of all ages to engage in activities that promote stewardship of the lower
Columbia River and estuary.
Action objectives from the LCFRB (2010) are identified in Table 5-7 below.
Table 5-7. Restoration opportunities in the lower Columbia River and estuary.
Restoration Opportunity Limiting Factor Addressed Source Plan Protect existing rearing habitat to ensure no further degradation.
Availability of preferred habitat LCFRB 2010

Cowlitz County Shoreline Analysis Report
94
Restoration Opportunity Limiting Factor Addressed Source Plan Increase shallow water peripheral and side channel habitats toward historic levels.
Availability of preferred habitat; Loss of habitat connectivity
LCFRB 2010
Restore connectivity between river and floodplain, tidally influenced reaches of tributaries, as well as in-river habitats.
Loss of habitat connectivity; Microdetritus-based food web; Availability of preferred habitat
LCFRB 2010
Reduce predation mortality on emigrating juveniles.
Predation mortality LCFRB 2010
Reduce contaminant exposure of emigrating juveniles.
Contaminant exposure LCFRB 2010
Document the interaction between emigrating juvenile salmonids and introduced species; minimize negative interactions.
Interaction with introduced species
LCFRB 2010
Develop an understanding of emigrating juvenile salmonid life history diversity and habitat use in the lower mainstem, estuary, and plume.
Availability of preferred habitat; Loss of habitat connectivity; Density dependence
LCFRB 2010
Maintain favorable water flow and temperature throughout migration period.
Fitness and timing of juvenile salmonids entering the subbasin
LCFRB 2010
Reduce predation mortality on migrating adults.
Predation losses (Adults) LCFRB 2010
Protect existing spawning habitat to ensure no further net degradation.
Availability of spawning habitat LCFRB 2010
Maintain favorable water flow and temperature throughout mainstem spawning and incubation period.
Decreased flows during spawning and incubation; Dewatering of redds
LCFRB 2010
5.2.2 Land Use Characterization
Current Land Use
Figure 5-2 below illustrates land use distribution in the Columbia River
Assessment Unit in 2012. As described in Section 3.3.1, this information is
aggregated from the 2012 County Assessor’s database.

The Watershed Company and Parametrix May 2014
95
Figure 5-2. Columbia River Assessment Unit 2012 land use distribution (Source:
Cowlitz County Assessor’s Office).
Water-oriented Uses
The following discussion of water-oriented uses should not be considered
comprehensive (please see the subsection on Water-oriented uses in Section 3.3.1
for background discussion). This section only selectively identifies certain water-
dependent and water-related uses. Water-enjoyment uses are discussed in the
below section titled Existing and Potential Shoreline Public Access.
Cowlitz County shorelines along the Columbia River, specifically in the area
around Longview, are home to several major water-oriented uses.
Longview Fibre, situated to the south of the Log Pond in Reach 16, is a major
paper and packaging company. An important use of their on-site dock is to
receive wood chips that support their operations. Just downstream of Longview
Fibre, in the City of Longview, the Port of Longview recently finished
construction of a grain export terminal with an expanded pier at the grain export
terminal at Berth 9.
The Weyerhauser Longview facilities, just downstream from the Lewis and Clark
Bridge in Reaches 11 through 14, include a log export facility, barge unloading
facilities for logs and chips to serve the sawmill, as well as paper and fiber export
terminals. Upland uses include two paper mills, one sawmill, administrative
offices, and a truck maintenance facility.

Cowlitz County Shoreline Analysis Report
96
The PPG Chlor-Alkali plant produces products used by the paper industry
throughout the northwest and depends on water access both for raw materials
and shipping finished product.
Further downstream, in Reaches 9 and 10, is the Millennium Bulk Terminals
Longview (MBTL) property (Figure 5-3), which was formerly the location of an
aluminum smelter. MBTL currently operates a bulk product terminal at the site.
The bulk product terminal is used for the receipt, storage and transport of
alumina from ship to rail or truck; the transportation of coal; and the handing of
other products such as green petroleum coke and cementitious materials.
MBTL is currently proposing to construct a coal export terminal on the site. The
proposed coal export terminal would cover approximately 100 acres of the 416-
acre site. The completed coal export terminal would consist of two docks, two
shiploaders, four stockpile pads, one tandem rotary dumper, 8 rail lines, and
associated facilities, conveyors, and equipment. The two new docks would
require associated dredging. The aforementioned bulk product terminal would
remain as a separate use from the coal export terminal (JARPA, MBTL Coal
Export Terminal 2012).
Figure 5-3. Millennium Bulk Terminals Longview site (Source: Cowlitz County).

The Watershed Company and Parametrix May 2014
97
Finally, to the west of Longview is a large undeveloped tract in Reach 6 and the
Longview Yacht Club on Fisher Island Slough in Reach 6. The yacht club
provides moorage for club members.
Upstream of Longview/Kelso, the Port of Kalama maintains large industrial
tracts on both side of the mouth of the Kalama River in Reaches 25 and 26, with
dock facilities capable of serving ocean going ships. The Port also maintains
facilities within the Kalama city limits and to the south in Reach 28.
The Port of Woodlawn has two undeveloped riverfront industrial parcels at
Austin Point just west of the Lewis River in Reach 38 and at Martins Bar to the
north in Reach 35. Neither currently has dock facilities.
Transportation and Utilities
At the western side of the County, State Route 4 runs along the north side of the
Columbia River, generally within shoreline jurisdiction. To the west of
Longview, a stretch of Willow Grove Road (SR 432) lies within shoreline
jurisdiction for slightly less than two miles. State Route 433 crosses over the
Columbia River (Lewis and Clark Bridge) just west of Log Pond near Longview.
North of Kalama, I-5 runs along the Columbia River shoreline. To the west of
Woodland, Dike Road generally follows the shoreline. The Burlington Northern
Santa Fe (BNSF) Railroad also parallels I-5 and crosses each of the same
waterbodies.
BPA has a major utility crossing over the Columbia River on the south side of
Longview. However, only a very small portion of this corridor appears to be
within Cowlitz County shoreline jurisdiction. A pipeline crosses shoreline
jurisdiction near the mouth of Mill Creek.
Existing and Potential Shoreline Public Access
Several existing shoreline public access locations occur within the Columbia
River Assessment Unit. These are listed below in Table 5-8.
Table 5-8. Existing shoreline public access locations in the Columbia River Assessment Unit.
Waterbody Name Manager Description
Abernathy Creek
Abernathy Creek (Figure
5-4) WDFW
Walk-in access only. No boat launch.1 Open year-round. Although Abernathy Creek itself is
located in a different assessment unit, this public access location, per the GIS information currently available, is within the Columbia River
Assessment Unit.

Cowlitz County Shoreline Analysis Report
98
Waterbody Name Manager Description
Columbia River
Lower Columbia Water Trail
Multiple agencies:
WDFW, State of Oregon
The Lower Columbia River Water Trail web pages provides paddlers and others interested in experiencing the lower Columbia River with
information about launch and landing sites, camp sites, lodging, restaurants and grocery
stores, and sites of interest along the water trail, as well as information about paddling stewardship, safety and resources.
County Line Park
Cowlitz County
5.5-acre park on the banks of the Columbia River (approximately 3,000 feet of shoreline is accessible). Offers day use and RV and tent
camping. Features restrooms, parking, electrical hookups, picnic sites, fishing platform, trails,
and open space.
Willow Grove Park (Figure 5-
5) Cowlitz County
60-acre regional beach park on the Columbia River for day use, with approximately 4,200 feet of shoreline access. Features a four-lane boat
launch, restrooms, playground equipment, beach access, picnic shelters and tables, and a beach volleyball court. A barrier-free, asphalt
trail nearly a mile long runs parallel to the water. Woodland Bottoms2 WDFW Sand boat launch. Open year-round.
Kalama River Sportsman Club2 WDFW Sand boat launch. Open year-round.
1 The Draft Public Access map (Appendix B) currently indicates that there is a boat launch at this location; however, this is contrary to the WDFW website which does not show a WDFW Water Access Site (i.e. boat launch) on the WDFW Water Access Site Map.
2 The Draft Public Access map (Appendix B) currently indicates that there is a boat launch at this location (the “Woodland Bottoms” launch is referred to as “Woodland”), but does not show as a WDFW Water Access Site on the WDFW website.
Figure 5-4. Shoreline public access at Abernathy Creek (Source: WDFW).

The Watershed Company and Parametrix May 2014
99
Figure 5-5. Boat ramp at Willows Grove Park (Source: Cowlitz County).
Regarding potential shoreline public access, in its list of Target Projects, the
Cowlitz Parks Plan includes the following project in the Columbia River
Assessment Unit:
2020
Willow Grove Park RV and tent camping, a safe swimming area,
overnight boat moorage and marina, venue/amphitheater, windsurfing,
and supporting infrastructure.
Future Land Use
Out of the ten assessment units, the Columbia River Assessment Unit saw the
largest decrease in vacant lands (14.4 percent) over the ten-year land use analysis
period (Table 5-9). Development of vacant land occurred mostly on single family
residential lots, which includes development of new single family units and
improvements above the $10K market value threshold defining vacant land.
From 2002 to 2012, the assessment unit saw a moderate decrease in agricultural
uses (1.3 percent), which were matched by increases in single family and
transportation uses (1.4 percent each). This could be indicative of a transition
from rural/agriculture to suburban development. Additional evidence of rural to
suburban transition, is the decrease in average parcel size, from 7.7 acres to 6.5
acres (an 18.5 percent decrease), despite the increase in parcel count. The
assessment unit also saw slight decreases in diking right-of-way, forestland,
other, recreation, undeveloped, and utility (<0.8 percent each), accompanied by
slight increases in commercial and industrial uses (<0.3 percent each).

Cowlitz County Shoreline Analysis Report
100
Table 5-9. Columbia River Assessment Unit: significant land use change 2002-2012.
Category
2002 2012 Change in Percent of Total Acres
Category Acres
Percent of Total Acres
Category Acres
Percent of Total Acres
Vacant 955 ac. 38.2% 611 ac. 23.9% -14.4% Agriculture 593 ac. 23.7% 574 ac. 22.4% -1.3% Single family residential 93 ac. 3.7% 131 ac. 5.1% +1.4%
Transportation 43 ac. 1.7% 79 ac. 3.1% +1.4%
Over the eleven-year permit evaluation period, the Columbia River Assessment
Unit saw the most permit activity compared to the other assessment units. The
majority of use permits issued were associated with port and
commercial/industrial uses (Figure 5-6). No permits associated with residential
uses were issued between 2002 and 2012; however, residential permit
applications are likely to increase with the increase in single family residential
land uses observed in the comparative analysis.
Throughout the evaluation period, the most common shoreline modification
permits issued were for dredging and landfill activities (Figure 5-6). As
development in the Columbia River Assessment Unit continues, it is likely that
these will remain the most commonly permitted activities.
There are a number of large property holdings in the area along the Columbia
River with potential access to the Columbia River Navigation Channel that are
likely to be available for water-dependent industrial use in the future. There are
about 5 linear miles of industrial-zoned land, along the Columbia River, which is
vacant or redevelopable. Some, such as the Millennium site, have active pending
development applications. Others, such as the Wasser-Winters site, may have
depth and environmental constraints which limit development.
Overall, about 35 percent of the industrial-zoned land with frontage on the
Columbia River with reasonable prospects of access to the navigation channel
and therefore with the potential for water-dependent use is potentially available.
That is substantially more land than has been developed in the past 20 years.
The future demand for water-dependent uses, particularly Port use, is dependent
on a wide range of factors including world trade and competition within the US
among ports, particularly competition for Upper Midwest grain exports from
Gulf Coast ports.

The Watershed Company and Parametrix May 2014
101
Figure 5-6. Permit issuance data for Columbia River Assessment Unit (Source: Cowlitz County).
0
2
4
6
8
10
12
14
16
18
20
Nu
mb
er
of
Pe
rmit
s
Shoreline Use Permits in Columbia River Assessment Unit 2001-2011
2011
2010
2009
2008
2007
2006
2005
2004
2003
2002
2001
0
2
4
6
8
10
12
14
16
Ove
rwat
er s
tru
ctu
re(n
ew/e
xpan
ded
)
Ove
rwat
er S
tru
ctu
re(r
epla
ced
)
Bri
dge
/Cu
lver
t
Bo
at L
aun
ch
Ban
k St
abili
zati
on
Lan
dfi
ll/D
red
gin
g
Nu
mb
er
of
Pe
rmit
s
Shoreline Modification Permits in Columbia River Assessment Unit 2001-2011
2011
2010
2009
2008
2007
2006
2005
2004
2003
2002
2001

Cowlitz County Shoreline Analysis Report
102
5.3 Lewis River Assessment Unit The Lewis River Basin includes 2,288 acres of shoreline along 44 miles of
shoreline (Figure 5-7). A summary of shoreline characteristics is provided in
Table 5-1.
Figure 5-7. Map of Lewis River Basin Assessment Unit (in aqua).
5.3.1 Ecological Characterization
Critical Areas
The Lewis River shoreline area includes palustrine and riverine wetlands.
According to the NWI information, as much as 13 percent of the total shoreline
area may be wetlands. Shorelines in the lower Lewis River are lined with levees,
and levees occupy 10 percent of the total shoreline length of the Lewis River
Assessment Unit. Floodplain area is approximately 24 percent of the total
shoreline jurisdiction in the assessment unit.
Priority species include bald eagle, osprey, northern spotted owl, Townsend’s
big-eared bat, waterfowl concentrations, and cavity nesting ducks.
The Salmon and Steelhead Limiting Factors Report (Wade 2000) specifically
prioritized the following areas as critical for each priority salmon species within
the lower Lewis River.

The Watershed Company and Parametrix May 2014
103
Fall Chinook salmon: Off-Channel habitat surrounding Eagle Island; and
entire mainstem reach between Cedar Creek and Merwin Dam
Coho salmon, steelhead, and cutthroat trout: Cedar Creek watershed and
the lower reaches of Johnson, Ross, Robinson, and Colvin creeks
Coho salmon: Wetland complexes in the lower 2 miles of the South Fork
Chelatchie Creek
Chum salmon: All backwater slough areas above the Lewis River Salmon
Hatchery
WDFW has identified the following (WDFW 2013a):
The Lewis River, from the confluence with the Columbia River upstream
to Merwin Dam is designated critical habitat for smelt by the National
Marine Fisheries Service. This reach is also important spawning and
rearing habitat for fall Chinook, coho, and steelhead; it also contains the
Lewis River Hatchery.
WDFW operates a hatchery at the mouth of Speelyai Creek. The creek
serves as the water source for the hatchery. The lower reaches of Speelyai
Creek support an important Kokanee spawning area.
Reach Scale Functions
Ecological functions in the reaches in the lower Lewis River downstream from
the City of Woodland (Reaches 1-5) are significantly degraded. The shorelines in
these lower reaches are lined with levees, devoid of native vegetation, and lack
habitat complexity. Despite significant degradation of natural shoreline
functions of the lower Lewis River, the agricultural fields in the area do likely
provide winter foraging habitat for migratory birds. These reaches also
experience tidal influence from the Columbia River estuary, and therefore have
the potential to provide low energy rearing habitats for juvenile salmon,
although the lack of shoreline complexity significantly limits the realization of
such potential. As a result of their position in the lower watershed, these reaches
score highly for hyporheic functions compared to steeper and naturally confined
reaches in the upper watershed.
In contrast to the heavily modified shorelines in the lower Lewis River, the
shorelines of Lake Merwin (Reaches 27-37) and Yale Lake (Reaches 38-50)

Cowlitz County Shoreline Analysis Report
104
provide well-vegetated shoreline habitats. The community of Cougar on Yale
Lake (Reach 46) does not have direct access on the lakeshore. Although the
vegetated and habitat conditions of these reservoirs score highly, the three
mainstem dams alter the natural hydroperiod of the lakes and downstream
areas, limit longitudinal connectivity in the watershed, create fish passage
barriers, and restrict downstream transport of sediment and large woody debris.
Where human disturbance occurs in the upper Lewis River watershed, it is
typically limited in extent and associated with small tributaries or sheltered
coves. These reaches with human disturbance (for example, Reaches 29, 46, 51,
52, 54, 61 and 62) tend to have lower hydrologic scores as a result of shoreline
modifications, including overwater structures and reduced shoreline vegetation).
Lower hyporheic scores in the upper watershed tributaries (Reaches 51 through
55 and 58 through 66) are related to the steeper terrain with more confined
channels.
Table 5-10. Functional scores for reaches in Lewis River Assessment Unit.
Waterbody Label Hydrologic Overall
Hyporheic Overall
Habitat Overall
Vegetative Overall
Lewis River Lewis 01 1 3 3 3
Lewis River
Lewis 02 1 4 3 3
Lewis 03 1 3 3 2
Lewis 04 3 4 3 3
Horseshoe Lake Lewis 05 1 3 3
Lewis River
Lewis 17 2 4 2 2
Lewis 18 3 4 3 4
Lewis 19 3 2 3 4
Lewis 20 3 4 3 4
Lewis 21 3 4 4 4
Lewis 22 3 4 4 4
Lewis 23 3 4 4 4
Lewis 24 3 3 3 3
Lewis 25 3 3 4 4
Lewis 26 3 4 4 4
Lake Merwin
Lewis 27 3 3 3
Lewis 28 3 4 4
Lewis 29 2 4 4
Lewis 30 4 4 5
Lewis 31 4 4 5
Lewis 32 3 4 4
Lewis 33 3 4 4

The Watershed Company and Parametrix May 2014
105
Waterbody Label Hydrologic Overall
Hyporheic Overall
Habitat Overall
Vegetative Overall
Lewis 34 3 4 4
Lewis 35 4 3 4
Lewis 36 4 4 4
Lewis 37 5 4 4
Yale Lake
Lewis 38 4 4 4
Lewis 39 5 4 5
Lewis 40 5 4 5
Lewis 41 3 4 4
Lewis 42 3 3 3
Lewis 43 4 4 5
Lewis 44 4 4 5
Lewis 45 4 4 5
Lewis 46 3 4 3
Lewis 47 4 4 4
Lewis 48 4 4 5
Lewis 49 4 4 4
Lewis 50 5 4 5
Cape Horn Creek Lewis 51 3 2 4 4
Jim Creek Lewis 52 3 2 4 4
Rock Creek Lewis 53 3 2 4 4
Brooks Creek Lewis 54 2 2 4 4
Speelyai Creek
Lewis 55 3 3 4 5
Lewis 56 3 4 4 5
Lewis 57 3 4 4 5
Lewis 58 3 2 4 4
Speelyai Creek, U T Lewis 59 3 2 4 4
Speelyai Creek, W F Lewis 60 3 2 4 4 Speelyai Creek Diversion Ditch Lewis 61 2 3 4 4
Dog Creek Lewis 62 2 2 4 5
Cougar Creek Lewis 63 3 2 4 4
Lewis 64 3 2 4 4
Panamaker Creek Lewis 65 3 2 4 4
Glacial runoff, unnamed Lewis 66 2 2 3 3
Restoration Opportunities
The Salmon and Steelhead Limiting Factors report for WRIA 27 (Wade 2000)
identifies the Lewis River dam network as the primary limiting factor for
salmonid habitat in this area. Planned and ongoing actions by PacifiCorp to

Cowlitz County Shoreline Analysis Report
106
mitigate for impacts to fish passage and habitat alterations will be significant to
maintain and improve shoreline functions in the Lewis River.
In addition to addressing dam management, other key strategies for restoring the
Lewis River subbasin include restoring floodplain connections and instream
habitat complexity and improving riparian habitat. In the upper basin,
restoration should address agricultural and forestry impacts to stream corridors
(LCFRB, 2010). A summary of priority restoration opportunities is provided in
Table 5-11.
Table 5-11. Restoration opportunities in the North Fork Lewis River.
Action Status Entity Source Plan/ ID
Manage regulated stream flows to provide for critical components of the natural flow regime
Expansion of existing program or activity
PacifiCorp, Cowlitz County PUD, FERC, WDFW, NMFS, USFWS
LCFRB 2010, L-Lew 1
Conduct floodplain restoration where feasible along the mainstem and in major tributaries that have experienced channel confinement. Build partnerships with landowners and agencies and provide financial incentives
New
NRCS, C/WCD, CCD, NGOs, WDFW, LCFRB, Corps, LCFEG
LCFRB 2010, L-Lew 4
Address water quality issues through the development and implementation of water quality clean-up plans (TMDLs)
Expansion of existing program or activity
Ecology LCFRB 2010, L-Lew 17
Limit intensive recreational use of the mainstem Lewis during critical periods
Expansion of existing program or activity
Cowlitz County, WDFW
LCFRB 2010, L-Lew 18
5.3.2 Land Use Characterization
Current Land Use
The chart below illustrates land use distribution in the Lewis River Assessment
Unit in 2012.

The Watershed Company and Parametrix May 2014
107
Figure 5-8. Lewis River Assessment Unit 2012 land use distribution (Source: Cowlitz County Assessor’s Office).
Water-oriented Uses
The following discussion of water-oriented uses should not be considered
comprehensive (please see the subsection on Water-oriented uses in Section 3.3.1
for background discussion). This section only selectively identifies certain water-
dependent and water-related uses. Water-enjoyment uses are discussed in the
below section titled Existing and Potential Shoreline Public Access.
Dams, a water-dependent use, are defining features of the Lewis River
Assessment Unit. This assessment unit includes three major dams: Merwin, Yale,
and Swift No. 2. Additionally, a fourth major dam, Swift No. 1, is located just
outside the assessment unit in Skamania County. Merwin, Yale, and Swift No. 1
are owned and operated by PacifiCorp. Swift No. 2 is owned by Cowlitz County
PUD No. 1 and is operated in coordination with the other projects by PacifiCorp.
Built in 1958, the 512-foot Swift No. 1 (FERC No. 2111) has a capacity of 240
megawatts. The Swift Reservoir it creates is 4,600 acres. The discharge from Swift
No. 1 enters a canal that transports the water through the 70-megawatt Swift No.
2 (FERC NO. 2213). Completed in 1953, the 323-feet Yale dam (FERC No. 2071)
has a capacity of 134 megawatts. Yale dam creates a 3,780-acre reservoir known
as Yale Lake. In service since 1931, the 313-feet-high Merwin dam (FERC No.

Cowlitz County Shoreline Analysis Report
108
935) has a generating capacity of 136 megawatts. It creates Merwin Lake, a 4,040-
acre impoundment.
Several fish hatcheries, also water-dependent uses, are located along the Lewis
River. Speelyai Hatchery, in Speelyai Bay on Merwin Lake, is owned and funded
by Pacificorp and Cowlitz PUD as mitigation for the loss of fish habitat on the
North Fork Lewis River due to the construction of the four hydroelectric dams.
Just below Merwin dam is the Merwin Fish Hatchery. Started in 1993, it is one of
the newest fish hatcheries in Washington State. It was constructed by PacifiCorp
to mitigate for fish losses resulting from construction and operation of the
Merwin Hydroelectric project. Downstream of the Merwin Fish Hatchery is the
Lewis River Hatchery. The Lewis River Hatchery serves to replace fish lost due
to land development and the construction of the four hydroelectric projects. The
Lewis River Hatchery is currently fully funded by PacifiCorp as mitigation for
lost fish habitat.
Other water-related uses include boat storage facilities (e.g. Lewis River Storage).
Transportation and Utilities
State Route 503 generally runs along the north side of Lewis River in this
assessment unit (Figure 5-9). However, SR 503 is typically located outside of
shoreline jurisdiction. A limited number of local or private roads provide access
to properties in shoreline jurisdiction. I-5 crosses over the Lewis River just south
of Woodland.
A BPA utility corridor transects shoreline jurisdiction at NE Happa Road, just
east of the Lewis River Golf Course. A pipeline transects shoreline jurisdiction
near to the east of Kuhnis Road, to the south of Woodland.
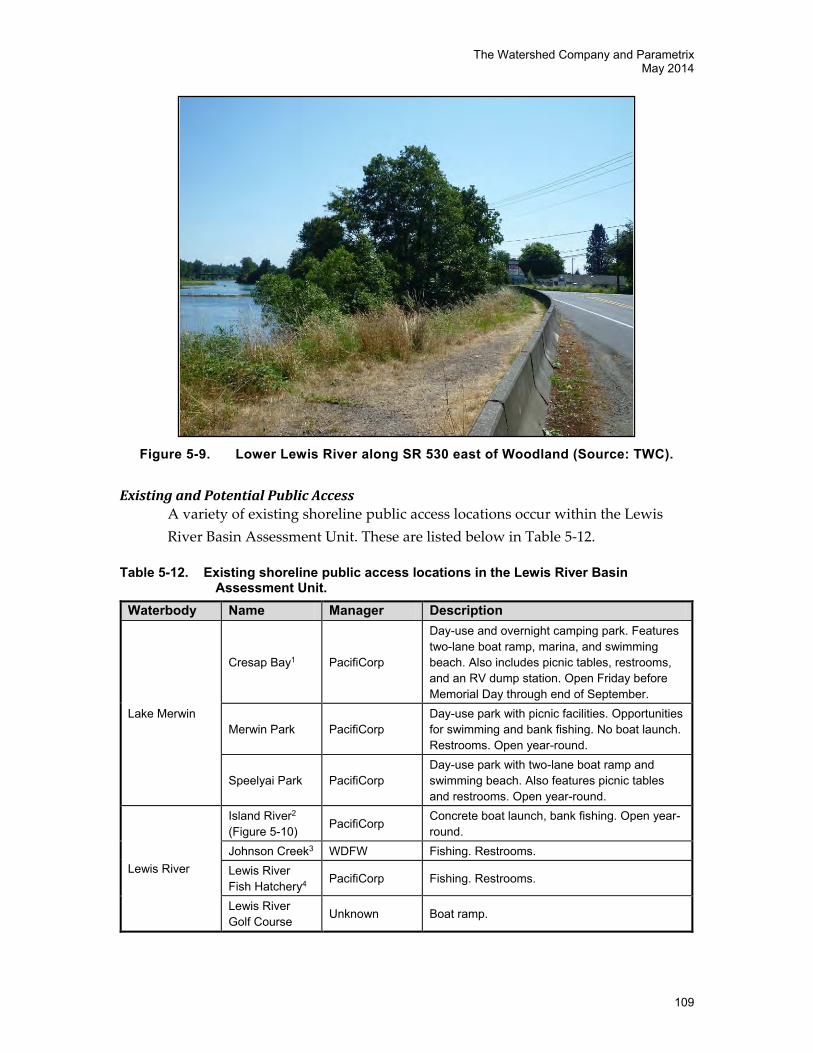
The Watershed Company and Parametrix May 2014
109
Figure 5-9. Lower Lewis River along SR 530 east of Woodland (Source: TWC).
Existing and Potential Public Access
A variety of existing shoreline public access locations occur within the Lewis
River Basin Assessment Unit. These are listed below in Table 5-12.
Table 5-12. Existing shoreline public access locations in the Lewis River Basin Assessment Unit.
Waterbody Name Manager Description
Lake Merwin
Cresap Bay1 PacifiCorp
Day-use and overnight camping park. Features two-lane boat ramp, marina, and swimming beach. Also includes picnic tables, restrooms, and an RV dump station. Open Friday before Memorial Day through end of September.
Merwin Park PacifiCorp Day-use park with picnic facilities. Opportunities for swimming and bank fishing. No boat launch. Restrooms. Open year-round.
Speelyai Park PacifiCorp Day-use park with two-lane boat ramp and swimming beach. Also features picnic tables and restrooms. Open year-round.
Lewis River
Island River2 (Figure 5-10) PacifiCorp
Concrete boat launch, bank fishing. Open year-round.
Johnson Creek3 WDFW Fishing. Restrooms. Lewis River Fish Hatchery4 PacifiCorp Fishing. Restrooms.
Lewis River Golf Course Unknown Boat ramp.

Cowlitz County Shoreline Analysis Report
110
Waterbody Name Manager Description
Martin5 WDFW Concrete boat launch, bank fishing. Restrooms. Open year-round.
Merwin Hatchery2 PacifiCorp
Boat ramp. Fishing opportunities. Also features picnic facilities and restrooms.
Yale Lake
Beaver Bay Camp PacifiCorp
Day-use and overnight camping park. Features single-lane boat ramp, swimming beach. Restrooms. Open Friday, before the last Saturday in April (when fishing starts), through the end of September.
Cougar Camp1 PacifiCorp
Day-use and overnight camping park. Features boat ramp, swimming beaches, and picnic area. Restrooms. Open Memorial Day weekend until Labor Day.
Saddle Dam PacifiCorp
Day use park with two-lane boat ramp and shoreline picnic area. Restrooms. Open Friday before Memorial Day through end of September.
Yale Park (Figure 5-11) PacifiCorp
Day-use park with four-lane boat ramp, picnic tables, and swimming beaches. Restrooms. Open year-round.
1 The Draft Public Access map currently does not show the park, just the boat ramp. The park is depicted on the WDFW website.
2 The Draft Public Access map currently indicates that there is a boat launch at this location (the “Island River” launch is referred to as “Lewis River - Island,” the “Merwin Hatchery” launch is referred to as “Merwin”), but does not show as a PacifiCorp River Access Site.
3 The Draft Public Access map currently does not show this WDFW Water Access Site.
4 The Draft Public Access map currently indicates that there is a boat launch at this location; however, this is contrary to the PacifiCorp website for this PacifiCorp River Access Site. Map does not show as a PacifiCorp River Access Site.
5 The Draft Public Access map currently indicates that there is a boat launch at this location (the “Martin” launch is referred to as “End of South Pekin Road”), but does not show as a WDFW Water Access Site.
Figure 5-10. Shoreline public access at Island River (Source: WDFW).

The Watershed Company and Parametrix May 2014
111
Figure 5-11. Public boat launch and parking lot at Yale Park (Source: TWC).
Potential shoreline public access for this assessment is primarily addressed in the
Draft Recreation Resource Management Plan for the Lewis River Hydroelectric
Projects (EDAW, Inc. & PacifiCorp 2004). This document includes many public
access projects, including new trails, boat launch improvements, ADA
accessibility projects, campground upgrades, and more.
Future Land Use
This unit saw a significant decrease in forestland (6.0 percent), the largest
decrease across all assessment units (Table 5-13). This decrease contributed to
increases in vacant lands (0.7 percent) and recreational uses (3.0 percent), which
resulted from reclassification of large tracts of forestland (>50 acres to
undeveloped and >65 acres to recreation) between 2002 and 2012. Moderate
increases were observed in single family residential (1.8 percent) and
undeveloped land (1.8 percent), with lesser increases in commercial, diking right-
of-way, and other (<0.4 percent each). Agriculture, open space,
public/education/assembly, and utilities decreased slightly by <0.3 percent each.
Some subdivision of parcels was evidenced by the increase in parcel count and
decrease in average parcel size from 4.3 acres to 3.8 acres (a 13.2 percent
decrease). This may be partially attributed to subdivision of forestland that
occurred before reclassification to other uses.

Cowlitz County Shoreline Analysis Report
112
Table 5-13. Lewis River Assessment Unit: significant land use change 2002-2012.
Category
2002 2012 Change in Percent of Total Acres
Category Acres
Percent of Total Acres
Category Acres
Percent of Total Acres
Vacant 212 ac. 9.9% 187 ac. 8.4% -1.5% Forestland 574 ac. 26.9% 462 ac. 20.8% -6.0% Recreation 99 ac. 4.6% 169 ac. 7.6% +3.0%
Throughout the permit evaluation period, issuance of use permits in this
assessment unit was infrequent in all land use categories, aside from “other,”
which averaged nearly one permit per year (Figure 5-12). Permits falling in the
“other” category include dam improvement projects, parks improvements, fish
hatchery improvements, and other general permits. Slightly more permits were
issued in 2010 and 2011, the last two years of the evaluation period. These
represent the only years where more than one permit was issued in a single land
use category in a given year (two residential permits in 2012 and three “other“
permits in 2011).
In addition to the to-be-developed shoreline master program update, much of
the upper Lewis watershed is also owned, managed, and/or regulated by
PacifiCorp. The PacifiCorp Shoreline Management Plan parallels a municipal
Shoreline Management Program. The plan identifies three shoreline
classifications: Integrated Use, Project Works, and Resource Management. The
majority of shoreline area is designated as Resource Management classification,
in which docks, hard shoreline stabilization, and dredging are all prohibited.
Based on past land use changes, permit history, and the existing regulatory
framework in the Lewis River Assessment Unit, future land use changes that
may be anticipated include a gradual shift from forestland to residential
development in the lower watershed, and continued recreational development
and conservation activities in the upper watershed.

The Watershed Company and Parametrix May 2014
113
Figure 5-12. Permit issuance data for Lewis River Assessment Unit (Source: Cowlitz County).
5.4 Kalama River Assessment Unit The Kalama River Assessment Unit includes 4,054 acres along 115.8 miles of
shoreline (Figure 5-13). A summary of shoreline characteristics is provided in
Table 5-1.
0123456789
1011
Shoreline Use Permits in Lewis River Assessment Unit 2001-2011
2011
2010
2009
2008
2007
2006
2005
2004
2003
2002
2001
0
1
2
3
4
5
Ove
rwat
er s
tru
ctu
re(n
ew/e
xpan
de
d)
Ove
rwat
er s
tru
ctu
re(r
epla
ced
)
Bri
dge
/Cu
lver
t
Bo
at L
aun
ch
Ban
k St
abili
zati
on
Lan
dfi
ll/D
red
gin
g
Shoreline Modification Permits in Lewis River Assessment Unit 2001-2011
2011
2010
2009
2008
2007
2006
2005
2004
2003
2002
2001

Cowlitz County Shoreline Analysis Report
114
Figure 5-13. Map of Kalama River Basin Assessment Unit (in brown).
5.4.1 Ecological Characterization
Critical Areas
The Kalama River shoreline area includes extensive palustrine and riverine tidal
channels. According to the NWI information, as much as 11 percent of the total
shoreline area may be wetlands. Many of these wetlands likely fall within the
River’s floodplain, which occupies 19 percent of shoreline jurisdiction in the
assessment unit.
In addition to listed and priority salmonids, priority species in the Kalama River
Assessment Unit include bald eagles, northern spotted owls, cavity nesting
ducks, waterfowl concentrations, and elk.
The Salmon and Steelhead Limiting Factors Report (Wade 2000) specifically
prioritized the following areas as critical for each threatened salmonid species
within the Kalama River subbasin.
Fall Chinook salmon and chum salmon: Mainstem Kalama between
Lower Kalama Falls (RM 10) to around Modrow Bridge (RM 2.4)
Winter steelhead: Upper mainstem Kalama River (RM 10 to RM 35)
Coho salmon: Tributaries below Lower Kalama Falls and any remaining
off-channel habitat

The Watershed Company and Parametrix May 2014
115
Summer steelhead: Five tributaries, Gobar Creek, Wildhorse Creek, North
Fork Kalama, Langdon Creek, and Lakeview Peak Creek, and the upper
mainstem Kalama River
Reach Scale Functions
Scores for hydrologic, habitat, vegetative, and hyporheic functions are
consistently higher functioning throughout the Kalama River basin compared to
other assessment units in the County. These scores are related to the forested
condition of the assessment unit, owing to the fact that approximately 96 percent
of the Kalama River Watershed is managed for forest production.
The lower Kalama River has the most impaired functions in the assessment unit.
A study of the lower 10 miles of the Kalama River, encompassing Shoreline
Reaches 01 to 19, conducted in Phase II of the LCFRB Watershed Assessment
Project (R2 and MBI 2004) found that natural geomorphic processes are severely
limited in the lower Kalama River. These processes are impaired by armoring
and levees that cover the majority of the shoreline length; much of the armoring
is designed to protect Kalama River Road, which parallels the lower Kalama
River. As a result of development and channelization of the river the density of
large woody debris is poor in the lower River. Incomplete armoring data for the
functional analysis means that armored shorelines were not incorporated into the
functional scoring for the lower Kalama River. Therefore, the reported scores are
likely skewed slightly higher than expected.
In the upper watershed, logged areas score lower for vegetative functions,
although where clear-cut boundaries extend to the edge of shoreline jurisdiction,
these areas are not reflected in the reach score (an example is Reach 27, which
shows high reach scores despite a large clear-cut adjacent to shoreline
jurisdiction).
In smaller tributaries, hyporheic functions score poorly compared to the
mainstem river functions because of the steeper terrain and sediment
composition. In several of the smaller tributaries, including Elk Creek (Reach 37)
and Wolf Creek (Reach 38), areas of forest harvest occur on both sides of a
stream, and vegetated buffers are smaller compared to the mainstem Kalama,
resulting in a more direct impact (i.e. lower scores) to shoreline scores and
functions.

Cowlitz County Shoreline Analysis Report
116
The area surrounding Merrill Lake (Reaches 48-52) is primarily undeveloped;
however, the steep slopes and unstable soils surrounding the Lake limit its
hydrologic scores. Logging in upslope areas likely has the most significant
impact on water quality and habitat functions in Merrill Lake.
Table 5-14. Functional scores for reaches in Kalama River Assessment Unit.
Waterbody Reach Number
Hydrologic Overall
Hyporheic Overall
Habitat Overall
Vegetative Overall
Kalama River
Kalama 01 3 4 3 4
Kalama 02 1 4 4 3
Kalama 03 3 5 4 5
Kalama 07 3 4 4 5
Kalama 10 3 4 4 5
Kalama 12 3 3 4 4
Kalama 13 3 2 3 4
Kalama 14 3 4 3 4
Kalama 15 3 4 4 4
Kalama 16 3 3 4 4
Kalama 17 4 3 4 4
Kalama 18 3 3 4 4
Kalama 19 3 3 4 4
Kalama 20 3 4 4 4
Kalama 21 4 3 4 4
Kalama 22 4 3 4 4
Kalama 23 3 3 4 4
Kalama 24 3 2 4 4
Kalama 25 4 2 4 4
Kalama 26 4 3 4 4
Kalama 27 4 3 4 5
Kalama 28 4 2 4 4
Kress Lake Kalama 30 3 4 4
Little Kalama River Kalama 31 4 4 4 4
Wild Horse Creek Kalama 32 3 2 4 4
Gobar Creek Kalama 33 3 2 4 4
Bear Creek (3) Kalama 34 2 2 4 3
Arnold Creek Kalama 35 3 2 4 4
Jacks Creek Kalama 36 3 2 4 4
Elk Creek Kalama 37 3 2 4 4
Wolf Creek Kalama 38 3 2 4 4
Langdon Creek Kalama 39 4 2 4 4

The Watershed Company and Parametrix May 2014
117
Waterbody Reach Number
Hydrologic Overall
Hyporheic Overall
Habitat Overall
Vegetative Overall
Kalama River, N F Kalama 40 4 2 4 4
Kalama River, U T Kalama 41 3 2 4 3
Fossil Creek Kalama 42 4 2 4 4
Kalama 43 3 2 4 3
Fossil Creek, U T
Kalama 44 3 2 4 4
Kalama 45 4 2 4 4
Dryer Glacier Kalama 46 3 2 4 5
Dry Creek Kalama 47 3 2 4 4
Merrill Lake
Kalama 48 3 4 4
Kalama 49 3 4 4
Kalama 50 4 4 4
Kalama 51 3 4 4
Kalama 52 4 4 4
Restoration Opportunities
Priority actions to improve the Kalama River basin for salmonid recovery include
managing forest lands and land development to conserve and restore watershed
processes. Fish passage barriers are also important consideration in watershed
management.
The following actions were proposed to restore and enhance shoreline functions
in the Kalama River (Table 5-15). This table includes specific actions prioritized
for salmon recovery in a 2009 study of the lower 2.5 miles of the Kalama River
(Powers and Tyler 2009).
Table 5-15. Restoration opportunities in the Kalama River.
Action Status Entity Source Plan/ ID
Fully implement and enforce the Forest Practices Rules (FPRs) on private timber lands in order to afford protections to riparian areas, sediment processes, runoff processes, water quality, and access to habitats
Currently in place WDNR LCFRB 2010,
KAL 1
Conduct floodplain restoration where feasible along the lower mainstem that has experienced channel confinement. Build partnerships with the Port of Kalama and other landowners and provide financial incentives
New
NRCS, C/W CD, NGOs, WDFW, LCFRB, Corps, Port of Kalama
LCFRB 2010, Kal 5

Cowlitz County Shoreline Analysis Report
118
Action Status Entity Source Plan/ ID
Assess, upgrade, and replace on-site sewage systems that may be contributing to water quality impairment
Expansion of existing program
Cowlitz County, C/W CD
LCFRB 2010, Kal 15
Address potential low-flow and thermal passage problems on the bar at the mouth of the Kalama
New Port of Kalama Wade 2000
Assess and look for solutions to gravel and debris buildup near the mouths of tributaries in the upper river
New Cowlitz County Wade 2000
Look for opportunities to increase and enhance off-channel and rearing habitat within the lower Kalama River
New Cowlitz County Wade 2000
Ledgett Groundwater Channel, Left bank at RM 2.5. Create 10,400 square meters of year round rearing habitat with a potential for some spawning habitat.
New TBD Powers and Tyler,2009
Port of Kalama Groundwater Channel, Right bank at RM 2.2. Create off-channel rearing habitat. New Port of Kalama Powers and
Tyler,2009 GW Channel System (private), Right bank at RM 2.1
New TBD Powers and Tyler,2009
Riprap Removal/Floodplain Reconnection, Right bank at RM 2.4
New TBD Powers and Tyler,2009
Pipeline Removal and LWD, Left bank at RM 2.2 New TBD Powers and Tyler,2009
WDFW Tidal and Groundwater Channels, Right bank at RM 0.7. Create off-channel rearing habitat.
New WDFW Powers and Tyler,2009
Low Water Fish Passage, Left bank at RM 0 New TBD Powers and Tyler,2009
Groundwater Channel, Left bank at RM 1.4 New TBD Powers and Tyler,2009
Active Side Channel, Right bank at RM 1.8 New TBD Powers and Tyler,2009
Port Tidal and Backwater Channels, Left bank at RM 0.1 New Port of Kalama
Powers and Tyler,2009
Spencer Creek Riparian and LWD at RM 0.5. Restore riparian, spawning, and rearing habitat. The mouth of Spencer Creek is at Kalama RM 1.8
New TBD Powers and Tyler,2009
Fish Passage Culvert, Spencer Creek at RM 1.8 New TBD Powers and Tyler,2009
5.4.2 Land Use Characterization
Current Land Use
The chart below illustrates land use distribution in the Kalama River Assessment
Unit in 2012.

The Watershed Company and Parametrix May 2014
119
Figure 5-14. Kalama River Assessment Unit 2012 land use distribution (Source:
Cowlitz County Assessor’s Office).
Water-oriented Uses
The following discussion of water-oriented uses should not be considered
comprehensive (please see the subsection on Water-oriented uses in Section 3.3.1
for background discussion). This section only selectively identifies certain water-
dependent and water-related uses. Water-enjoyment uses are discussed in the
below section titled Existing and Potential Shoreline Public Access.
The Kalama River Assessment Unit includes two fish hatcheries. Constructed in
1958, Kalama Falls Hatchery is a Columbia River Fish Development program
hatchery, authorized under the Mitchell Act and funded through National
Marine Fisheries Service. Downstream of the Kalama Falls Hatchery is the Fallert
Creek Hatchery, a state-funded hatchery that began operation in 1895.
Transportation and Utilities
On the north side of the Kalama River, the aptly named Kalama River Road
closely follows the watercourse, often in shoreline jurisdiction, until the road’s
terminus near Gobar Creek. On the south side of the river, Bates Road runs along
the shoreline for less than one mile. Besides these two roads, other roads in this
assessment unit tend to transect shoreline jurisdiction. To the east of Gobar
Creek, few roads exist.
Approximately 0.6 miles east of Wooden Bridge Road, a BPA utility corridor
transects shoreline jurisdiction. A pair of pipelines transect shoreline jurisdiction
to the east of I-5.

Cowlitz County Shoreline Analysis Report
120
Existing and Potential Shoreline Public Access
Existing shoreline public access locations within the Kalama River Assessment
Unit are listed below in Table 5-16.
Table 5-16. Existing shoreline public access locations in the Kalama River Assessment Unit.
Waterbody Name Manager Description
Kalama River
Beginners Hole1 (Figure 5-15) WDFW
Platform. No boat launch. Restrooms. Open year-round. Site is located just over a mile east of the City of Kalama.
Lower Kalama River2 WDFW Gravel boat launch, bank fishing. Open year-round.
Mahaffey’s Campground Private Boat ramp available.
Modrow Bridge2 WDFW Concrete boat launch, bank fishing. Restrooms. Open year-round.
Pritchard’s2 (Figure 5-16)
WDFW Gravel boat ramp (hand-launch only). Limited parking. Open year-round.
Upper Kalama2 WDFW Concrete boat ramp (recommended for drift boats only because the ramp silts up). Open year-round.
Lake Merrill Lake Merrill3 WDNR
This 114-acre Natural Resource Conservation Area consists of a forested area along the Lake Merrill shoreline. Includes a boat launch and a newly renovated small campground area (mostly walk-in, with a few sites accessible by vehicle).
1 The Draft Public Access map (Appendix B) currently does not show this WDFW Water Access Site.
2 The Draft Public Access map currently indicates that there is a boat launch at this location, but does not show as a WDFW Water Access Site.
3 The Draft Public Access map currently does not show NRCA, just the boat ramp.
Figure 5-15. Shoreline public access at Beginners Hole (Source: WDFW).

The Watershed Company and Parametrix May 2014
121
Figure 5-16. Shoreline public access at Pritchard’s (Source: WDFW).
No long range plans were found regarding future changes or modifications to
shoreline public access in this assessment unit other than increased public access
needs are noted in the County Parks Plan (2010). WDFW is in the process of
upgrading the boat ramp and associated facilities at the Modrow Bridge access
location.
Future Land Use
Aside from South Fork Chehalis River, this assessment unit experienced the least
change in land use over the last decade (Table 5-17). The largest change was a
modest decrease in forestland (1.5 percent, about 35 acres). Slight increases in
single family residential and undeveloped land (0.5 percent and 0.6 percent,
respectively) were observed, along with an overall decrease in vacant land (0.6
percent). Commercial and fishing activity uses also increased by 0.1 percent
each.
Table 5-17. Kalama River Assessment Unit: significant land use change 2002-2012.
Category
2002 2012 Change in Percent of Total Acres
Category Acres
Percent of Total Acres
Category Acres
Percent of Total Acres
Vacant 216 ac. 5.5% 194 ac. 4.9% -0.6% Forestland 2,950 ac. 75.4% 2,917 ac. 74.1% -1.5% Single family residential 193 ac. 4.9% 213 ac. 5.4% +0.5% Undeveloped 657 ac. 16.8% 684 ac. 17.4% +0.6%

Cowlitz County Shoreline Analysis Report
122
Issuance of use permits in the Kalama River Assessment Unit was fairly
consistent over the period studied (Figure 5-17). Use permits were issued
equally across land uses, with the most recent permits issued to port and “other”
uses (both in 2010). Modification permits issued averaged one permit every two
years.
If the rate of land use change and permit activity observed in this analysis
continues, significant shifts in level or intensity of development is not anticipated
within this assessment unit.
Figure 5-17. Permit issuance data for Kalama River Assessment Unit (Source:
Cowlitz County).
0
1
2
3
4
5
Shoreline Modification Permits in Kalama River Assessment Unit 2001-2011
2011
2010
2009
2008
2007
2006
2005
2004
2003
2002
2001
0
1
2
3
4
Ove
r w
ater
str
uct
ure
(new
/exp
and
ed
)
Ove
rwat
er S
tru
ctu
re(r
epla
ced
)
Bri
dge
/Cu
lver
t
Bo
at L
aun
ch
Ban
k St
abili
zati
on
Lan
dfi
ll/D
red
gin
g
Shoreline Modification Permits in Kalama River Assessment Unit 2001-2011
2011
2010
2009
2008
2007
2006
2005
2004
2003
2002
2001

The Watershed Company and Parametrix May 2014
123
5.5 Cowlitz River Assessment Unit The Cowlitz River watershed includes 379.5 miles of shoreline, divided among
the Cowlitz River, Toutle River, and Coweeman River and their tributaries, as
well as Silver Lake, Castle Lake, Coldwater Lake, and Fawn Lake (Figure 5-18).
The total shoreline area is 16,230 acres, the largest assessment unit in the County.
A summary of shoreline characteristics in the assessment unit is provided in
Table 5-1.
Figure 5-18. Map of Cowlitz River Assessment Unit (in purple).
5.5.1 Ecological Characterization
Critical Areas
According to the NWI information, as much as 30 percent of the total shoreline
area on the Cowlitz River may be wetlands. Approximately 33 percent of
shoreline jurisdiction falls within the floodplain. The Cowlitz Assessment Unit
has the highest proportion of shoreline area in landslide hazard areas (10
percent) compared to other assessment units in the County.
Priority bird species in the Cowlitz Assessment Unit include bald eagles, osprey,
cavity nesting ducks, and waterfowl concentrations.
Reach Scale Functions
Cowlitz River Shoreline Reaches 9-13, north of the City of Kelso, score lower for
hydrologic, hyporheic, habitat, and vegetative scores compared to other reaches
in the Cowlitz Assessment Unit. The Cowlitz River is artificially constrained by
levees in these reaches and shoreline vegetation is limited, except in Reach 11,

Cowlitz County Shoreline Analysis Report
124
where patchy scrub shrub and forested vegetation occurs paralleling the
interstate. WDFW has identified the tidal flat between the mainland and the
peninsula south of Highway 432, south of the Log Pondas excellent off-channel
habitat. It is a protected backwater that is less prone to sedimentation from the
volcanic ash that affects many other areas of the system.
In contrast to the artificially confined reaches in the lower Cowlitz River, Reaches
29-31 on the Cowlitz River, near the northern County border, occur on a broad
floodplain with significant riparian wetland areas. Functional scores in these
reaches are amongst the highest for Cowlitz River reaches.
Undeveloped reaches of Silver Lake (Cowlitz Reaches 104, 106-110, 113-116) have
high hydrologic, vegetated, and habitat functions resulting from the large areas
of relatively undisturbed forested and shrub wetlands. This is in contrast to the
more highly developed reaches along Silver Lake (Cowlitz Reaches 105, 111, and
112), which have a high density of overwater structures and other shoreline
modifications. The community of Silver Lake (Reach 110) has 83 single family
lots fronting on the lake and sloughs with minimal setbacks and vegetated
buffers and with docks on most lots where lake depth is sufficient for vessels.
Reaches in the North Fork Toutle River and upper South Fork Toutle River
scored poorly for hydrologic functions (Reaches 89-102). Both rivers still
maintain an extremely high sediment load resulting from the 1980 eruption of
Mount St. Helens, particularly on the North Fork Toutle River upstream of the
Corps’ Sediment Retention Structure. The high sediment load has resulted in a
broadly braided and frequently migrating channel that responds to episodic,
flow-mediated sediment fluxes. This area is referred to as the sediment plain.
Because these braided channels each convey a relatively small portion of the total
flow and because each channel is wide relative to its depth, the sediment plain
can act as a fish barrier, preventing upstream migrations during low flow
conditions (AMEC 2010). As a result of the recent channel migrations, the
mapped channel is a small portion of the total channel area, and despite few
human impacts, riparian vegetation is limited within the mapped area of
shoreline jurisdiction. Downstream from the confluence of the Green River
(Cowlitz Reaches 89-90), the North Fork Toutle River maintains high sediment
loads, but the channel path is more defined, and the sediment has formed
sandbars with early floodplain forests; which will likely support a source of
future large woody debris recruitment when the channel shifts course.

The Watershed Company and Parametrix May 2014
125
WDFW has noted that the South Fork Toutle was less impacted by the eruption
of Mt. St. Helens, has largely intact habitat, and remains an important system
particularly for wild steelhead, coho, and fall Chinook.
Reaches on the Green River (Cowlitz Reaches 133-134) and its tributary, Devils
Creek (Cowlitz Reach 135), scored highly for vegetative functions. The area is in
private ownership and used primarily for timber harvest.
With the exception of the Town of Ryderwood, where residential development
has resulted in limited vegetation along Campbell Creek (Cowlitz Reach 155),
functional scores for vegetation and habitat are relatively high on Campbell
Creek (Cowlitz Reaches 153, 154, and 156) and Stillwater Creek (Cowlitz Reaches
151-152) near the northern border of the County.
Table 5-18. Functional scores for reaches in Cowlitz River Assessment Unit.
Waterbody Label Hydrologic
Overall Hyporheic
Overall Habitat Overall
Vegetative Overall
Cowlitz River
Cowlitz 001 3 4 4 4 Cowlitz 009 1 3 4 3 Cowlitz 010 1 2 2 2 Cowlitz 011 2 3 3 3 Cowlitz 012 1 2 2 2 Cowlitz 013 1 3 3 2 Cowlitz 014 1 3 4 3 Cowlitz 015 3 4 4 4 Cowlitz 016 3 4 4 4 Cowlitz 017 2 3 4 3 Cowlitz 024 2 3 4 3 Cowlitz 025 3 3 3 4 Cowlitz 026 3 3 3 4 Cowlitz 027 3 2 3 3 Cowlitz 028 3 3 4 4 Cowlitz 029 3 4 4 4 Cowlitz 030 3 4 4 4 Cowlitz 031 3 4 4 4
Coweeman River
Cowlitz 047 3 4 4 4 Cowlitz 048 3 4 4 4 Cowlitz 049 4 3 4 4 Cowlitz 050 4 3 4 4 Cowlitz 051 3 3 4 5 Cowlitz 052 3 2 4 4 Cowlitz 053 4 3 4 5

Cowlitz County Shoreline Analysis Report
126
Waterbody Label Hydrologic
Overall Hyporheic
Overall Habitat Overall
Vegetative Overall
Cowlitz 054 4 3 4 5 Cowlitz 055 3 3 4 4 Cowlitz 056 3 3 4 4 Cowlitz 057 4 3 4 4 Cowlitz 058 3 4 4 5 Cowlitz 059 3 5 4 5 Cowlitz 060 3 3 4 5
Goble Creek Cowlitz 061 3 3 4 4
Cowlitz 062 3 2 4 4
Goble Creek, N F Cowlitz 063 3 3 4 4 Cowlitz 064 3 2 4 4
Mulholland Creek Cowlitz 065 3 2 4 4 Baird Creek Cowlitz 066 3 2 4 4 Coweeman River, U T Cowlitz 067 3 2 4 4
Ostrander Creek Cowlitz 068 3 3 4 4 Cowlitz 069 3 3 4 5
Ostrander Creek, S F Cowlitz 070 3 2 4 4 Salmon Creek Cowlitz 071 3 3 3 3
Arkansas Creek
Cowlitz 073 4 2 3 4 Cowlitz 075 3 4 4 4 Cowlitz 076 3 2 4 4
Delameter Creek Cowlitz 077 3 3 4 4
Monahan Creek Cowlitz 078 3 2 4 4 Cowlitz 079 3 2 4 4
Toutle River
Cowlitz 080 3 3 3 4 Cowlitz 081 2 3 3 3 Cowlitz 082 3 2 4 4 Cowlitz 083 4 2 4 4 Cowlitz 084 3 1 4 4 Cowlitz 085 3 2 3 3 Cowlitz 086 3 3 4 4 Cowlitz 087 3 2 4 4 Cowlitz 088 3 2 4 4
Toutle River, N F
Cowlitz 089 3 3 4 4 Cowlitz 090 3 3 4 4 Cowlitz 091 2 2 4 3 Cowlitz 092 2 2 3 2 Cowlitz 093 2 2 4 3 Cowlitz 094 2 2 3 3

The Watershed Company and Parametrix May 2014
127
Waterbody Label Hydrologic
Overall Hyporheic
Overall Habitat Overall
Vegetative Overall
Toutle River, S F
Cowlitz 095 3 2 4 4 Cowlitz 096 3 3 4 5 Cowlitz 097 3 3 4 4 Cowlitz 098 3 3 4 4 Cowlitz 099 4 3 4 4 Cowlitz 100 3 3 4 5 Cowlitz 101 2 3 3 3 Cowlitz 102 2 1 4 3
Outlet Creek Cowlitz 103 3 3 4 5 Cowlitz 104 3 2 4 4
Silver Lake
Cowlitz 105 3 2 2 Cowlitz 106 5 4 5 Cowlitz 107 4 4 4 Cowlitz 108 4 4 5 Cowlitz 109 4 4 4 Cowlitz 110 4 4 4 Cowlitz 111 4 3 4 Cowlitz 112 3 3 3 Cowlitz 113 5 4 5
Sucker Creek Cowlitz 114 5 4 5 5 Silver Lake Cowlitz 115 5 4 5
Hemlock Creek
Cowlitz 116 3 3 4 4 Cowlitz 117 2 3 4 4 Cowlitz 118 3 2 4 4
Studebaker Creek (2) Cowlitz 119 3 2 4 4 Johnson Creek Cowlitz 120 4 3 4 4 Toutle River, S F, U T (5) Cowlitz 121 3 2 4 3 Bear Creek (2) Cowlitz 122 4 2 4 4 Harrington Creek Cowlitz 123 3 2 4 5 Toutle River, S F, U T (4) Cowlitz 124 4 2 4 4 Trouble Creek Cowlitz 125 4 2 4 4 Toutle River, S F, U T Cowlitz 126 3 2 4 4 Toutle River, S F, U T (3) Cowlitz 127 3 1 4 4
Coldspring Creek Cowlitz 128 3 1 4 4 Cowlitz 129 4 2 4 4
Toutle River, S F, U T (2) Cowlitz 130 2 2 4 4 Wyant Creek Cowlitz 131 3 4 4 4 Wyant Creek, U T Cowlitz 132 3 3 4 4
Green River Cowlitz 133 4 3 4 5 Cowlitz 134 3 3 4 5

Cowlitz County Shoreline Analysis Report
128
Waterbody Label Hydrologic
Overall Hyporheic
Overall Habitat Overall
Vegetative Overall
Devils Creek Cowlitz 135 3 4 4 5 Green River, U T Cowlitz 136 3 2 4 4 Shultz Creek Cowlitz 137 4 2 4 4 Alder Creek Cowlitz 138 2 2 4 4 Hoffstadt Creek Cowlitz 139 3 2 4 4 Bear Creek Cowlitz 140 2 2 4 4 Deer Creek Cowlitz 141 3 2 4 4 Castle Creek Cowlitz 142 2 2 4 3 Castle Lake Cowlitz 143 3 4 3 Maratta Creek Cowlitz 144 2 2 4 4 Coldwater Creek Cowlitz 145 2 2 4 3 South Coldwater Creek Cowlitz 146 3 2 4 4 Coldwater Lake Cowlitz 147 3 4 4 Studebaker Creek Cowlitz 148 2 2 3 3 Fawn Lake Cowlitz 149 2 4 3 Olequa Creek Cowlitz 150 3 4 4 4
Stillwater Creek Cowlitz 151 3 4 4 5 Cowlitz 152 3 3 4 5
Campbell Creek
Cowlitz 153 3 4 4 5 Cowlitz 154 3 4 4 4 Cowlitz 155 2 4 3 3 Cowlitz 156 3 4 4 5
Salmon Creek (2) Cowlitz 157 3 2 4 4
Restoration Opportunities
Prioritized restoration measures for the Lower Cowlitz basin are identified below
as excerpted from the Lower Columbia Salmon Recovery and Fish and Wildlife
Subbasin Plan (LCFRB 2010):
1. Protect stream corridor structure and function in high priority reaches at risk
of degradation;
2. Protect hillslope processes in functional subbasins contributing to Tier 1
reaches;
3. Restore degraded hillslope processes in the Lower Cowlitz subbasin;
4. Create/Restore off-channel and side channel habitat in the mainstem Cowlitz
and lower reaches of major tributaries;
5. Restore floodplain function and channel migration processes;
6. Restore access to habitat blocked by artificial barriers (priority locations at
Mill Creek, Leckler Creek, Salmon Creek, Foster Creek, Skook Creek, and
Blue Creek);

The Watershed Company and Parametrix May 2014
129
7. Provide for adequate instream flows during critical periods in tributaries;
8. Restore degraded hillslope processes on forest, agricultural and developed
lands;
9. Restore riparian conditions throughout the basin (Priority locations in Tier 1
reaches);
10. Restore degraded water quality with an emphasis on temperature; and
11. Restore channel structure and stability.
The same set of general priorities apply to the Coweeman and Toutle Rivers,
except that in the Coweeman River, restoring channel structure and stability is a
higher priority than in the lower Coweeman. In the Toutle River, an additional
high priority action is to address fish passage and sediment issues at the
Sediment Retention Structure on the NF Toutle (LCFRB 2010).
As noted in the Lower Cowlitz River and Floodplain Habitat Restoration Siting
and Design Report (Tetra Tech 2007), primary limitations on restoration in the
Lower Cowlitz are the high sediment load from the Toutle River; the regulation
of flows; and existing and proposed development within the floodplain and
along the riparian zone. A summary of restoration opportunities throughout the
assessment unit is presented in Table 5-19 below.
Table 5-19. Restoration opportunities in the Cowlitz River Assessment Unit.
Action Status Entity Source Plan Manage regulated stream flows to provide for critical components of the natural flow regime
Expansion of existing program or activity
Tacoma Power, Lewis County PUD, FERC, WDFW
LCFRB 2010, L Cow 1, Wade 2000
Monitor and notify FERC of significant license violations, enforce terms and conditions of section 7 consultations on FERC relicensing agreements, and encourage implementation of section 7 conservation recommendations
Expansion of existing program or activity
NMFS, USFWS LCFRB 2010, L Cow 4
Conduct floodplain restoration where feasible along the mainstem and in major tributaries that have experienced channel confinement, and especially in areas affected by dredging and floodplain filling following the 1980 Mt. St. Helens eruption. Survey landowners, build partnerships, and provide financial incentives
New NRCS, Cowlitz CD, NGOs, WDFW, LCFRB, Corps, LCFEG
LCFRB 2010, L Cow 6; Toutle 2; Coweeman 6, Wade 2000
Expand local government Comprehensive Planning to ensure consistent protections are in place to initiate review of development and real estate transactions that may affect natural resources
Expansion of existing program or activity
Cowlitz County LCFRB 2010, L Cow 15

Cowlitz County Shoreline Analysis Report
130
Action Status Entity Source Plan Assess, upgrade, and replace on-site sewage systems that may be contributing to water quality impairment.
Expansion of existing program or activity
Cowlitz County, Cowlitz CD
LCFRB 2010, L Cow 19; Toutle 18
Address fish passage and sediment issues at the Sediment Retention Structure on the NF Toutle.
Expansion of existing program or activity
WDFW, Corps LCFRB 2010, Toutle 1, Wade 2000
Assess and, if possible, alter the Silver Lake Dam to increase flows in Outlet Creek to assure fish passage into the Silver Lake watershed.
New TBD Wade 2000
Continue to manage federal forest lands according to the Northwest Forest Plan.
Activity is in place
USFS LCFRB 2010, Toutle 4
Address temperature impairments through development of water quality clean-up plans (TMDLs)
Expansion of existing program or activity
Ecology LCFRB 2010, Coweeman 15
Assess, repair, and where possible, decommission roads that are contributing chronic sediment to stream systems or that may fail and lead to landslides, especially within areas with road densities above 3.0 miles/square mile.
Expansion of existing program or activity
USFS, Cowlitz County
Wade 2000
Look for opportunities, both short- and long-term, to increase Large Woody Debris (LWD) supplies within stream systems.
New Cowlitz County and partners
Wade 2000
Replant degraded riparian areas with native conifers. To begin with, focus riparian restoration efforts along the more productive tributaries including Baird, Mulholland, and Goble creeks.
Expansion of existing program or activity
Cowlitz County and partners
Wade 2000
Address fish passage barriers in the Toutle River and tributaries to the lower Cowlitz River and prioritize for repair and replacement.
Expansion of existing program or activity
USFS, Cowlitz County, and partners
Wade 2000
Connect gravel ponds and other off-channel areas near RM 7 on the Coweeman River to provide rearing and overwintering habitat for juvenile salmonids.
New TBD Wade 2000
Cowlitz RM 0.5 right bank remove some dredged materials and create riparian and wetland bench.
Conceptual plan TBD Tetra Tech 2007
Cowlitz RM 7.3 right bank remove some dredged materials and create riparian/floodplain bench; construct setback levee if necessary.
Conceptual plan TBD Tetra Tech 2007
Cowlitz RM 8.5 right bank set back levee and plant riparian/floodplain vegetation on bench
Conceptual plan TBD Tetra Tech 2007

The Watershed Company and Parametrix May 2014
131
Action Status Entity Source Plan Cowlitz RM 9.0 left bank dredged materials removal to create riparian/floodplain bench. Conceptual plan TBD Tetra Tech 2007
Place LWD and vegetate with willows (mouth of Ostrander Creek).
Conceptual plan TBD Tetra Tech 2007
Remove noxious weeds and restore riparian zone along length of Ostrander Creek. Conceptual plan TBD Tetra Tech 2007
Cowlitz RM 9.7 right bank bar and island enhancement.
Conceptual plan TBD Tetra Tech 2007
Culvert replacement on Leckler Creek at Hazel Dell Road.
Conceptual plan TBD Tetra Tech 2007
Cowlitz RM 9.8 left bank riparian restoration: Remove revetment and some dredged material and create riparian and floodplain bench.
Conceptual plan TBD Tetra Tech 2007
Cowlitz RM 10.5 left bank riparian restoration: Remove some dredged materials and create riparian/floodplain bench.
Conceptual plan TBD Tetra Tech 2007
Cowlitz RM 11.2 left bank bar and island enhancement: Place wood to promote side channel scour and provide cover.
Conceptual plan TBD Tetra Tech 2007
Cowlitz RM 12.5 left bank side channel restoration and enhancement: Enhance low bar with remnant side channel by placing wood and minor excavation.
Conceptual plan TBD Tetra Tech 2007
Cowlitz RM 12.5 right bank riparian restoration: Remove riprap and bioengineer as feasible, remove dredged materials to create riparian/floodplain bench
Conceptual plan TBD Tetra Tech 2007
Cowlitz RM 13.5 left bank riparian restoration: Remove some dredged materials and bioengineer recent riprap placement to create riparian/floodplain bench.
Conceptual plan TBD Tetra Tech 2007
Cowlitz RM 14.0 left bank side channel restoration and enhancement: Excavate remnant side channel, place LWD.
Conceptual plan TBD Tetra Tech 2007
Cowlitz RM 14.5 right bank side channel restoration and enhancement: Excavate remnant side channel, place LWD, plant riparian vegetation.
Conceptual plan TBD Tetra Tech 2007
Cowlitz RM 16.0 right bank side channel restoration and enhancement: Create defined boat launch area and restore historic side channel and improve floodplain with plantings and wood.
Conceptual plan TBD Tetra Tech 2007
Delameter Creek Culvert replacement at Delameter Road.
Conceptual plan TBD Tetra Tech 2007
Fence off Delameter Creek from livestock and restore riparian at RM 4. Conceptual plan TBD Tetra Tech 2007

Cowlitz County Shoreline Analysis Report
132
Action Status Entity Source Plan Monahan Creek Culvert replacement at Delameter Road. Conceptual plan TBD Tetra Tech 2007
Monahan Creek Riparian restoration: Remove Japanese knotweed along lower 4 miles and revegetate.
Conceptual plan TBD Tetra Tech 2007
Cowlitz RM 18.5 left bank dredged materials removal to create riparian/floodplain bench.
Conceptual plan TBD Tetra Tech 2007
Cowlitz RM 18.8 right bank bar and island enhancement: segregate boat launching from riparian zone and bars; cut chute overflow channels and restore floodplain/riparian habitat.
Conceptual plan TBD Tetra Tech 2007
Cowlitz RM 19.8 left bank dredged materials removal to create riparian/floodplain bench.
Conceptual plan TBD Tetra Tech 2007
Toutle River RM 0.2 right bank dredged materials removal to create riparian/floodplain bench.
Conceptual plan TBD Tetra Tech 2007
Toutle River RM 3.2 right bank Off-channel restoration and enhancement: Reconnect off-channel ponds behind dredged material, enhance with LWD and riparian restoration.
Conceptual plan TBD Tetra Tech 2007
Cowlitz RM 20.2 left bank dredged materials removal to create riparian/floodplain bench.
Conceptual plan TBD Tetra Tech 2007
Cowlitz RM 22.2 left bank dredged materials removal to create riparian/floodplain bench. Conceptual plan TBD Tetra Tech 2007
Cowlitz RM 23.0 left bank off-channel and floodplain restoration.
Conceptual plan TBD Tetra Tech 2007
Cowlitz RM 23.2 right bank bar and island enhancement: Place LWD alongside channel and revegetate where appropriate on Hog Island.
Conceptual plan TBD Tetra Tech 2007
Rock Creek Culvert replacement at West Side Highway.
Conceptual plan TBD Tetra Tech 2007
Remove water control structure and reconnect Hill Creek; riparian revegetation along lower 1000-2000 feet of creek.
Conceptual plan TBD Tetra Tech 2007
Cowlitz RM 24.5 left bank riparian restoration: Slope back banks and create riparian/floodplain bench.
Conceptual plan TBD Tetra Tech 2007
Lower Olequa Creek enhancement: Restore side channel and riparian zone, remove invasive species, place LWD.
Conceptual plan TBD Tetra Tech 2007
Cowlitz RM 25.0 Acquire easements in active channel migration area.
Conceptual plan TBD Tetra Tech 2007
Cowlitz RM 25.0 side channel restoration and enhancement: Remove car bodies, place LWD and riparian restoration.
Conceptual plan TBD Tetra Tech 2007

The Watershed Company and Parametrix May 2014
133
Action Status Entity Source Plan Cowlitz RM 26.0 left bank riparian restoration: Slope back banks to create riparian bench; remove riprap; may need to move road in one area.
Conceptual plan TBD Tetra Tech 2007
Cowlitz River habitat enhancements upstream of Cowlitz County (RM 27-43)
Conceptual plan TBD Tetra Tech 2007
5.5.2 Land Use Characterization
Current Land Use
The chart below (Figure 5-19) illustrates land use distribution in the Cowlitz
River Assessment Unit in 2012.
Figure 5-19. Cowlitz River Assessment Unit 2012 land use distribution (Source:
Cowlitz County Assessor’s Office).
Water-oriented Uses
The following discussion of water-oriented uses should not be considered
comprehensive (please see the subsection on Water-oriented uses in Section 3.3.1
for background discussion). This section only selectively identifies certain water-
dependent and water-related uses. Water-enjoyment uses are discussed in the
below section titled Existing and Potential Shoreline Public Access.
The Cowlitz River Assessment Unit includes the North Toutle Fish Hatchery as a
key water-oriented use. Constructed in 1952, the hatchery is federally-funded
and operated by the state of Washington. The hatchery was temporarily

Cowlitz County Shoreline Analysis Report
134
abandoned after the 1980 eruption of Mount St. Helens, with hatchery operations
reestablished in 1985.
Transportation and Utilities
This expansive assessment unit features numerous roads, highways, Interstate 5,
and railroads (Figure 5-18) in shoreline jurisdiction; however, most tend to pass
through shoreline jurisdiction briefly (rather than run parallel the shoreline). An
exception to this is the Rose Valley Road, which follows closely along the
Coweeman River for extended stretches.
BPA utility corridors pass through the shoreline jurisdiction of Arkansas,
Monahan, and Delameter Creeks before crossing the shoreline jurisdiction of the
Cowlitz and Coweeman Rivers. Pipelines cross the shoreline jurisdiction of the
Cowlitz, Coweeman, and Toutle Rivers, as well as Ostrander Creek.
Figure 5-20. The BNSF Railroad along Cowlitz River north of Castle Rock
(Source: TWC).
Existing and Potential Shoreline Public Access
Existing shoreline public access locations within the Cowlitz River Assessment
Unit are listed below in Table 5-20.

The Watershed Company and Parametrix May 2014
135
Table 5-20. Existing shoreline public access locations in the Cowlitz River Assessment Unit.
Waterbody Name Manager Description Coldwater Lake Coldwater Lake
Recreation Area1
USFS Boat ramp (petroleum-powered motors prohibited). Also has picnic areas, shoreline trails, and restrooms.
Cowlitz River Harry Gardner Park2
Cowlitz County Originally wiped out by the 1980 eruption, this 17-acre, day-use park on the south fork of the Toutle River was recently reopened. There is approximately 500 feet of Toutle River access. Includes walking trails, picnic tables, benches, fire pits, barbecues, play area, horseshoe pits and beach volleyball.
Hog Island3 Cowlitz County 10-acre day use park with primitive boat launch. Fishing access. Features parking and undeveloped areas.
Olequa Creek4 (Figure 5-21)
WDFW Concrete boat launch, bank fishing. Restrooms. Open year-round.
Riverside Park Cowlitz County 58-acre regional park on the Cowlitz River includes ball fields, sport courts, restrooms, trails, playground equipment, open space, picnic shelters and tables. There is no river access for fishing or boat launching.
North County Recreation Sports Complex
City of Castle Rock
Access to the Castle Rock boat launch is through the North County Recreation Sports Complex, directly south of the Castle Rock High School entrance.
Silver Lake Seaquest State Park
Washington State Parks
475-acre, year-round camping park near Mount St. Helens. The forested park claims over a mile of Silver Lake shoreline. Amenities include trails for hiking and bicycling, play areas, and playing fields. Open year-round.
Silver Lake4 (Figure 5-22)
WDFW Concrete boat ramp, fishing dock. Restrooms. Open year-round.
Silver Lake Resort
Private Boat ramp available.
Streeter’s Resort
Private Boat ramp available.
Toutle River Toutle5 WDFW Located near the mouth of the Toutle River, just west of I-5. Walk-in only. No boat launch. Open year-round.
Tower Bridge5 WDFW Located off Riverview Drive, just downstream of the north and south fork confluence. No boat launch. Open year-round.
1 The Draft Public Access map (Appendix B) currently indicates that there is a boat launch at this location, but does not show Recreation Area.
2 The Draft Public Access map currently does not show this park. However, this park is documented on the Cowlitz County website as recently re-opened.
3 The Draft Public Access map currently indicates that there is a boat launch at this location, but does not showpark. 4 The Draft Public Access map currently indicates that there is a boat launch at this location, but does not show as a WDFW
Water Access Site. 5 The Draft Public Access map currently does not show this WDFW Water Access Site.

Cowlitz County Shoreline Analysis Report
136
Figure 5-21. Shoreline public access at Olequa Creek (Source: WDFW).
Figure 5-22. Shoreline public access at Silver Lake (Source: WDFW).
Regarding potential shoreline public access, the Cowlitz Parks Plan, in its
Summary Findings and Conclusions, makes the following statement applicable
to the Cowlitz River Assessment Unit:
“Efforts to improve the water quality of Silver Lake will increase public
use of the lake. Additional public shoreline access combined with needed

The Watershed Company and Parametrix May 2014
137
recreational facilities serving local communities and tourist traffic along
SR 504 is anticipated.”
Moreover, in its list of Target Projects, the Cowlitz Parks Plan includes the
following projects in the Cowlitz River Assessment Unit:
2012-2013
“Complete restoration of Harry Gardner Park to the condition prior to the
1980 eruption of Mount St. Helens to include RV/tent camping,
supporting outdoor venues, hiking, and river access.”
2013
“Create kayak/canoeing/sculling opportunities at Silver Lake to include
improved launch facilities, restrooms, parking and other required
facilities.”
Finally, Cowlitz County has recently approved a shoreline permit application for
a commercial zip line recreation course on Goat Island (within Silver Lake).
When completed, this facility will provide patrons with access to a portion of
privately owned shoreline that was not previously accessible to the public.
Future Land Use
At around 16,000 acres, Cowlitz River is the largest assessment unit studied.
Over the ten-year study period (Table 5-21), the assessment unit saw a
significant increase in land classified as “undeveloped” (6.2 percent), despite an
overall decrease (by 2.1 percent) in lands meeting the definition criteria for
vacant land, as described in Section 3.4.2. This change indicates the potential for
development on lands in 2012 where development was not anticipated in 2002,
indicating an increase in development potential within the assessment unit. A
notable decrease in forestland (5.5 percent) was also observed. The analysis
yielded several areas that were reclassified from forestland in 2002 to other land
uses in 2012, including single-family residential (>70 acres), agriculture (>30
acres), and undeveloped (>140 acres). Additional land use changes included
increases in transportation (3.8 percent), agriculture (1.4 percent), and single
family residential (1.8 percent), as well as lesser increases in fishing activities,
open space, and recreation (0.1 percent each). Slight decreases were observed in
industrial and public/educational/assembly (<0.3 percent each).

Cowlitz County Shoreline Analysis Report
138
Table 5-21. Cowlitz River Assessment Unit: significant land use change 2002-2012.
Category
2002 2012 Change in Percent of Total Acres
Category Acres
Percent of Total Acres
Category Acres
Percent of Total Acres
Vacant 1,789 ac. 11.2% 1,523 ac. 9.2% -2.1% Undeveloped 5,460 ac. 34.3% 6,737 ac. 40.5% +6.2% Forestland 7,950 ac. 49.9% 7,401 ac. 44.5% -5.5% Transportation 747 ac. 4.7% 141 ac. 0.8% -3.8%
Permit activity in this unit was modest relative to the development change
observed over the evaluation years. Over the evaluation period, approximately
three-times as many permits were issued for transportation and infrastructure
related uses than all other use categories (Figure 5-23). Accompanying this, is the
observation that half of all shoreline modification permits issued were for
bridges and culverts, which may have been associated with roads and
infrastructure. Given the push to remove and renovate roads in the upper
watershed, one can anticipate that development of this type will continue within
the Cowlitz River Assessment Unit.

The Watershed Company and Parametrix May 2014
139
Figure 5-23. Permit issuance data for Cowlitz River Assessment Unit (Source:
Cowlitz County).
5.6 Mill, Abernathy, Germany Creek Assessment Unit Shoreline jurisdiction in the Mill, Abernathy, and Germany Creek Assessment
Unit covers 2,745 acres and 57.6 miles of river (Figure 5-24). A summary of
shoreline characteristics is provided in Table 5-1.
0
1
2
3
4
5
6
Nu
mb
er
of
Pe
rmit
s
Shoreline Use Permits in Cowlitz River Assessment Unit 2001-2011
2011
2010
2009
2008
2007
2006
2005
2004
2003
2002
2001
0
1
2
3
4
5
6
Ove
r w
ater
str
uct
ure
(new
/exp
and
ed
)
Ove
rwat
er S
tru
ctu
re(r
epla
ced
)
Bri
dge
/Cu
lver
t
Bo
at L
aun
ch
Ban
k St
abili
zati
on
Lan
dfi
ll/D
red
gin
g
Nu
mb
er
of
Pe
rmit
s
Shoreline Use Permits in Cowlitz River Assessment Unit 2001-2011
2011
2010
2009
2008
2007
2006
2005
2004
2003
2002
2001

Cowlitz County Shoreline Analysis Report
140
Figure 5-24. Map of Mill, Abernathy, and Germany Creek Assessment Unit (in
yellow).
5.6.1 Ecological Characterization
Critical Areas
According to the National Wetland Inventory, wetlands occupy approximately
33 percent of shoreline jurisdiction in the Mill, Abernathy, Germany Assessment
Unit. Similarly, floodplain areas occupy approximately 31 percent of shoreline
jurisdiction. The majority of the floodplain and wetland area occurs in the Coal
Creek delta.

The Watershed Company and Parametrix May 2014
141
The assessment unit provides habitat for priority species including northern
spotted owl, Columbian white tailed deer, osprey, purple martin, Dunn’s
salamander, and the tailed frog.
Reach Scale Functions
Ecological functions in Mill, Abernathy, and Germany Creeks are primarily
influenced by forest harvest activities, agriculture, and rural residential
development. Scores of the functional analysis are relatively consistent
throughout the assessment unit, but larger valleys tend to score higher for
hydrologic, hyporheic, and vegetative functions because of the potential for
floodplain connectivity even though these floodplain valleys tend to be either
cleared or developed compared to steeper, more highly confined, but less
developed forested areas in other reaches.
The Coal Creek delta offers potentially important tidal freshwater rearing
habitats for juvenile salmonids, as well as vegetated marshes that provide habitat
for birds and other wildlife; however, the pumping station on Coal Creek Slough
limits fish passage. Although not identified as particularly high functioning
using the scoring approach, Reach 17, in particular, supports a large emergent
and scrub-shrub wetland complex with first and second order tidal channels that
are particularly significant habitats for small fish throughout the year. This
wetland complex also provides significant flood storage capacity for the
Columbia River and Coal Creek. In contrast, Reach 16 is entirely enclosed within
dikes, and shoreline vegetation is limited to agricultural fields.
Table 5-22. Functional scores for reaches in Mill, Abernathy, Germany Creeks Assessment Unit.
Waterbody Reach number
Hydrologic Overall
Hyporheic Overall
Habitat Overall
Vegetative Overall
Mill Creek 01 3 3 4 4
Mill Creek, S F 02 3 2 4 4
Mill Creek 03 3 3 4 5
Spruce Creek 04 3 2 4 3
Abernethy Creek 05 3 3 4 4
Cameron Creek 06 3 2 4 4
Abernethy Creek
07 3 3 4 4
08 3 3 4 5
09 3 2 4 4
Ordway Creek 10 2 2 4 4
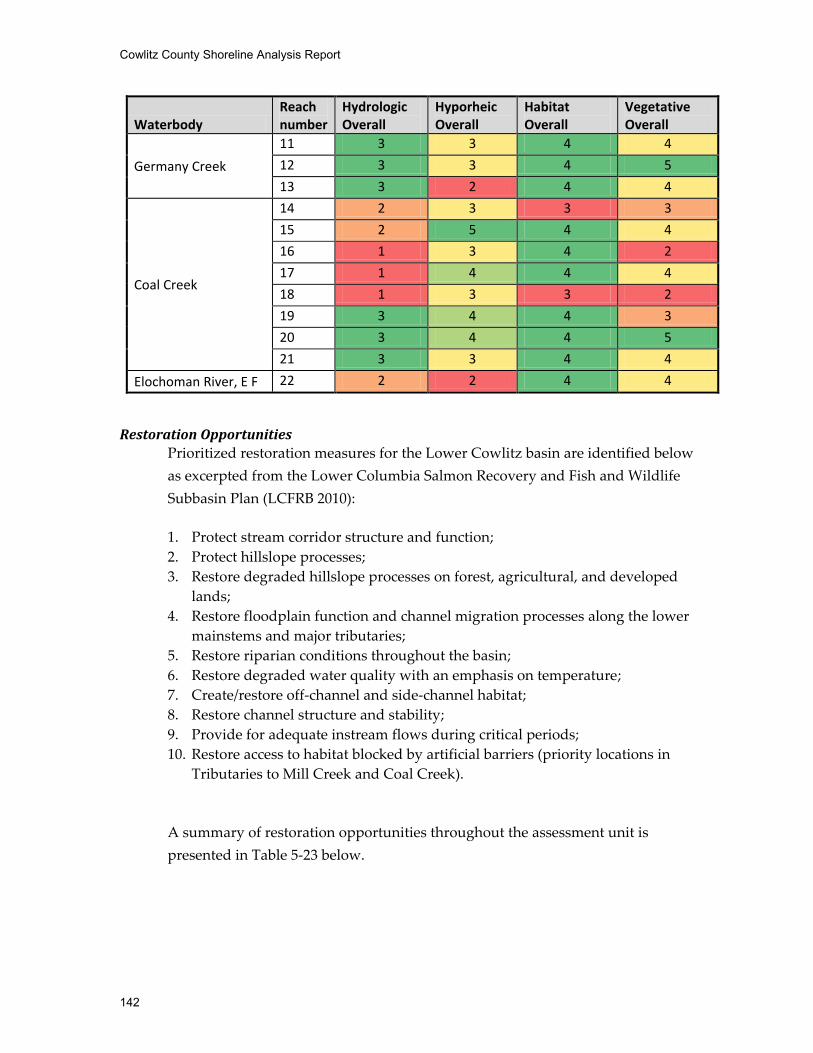
Cowlitz County Shoreline Analysis Report
142
Waterbody Reach number
Hydrologic Overall
Hyporheic Overall
Habitat Overall
Vegetative Overall
Germany Creek
11 3 3 4 4
12 3 3 4 5
13 3 2 4 4
Coal Creek
14 2 3 3 3
15 2 5 4 4
16 1 3 4 2
17 1 4 4 4
18 1 3 3 2
19 3 4 4 3
20 3 4 4 5
21 3 3 4 4
Elochoman River, E F 22 2 2 4 4
Restoration Opportunities
Prioritized restoration measures for the Lower Cowlitz basin are identified below
as excerpted from the Lower Columbia Salmon Recovery and Fish and Wildlife
Subbasin Plan (LCFRB 2010):
1. Protect stream corridor structure and function;
2. Protect hillslope processes;
3. Restore degraded hillslope processes on forest, agricultural, and developed
lands;
4. Restore floodplain function and channel migration processes along the lower
mainstems and major tributaries;
5. Restore riparian conditions throughout the basin;
6. Restore degraded water quality with an emphasis on temperature;
7. Create/restore off-channel and side-channel habitat;
8. Restore channel structure and stability;
9. Provide for adequate instream flows during critical periods;
10. Restore access to habitat blocked by artificial barriers (priority locations in
Tributaries to Mill Creek and Coal Creek).
A summary of restoration opportunities throughout the assessment unit is
presented in Table 5-23 below.

The Watershed Company and Parametrix May 2014
143
Table 5-23. Restoration opportunities in Mill, Abernathy, and Germany Creeks.
Action Status Entity Source Plan, ID Seize opportunities to conduct voluntary floodplain restoration on lands being phased out of agricultural production. Survey landowners, build partnerships, and provide financial incentives
New
NRCS/WCD, NGOs, WDFW, LCFRB, Corps, LCFEG
LCFRB 2010 M-A-G 4
Assess, upgrade, and replace on-site sewage systems that may be contributing to water quality impairment
Expansion of existing program or activity
Cowlitz County, Cowlitz CD
LCFRB 2010 M-A-G 15
Address fish passage barriers, particularly in Germany and Coal Creeks where 30-34% of the habitat is blocked
Expansion of existing program or activity
LCFRB, Cowlitz County Wade 2002
Look for opportunities to reconnect off-channel and side channel habitat in incised stream reaches
New LCFRB, Cowlitz County Wade 2002
Identify areas where channel modifications (LWD or large rocks) could help slow flows, capture scarce spawning gravels, reconnect floodplain habitat, and enhance instream channel diversity
New LCFRB, Cowlitz County
Wade 2002
Target riparian restoration efforts along the most productive and/or degraded streams including the agricultural areas (generally lower and middle reaches) of Germany and Abernathy Creeks, and the residential areas of Mill Creek.
New LCFRB, Cowlitz County, Cowlitz CD
Wade 2002
5.6.2 Land Use Characterization
Current Land Use
The chart below (Figure 5-25) illustrates land use distribution in the Mill,
Abernathy, Germany Creeks River Assessment Unit in 2012.

Cowlitz County Shoreline Analysis Report
144
Figure 5-25. Mill, Abernathy, Germany Creeks Assessment Unit 2012 land use
distribution (Source: Cowlitz County Assessor’s Office).
Water-oriented Uses
The following discussion of water-oriented uses should not be considered
comprehensive (please see the subsection on Water-oriented uses in Section 3.3.1
for background discussion). This section only selectively identifies certain water-
dependent and water-related uses. Water-enjoyment uses are discussed in the
below section titled Existing and Potential Shoreline Public Access.
Coal Creek Moorage on Coal Creek Slough provides commercial vessel moorage.
Transportation and Utilities
State Route 4 runs along the north side of Coal Creek Slough. On the south side
of the slough, Willow Grove Road closely follows the shoreline. The creeks in
this assessment unit typically feature a road running alongside that bears the
same name of the creek (e.g. Mill Creek Road runs alongside Mill Creek). These
roads are frequently found within shoreline jurisdiction.
There is a pipeline in this assessment unit that begins near the mouth of Mill
Creek and heads north for approximately 1.5 miles before heading east. This
pipeline transects shoreline jurisdiction at multiple locations in this assessment
unit.

The Watershed Company and Parametrix May 2014
145
Existing and Potential Shoreline Public Access
Existing shoreline public access locations within the Mill, Abernathy, and
Germany Creek Assessment Unit are listed below in Table 5-24.
Table 5-24. Existing shoreline public access locations in the Mill, Abernathy, and Germany Creek Assessment Unit.
Waterbody Name Manager Description Coal Creek Slough
Coal Creek Boat Launch1
Cowlitz County Includes two-acre boat launch with concrete, single-lane ramp on Coal Creek Slough leading to the Columbia River, as well as parking and undeveloped areas.
1 The Draft Public Access map currently refers to the boat launch at this location as “Coal Creek Slough.”
Regarding potential shoreline public access, in its list of Target Projects, the
Cowlitz Parks Plan includes the following projects in the Mill, Abernathy, and
Germany Creek Assessment Unit:
2013
“Create kayak/canoeing/sculling opportunities at Coal Creek Slough to
include improved launch facilities, restrooms, parking and other required
facilities.”
Future Land Use
The Mill, Abernathy, Germany Creeks Assessment Unit saw the greatest increase
in vacant land (6.8 percent) (Table 5-25). This is due in part to two factors.
Several parcels (>32 total acres) that were classified as forestland in 2002 were
reclassified as undeveloped in 2012. In addition, a large area (>251 total acres)
associated with the Port of Longview that was excluded as vacant in 2002 (due to
its “public exempt” tax status), changed ownership and subsequently met the
criteria for vacant land in 2012, as described in Section 3.4.2. This change
indicates the potential for development on lands where development was not
anticipated in 2002, indicating an increase in development potential within the
assessment unit. These changes also contributed to the increase in undeveloped
land (2.7 percent) and decrease in forestland (0.2 percent). Single family
residential (1.4 percent), transportation (0.8 percent), and open space increased
over the ten-year period. Decreases were observed in agriculture (1.0 percent),
ports (0.8 percent), and utilities (0.5 percent); with lesser decreases in fishing
activities, multi-family residential, and recreation (<0.3 percent each).

Cowlitz County Shoreline Analysis Report
146
Table 5-25. Mill, Abernathy, Germany Creeks Assessment Unit: significant land use change 2002-2012.
Category
2002 2012 Change in Percent of Total Acres
Category Acres
Percent of Total Acres
Category Acres
Percent of Total Acres
Vacant 552 ac. 21.7% 764 ac. 28.6% +6.8% Undeveloped 849 ac. 33.4% 969 ac. 36.2% +2.7% Single family residential 588 ac. 23.2% 656 ac. 24.5% +1.4%
This assessment unit saw the fewest number of shoreline use and modification
permits issued over the evaluation period compared to all other units except the
South Fork Chehalis River (Figure 5-26). A total of three use permits were
issued, all for road/railroad uses. Five modification permits were issued, all but
one of which were for bridge/culvert modifications.
Analysis of land use changes within the Mill, Abernathy, Germany Creek
Assessment Unit indicates potential for increased development activity. Single
family residential development and development associated with the port is
likely to continue, while forestland may decrease as development occurs.
However, considering the limited number of permits issued over the evaluation
period, significant changes are not anticipated.

The Watershed Company and Parametrix May 2014
147
Figure 5-26. Permit issuance data for Mill, Abernathy, Germany Creeks Assessment
Unit (Source: Cowlitz County).
5.7 South Fork Chehalis River Shoreline jurisdiction in the South Fork Chehalis River Assessment Unit is very
small, covering only 121 acres and 2.5 miles of river in the northwest corner of
the County (Figure 5-27). A summary of shoreline characteristics is provided in
Table 5-1.
0
0.2
0.4
0.6
0.8
1
1.2
Nu
mb
er
of
Pe
rmit
s
Shoreline Use Permits in Mill, Abernathy, Germany CreekAssessment Unit 2001-2011
2012
2010
2009
2008
2007
2006
2005
2004
2003
2002
0
0.5
1
1.5
2
2.5
3
3.5
4
4.5
Ove
r w
ater
str
uct
ure
(new
/exp
and
ed
)
Ove
rwat
er S
tru
ctu
re(r
epla
ced
)
Bri
dge
/Cu
lver
t
Bo
at L
aun
ch
Ban
k St
abili
zati
on
Lan
dfi
ll/D
red
gin
g
Nu
mb
er
of
Pe
rmit
s
Shoreline Modification Permits in Mill, Abernathy, Germany CreekAssessment Unit 2001-2011
2011
2010
2009
2008
2007
2006
2005
2004
2003
2002
2001

Cowlitz County Shoreline Analysis Report
148
Figure 5-27. Map of South Fork Chehalis Assessment Unit.
5.7.1 Ecological Characterization
Critical Areas
No wetlands are identified by the National Wetlands Inventory within shoreline
jurisdiction in the South Fork Chehalis River Assessment Unit; however, the
NOAA CCAP coverage identifies areas of emergent, scrub shrub, and forested
wetland vegetation. Where projects may potentially impact wetland sites, a site-
specific survey will be required to identify and delineate if and where wetlands
occur.
This assessment unit provides habitat for Roosevelt elk, Dunn’s salamander, as
well as coho salmon, steelhead trout, and pacific lamprey.
Reach Scale Functions
The South Fork Chehalis River Assessment Unit consists of a single reach. The
reach is steep and well vegetated along the river corridor and primarily in use as
forest lands. The primary impact to the immediate shoreline comes from a
logging road that parallels the reach and associated active logging activities.
Otherwise, the reach rates moderately high for ecological functions.
Table 5-26. Functional scores for reaches in South Fork Chehalis River Assessment Unit.
Waterbody Reach
number Hydrologic
Overall Hyporheic
Overall Habitat Overall
Vegetative Overall
Chehalis River, S F 01 3 2 4 4
Restoration Opportunities
Dominant land use in the upper South Fork is commercial forestry, and
agricultural uses predominate in the lower river. Both agricultural and forestry

The Watershed Company and Parametrix May 2014
149
uses have resulted in significant alterations to the shorelines of the South Fork
Chehalis River. The Chehalis Basin Salmon Habitat Restoration and Preservation
Work Plan for WRIA 22 and 23 (Chehalis Basin Partnership Habitat Work Group
2008) identified several restoration recommendations for the Chehalis watershed,
including several recommendations applicable to the upper South Fork Chehalis
River. Given the degraded state of riparian vegetation, high sediment loads
originating from the upper watershed, and the density of fish passage barriers,
the Chehalis Basin Partnership Habitat Work Group (2008) identified the
following priorities for restoration in the upper South Fork Chehalis River:
Riparian restoration
o Conifer underplanting
o Control of invasive species
Control excess sedimentation
o Implement alternative methods of bank stabilization
(bioengineering) in locations with excessive erosion (sediment
input)
o Abandon roads on steep geologically sensitive areas
o Upgrade existing roads to comply with Forest Practices Act rules
and regulations
o Revegetate streaming and riverbanks for added protection from
erosion
Correct fish passage barriers
5.7.2 Land Use Characterization
Current Land Use
The chart below illustrates the 100 percent forestland land use within the South
Fork Chehalis River Assessment Unit in 2012 (Figure 5-28).

Cowlitz County Shoreline Analysis Report
150
Figure 5-28. South Fork Chehalis River Assessment Unit 2012 land use distribution
(Source: Cowlitz County Assessor’s Office).
Water-oriented Uses
No water-oriented uses are known for this assessment unit. The entire
assessment unit consists of forestland.
Transportation and Utilities
Minor forest service roads provide access to this area. No utilities are known to
exist in this area.
Existing and Potential Shoreline Public Access
No existing public access locations are known for this assessment unit. The entire
assessment unit consists of privately held forestland.
Future Land Use
The South Fork Chehalis River Assessment Unit consists of a single land use
(forestland). No changes in land use were observed between 2002 and 2012. In
addition, no use or modification permits were issued between 2001 and 2011.
Due to the lack of change observed within this unit, significant development
changes are not expected or cannot be anticipated.
5.8 City of Castle Rock and UGA The City of Castle Rock is located on the Cowlitz River floodplain in northern
Cowlitz County, just downstream from the confluence with the Toutle River.
The Castle Rock Assessment Unit has 170 acres of shoreline jurisdiction covering
6.6 miles of river and streams.

The Watershed Company and Parametrix May 2014
151
Figure 5-29. Map of City of Castle Rock shoreline jurisdiction.

Cowlitz County Shoreline Analysis Report
152
5.8.1 Ecological Characterization
Critical Areas
Approximately 10 percent of the area in the assessment unit is mapped as
wetlands by the National Wetlands Inventory. Approximately 50 percent of the
assessment unit is in the mapped floodplain, and another 24 percent of the
shoreline area is within the floodway. A certified levee within the City limits
occupies approximately 45 percent of the shoreline length along the east bank of
the Cowlitz River within the City’s jurisdiction.
Priority species and habitats are limited to the shoreline waterbodies, which
provide migratory, rearing, and potential spawning areas for six species of
priority and listed salmonids.
Reach Scale Functions
As a result of sediment deposition from the Toutle River, the Cowlitz River
within the City of Castle Rock includes alluvial gravel bars on the inner bends of
the river. The downtown core of the City of Castle Rock is protected from flood
waters by a levee on its west side. The levee occurs within shoreline jurisdiction
in Reaches 19 and 21, limiting function scores in those reaches (Table 5-27).
Although this levee is currently the only certified levee, significant deposition of
dredge material on the banks of the river in the city has altered the natural
shoreline of the Cowlitz River (Sherwood et al. 1990). This deposition has
created berms along the Cowlitz River that limit floodplain functions and
connectivity within the city. As noted in Appendix I, these dredge deposits are
located throughout all of the City’s reaches and have modified the shoreline
conditions from its natural state. In addition to the berms and levees, shoreline
armoring has been installed throughout many shoreline reaches. These include
rip-rap adjacent to the public boat launch (Reach 23) and north and south of the
SR 411 bridge (Reach 22), and a revetment and emergency armament southeast
of “The Rock” community park (Reach 19).
In some locations along the city’s shorelines, wooded vegetation (primarily
alders and cottonwoods) on the berms along the river provides a vegetated
corridor for wildlife and helps buffer some of the effects of adjacent development
on the river. Several areas along the certified levee are maintained to preserve
view windows. These are generally located within Reach 19 and Reach 21, north
and south of the SR 411 bridge. Where tree vegetation is present along the
shoreline, it is generally limited to a relatively narrow riparian corridor. Three
notable areas of more substantial vegetation exist; Reach 18 (near the mouth of

The Watershed Company and Parametrix May 2014
153
Salmon Creek adjacent to dredge spoil deposits), Reach 19 (“The Rock”
community park), and Reach 74 (along Arkansas Creek). In contrast, a dredge
disposal site, also in Reach 19 is sparsely vegetated. There is little terrestrial
habitat value outside of the narrow riparian corridor.
Salmon Creek (Reach 072) and Arkansas Creek (Reach 074) within the City’s
shoreline jurisdiction have narrow bands of forested riparian vegetation.
Although not confined by armoring or a levee, Salmon Creek borders the
railway, and is artificially confined to its present course.
Table 5-27. Functional scores for reaches in City of Castle Rock Assessment Unit.
Waterbody City/ UGA Label
Hydrologic Overall
Hyporheic Overall
Habitat Overall
Vegetative Overall
Cowlitz River City
Cowlitz 018 a 3 4 4 5 Cowlitz 019 1 3 2 b 3 Cowlitz 020 2b 4 2 b 3 b Cowlitz 021 1 3 2 b 3 Cowlitz 022 2 b 4 2 b 3 b Cowlitz 023 1 b 3 2 b 3 b
Salmon Creek Cowlitz 072 3 3 3 4 Arkansas Creek Cowlitz 074 3 4 4 4
a Functional scores for Cowlitz 18 reflect that the majority of this reach has a wide area of multi-structured vegetation within the shoreline jurisdiction. The vegetation is established on dredge spoil deposits placed there after the Mt. Saint Helen’s volcanic eruption. By their physical nature, the dredge spoils are highly susceptible to displacement from high water events. The dredge spoils site may receive additional spoils in the future. The functional scores of this reach would be considered lower if either natural river processes or the addition of dredge spoils reduced the width of the vegetation along the shoreline.
b Functional scores were adjusted to account for documented shoreline armoring along portions of the Cowlitz River (see Appendix I).

Cowlitz County Shoreline Analysis Report
154
Table 5-28. Summary of reach characteristics in the Castle Rock Assessment Unit (see Section 3.4.2 for methodology)
Average Conditions by Parcel Total by Reach
Waterbody City/ UGA Reach Label
Parcel Size (acre)
Parcel Width (ft)
Parcel Depth (ft)
Shoreline Setback (ft)
Vegetated Condition O
verw
ater
St
ruct
ures
Shor
elin
e A
rmor
ing
%
Impe
rvio
us %
Cowlitz River
City
Cowlitz 018 3.3 323.3 182.6 267.0 3.8 0 0 3 Cowlitz 019 2.1 316.6 105.3 188.8 2.7 0 0 14 Cowlitz 020 20.0 1357.0 108.6 192.1 3 0 10 9 Cowlitz 021 0.3 158.8 68.7 188.6 1.3 0 0 16 Cowlitz 022 1.8 160.1 114.0 249.0 2.5 0 0 22 Cowlitz 023 12.3 665.6 191.9 456.3 2.8 1 0 12
Salmon Creek Cowlitz 072 8.2 279.7 467.8 NA 4 0 0 14 Arkansas Creek Cowlitz 074 39.8 1,496.5 1,022.6 154.7 3.8 0 0 3

The Watershed Company and Parametrix May 2014
155
Restoration Opportunities
The most significant opportunities for restoration in the City of Castle Rock
include riparian restoration and floodplain restoration. The City has completed
significant restoration projects in the last 10 years, including recent
enhancements along Janisch and Whittle Creeks, and continues to identify new
restoration opportunities.
5.8.2 Land Use Characterization
Future Land Use (Assessment Unit Analysis)
Over the past 10 years, vacant lands and undeveloped lands decreased in the
Castle Rock Assessment Unit (Table 5-29). However, this was due to a large
annexation in 2010 on the western shore of the Cowlitz River and not the result
of increased development activity. Some growth of single-family residential uses
can be anticipated in vacant lands in the assessment unit in the foreseeable
future.
Table 5-29. Castle Rock Assessment Unit: significant land use change 2002-2012.
Category
2002 2012 Change in Percent of Total Acres
Category Acres
Percent of Total Acres
Category Acres
Percent of Total Acres
Vacant 29 ac. 31.5% 19 ac. 20% -11.5% Undeveloped 72 ac. 77.6% 65 ac. 70.4% -7.3% Single family residential 12.6 ac. 13.5% 15.3 ac. 16.5% +3.0% Recreation 0.3 ac. 0.3% 4.7 ac. 5.1% +4.8%
A review of shoreline permit history over the past 10 years within the City of
Castle Rock revealed only four projects; each of these was a public project. As a
result of the City’s ownership and stewardship of the majority of the City’s
shorelines, few private development permits are expected in the future.
Potential Use Conflicts
Castle Rock currently has no water-oriented commercial uses, but does have
public recreation areas and access trails along levees. The potentially industrial
area in the southerly portion of the city and UGA is not likely to include water-
dependent uses given the lack of a commercial navigation channel. There are a
few residences in the vicinity of this area, but these are not likely to be
incompatible with future industrial uses if appropriate site design provides for
buffers or other means to reduce impacts.

Cowlitz County Shoreline Analysis Report
156
Transportation and Utilities
The BNSF Railroad and I-5 only intersect with City of Castle Rock shoreline
jurisdiction within reach Cowlitz 072 on Salmon Creek. Huntington Avenue
runs through a portion of Cowlitz 019 and PH 10/A Street (SR 411) bisects reach
Cowlitz 022 and divides Cowlitz 019 and Cowlitz 021 where it crosses the
Cowlitz River. In addition to these larger roads, many local roads are present
within Cowlitz 021 and Cowlitz 022.
Utility infrastructure is present within Reach 21 (water treatment plant) and
Reach 19 (PUD Substation and the Wastewater Treatment Plant)
Existing and Potential Public Access
Much of the Castle Rock shoreline is owned and managed by the City for a
variety of public access and recreation uses. The State DNR and the School
District also have shoreline sites with limited public access options. Public access
is described for each reach in the City of Castle Rock and its unincorporated
UGA in Table 5-30 below.
The City’s Riverfront Master Plan, Park and Recreation Plan, and the Riverfront
Trails Project provide a comprehensive public access approach for shoreline
jurisdiction lands in Castle Rock. These plans identify opportunities to improve
existing sites for public enjoyment.
Table 5-30. Public access opportunities in the Castle Rock Assessment Unit.
Reach Potential Public Access Description
Cowlitz 074 No current facilities, zoned for Parks, Recreation and Open Space
Cowlitz 019 The Rock Community Park, Lions Pride Community Park, Riverfront Trail and future park site. Lions Pride Community Park provides a “gateway” to the City with main trailhead access. Future trails to the southeast are planned.
Cowlitz 020
Castle Rock Fairgrounds, Riverfront Trail with meandering access trails, informal parking and fishing locations, shoreline access at the end of Fair Lane. The City plans to develop the “High Banks” area outside of shoreline jurisdiction, but with likely connectivity and amenities within jurisdiction.
Cowlitz 021 Riverfront Trail, fishing platform north of bridge, Trailhead parking near the intersection of Front Ave and SR 411.
Cowlitz 022 Riverfront Trail, and Mosier Road Recreation Area
Cowlitz 023 Al Helenberg Memorial Boat Launch includes boat launch, floating dock and groin, Riverfront Trail, and an outdoor classroom north of the boat launch. The Riverfront Trail is proposed to be paved as part of a regional trail system.

The Watershed Company and Parametrix May 2014
157
Reach Scale Analysis of Current Land Use, Water-dependent and Water–related uses, and Future Land Use
Cowlitz 072 – City –Salmon Creek
Current Land Use: A small fraction of a large vacant parcel and I-5/local street
right-of-way make up the existing land uses. The BNSF railroad right-of-way is
just outside of the Shoreline jurisdictional boundaries. The reach also includes
land that is vacant and owned by WDNR and that may provide restoration
opportunities. Impervious surface includes 14 percent of the parcel area for this
reach. Shoreline vegetated area depths are 100 feet in this area, with an average
condition score of the vegetated area, as estimated from aerial photos, of 4. The
shoreline is not armored within this reach, and there are no overwater structures.
City of Castle Rock zoning includes Highway Business and Industrial
designations.
Water-dependent Uses and Water-related Uses: There are no water-dependent
or water-related uses within this reach.
Future Land Use: The Comprehensive Plan includes industrial uses within this
reach. Given the constrained nature of this reach, located between the freeway
and rail line, no new development is expected.
Cowlitz 018 – City –Cowlitz River
Current Land Use: The southern (majority) portion of this reach is owned by the
WDNR. This reach is currently used as a dredge spoil deposit site under
emergency declaration after the eruption of Mount St. Helens. The remainder is
made up of three vacant tax lots and two single family residences. Two of the
vacant tax lots extend out into the Cowlitz River. A substantial amount of tree
and shrub vegetation exists near the mouth of Salmon Creek (ranging between
161 feet to 281 feet wide), covering most of the shoreline jurisdictional area at the
southern tip of this reach. The width of continuous vegetation drops off
considerably on the northern parcels (~30 feet in places) which are either vacant
or contain single family residences located on dredge spoils. The shoreline is not
armored within this reach, and there are no overwater structures. The majority
of this reach is zoned Industrial with a small portion zoned as low-density
residential at the very north end of the reach.
Water-dependent Uses and Water-related Uses: The existing dredge spoils were
excavated and removed from the bottom of a body of water (presumably the

Cowlitz County Shoreline Analysis Report
158
Cowlitz River) and may be used for land reclamation purposes, and as such can
be categorized as water-related.
Future Land Use: The Comprehensive Plan includes industrial uses within this
reach. Much of this reach is under one ownership and has good access to I-5.
During stakeholder interviews, part of the visioning process, the owner’s
representative described the possibility of a new marina, floating homes,
spectator sports facilities and new industrial development. These uses, however,
are not permitted under current zoning, are not envisioned in the
Comprehensive Plan, and have not been presented to the City by the property
owner. Land use projections in this report are based on existing zoning.
Cowlitz 019 – City –Cowlitz River
Current Land Use: Beginning at the southern portion of this reach, there are
several single-family residences and mobile homes, along with vacant parcels
and street ROW. Three rock barbs are located in the Cowlitz River. They are
designed to decrease velocity and reduce erosional forces along the river bank.
Further north, the reach is occupied by Lions Pride Park and a City-owned RV
waste disposal site. Long strips of vacant land owned by the State, County or
City are located on either side of Huntington Avenue, representing both public
open space (Lions Pride Park) and public access (Riverfront Trail). A 300-foot-
long revetment installed by the Corps is located just downstream of “The Rock”
community park. The only remaining vegetated shoreline within the City is
located within “The Rock” community park, an identified cultural/historical site
west of Huntington Avenue. There is evidence of previous realignment of Front
Avenue based on parkland not within any tax lot (possibly former road ROW).
West of “The Rock” community park, the reach along Dike Drive includes the
Castle Rock Wastewater Treatment Plant and other city-owned vacant parcels,
along with one single-family residence. This area also represents the downstream
end of the certified levee.
Further upstream, along the waterward side of the levee, is the location of the
City’s active dredge spoils deposit site, a skate park and bike park. This is an area
planned (through the Riverside Master Plan) for future recreational uses. To the
north, there are vacant parcels corresponding to the Riverfront Trail and future
park site, as well as single-family residences, a mobile home and a lot owned by
the Cowlitz Public Utility District No. 1. A portion of land closest to the shoreline
is part of the right-of-way.

The Watershed Company and Parametrix May 2014
159
Shoreline vegetation is fairly narrow along the levee and located primarily at the
toe of the river bank (typically around 30 feet). Only along the waterward side of
the active dredge spoils disposal site is the vegetated width more substantial.
There are no overwater structures within this reach. Land within this reach is
designated with Low-density Residential, Parks, Recreation and Open Space and
High Density Residential.
Water-dependent Uses and Water-related Uses: As shoreline parkland with
access to the river, Lions Pride Park and the Riverfront Trail represent a water-
enjoyment use. The Wastewater Treatment Plant on Michner Street is a water-
related use due to the need for sewage facilities to be located near the river where
its outfall is located.
The existing dredge spoils were excavated and removed from the bottom of a
body of water (presumably the Cowlitz River) and may be used for land
reclamation purposes, and as such can be categorized as water-related.
Future Land Use: The Comprehensive Plan includes industrial, low-density
residential, high-density residential, commercial, parks/open space and
public/institutional uses within this reach. Some portions of the shoreline are not
given a planning designation. The parks/open space designation extends out into
the Cowlitz River. Given the significant ownership by the City in this reach and
the open space and recreational designations, future development is likely to be
recreation related. The City’s adopted Riverside Master Plan calls for the dredge
spoils deposit site to be reclaimed for recreational uses.
Cowlitz 074 – City –Arkansas Creek
Current Land Use: A large City-owned vacant tract that is the current site of City
and WDNR dredge spoils is located here. The reach also includes small portion
of a repair facility parcel. Most of the reach occupies unparcelized vacant lands,
zoned for parks/open space. The southern bank of Arkansas Creek is adjacent to
several single-family residential parcels that are not within the reach itself. The
area of shoreline jurisdiction within the City is fairly well vegetated along both
banks of Arkansas Creek. The average condition score of the vegetated area, as
estimated from aerial photos, is 3.8. The shoreline is not armored within this
reach, and there are no overwater structures. This reach is designated with
Parks, Recreation and Open Space zoning.
Water-dependent Uses and Water-related Uses:
Cowlitz County Shoreline Analysis Report
160
The existing dredge spoils were excavated and removed from the bottom of a
body of water (presumably the Cowlitz River) and may be used for land
reclamation purposes, and as such can be categorized as water-related.
Future Land Use: The Comprehensive Plan includes parks/open space and
mixed-uses within this reach. The parks/open space designation extends across
the Cowlitz River. There is not likely to be any new development in this reach
except recreation use and restoration opportunities, including a potential new
bridge over the creek near the mouth.
Cowlitz 020 – City –Cowlitz River
Current Land Use: A large City-owned vacant tract that is the current site of city
and WDNR dredge spoils is within the southern extent of the reach. A small
corner of the Mt. St. Helens Motorcycle Club facility is also within this reach, as
well as portions of the Castle Rock Fairgrounds. Much of the shoreline between
the dredge spoils site to the south and PH 10 (A Street), which includes the
Riverfront Trail, is not within any tract. The undeveloped “High Banks” area to
the south includes an extensive amount of informal walking trails, parking and
fishing locations. As with other areas of the City’s shoreline which contains
dredge spoils deposits, the shoreline vegetation is somewhat limited through this
reach, with the exception of an approximately 800-foot-long section along the
Fairgrounds. Tree cover typically consists of alders and cottonwoods located
near the toe of the river bank. Rip rap armoring is located just south of the SR
411 bridge, adjacent to the Fairgrounds structures and parking. There are no
overwater structures through this reach. This reach is designated with Parks,
Recreation and Open Space zoning.
Water-dependent Uses and Water-related Uses: As shoreline parkland with
access to the river, the Riverfront Trail represents a water-enjoyment use. There
is shoreline access provided at the end of Fair Lane.
The existing dredge spoils were excavated and removed from the bottom of a
body of water (presumably the Cowlitz River) and may be used for land
reclamation purposes, and as such can be categorized as water-related.
Future Land Use: The Comprehensive Plan includes parks/open space and
mixed-uses within this reach. A significant length of this shoreline proximate to
the dredge spoils site is not within any comprehensive plan designation. The

The Watershed Company and Parametrix May 2014
161
Community Fair has discussed expanding and renovating facilities with the City
staff, and these buildings are currently within the 200-foot shoreline jurisdiction.
Cowlitz 021 – City –Cowlitz River
Current Land Use: The Castle Rock Public Works Facility is located along A
Street, while the Water Treatment Plant is located directly north. There is also a
church, single-family residences and multifamily apartments within this reach.
The Riverfront Trail runs along an easement within several tax lots, while much
of the shoreline is not within any tax lot. Further north, the reach consists entirely
of single-family residential parcels, with some parcels that are vacant. Closest to
the city boundary, there are two single-family residences east of Huntington
Avenue as well as several vacant tax lots. There are also vacant parcels towards
the shoreline on the west side of the road, including a state-owned tidelands
parcel and a city-owned parcel that encompasses the Riverfront Trail and
trailhead. ADA trail access is provided at the western end of Shintaffer Avenue.
The certified levee runs along the entire shoreline of this reach, immediately
adjacent to the shore. Shoreline vegetation is fairly narrow along the levee and
located primarily at the toe of the river bank (typically less than 30 feet). Per view
corridor maintenance requirements, several areas along the certified levee are
maintained to preserve view windows. The average condition score of the
vegetated area, as estimated from aerial photos, is 1.3. There are no overwater
structures. This reach is designated with High Density Residential and Retail
Business zoning.
Water-dependent Uses and Water-related Uses: Within this reach, there is a
fishing platform north of the bridge; these are the reach’s sole overwater
structures. The operation of a Water Treatment Plant is dependent on being
located in proximity to the intake on the river; hence it is classified as a water-
related use. As shoreline parkland with access to the river, the Riverfront Trail
represents a water-enjoyment use. Other uses are separated from the river by a
federally certified levee. This levee separates the uplands from the shoreline,
such that shoreline functions do not extend landward of the levee.
Future Land Use: The Comprehensive Plan includes public/institutional,
commercial, low-density residential and high-density residential uses within this
reach. Some portions of the shoreline are not designated in the comprehensive
plan. The City’s waterfront and downtown plans call for significant
redevelopment and enhancements in this area.

Cowlitz County Shoreline Analysis Report
162
Cowlitz 022 – City –Cowlitz River
Current Land Use: There is a vacant commercial parcel located on past dredge
spoils along SR 411 as well as single family residences and a mobile home to the
west of Mosier Road. Two of these residential tracts also occupy land to the east
of Mosier along the shoreline. A City-owned vacant tract is located along the
river, while the remaining shoreline is not within any parcel. The Riverfront Trail
runs along the shoreline as well, adjacent to Mosier Road and public access also
includes a fishing platform just north of the bridge. Shoreline vegetated consists
of a narrow band of alders and cottonwoods, located near the toe of the river
bank. Mosier Road runs along the river and interrupts potential habitat
connectivity. The shoreline is nearly completely armored within this reach, and
there are no overwater structures. This reach is designated with High Density
Residential and Low-density Residential zoning.
Water-dependent Uses and Water-related Uses: As shoreline parkland with
access to the river, the Riverfront Trail represents a water-enjoyment use.
Future Land Use: The Comprehensive Plan includes low-density residential,
high-density residential and mixed-uses within this reach. Given the larger
parcel sizes and good transportation access this reach is likely to see new
commercial development in the future.
Cowlitz 023 – City –Cowlitz River
Current Land Use: The majority of this reach contains past dredge spoils
deposits. Vegetation is typically just a narrow band of alders and willows, with
the only extensive vegetation located at the river’s bend just east of the
recreational ball fields. The City’s Boat Launch facility is located within this
reach, along with the North County Recreation Association’s Sports Complex
and two additional vacant parcels, one of which is owned by the Castle Rock
School District #401. Of the three school district-owned parcels, one extends
across the Cowlitz River while another privately owned parcel extends out into
the river. A small portion of the reach is not within any tax lot parcel, including
local street right-of-way and land closest to the shoreline. The shoreline is
armored just north of the boat launch within this reach. The boat launch also
contains a recently constructed floating dock. There is a flood control berm that
was built after a 1995 high water event to protect residences within the Green
Acres community and the high school from flooding. This reach is designated
with a small area of Low-density Residential zoning with the remainder
designated as Parks, Recreation and Open Space.

The Watershed Company and Parametrix May 2014
163
Water-dependent Uses and Water-related Uses: The Boat Launch facility is a
water-dependent use. As shoreline parkland with access to the river, the
Riverfront Trail represents a water-enjoyment use. Other existing informal dirt
trails are likely to be incorporated into the regional trail system in the future.
Future Land Use: The Comprehensive Plan includes parks/open space and low-
density residential uses within this reach. There is the potential for a small
amount of low-density residential in this reach. The local school district may
utilize the area for teaching and interpretive nature trails and displays and may
complete wetland and/or habitat enhancement as a part of an open classroom
curriculum.
The existing berm may be improved in the future to achieve certification. This
may result in a loss of shoreline vegetation along the berm due to Corps
vegetation policies, but in most instances the amount of vegetation is limited to a
narrow band of cottonwoods and alders. As an alternative to improving the
berm, some land in or adjacent to this reach may be elevated to accommodate
new development in the floodplain (WEST Consultants 2008). Both land
elevation and berm improvement would eliminate already limited floodplain
connectivity in this reach.
5.9 City of Kalama The City of Kalama is located on the Columbia River, just upstream (southeast)
of the confluence with the Kalama River. The assessment unit has 214 acres of
shoreline jurisdiction covering 6.6 miles of river.

Cowlitz County Shoreline Analysis Report
164
Figure 5-30. Maps of City of Kalama shoreline jurisdiction (continued).
Kalama 04
Columbia 27
Columbia 28
Columbia 29

The Watershed Company and Parametrix May 2014
165
Figure 5-30. Maps of City of Kalama shoreline jurisdiction (continued).

Cowlitz County Shoreline Analysis Report
166
5.9.1 Ecological Characterization
Critical Areas
Approximately 36 percent of the shoreline jurisdiction in the City of Kalama
Assessment Unit is mapped as wetland area by the National Wetlands Inventory.
Levees along the Columbia and the lower Kalama River in the City and its UGA
occur on nearly 28 percent of the shoreline length in the assessment unit.
Outside of these leveed sections, approximately 62 percent of the shoreline area
is within the mapped floodplain.
The shoreline provides habitat for osprey, Canada geese, and cavity-nesting
ducks, as well as aquatic shoreline habitat for the entire suite of salmonids and
priority fish species using the Columbia River and lower Kalama River
shorelines.
Reach Scale Functions
The shoreline along the Columbia River in the City of Kalama and its UGA is
lined with levees or other shoreline armoring largely supporting port and
industrial uses. A large wetland is located adjacent to Port properties in Reach
27, and although separated from the River by a levee, the property is within the
mapped floodplain of the Columbia River, providing some hydrologic functions.
This wetland area provides some of the only shoreline vegetation and
functioning habitat within the City’s UGA on the Columbia River (Table 5-31).
Other vegetation on the Columbia River is limited to a few mowed grass areas
and patchy trees and shrubs in Reaches 29 and 30. Over- and in-water structures
occur throughout the Columbia River reaches, associated with Port properties.
The marina basin provides refuge from high flows, but instream habitat is
lacking in complexity and shallow water habitat, and overwater structures
provide potential habitat for predators on juvenile salmonids and other small
fish.
Kalama River
Kalama Reach 04 is largely perpendicular to the river and consists of a narrow
wetland situated between I-5 and the railway. Because of its location, the
wetland provides water quality functions. Kalama Reaches 05 and 06 are well
vegetated and include a sandbar. Kalama Reach 08 on the right bank includes a
variety of land uses including a resort, single-family homes, and some
agriculture. Kalama Reach 09 is a well-vegetated wetland area with a pond near
its west end. Similarly, the majority of the shoreline area on Kress Lake (Reach
29) is well vegetated, with little human disturbance of functions except the

The Watershed Company and Parametrix May 2014
167
parking lot and boat launch on the west side. A soft-surface trail encircles the
lake.
Table 5-31. Functional scores for reaches in City of Kalama Assessment Unit.
Waterbody City/ UGA Label
Hydrologic Overall
Hyporheic Overall
Habitat Overall
Vegetative Overall
Columbia River
UGA Columbia 27 1 4 1 1
City Columbia 28 1 3 2 2 Columbia 29 1 3 2 2
UGA Columbia 30 2 3 2 2
Kalama River
UGA Kalama 04 3 4 4 3 City Kalama 05 3 3 3 3
UGA Kalama 06 3 4 4 5 Kalama 08 3 4 3 4 Kalama 09 3 4 5 4
City Kalama 11 2 4 3 3 Kress Lake UGA Kalama 29 4 4 5

Cowlitz County Shoreline Analysis Report
168
Table 5-32. Summary of reach characteristics in the City of Kalama Assessment Unit.
Average Conditions by Parcel Total by Parcel
Waterbody City/ UGA Reach Label
Parcel Size
(acre) Parcel
Width (ft) Parcel
Depth (ft)
Shoreline Setback
(ft)
Average Depth of
Vegetated Shoreline
(ft) Vegetated Condition O
verw
ater
St
ruct
ures
Shor
elin
e A
rmor
ing
%
Impe
rvio
us
%
Columbia River City
Columbia 28 13.6 1054.1 125.6 284.6 0 1 3 77 41 Columbia 29 3.5 475.0 105.4 244.0 20.6 1 0 58 55
UGB Columbia 27 57.2 947.9 883.7 779.7 0 1 3 92 30 Columbia 30 11.4 957.9 152.5 288.6 113.4 1.1 2 50 41
Kalama River City
Kalama 05 25.2 237.9 134.3 NA 1740.0 5 0 0 5 Kalama 11 2.0 232.9 261.3 305.2 281.3 2 1 0 6
UGB
Kalama 04 9.7 122.3 90.9 NA 326.9 5 0 0 16 Kalama 06 10.1 338.6 120.3 318.3 384.8 3.7 0 0 8 Kalama 08 7.8 385.7 154.7 250.6 387.4 2.8 1 0 3 Kalama 09 7.2 329.1 221.4 294.2 600.9 3.1 0 0 3
Kress Lake UGB Kalama 29 13.3 792.4 152.0 789.2 675.2 3.3 0 0 1

The Watershed Company and Parametrix May 2014
169
Restoration Opportunities
Two areas present potential restoration opportunities with the City of Kalama.
Some portion of the land around Kress Lake, which is primarily forested, is
under a mitigation agreement with the State of Washington. The land along the
north and south banks of the Kalama River, west of I-5 and the BNSF Railroad
also presents a potential mitigation opportunity. Both projects are proposed as
mitigation, meaning that they would be restored to compensate for an action that
negatively affects ecological functions. As such, mitigation projects are not truly
restoration projects, and the projects may or may not result in a net gain in
ecological functions.
5.9.2 Land Use Characterization
Future Land Use (Assessment Unit Analysis)
Over the past ten years, the area of vacant lands in the City of Kalama UGA has
only decreased slightly, by 1.4 percent (Table 5-33). The area of single family
residential use has remained largely unchanged. Agricultural uses, once present
in the assessment unit have been lost or reclassified as undeveloped properties.
The data shows a shift of approximately 15 acres from industrial to commercial
uses; since commercial and industrial uses are often related and may sometimes
overlap, this apparent difference in use may be a reflection of differences in
categorization methods over the course of time.
Table 5-33. City of Kalama Assessment Unit: Significant land use change 2002-2012.
Category
2002 2012 Change in Percent of Total Acres
Category Acres
Percent of Total Acres
Category Acres
Percent of Total Acres
Vacant 23 ac. 7.7% 19 ac. 6.3% -1.4% Undeveloped 38 ac. 13.1% 49 ac. 16.3% +3.2% Single Family Residential 27 ac. 9.3% 29 ac. 9.4% +0.1% Recreation 0.3 ac. 0.3% 10 ac. 5.1% +3.3% Agriculture 10.6 ac. 3.6% 0 0% -3.6%
Permits within City of Kalama shoreline jurisdiction back to 2002 were obtained
from the City of Kalama and reviewed for applicability (Table 5-34). Permits
with a use change, new development or significant expansion of an existing use
are included here.

Cowlitz County Shoreline Analysis Report
170
Table 5-34. Ten year permit history in the City of Kalama.
Reach Permit Application Activity Location
Columbia 29 N/A
Phase 1 - Develop Port of Kalama Interpretative Center and Office Building Phase 2 – Develop hotel and restaurant
110 W. Marine Drive, at Kalama Marina
Potential Use Conflicts
The existing park and recreation facilities and marina, with the prospect for a
hotel, restaurant, and small conference center called for in the Port of Kalama
Comprehensive Plan, would not be a conflicting use with anticipated existing
and future industrial uses given the configuration of surrounding Port uses.
The residential area south of the Port of Kalama is reasonably well buffered from
port uses by distance but experiences some conflicts when access across the rail
corridor is blocked by train movement.
Transportation and Utilities
The BNSF Railroad runs parallel to the Columbia River and the shoreline reaches
along the Columbia within the City of Kalama. Shoreline jurisdiction includes
portions of the railroad within Columbia 29 and is very near the railroad in
Kalama 04. I-5 is near to reach Columbia 2 and Kalama 04 as well, and crossing
the Kalama River at the edges of reaches Kalama 05 and Kalama 08
Existing and Potential Public Access
Public access is described for each reach in the City of Kalama and its
unincorporated UGA in Table 5-35 below. Potential public access opportunities
include the Port of Kalama’s plans to develop an interpretive center as well as a
restaurant and hotel on the marina. Kalama Reach 09 is in an area designated for
a future park, and Kress Lake recreation in Kalama Reach 29 has potential for
amenity and access improvements.
Table 5-35. Public access opportunities in the Kalama Assessment Unit.
Reach Potential Public Access Description Columbia 30 Part of Marine Park with beach access Columbia 29 Part of Marine Park with beach access, Kalama Marina and boat launch Kalama 08 Camp Kalama: Boat launch, beach access, camping Kalama 29 Kress Lake: Small boat launch, fishing access, and trail around shore

The Watershed Company and Parametrix May 2014
171
Reach Scale Analysis of Current Land Use, Water-dependent and Water–related uses, and Future Land Use
The City of Kalama has shoreline jurisdiction along the Columbia River, the
Kalama River, and Kress Lake. The reaches include low-density residential,
industrial, and recreational areas. The following descriptions for each reach will
summarize existing and planned land uses and details regarding shoreline
treatments and features.
Columbia River
Columbia 30 – City
Current Land Use: The south half of this reach is occupied by industrial land
uses with a dock associated with large grain silos near the shore and the Port of
Kalama wastewater treatment plant. The north half of the reach includes the
southern portion of a park with a beach area and beach access below an armored
slope supporting the upper portion of the park. Shoreline vegetated area depths
range from 35.8 feet to 278.9 feet, including the park, with an average depth of
113.4 feet. The average condition score of the vegetated area, as estimated from
aerial photos, is 1.1. The shoreline is armored within portions of this reach. The
docks constitute overwater structures. The City of Kalama future land use
designation within this reach is industrial.
Water-dependent Uses and Water-related Uses: This reach contains water-
dependent uses associated with the Port of Kalama including the marine
shipping terminals for Cenex/United Harvest. The Port of Kalama also owns the
property to the north occupied by Marine Park with access to the water, and thus
includes a water-enjoyment use. The outfall to the river for the City of Kalama
wastewater treatment plant is another a water-related use due to the need for
proximity to river for discharge of treated wastewater.
Future Land Use: It is anticipated that this area will remain in industrial use as
part of the Port of Kalama.
Columbia 29 - City
Current Land Use: Land use consists of a recreational marina, Kalama Marina,
with partially covered boat docks. Adjacent upland uses include local roads, a
railroad and I-5. The shore is armored near the marina. The southern end of
Columbia 29 includes a portion of a park owned and operated by the Port of
Kalama. Shoreline vegetated area depths range from 0 feet to 63.3 feet within the
park, with an average depth of 20.6 feet. The average condition score of the
vegetated area, as estimated from aerial photos, is 1. The marina and associated

Cowlitz County Shoreline Analysis Report
172
docks are overwater structures in this reach. This area is all designated with
Industrial Zoning in the City of Kalama.
Water-dependent Uses and Water-related Uses: The marina is a water-
dependent use owned by the Port of Kalama and includes nine floating docks
with covered and uncovered moorage slips for recreational boats. The beach
access portion of Marine Park is a water-enjoyment use.
Future Land Use: The City of Kalama Comprehensive Plan shows this area as an
industrial zone, which is consistent with the current zoning. The Port of Kalama
has plans to develop an interpretive center with offices as well as a restaurant
and hotel on the marina (see the Permit Table). The Port of Kalama may expand
or redevelop additional industrial uses in this reach in the future.
Columbia 28 – City
Current Land Use: Land use in Columbia 28 is all industrial with two log float
areas adjacent to a large log storage and processing yard (RSG Forest Products).
The property is also part of the Port of Kalama. The shoreline is armored within
the entire reach. The shoreline vegetated area generally consists of small bushes
and grasses that are temporarily established on riprap slopes between periods of
periodic clearing to ensure stability of the armoring. The average condition score
of the vegetated area, as estimated from aerial photos, is 1. There are large docks
and overwater storage structures in this reach. This area is all designated with
Industrial Zoning in the City of Kalama.
Water-dependent Uses and Water-related Uses: Two water-dependent log float
areas and at least three docks exist within the Columbia River in Columbia 28.
The upland log storage area could be considered water-oriented based on the use
of the Columbia River shipping facility.
Future Land Use: The City of Kalama Comprehensive Plan shows this area as an
industrial zone, which is consistent with current zoning. Although fully
occupied with industrial uses at present, the Port of Kalama may expand or
redevelop additional industrial uses in this reach in the future.
Columbia 27 – UGA
Current Land Use: Columbia 27 includes a large area of forested floodplain
between industrial uses that is isolated from the river by a levee constructed in
the 1960s. East of the forested shore area, the Kalama Export Company industrial
use has rail lines, large silos for farm products, and docks along its shoreline.

The Watershed Company and Parametrix May 2014
173
The shoreline is armored within the entire reach. Shoreline vegetated areas are
not present waterward of the riprap slopes that border industrial lands, except
for small areas of accretion deposits which support vegetation waterward of the
toe of the artificial slope. The Port of Kalama docks are overwater structures in
this reach. The City of Kalama future land use designation within this reach is
industrial.
Water-dependent Uses and Water-related Uses: The docks associated with the
Port of Kalama industrial land are a water-dependent use for the export of
goods.
Future Land Use: It is anticipated that the developable portion of this reach will
remain in industrial use as part of the Port of Kalama, although the
comprehensive plan does not include this area. The Port of Kalama may expand
or redevelop additional industrial uses in this reach in the future.
Kalama River
Kalama 04 – UGA
Current Land Use: This reach is a long, narrow reach of inland floodplain
between I-5 and the railroad. It is vegetated but otherwise is vacant. There are no
buildings in this reach; however, 16 percent of the parcel area for this reach is
impervious surface due to transportation infrastructure. The average shoreline
vegetated area depth is 171.7 feet. The average condition score of the vegetated
area, as estimated from aerial photos, is 5. The shoreline is not armored in this
reach. There are no overwater structures in this reach. There is no City of
Kalama future land use designation within this reach.
Water-dependent Uses and Water-related Uses: There are no water-oriented
uses in this reach.
Future Land Use: No future changes in this reach are anticipated as it appears to
be undevelopable land due to its configuration. This area is not included in the
Kalama Comprehensive Plan.
Kalama 05 – City
Current Land Use: This small reach is densely forested up to the shore and is
otherwise vacant. It is adjacent to a local road and bridge crossing the Kalama
River. The parcel configuration is unusual with a 2-acre parcel about 250 feet
deep abutting the river, extending about 660 feet along the river abutted by a
very steep rock escarpment. This parcel is outside of the city limits. Behind it is

Cowlitz County Shoreline Analysis Report
174
a parcel 24.13 acres in size, with a width of about 660 feet and a depth of about
1,300 feet. A steep escarpment rises from the river over both parcels. There are
no buildings in this reach; however, 5 percent of the parcel area for this reach is
impervious surface due to transportation infrastructure. The average shoreline
vegetated area depth is 1,740 feet. The average condition score of the vegetated
area, as estimated from aerial photos, is 5. The shoreline is not armored within
this reach. There are no overwater structures in this reach. This reach is
designated with Single-Family Residential Zoning in the City of Kalama.
Water-dependent Uses and Water-related Uses: There are no water-oriented
uses in this reach.
Future Land Use: A small part of the westerly portion of this reach is included
in the Kalama Comprehensive Plan, and no significant growth or development is
expected.
Kalama 06 – UGA
Current Land Use: This small reach is mostly vegetated with shrubs and trees
but may have some manicured lawn and private shore access for the upland
residence. Shoreline vegetated area depths range from 97.3 feet to 1,089 feet,
with an average depth of 384.8 feet. The average condition score of the vegetated
area, as estimated from aerial photos, is 3.7. The shoreline is not armored within
this reach. There no overwater structures within this reach. The City of Kalama
future land use designation within this reach is residential.
Water-dependent Uses and Water-related Uses: There are no water-oriented
uses in this reach.
Future Land Use: If additional development were to occur in this area, it would
be anticipated to be low-density residential with a small number of units.
Kalama 08 – UGA
Current Land Use: Kalama 08 is a long reach, extending from the east side of I-5
on the north shore of the Kalama River to approximately Kalama River Road. At
the southern end near I-5 there is recreation access to the Kalama River at Camp
Kalama Resort with camping and a boat launch area. The remainder of the reach
is occupied by large, low-density residences and agricultural uses. Shoreline
vegetated area depths range from 0 feet to 1,514.8 feet, with an average depth of
387.4 feet. The average condition score of the vegetated area, as estimated from
aerial photos, is 2.8. The shoreline is not armored within this reach. There is one

The Watershed Company and Parametrix May 2014
175
dock in this reach. There is no City of Kalama future land use designation within
this reach.
Water-dependent Uses and Water-related Uses: The boat launch for recreation
access to the river is a water-dependent use.
Future Land Use: This area is designated for mixed use in the Kalama
Comprehensive Plan and can accommodate a variety of residential, commercial
and industrial uses. There are several large vacant properties within this reach
that could be used for potential development in the future. Redevelopment of
the existing resort is also a possibility. Over the long term, substantial new
mixed use development is anticipated in this area.
Kalama 09 – UGA
Current Land Use: This reach is a potential associated wetland to the Kalama
River and is surrounded by riparian forested areas and agricultural fields with
homes. Vegetated area depths range from 129.7 feet to 1,012.1 feet, with an
average depth of 600.9 feet. The average condition score of the vegetated area, as
estimated from aerial photos, is 3.1. There are no overwater structures in this
reach. This is part of the area designated for mixed use in the Kalama
Comprehensive Plan and can accommodate a variety of residential, commercial,
and industrial uses. Over the long term, substantial new mixed use development
is anticipated in this area. The easterly portion of this area is within a future
designated park.
Water-dependent Uses and Water-related Uses: There are no water-oriented
uses in this reach.
Future Land Use: Due to the Kalama Comprehensive Plan designation for
mixed use, substantial new mixed use development with a variety of residential,
commercial, and industrial uses is anticipated in this area. The easterly portion of
this area will be developed as active and passive park facilities.
Kalama 11 – City
Current Land Use: Kalama 11 is a small reach consisting only of the City of
Kalama drinking water treatment facility, one building near the road, and a
pump station building on the shore. Surrounding land use is very low-density
residential. The one parcel is 2 acres with a width of 232.9 feet and a depth of
261.3 feet. The building setback is 305.2 feet, and 6 percent of the parcel area for
this reach is impervious surface. Shoreline vegetated area depth is 281.3 feet.

Cowlitz County Shoreline Analysis Report
176
The condition score of the vegetated area, as estimated from aerial photos, is 2.
The shoreline is not armored within this reach. An ancillary structure for the
water treatment facility appears to be partially an overwater structure. This
reach is designated with Single-Family Residential Zoning in the City of Kalama.
Water-dependent Uses and Water-related Uses: The drinking water treatment
facility is a water-oriented use because of the need for access to water from the
Kalama River.
Future Land Use: This area in not included in the Kalama Comprehensive Plan.
As this small reach only consists of the drinking water treatment facility, no use
changes are anticipated; however, the City of Kalama may expand or redevelop
the utility use currently present.
Kalama 29 – UGA
Current Land Use: Kalama 29 contains the shoreline around Kress Lake. There
is a small corner of agricultural land at the southwest corner of the lake along
with a parking lot for a recreation trail. A wheelchair-accessible platform for
fishing or viewing the lake and small boat launch are also in this area. The
remainder of the shoreline is forested with a recreation trail around the perimeter
of the lake. Kress Lake is surrounded by agriculture and forest lands. Shoreline
vegetated area depths range from 491.5 feet to 925.3 feet, with an average depth
of 675.2 feet. The average condition score of the vegetated area, as estimated
from aerial photos, is 3.3. The shoreline is not armored within this reach. There
are no overwater structures in this reach. There is no City of Kalama future land
use designation within this reach.
Water-dependent Uses and Water-related Uses: Kress Lake has both water-
dependent and water-related uses. The boat launch and fishing access are water-
dependent, while wildlife viewing and the recreation trail are water-enjoyment
uses.
Future Land Use: The area around the lake owned by the Washington
Department of Fish and Wildlife is designated Recreation in the Kalama
Comprehensive Plan. The parcel to the south and generally 50 to 100 feet from
OHWM is designated for mixed use in the Kalama Comprehensive Plan.
Substantial new mixed use development with a variety of residential,
commercial, and industrial uses is anticipated in this area.

The Watershed Company and Parametrix May 2014
177
5.10 City of Kelso The City of Kelso is located at the confluence of the Cowlitz, Coweeman, and
Columbia Rivers. The assessment unit, which includes the UGB planning area
identified by the Cowlitz-Wahkiakum Council of Governments, has 882 acres of
shoreline jurisdiction covering 21.5 miles of River.

Cowlitz County Shoreline Analysis Report
178
Figure 5-31. Map of City of Kelso shoreline jurisdiction (1 of 2).

The Watershed Company and Parametrix May 2014
179
Figure 5-31. Map of City of Kelso shoreline jurisdiction (2 of 2).

Cowlitz County Shoreline Analysis Report
180
5.10.1 Ecological Characterization
Critical Areas
The NWI identifies wetlands on approximately 53 percent of shoreline
jurisdiction. Levees on the Coweeman and Cowlitz Rivers in the City and a
portion of its UGA occupy 38 percent of the total assessment unit shoreline
length. Within the City of Kelso city limits, levees occupy 65 percent of the total
shoreline length, including 100 percent of the Cowlitz River shoreline upstream
of the Coweeman River and the entire west bank of the Coweeman River
downstream from Allen Street Road. These levees preclude functioning
floodplains in much of the City; however, a portion of the Coweeman River
within the City has an active floodway, and floodplain areas occur along the
Coweeman River within the unincorporated UGA, as well as in Columbia Reach
20. In total, 69 percent of the shoreline area within the assessment unit is in the
mapped floodplain, of which, an additional 9 percent is within the floodway.
Reach Scale Functions
Ecological function scores are reported in Table 5-36 below along with parcel and
reach level data in Table 5-37.
Columbia River
Reach Columbia 20 is the only reach in the City of Kelso with Columbia River
frontage. This reach, located at the confluence with the Cowlitz River, includes
substantial area of potential wetland habitat in the eastern portion of the site. A
levee is present on the northwestern edge of the wetland, approximately 0.75
mile from the Columbia River shoreline; given its distance from the Columbia
River, its presence was not factored into the hydrologic scores. The entire reach
area is within the floodplain of the Columbia River. The dredge spoil deposit
area in the western portion of the site has a vegetated riparian area that varies
between 150 and 300 feet, and the reach performs significant hydrologic, habitat,
and water quality functions.
Owl Creek
Reach Columbia 43 in the City’s UGA on Owl Creek scores highly for hydrologic
functions because of a lack of shoreline armoring, and forested vegetation is
intact throughout much of the reach. Reach Columbia 42 in the City on Owl
Creek is also not armored, and it runs through a narrow depression between I-5
and a railway. This depression includes substantial areas of wetland emergent
and forested vegetation; given its location relative to roads and railways, this
reach has an especially significant role in water quality functions.

The Watershed Company and Parametrix May 2014
181
Cowlitz River
With the exception of Reaches Cowlitz 002 and 003, the entire Cowlitz River
shoreline in the City and its UGA are impaired by shoreline armoring and levees.
The series of levees has channelized the lower Cowlitz has channelized the lower
Cowlitz River, and ongoing levee maintenance results in limited shoreline
vegetation. A railway parallels the Cowlitz River, and further limits any
shoreline vegetation functions along most of the Cities reaches (Cowlitz 004, 006-
008). The most intact shoreline vegetation occurs in a portion of Reach Cowlitz
004, along the golf course, and in Cowlitz 007 where the railway curves away
from the shoreline.
Coweeman River
A levee isolates the Coweeman River from its northern shoreline for its entire
length within the City. Hydrologic connectivity is significantly better on the
southern (left) bank of the River (Reaches Cowlitz 32, 35-37, 43, and 46) and
within the eastern UGA (Reaches Cowlitz 44 and 45). Shoreline vegetation and
habitat are more diverse and provide greater habitat functions on the southern
bank of the Coweeman River, despite existing development and infrastructure.
In the eastern UGA, Reach Cowlitz 44 includes a large wetland area.
Table 5-36. Functional scores for reaches in City of Kelso Assessment Unit.
Waterbody City/ UGA Label
Hydrologic Overall
Hyporheic Overall
Habitat Overall
Vegetative Overall
Columbia River City Columbia 20 4 4 5 4
Owl Creek City Columbia 42 3 4 4 4
UGA Columbia 43 3 3 4 5
Cowlitz River City
Cowlitz 002 3 4 4 4
Cowlitz 003 2 4 3 4
Cowlitz 004 1 3 3 3
Cowlitz 005 1 3 3 3
Cowlitz 006 1 3 2 3
Cowlitz 007 1 4 4 4
UGA Cowlitz 008 1 2 2 2
Coweeman River
City
Cowlitz 032 3 4 4 5
Cowlitz 033 1 3 3 2
Cowlitz 034 1 3 3 2
UGA Cowlitz 035 3 4 4 5
City
Cowlitz 036 3 4 4 4
Cowlitz 037 3 4 4 4
Cowlitz 038 1 3 2 2
Cowlitz 039 1 3 3 2

Cowlitz County Shoreline Analysis Report
182
Waterbody City/ UGA Label
Hydrologic Overall
Hyporheic Overall
Habitat Overall
Vegetative Overall
UGA Cowlitz 040 1 4 4 3
Cowlitz 041 1 3 4 2
City Cowlitz 042 1 3 3 3
UGA
Cowlitz 043 3 4 4 4
Cowlitz 044 3 5 4 4
Cowlitz 045 3 3 4 4
City Cowlitz 046 3 4 5 4

The Watershed Company and Parametrix May 2014
183
Table 5-37. Summary of reach characteristics in the City of Kelso Assessment Unit.
Average Conditions by Parcel Total by Reach
Waterbody City/ UGA Reach Label
Parcel Size
(acre) Parcel
Width (ft) Parcel
Depth (ft) Shoreline
Setback (ft)
Average Depth of
Vegetated Area (ft)
Vegetated Condition
Ove
rwat
er
Stru
ctur
es
Shor
elin
e
Arm
orin
g %
Impe
rvio
us
%
Columbia City Columbia 20 39.8 1023 1496 155 876 4 0 25 3 Owl Creek City Columbia 42 35.2 781 1285 NA 472 4 0 0 11
UGA Columbia 43 4.4 434 166 4,076 469 5 0 0 6 Cowlitz River
City
Cowlitz 002 90.1 199 2115 NA 2,648 4 0 0 9 Cowlitz 003 10.1 200 901 NA 88 2 0 0 12 Cowlitz 004 45.4 169 1587 326 326 2 0 100 6 Cowlitz 005 0.9 67 205 217 44 1 1 100 44 Cowlitz 006 0.4 75 141 162 49 1 0 100 24 Cowlitz 007 2.5 73 496 244 74 3 0 100 81
UGA Cowlitz 008 5.8 159 1292 NA 77 2 0 100 80 Coweeman River City
Cowlitz 032 4.2 221 448 247 268 3 0 0 10 Cowlitz 033 3.7 75 598 586 72 1 0 100 41 Cowlitz 034 1.1 78 320 293 23 1 0 100 12
UGA Cowlitz 035 2.2 131 458 222 130 4 0 46 7
City
Cowlitz 036 1.9 161 200 136 254 4 0 0 1 Cowlitz 037 0.6 103 152 144 143 3 0 43 5 Cowlitz 038 7.6 93 389 259 41 1 0 100 64 Cowlitz 039 8.8 88 509 332 58 2 0 100 19
UGA Cowlitz 040 3.3 48 56 NA NA NA 0 0 0 Cowlitz 041 32.5 230 857 200 49 1 0 100 83
City Cowlitz 042 0.5 48 68 173 105 3 0 24 4
UGA Cowlitz 043 5.5 243 513 281 341 3 1 32 3 Cowlitz 044 7.3 179 897 135 335 3 0 45 22 Cowlitz 045 20.3 213 1591 417 856 3 0 0 0
City Cowlitz 046 208.9 199 1323 NA 4,013 5 0 0 0

Cowlitz County Shoreline Analysis Report
184
Restoration Opportunities
Hart’s Lake in reaches Cowlitz 044 and Cowlitz 046, is noted as an area for
potential restoration. This area has been targeted by the City of Kelso for the
development of a regional wetland bank.
5.10.2 Land Use Characterization
Future Land Use (Assessment Unit Analysis)
Little change in land use conditions was observed in the Kelso Assessment Unit
over the past ten years (Table 5-38). The area of vacant lands within shoreline
jurisdiction stayed the same, although because the area incorporated into the
analysis of land use changed slightly, the percent change gives the appearance of
a reduction in vacant lands. The area of single family residential development
showed the greatest increase of any land use type in the assessment unit, up 16
acres. The area categorized as transportation lands (including railroads and
rights of way) decreased by approximately 6 acres. It is expected that this
reduction is a primarily a result of differences in categorization of lands over
time.
Table 5-38. City of Kelso Assessment Unit: land use change 2002-2012.
Category
2002 2012 Change in Percent of Total Acres
Category Acres
Percent of Total Acres
Category Acres
Percent of Total Acres
Vacant 538 ac. 63.9% 538 ac. 61.5% -2.4% Single Family Residential 105 ac. 12.6% 121 ac. 13.9% +1.3% Transportation 128 ac. 15.3% 122 ac. 13.9% -1.3%
Permits within City of Kelso shoreline jurisdiction back to 2002 were obtained
from the City of Kelso and reviewed for applicability. Permits with a use change,
new development or significant expansion of an existing use are included in
Table 5-39. Only three permits were identified within the designated period and
shoreline area. These permits indicate that limited development of residential
and transportation uses and ongoing dredging and dredge disposal has
occurred.
Table 5-39. Ten-year permit history in the City of Kelso.
Reach Permit
Application Activity Location

The Watershed Company and Parametrix May 2014
185
Cowlitz 004 SHR09-003 Removal of approximately 50 trees from potential shoreline wetland area
South end of Kelso-Longview Airport runway (Parcel 240910100)
Cowlitz 005 06-001 Develop 54-unit townhomes 2200 Block of S. River Road (Parcel 24370)
Columbia 20 08-001 Continued use of existing 236 acre dredge material disposal site
Wasser-Winters Co. property at south end of Kelso, east bank of Cowlitz River between river mile 0 and 1.
Potential Use Conflicts
Kelso currently has no water-oriented uses, except for public access trails, and
the storage of dredge spoils, due to the isolation of the shoreline in many areas
by levees and transportation corridors. Because of the levees and transportation
corridors there is little potential for use conflicts.
Areas with potential for future water-oriented uses include the area near the golf
course (Cowlitz Reach 004 and 005), the area on the south bank of the Coweeman
River within the UGA (Cowlitz Reach 032), and the east bank of Carrol’s Channel
(Columbia 20). All of these areas are currently vacant with no existing single-
family dwellings or other potential conflicting uses.
Transportation and Utilities
In the City of Kelso, I-5 intersects the shoreline jurisdiction five times, twice
running parallel within reaches Columbia 43 and Cowlitz 32, and three times
crossing the Coweeman River. The BNSF Railroad is within shoreline
jurisdiction in two general areas, in and near reaches Columbia 20, Columbia 42,
Columbia 43, and Cowlitz 004 in the southern end of Kelso, and along the
downtown waterfront beginning in reach Cowlitz 006 where the railroad is
parallel with and within the shoreline jurisdiction from Cowlitz 006 north to
Cowlitz 008. There are three crossings of the Cowlitz River within the city limits:
Tennant Way (SR 432), Allen Street (SR 4) and W Cowlitz Way (SR 4).
Existing and Potential Public Access
Public access is described for each reach in the City of Kelso and its
unincorporated UGA in Table 5-40 below.
Table 5-40. Public access opportunities in the Kelso Assessment Unit.
Reach Potential Public Access Description Cowlitz 004 Three Rivers Golf Course. Public course with frontage on river at its southern
end.

Cowlitz County Shoreline Analysis Report
186
Reach Potential Public Access Description Vacant shore land that appears to be used for beach access, but is not officially public access. Further research is required.
Cowlitz 005 Access to short trail and sandy bank at shore at Yew Street. Further research is required.
Cowlitz 005-007 Cowlitz River Dike Trail Cowlitz 008 Gravel extension of Cowlitz River Dike Trail Cowlitz 034, 038, Cowlitz 40-42
Coweeman River Trail
Cowlitz 39 Tam O’Shanter Park and Coweeman River Trail
Reach Scale Analysis of Current Land Use, Water-dependent and Water–related uses, and Future Land Use
The City of Kelso shoreline reaches include low- and high-density residential,
commercial, industrial, and recreational uses. The following descriptions for
each reach will summarize existing and planned land uses and details regarding
shoreline treatments and features.
Columbia River
Columbia 20 – City
Current Land Use: There are no structures in Columbia Reach 20, and the south
and easterly portion of the site includes potential wetlands. The westernmost
portion of the reach contains a permitted dredge disposal site, which is partially
within shoreline jurisdiction. This reach is designated with IGM – General
Manufacturing zoning in the City of Kelso.
Water-dependent Uses and Water-related Uses: None.
Future Land Use: The area is all designated for industrial use in the Kelso
Comprehensive Plan. As much of this land is vacant, there is potential for future
industrial development.
Columbia 42 – City
Current Land Use: This reach is along Owl Creek running between I-5 and a
railroad line. No development exists along the creek or between these two
transportation corridors. This reach is designated with IGM – General
Manufacturing, and CMR – Major Retail Area zoning in the City of Kelso.
Water-dependent Uses and Water-related Uses: There are no water-oriented
uses in this reach.

The Watershed Company and Parametrix May 2014
187
Future Land Use: This area is designated for industrial and commercial uses in
the Kelso Comprehensive Plan. No plans are known for future development and
no major use changes are anticipated.
Columbia 43 – UGA
Current Land Use: This reach follows Owl Creek on the east side of I-5 through
a forested area along the creek in unincorporated Cowlitz County. It is
surrounded by large lot, low-density residential development. The shoreline is
not armored within this reach, and there are no overwater structures. This area
is not designated with City of Kelso zoning.
Water-dependent Uses and Water-related Uses: There are no water-oriented
uses in this reach.
Future Land Use: This area is not included in the comprehensive plan. No use
changes are anticipated in this residential area. Further residential development
may be possible.
Cowlitz River
Cowlitz 002 – City
Current Land Use: This reach begins just east of the confluence of Cowlitz River
and Columbia River. It includes vegetated shoreline and is adjacent to the north
boundary of a sediment dredge storage location owned by Wasser-Winters Co.
This reach is designated with IGM – General Manufacturing zoning in the City of
Kelso.
Water-dependent Uses and Water-related Uses: The sand/gravel/ash storage
location was the result of dredging. The site does not, however, host any water-
oriented uses.
Future Land Use: This area is designated for industrial use in the Kelso
Comprehensive Plan. Land upland of reach Cowlitz 002 is considered vacant so
there is potential for future industrial development.
Cowlitz 003 – City
Current Land Use: This reach begins at the railroad crossing and ends at the
confluence of the Cowlitz River with the Coweeman River. There is a narrow
band of riparian vegetation right along shore. The land is mostly vacant, and
there is only one parcel in the reach. This reach is designated with IGM –
General Manufacturing zoning in the City of Kelso.

Cowlitz County Shoreline Analysis Report
188
Water-dependent Uses and Water-related Uses: There are no water-oriented
uses in this reach.
Future Land Use: This area is designated for industrial use in the Kelso
Comprehensive Plan. Land upland of reach Cowlitz 003 is considered vacant so
there is potential for future industrial development, but significant use changes
are not anticipated.
Cowlitz 004 – City
Current Land Use: At its southern end, Cowlitz 004 begins with a very narrow
shore between the Cowlitz River and a railroad. Upland of the railroad is the
south end of the runway at the Southwest Washington Regional Airport. Moving
north, the shoreline includes beach potentially formed with dredge spoil deposits
and riparian vegetation and a small portion of the adjacent Three Rivers Golf
Course, which is open to the public. Further north in Cowlitz 004, the beach and
riparian vegetation area is wider and the shoreline jurisdiction does not include
the golf course. The beach and vegetation area is privately owned but has many
crisscrossing foot paths that appear to be used to access the Cowlitz River. This
reach is designated with OPN – Open Space and RMF – Residential Multi-Family
zoning in the City of Kelso.
Water-dependent Uses and Water-related Uses: There are no water-oriented
uses in this reach.
Future Land Use: Land upland of the railroad at the southern end of this reach
is designated for industrial use in both the current zoning map and Kelso
Comprehensive Plan. The remainder of this reach is designated as open space in
the Kelso Comprehensive Plan. Plans are underway to extend the airport
runway. The extension may involve impacts to wetlands with potential
shoreline jurisdiction and mitigation may be required. This area may be
appropriate for multi-family development and may present opportunities for
associated restoration and public access. No other land use change or significant
growth is expected in this reach.
Cowlitz 005 – City
Current Land Use: Cowlitz 005 begins at the north end of the Three Rivers Golf
Course. The shoreline jurisdiction includes S. River Road and portions of
medium-density single family residences at its southern end. North of Olive
Street, the shoreline includes portions of an industrial use and unimproved land,

The Watershed Company and Parametrix May 2014
189
and then moves back to medium to low-density single family residential use
again. West of Riverside Drive, the bank appears partially armored, and there is
minimal riparian vegetation. Industrial uses and potentially one or two
residential uses are near the river. There is unparcelized right-of-way land
(approximately aligned as if Yew Street were to extend to the Cowlitz River) that
has a sandy beach that has a trail leading down to the shore. Ownership of this
area is unclear and needs further research. This area also the southern terminus
of the Cowlitz River Dike Trail, which lies adjacent to the railroad on the Cowlitz
River Dike, separated by a high safety and security fence. In this reach, the trail
is separated from the river by Riverside Drive and industrial uses. This reach
ends at approximately Mill Street.
There is one small dock over the water near the north end of the golf course
within this reach. This reach is designated with RSF-10- Residential Single
Family zoning in the City of Kelso and possibly ILM – Airport Industrial/Light
Industrial..
Water-dependent Uses and Water-related Uses: The unofficial recreation access
across from Yew Street provides a water-enjoyment use that may or may not be
appropriate over time. Further research is required.
Future Land Use: This area is designated with industrial and commercial uses in
the comprehensive plan, not consistent with the current single family zoned area.
There may be potential for use change if property in this area is redeveloped.
There are also several parcels classified as vacant which presents the potential for
future development.
Cowlitz 006 – City
Current Land Use: Cowlitz 006 includes the east side of the Cowlitz River from
approximately Mill Street to approximately Columbia Street. Just north of Mill
Street, there is a City-owned undeveloped vegetated parcel at the shore. The
shore between the river and the railroad is quite narrow north of this point up to
the end of this reach at approximately Columbia Street. The bank has
approximately 40-50 feet of vegetation. The shoreline jurisdiction extends inland
beyond the levee and railroad at approximately Cedar Street continuing north to
Allen Street. Land uses within the shoreline jurisdiction between Cedar Street
and Allen Street include light industrial, rail station, and office uses. North of
Allen Street, the shoreline jurisdiction area includes the rail line and areas used

Cowlitz County Shoreline Analysis Report
190
for rail-related activities and the vegetated shore up to approximately Columbia
Street.
Throughout this reach, the Cowlitz River Dike Trail lies on the Cowlitz River
Dike between the river and the BNSF railroad. The trail is separated from the
railroad by a high safety and security fence. There are no official rail crossing
locations providing access to the trail, but users typically cross at grade at Mill
Street or at Yew Street.
The reach also includes a small area along the west side of the Cowlitz River, in
West Kelso from approximately Fishers Lane, to approximately Washington
Street. This area includes a levee, local roads, some beach areas, medium density
residences, and office and retail uses.
Two bridges cross the Cowlitz River within this reach. This reach is designated
with RSF-10- Residential Single Family, RSF-5- Residential Single Family OPN –
Open Space, CTC – Town Center Community, CSR – Special Retail District, and
CWK – West Kelso Community zoning in the City of Kelso.
Water-dependent Uses and Water-related Uses: There are no water-dependent
uses in this reach. The Cowlitz River Dike Trail provides a water- enjoyment
opportunity on the shoreline.
Future Land Use: This area is designated with high-density residential and
commercial uses in the Kelso Comprehensive Plan, consistent with current
zoning. No significant growth or use changes are anticipated for the downtown
area at this time.
Cowlitz 007 – City
Current Land Use: This reach begins at approximately Columbia Street where
the shore widens compared to the reach just to the south. Parcels waterward of
the levee and the railroad are undeveloped and forested with some trails that
potentially connect to the Cowlitz River Dike Trail (the paved portion of the trail
ends at Barnes Road). Some of these parcels are owned by the City of Kelso and
some by private owners, and it appears there may be limited dock access to the
river. At approximately Redpath, the shoreline has a large sandy beach area
with a utility use. Upland development inland of this reach is medium to low-
density residential. This reach is designated with RSF-5- Residential Single
Family and OPN – Open Space zoning in the City of Kelso.

The Watershed Company and Parametrix May 2014
191
Water-dependent Uses and Water-related Uses: There may be potential water-
dependent recreational uses if a dock are present (available aerial photography
was inconclusive). The Cowlitz River Dike Trail provides recreational access
along the river as a water-enjoyment use.
Future Land Use: Land in this reach along the river is designated as commercial
use in the Kelso Comprehensive Plan, while land adjacent to the railroad is
designated as low or high density residential. The commercial designations may
not be consistent with the current open space zoning applied to portions of this
reach, but given the limited access, there is little potential for use change in the
future. No known plans for development were identified.
Cowlitz 008 – UGA
Current Land Use: This reach begins at approximately Barnes Street and is in
unincorporated Cowlitz County. The shoreline is mostly inaccessible due to the
multiple rail lines, although it is fairly wide and vegetated. Landward of the rail
yard there are low-density residential developments. This reach is not included
in City of Kelso zoning.
Water-dependent Uses and Water-related Uses: There are no water-dependent
uses in this reach. The Cowlitz River Dike Trail provides a water- enjoyment
opportunity on the shoreline.
Future Land Use: This reach is outside the limits of the comprehensive plan. No
known plans for this residential area were identified and no use changes are
anticipated.
Coweeman River
Cowlitz 032 – City
Current Land Use: This is a long reach on the eastern shore, starting at the
confluence of the Coweeman River with the Cowlitz River. The shore of the
Coweeman has a narrow band of riparian vegetation. Landward, there are local
roads, undeveloped but development-prepared land, and two commercial built
lots. Moving north up the Coweeman River, there is a forested area with the
shoreline jurisdiction extending into the I-5 right-of-way. The forested shore
narrows and is more sparsely vegetated moving further north. This reach also
includes an I-5 crossing of the Coweeman River and one single-family residence.
The Talley Way Bridge crosses over the Cowlitz River in this reach. This reach is
designated with RSF-15- Residential Single Family, and CMR – Major Retail Area
zoning in the City of Kelso.

Cowlitz County Shoreline Analysis Report
192
Water-dependent Uses and Water-related Uses: There are no water-oriented
land uses in this reach.
Future Land Use: Kelso Comprehensive Plan designations within this reach
include Commercial, Industrial, and Low-density Residential. The southern end
of the reach includes several vacant parcels with commercial zoning, thus though
no permits were identified for new development there, commercial growth is
anticipated. No use changes or growth is expected in the remainder of the reach.
Cowlitz 033 – City
Current Land Use: This reach begins on the northern and western shores of
Coweeman River just east of the confluence with the Cowlitz River. A levee
exists about 60 feet landward from the water throughout this reach, and starts
just east of Talley Way. A recreational trail, the Coweeman River Trail, runs
along the top of the levee. The southernmost access point for the trail is at Talley
Way. The shore between the levee and the water is vegetated with mowed grass
or small shrubs. Landward of the levee, the shoreline jurisdiction includes
vacant land, industrial uses and big box retail development. At the north end of
this reach, there is a small oxbow lake with shoreline jurisdiction bordered by
shrubby vegetation and industrial uses. This reach also includes an I-5 crossing
of the Coweeman River and one single-family residence. The Talley Way Bridge
crosses over the Cowlitz River in this reach. This reach is designated with ILM –
Airport Industrial/Light Industrial Area zoning in the City of Kelso.
Water-dependent Uses and Water-related Uses: There are no water-dependent
uses in this reach. The Coweeman River Trail provides a water- enjoyment
opportunity on the shoreline.
Future Land Use: Land in this reach is all designated for Industrial use in the
Comprehensive Plan, consistent with current zoning. There are several vacant
parcels in the northern half of the reach that may provide potential for industrial
development in the future. No use changes are anticipated.
Cowlitz 034 – City
Current Land Use: This reach begins at the south with the I-5 crossing of the
Coweeman River and where there is undeveloped land that is sparsely
vegetated. Moving north, there is a second I-5 crossing. Cowlitz 034 continues
on the west side of the river and primarily includes a levee with the Coweeman
River Trail. There is a small extension of shoreline jurisdiction to the west to the
The Watershed Company and Parametrix May 2014
193
west that includes some medium density residential development and two
undeveloped lots within the shoreline jurisdiction bordering a creek that drains
to the Coweeman River. The two I-5 bridges in this reach are overwater
structures. This reach is designated with RSF-15- Residential Single Family, ILM
– Airport Industrial/Light Industrial Area and CSR – Special Retail District
zoning in the City of Kelso.
Water-dependent Uses and Water-related Uses: There are no water-dependent
uses in this reach. The Coweeman River Trail provides a water- enjoyment
opportunity on the shoreline.
Future Land Use: Land in this reach is designated with Industrial and
Commercial uses in the Comprehensive Plan, consistent with current zoning.
There are a few vacant parcels identified at the northern end of the reach,
primarily surrounding a small wetland area. No significant growth or land use
changes are expected for this reach.
Cowlitz 035 – UGA
Current Land Use: Cowlitz 035 is within unincorporated Cowlitz County with
low-density residential development and forested areas. This area is not
included in the City of Kelso Zoning.
Water-dependent Uses and Water-related Uses: There are no water-oriented
uses in this reach.
Future Land Use: This area is outside of the comprehensive plan. No significant
land use changes or significant development is expected in this reach.
Cowlitz 36 – City
Current Land Use: Cowlitz 36 consists primarily of forested riparian land, with
the exception of the I-5 bridges at its southern extent. The Grade Street Bridge in
this reach is an overwater structure. This reach is designated with CSR – Special
Retail District zoning in the City of Kelso.
Water-dependent Uses and Water-related Uses: There are no water-oriented
uses in this reach.
Future Land Use: A portion of the land in this reach is designated as
Commercial use, consistent with current zoning and a portion shows no
designation within the comprehensive plan. There is a large undeveloped area
Cowlitz County Shoreline Analysis Report
194
within this reach with commercial zoning that may be suitable for future
commercial development growth. No plans are known at this time.
Cowlitz 37 – City
Current Land Use: This reach along the south shore of the Coweeman River
includes approximately five medium density single family residences, with at
least one private floating dock to access the water. Cowlitz 37 includes another I-
5 crossing as well as a local road bridge crossing at S. Kelso Road. North of S.
Kelso Road, the reach is primarily undeveloped with shrubs/grasses along the
shoreline. This reach is designated with RSF-15- Residential Single Family and
RSF 10 – Residential Single Family zoning in the City of Kelso.
Water-dependent Uses and Water-related Uses: The private residential access
docks within this reach are accessory water-dependent uses.
Future Land Use: Land in this reach is designated with Low-Density Residential
and Commercial uses in the Comprehensive Plan, primarily consistent with
current zoning. There are several undeveloped residential lots, but no significant
growth or use changes are anticipated.
Cowlitz 38 – City
Current Land Use: This reach runs along the north side of the Coweeman River,
with the levee and Coweeman River Trail continuing throughout the reach.
There is a commercial restaurant use at the southern extent of the reach and a
bridge crossing at Grade Street. To the northeast of Grade Street up to the I-5
bridges, the land is undeveloped. Near I-5, the shoreline jurisdiction also
includes portions of local roads, parking lots and a commercial building. The
Grade Street Bridge in this reach is an overwater structure. This reach is
designated with RMF – Residential Multi-Family and CMR – Major Retail Area
zoning in the City of Kelso.
Water-dependent Uses and Water-related Uses: There are no water-dependent
uses in this reach. The Coweeman River Trail provides a water- enjoyment
opportunity on the shoreline.
Future Land Use: Land in this reach is designated with Commercial use in the
comprehensive plan, primarily consistent with current zoning. There are no
vacant parcels in this reach and no use changes or significant growth is
anticipated.

The Watershed Company and Parametrix May 2014
195
Cowlitz 39 – City
Current Land Use: The levee and Coweeman River Trail continue through the
Cowlitz 39 reach along the north shore of the Coweeman River. The shoreline
jurisdiction is expanded at the west end of this reach and includes the majority of
a baseball field that is part of Tam O’Shanter Park. The shoreline jurisdiction
primarily includes the levee and trail, but in places within this reach it also
includes a sliver of the upland recreation field that is part of Tam O’Shanter Park.
The trail can be accessed from Tam O’Shanter Park, but there is no direct river
access.
This reach appears to have slivers of unincorporated Cowlitz County along the
river side of the shoreline. The S. Kelso Road Bridge in this reach is an
overwater structure. This reach is designated with RMF – Residential Multi-
Family and OPN – Open Space zoning in the City of Kelso.
Water-dependent Uses and Water-related Uses: There are no water-dependent
uses in this reach. The Coweeman River Trail provides a water- enjoyment
opportunity on the shoreline.
Future Land Use: Land in this reach is primarily designated with Parks/Open
Space use in the comprehensive plan, with a small portion of Commercial
designation. The commercial area is currently zoned for multi-family residential
uses, inconsistent with the Comprehensive Plan, however the current use is
recreation, so no use changes are anticipated and no growth is anticipated in this
reach.
Cowlitz 40 – UGA
Current Land Use: This reach contains a very thin strip of land that is within
unincorporated Cowlitz County along the north and south banks of the
Coweeman River along Cowlitz 39 and Cowlitz 37. This land is primarily
undeveloped with a small portion of a residential use adjacent to Cowlitz 37. A
portion of the Coweeman River Trail may be within Cowlitz 40. There is a
portion of one 3.06 acre parcel in this reach, with a depth of 55.7 feet and a width
of 48.4 feet. There are no buildings in this reach and no impervious surface. This
reach is not included in City of Kelso zoning.
Water-dependent Uses and Water-related Uses: There are no water-dependent
uses in this reach. The Coweeman River Trail provides a water- enjoyment
opportunity on the shoreline.

Cowlitz County Shoreline Analysis Report
196
Future Land Use: Land in this reach is designated with Parks/Open Space use in
the Kelso Comprehensive Plan and the areas outside of the city limits have no
future land use designation. No future growth or use changes are anticipated.
Cowlitz 41 – UGA
Current Land Use: This small reach includes undeveloped land including the
dike and trail riverward of a mobile home park in unincorporated Cowlitz
County. It only includes land within the UGA, not within the city limits. This
reach is not included in City of Kelso zoning.
Water-dependent Uses and Water-related Uses: There are no water-dependent
uses in this reach. The Coweeman River Trail provides a water- enjoyment
opportunity on the shoreline.
Future Land Use: Land within this reach is not included in the Kelso
Comprehensive Plan. No significant use changes or development are
anticipated.
Cowlitz 42 – City
Current Land Use: Reach 42 includes the levee and Coweeman River Trail to
their termini. The reach consists of the edge of a large mobile home park. Users
are able to access the trail at the top of the dike at Allen Street. The shoreline also
includes two small tributaries. This reach is designated with RMF – Residential
Multi-Family zoning in the City of Kelso.
Water-dependent Uses and Water-related Uses: There are no water-dependent
uses in this reach. The Coweeman River Trail provides a water- enjoyment
opportunity on the shoreline.
Future Land Use: Land within this reach is designated with High-Density
Residential use in the Comprehensive Plan. No future use changes or significant
development is anticipated in this reach.
Cowlitz 43 – UGA
Current Land Use: Uses in this reach include low-density residential and
undeveloped land within unincorporated Cowlitz County. There is one private
dock overwater structure in this reach. This reach is not included in City of
Kelso zoning.

The Watershed Company and Parametrix May 2014
197
Water-oriented Uses: The private residential access dock within this reach is an
accessory water-dependent use.
Future Land Use: Land within this reach is not included in the Kelso
Comprehensive Plan. There are several parcels identified as vacant within this
reach that may be suitable for future low-density residential development,
however no use changes or significant growth is anticipated.
Cowlitz 44 – UGA
Current Land Use: This is a large reach that exists along the north and south
shores of the Coweeman River in unincorporated Cowlitz County, to the east of
the city limits. It includes a large wetland area south of the river. Land in this
reach is undeveloped or in agricultural uses. Note that this reach includes a
small, non-contiguous piece of land north of Allen Street along a small tributary
to the Coweeman River. This area is also undeveloped. This reach is not
included in City of Kelso zoning.
Water-dependent Uses and Water-related Uses: There are no water-oriented
uses in this reach.
Future Land Use: Land within this reach is not included in the Kelso
Comprehensive Plan. No use changes or significant growth is anticipated in this
reach.
Cowlitz 45 – UGA
Current Land Use: This reach includes low-density residential and agricultural
uses to the north of the shoreline jurisdiction. The majority of the land within
shoreline jurisdiction directly adjacent to the river is partially forested. This
reach is within unincorporated Cowlitz County and is not included in City of
Kelso zoning.
Water-dependent Uses and Water-related Uses: There are no water-oriented
uses in this reach.
Future Land Use: Land within this reach is not included in the Kelso
Comprehensive Plan. No use changes or significant growth is anticipated in this
reach.
Cowlitz 46 – UGA

Cowlitz County Shoreline Analysis Report
198
Current Land Use: This small reach in unincorporated Cowlitz County consists
of the southern edge of the large wetland complex described in Cowlitz 44,
consisting of some open grassy areas and some shrubby areas. This reach is not
included in City of Kelso zoning.
Water-dependent Uses and Water-related Uses: There are no water-oriented
uses in this reach.
Future Land Use: Land within this reach is not included in the Kelso
Comprehensive Plan. No use changes or significant growth is anticipated in this
reach.
5.11 City of Woodland and UGA The City of Woodland is located on the lower North Fork Lewis River,
approximately 2 miles upstream of the confluence with the East Fork Lewis River
and 5 miles upstream from the confluence with the Columbia River. The City of
Woodland also includes shorelines on Horseshoe Lake, an 85 acre historic oxbow
that was isolated from the Lewis River when Interstate 5 was constructed in
1940. In total, the assessment unit includes 237 acres of shoreline jurisdiction.

The Watershed Company and Parametrix May 2014
199
Figure 5-32. Map of City of Woodland shoreline jurisdiction.

Cowlitz County Shoreline Analysis Report
200
5.11.1 Ecological Characterization
Critical Areas
The NWI identifies wetlands on approximately 24 percent of shoreline
jurisdiction. A levee separates Horseshoe Lake from the Lewis River, and the
levee extends north to Lewis Reach 12. Nearly half of the total shoreline area is
within the mapped floodplain, 33 percent of which falls within the floodway.
The majority of the floodway area occurs in Reach 13 and Reach 15. In addition
to listed salmonids using the Lewis River, priority species in the City include a
bald eagle’s nest in Lewis Reach 15. Horseshoe Lake is isolated from
anadromous fish use, but the lake is stocked with rainbow trout and brown trout
for recreational fishing opportunities.
Reach Scale Functions
The City’s northern shoreline area (Reaches 13-15) includes riparian vegetation
and off-channel backwater habitats. Large woody debris is present in the
backwater habitats, and is occasionally present along riparian habitats in the
mainstem river. Mid-channel islands are vegetated with early colonizing shrubs
and trees, providing instream habitat complexity. Reaches 13 and 15 provide the
most densely vegetated forested shoreline in the City. These reaches also
provide some of the highest functioning reach for hydrologic processes in the
City because they provide hydrologically connected floodway areas (Table 5-41).
Riparian vegetation is limited in the City’s core downtown area. The levee that
separates Reach 12 from the River acts to channelize the River through the City’s
core area.
The City’s shoreline on Horseshoe Lake is developed with roads, parks, and
residential and commercial development. At least eighteen overwater structures
are present on Horseshoe Lake, associated with existing residential development
(Table 5-42).
Table 5-41. Functional scores for reaches in City of Woodland Assessment Unit.
Waterbody City/UGA Label Hydrologic
Overall Hyporheic
Overall Habitat Overall
Vegetative Overall
Horseshoe Lake UGA Lewis 06 1 4 3 Lewis River Lewis 07 1 4 4 3
Horseshoe Lake
City Lewis 08 3 2 3 Lewis 09 2 2 2 Lewis 10 2 2 2

The Watershed Company and Parametrix May 2014
201
Waterbody City/UGA Label Hydrologic
Overall Hyporheic
Overall Habitat Overall
Vegetative Overall
Lewis River City
Lewis 11 1 4 3 3 Lewis 12 1 3 2 2 Lewis 13 3 4 4 4 Lewis 14 3 4 4 4 Lewis 15 3 4 4 4 Lewis 16 2 3 2 3

Cowlitz County Shoreline Analysis Report
202
Table 5-42. Summary of reach characteristics in the City of Woodland Assessment Unit.
Average Conditions by Parcel Total by Reach
Waterbody City/ UGA Reach Label
Parcel Size
(acre) Parcel
Width (ft) Parcel
Depth (ft) Shoreline
Setback (ft)
Average Depth of
Vegetated Area (ft)
Vegetated Condition O
verw
ater
St
ruct
ures
Shor
elin
e
Arm
orin
g %
Impe
rvio
us
%
Horseshoe Lake
Clark Co. UGA
Lewis 06 79 N/A N/A 850 800 5 0 0 <1
Horseshoe Lake
Clark Co. UGA Lewis 07 39.8 1,496.5 1,022.6 154.7 876.4 3.8 0 0 3
Horseshoe Lake
Clark Co. UGA
Lewis 09 2.23 325.9 127.3 149.5 60.4 1.9 18 0 8
Horseshoe Lake
City
Lewis 08 0.6 102.0 77.2 123.8 55.5 1.7 10 4 23.6 Lewis 10 4.5 747.1 117.1 69.8 121.5 2 0 94 24 Lewis 11 1.8 279.7 99.7 343.6 32.8 1.5 0 0 17 Lewis 12 1.4 220.6 87.5 178.3 71.5 3 0 0 30 Lewis 13 1.2 158.4 203.3 671.3 262.4 2.1 0 0 6 Lewis 14 0.5 93.6 173.6 154.8 181.6 1.8 2 15 12
Lewis River Lewis 15 4.7 264.2 146.4 328.4 554.9 1.9 0 0 2 Lewis 16 1.1 149.3 137.6 112.6 86.9 1.9 3 30 12

The Watershed Company and Parametrix May 2014
203
Restoration Opportunities
There are several restoration sites available within the City of Woodland. The
areas zoned for floodway are the most obvious areas for restoration and are
generally found in the Lewis 13, 14 and 15 reaches. There are also restoration
opportunities to found south of the CC Street Bridge within the floodway. In this
location there are lots of invasive species and informal camping.
5.11.2 Land Use Characterization
Future Land Use (Assessment Unit Analysis)
The area of vacant lands and land designated as undeveloped decreased over the
past ten years (Table 5-43). The area designated as multi-family residential use
decreased by four acres, while single family uses increased by three acres. Based
on these past trends in land use, continued gradual infill of single family
residential development is anticipated. Growth in multi-family residential
development is not expected in the foreseeable future.
Table 5-43. City of Woodland Assessment Unit: significant land use change 2002-2012.
Category
2002 2012 Change in Percent of Total Acres
Category Acres
Percent of Total Acres
Category Acres
Percent of Total Acres
Vacant 70 ac. 50.2% 64 ac. 50.4% -0.2% Undeveloped 77 ac. 55.7% 68 ac 54.1% -1.6% Single Family Residential 23 ac. 16.8% 26 ac. 20.2% +3.4% Multi-Family Residential 14 ac. 10.2% 10 7.6% -2.6%
Permits within City of Woodland shoreline jurisdiction back to 2002 were
obtained from the City of Woodland and reviewed for applicability. Permits
with a use change, new development or significant expansion of an existing use
are included in Table 5-44. These permits indicate that development of
residential, including subdivision of land, and transportation uses and ongoing
dredging and dredge disposal has occurred.
If similar land use and permit trends continue in the future, gradual expansion of
single family residential uses is likely to continue in the City.

Cowlitz County Shoreline Analysis Report
204
Table 5-44. Ten-year permit history in the City of Woodland.
Reach Permit
Application Activity Location Lewis 06 – Clark County – Horseshoe Lake
No substantial activity
Lewis 07 –Clark County – Horseshoe Lake
No substantial activity
Lewis 08 – City –Horseshoe Lake 202-933
Street reconstruction (Davidson & Goerig, from 5th to Bozarth)
S24, T5N,R1W
210-925 Rocks to bolster road embankment
in ROW, E of S Pekin, SE of intersection of S Pekin & Windflower, and NE of 449 Windflower Dr.
211-903 Construct 300' of sidewalk on W side of S Pekin Rd.
155 S Pekin Rd, parcel 5078
204-907 Street reconstruction Dunham Ave. 205-920 3 lot subdivision 201 S Pekin Road
205-947 Harmony Park, 21 lot subdivision.
East of the BNSF, west of S Pekin Rd adjacent to Horseshoe Lake
214-911 Safe Route to School (sidewalk construction) South Pekin
213-935 Lilac Lane Subdivision (proposed 12 lot subdivision)
Approx. 106/110 South Pekin
Lewis 09 – Woodland UGA/Clark County – Horseshoe Lake
203-931 Bulkhead and floating dock 354 Island Aire Dr, parcel 5-0645-515-039
205-932
Retaining wall + fill placed behind retaining wall (Applicant ordered to remove retaining wall and all fill brought in.)
442 Island Aire Drive
Lewis 10 – City –Horseshoe Lake
202-933 (also in Lewis 8)
Street reconstruction (Davidson & Goerig, from 5th to Bozarth)
S24, T5N,R1W
205-929 Outdoor skate park Horseshoe Lake Park, S24, T5N, R1W, W.M.
Lewis 11 – City –Lewis River
No substantial activity
Lewis 12 – City –Lewis River
204-908 Lewis River bridge seismic rehabilitation
CC Street, S19, T5N, R1E
206-941 Ranney Well/Pump Replacement
1380 Lewis River Rd., parcel 5-056401.
209-926 Establish resturant in with tavern, demo existing single family dwelling.
1382 N Goerig, parcel 5-0564

The Watershed Company and Parametrix May 2014
205
Reach Permit
Application Activity Location
213-930 Ranney Well Improvements (new laterals / cleaning of existing laterals)
1380 Lewis River Road
213-923 Woodport Place duplexes (constructing 6 new duplex buildings)
1489 Goerig
Lewis 13 – City –Lewis River
206-918 Riverwood Short Plat. 4 lots 1772 Lewis River Rd
206-904 Lewis River Front Park #4, 2.93 acres for 14 lot PURD. 1874 Lewis River Rd.
Lewis 14 – City –Lewis River
No substantial activity
Lewis 15 – City –Lewis River
205-942 109 lot subdivision (Riverview Residential)
2215 Lewis River Road, between the State Highway and the Lewis River
Lewis 16 – City –Lewis River
No substantial activity
Potential Use Conflicts
Woodland currently has no water-oriented uses except for public recreation
areas on Horseshoe Lake. The commercial areas along the Lewis River and
Horseshoe Lake are likely to provide some water-oriented uses as well as
ecological enhancement and public access. These areas are largely abutted by
commercial areas which are not likely to present use conflicts.
Transportation and Utilities
The majority of the transportation routes within the City of Woodland shoreline
jurisdiction areas are local roads. The exceptions are where I-5 travels adjacent to
Horseshoe Lake and where Lewis River Road (SR 503) travels parallel to the
Lewis River through reach Lewis 12 and a small portion of reach Lewis 13. There
are no railroads within shoreline jurisdiction. A portion of the Woodland State
Airport is adjacent to Lewis 07.
Existing and Potential Public Access
Public access is described for each reach in the City of Woodland and its
unincorporated UGA in Table 5-45 below.
Table 5-45. Public access opportunities in the Woodland Assessment Unit.
Reach Potential Public Access Description Lewis 07 Informal fishing access on state airport property Lewis 09 Informal fishing/ swimming location at start of Island Aire Drive

Cowlitz County Shoreline Analysis Report
206
Lewis 10 Horseshoe Lake Park – this is a public Park with public boat ramp, adjacent amphitheater, skatepark and picnic shelters
Lewis 12 Informal fishing/ swimming location accessed Goerig St and Cherry Blossom Lane
Lewis 13 Informal fishing/ swimming location accessed from southern end of Gun Club Road
Lewis 15 Informal fishing/ swimming location accessed from businesses on McCracken Road.
Reach Scale Analysis of Current Land Use, Water-dependent and Water–related uses, and Future Land Use
Lewis 06 – Clark County – Horseshoe Lake
Current Land Use: This reach is almost entirely made up of one large-lot single-
family residential parcel (255196000). This parcel occupies the vast majority of
land acreage inside of Horseshoe Lake. With the exception of the residential
structure, the remainder of the parcel (including the shoreline) is undeveloped.
The remainder of the reach occupies local street and Interstate 5 right-of-way.
The parcel is 79 acres in size. The single building setback is 850 feet from the
southern shore, which is the nearest to the house. Much less than 1 percent of the
parcel area for this reach is impervious surface. The shoreline vegetated area
depth is 800 feet between the house and the southern shore with a vegetated
condition score of 5. The shoreline is not armored within this reach, and there are
no overwater structures. This area is not included in City of Woodland zoning.
Water-dependent Uses and Water-related Uses: There are no water-related or
water-dependent uses in this reach.
Future Land Use: The Comprehensive Plan includes low-density uses within this
reach, but does not include areas along Interstate 5 right-of-way. It is anticipated
that this area will not see much new development in the future, though the
addition of some new residential dwellings is possible.
Lewis 07 –Clark County – Horseshoe Lake
Current Land Use: The west half of this reach resides in local street and I-5 right-
of-way. The east half of this reach is exclusively made up of a state-owned parcel
that encompasses a runway at Woodland State Airport and associated airport
property. The land closest to the shoreline is not within any tax lot. The airport
parcel is 39.75 acres, average width is 1,496.5 feet, and average depth is 1,022.6
feet. The average building setback is 154.7 feet, and 3 percent of the parcel area
for this reach is impervious surface. Shoreline vegetated area depths range from

The Watershed Company and Parametrix May 2014
207
294.9 feet to 1,585.8 feet, with an average depth of 876.4 feet. The average
condition score of the vegetated area, as estimated from aerial photos, is 3.8. The
shoreline is not armored within this reach, and there are no overwater structures.
This area is not included in City of Woodland zoning.
Water-dependent Uses and Water-related Uses: There are no water-related or
water-dependent uses in this reach.
Future Land Use: The extreme southwest portion of the west half of the reach is
envisioned as low-density residential. However, this portion of the reach is
almost entirely street and highway right-of-way. On the east half, the
Comprehensive Plan includes public/institutional uses within this reach,
referring to the continued operation of the airport. Multi-building commercial
development is expected in this area between the airport and CC Street.
Lewis 08 – City –Horseshoe Lake
Current Land Use: The south half of this reach is predominantly single-family
detached residential, several of which back onto the lake and include docks for
personal boats. The north half is more mixed with retail, offices/services, an
apartment complex, street right-of-way and civic uses. There are vacant
properties throughout the entire reach, but are more prevalent in northern half.
Much of the shoreline, including a parking lot and driveway access for
businesses along Davidson Ave, is not within any tax lot. Shoreline vegetated
area depths range from 61.1 feet to 183.9 feet, with an average depth of 55.5 feet.
The average condition score of the vegetated area, as estimated from aerial
photos, is 1.74. The shoreline is not armored within this reach though there are
numerous small boat docks. This reach is designated with LDR-8.5- Low-density
Residential, LDR-6- Low-density Residential, HDR- High Density Residential,
and C-1- Central Business District zoning in the City of Woodland.
Water-dependent Uses and Water-related Uses: There are accessory water-
dependent uses such as private in-water structures (docks) used presumably for
recreation within single-family residential parcels.
Future Land Use: The Comprehensive Plan includes low-density residential,
high-density residential and commercial uses within this reach. Land closest to
the shoreline is not given a plan designation. Much of this area is built out with
single family but there are some parcels that may see redevelopment in the
future, likely to low to medium residential uses.

Cowlitz County Shoreline Analysis Report
208
Lewis 09 – Woodland UGA/Clark County – Horseshoe Lake
Current Land Use: This reach occupies the developed northern shore of the
peninsula surrounded by Horseshoe Lake. It includes a city-owned storage
warehouse, manufactured park, several single-family residences, vacant land,
and private road right-of-way. It also includes road right-of-way not within any
parcel. Shoreline vegetated area depths range from 9.4 feet to 226 feet, with an
average depth of 60.4 feet. The average condition score of the vegetated area, as
estimated from aerial photos, is 1.9. The shoreline is not armored within this
reach. There are, however, numerous boat docks at the parcels off Island Aire
Drive. The majority of this reach is not zoned by the City of Woodland because it
is within the UGA and is not annexed. It lies within Clark County jurisdiction;
however, a portion is designated with LDR-6- Low-density Residential.
Water-dependent Uses and Water-related Uses: There are only accessory water-
related structures uses (docks at single-family residential parcels).
Future Land Use: The Comprehensive Plan includes low-density uses within this
reach, but does not include areas along Interstate 5 right-of-way. This reach is
unlikely to see much, if any land use changes in the future since it is currently
fully developed with single family residential uses.
Lewis 10 – City –Horseshoe Lake
Current Land Use: This reach is entirely encompassed by Horseshoe Lake Park
with the exception of one office/retail establishment. It includes a covered picnic
area, playground, gazebo, public lake access and the Rolling Freedom skate park.
The reach also includes shoreline not within any tax lot, including land closest to
Horseshoe Lake as well as right-of-way for Lakeshore Drive and Interstate 5. One
parcel is nearly 9 acres, and the other is less than one tenth of an acre. The
average shoreline vegetated area is 243 feet with an average condition score of 2.
The shoreline is armored within this reach, and there are no overwater
structures. A small portion of this reach is designated C-1- Central Business
District zoning, while the remainder, comprised on Horseshoe Lake Park is
designated with P/Q – P/I in the City of Woodland.
Water-dependent Uses and Water-related Uses: Horseshoe Lake Park is open
for swimming, fishing, canoeing, and kayaking and as such is a water-enjoyment
use.

The Watershed Company and Parametrix May 2014
209
Future Land Use: The Comprehensive Plan includes public/institutional uses
within this reach. Land closest to the shoreline is not given a plan designation.
Given the park and the institutional uses within this reach, no new development
is expected.
Lewis 11 – City –Lewis River
Current Land Use: The parcels within this reach consist of Woodland State
Airport and associated uses and services. There is an adjacent medium-size
vacant parcels are also within this reach. Much of the shoreline is not within any
tax lot. Shoreline vegetated area depths range from 19.7 feet to 45.8 feet, with an
average depth of 32.75 feet. The average condition score of the vegetated area, as
estimated from aerial photos, is 1.5. The shoreline is not armored within this
reach, and there are no overwater structures. The northern half of this reach is
designated with C-2- Highway Commercial/Light Industrial zoning while the
remainder has no zoning designation in the City of Woodland.
Water-dependent Uses and Water-related Uses: There areb no water-related or
water-dependent uses in this reach.
Future Land Use: The Comprehensive Plan includes public/institutional and
commercial uses within this reach. Portions of the shoreline are not given any
planning designation. There is likely to be some new commercial uses within this
reach given the vacant commercial parcel and proximity to I-5. There is a site
plan for an area between the state airport and CC Street for a multi-building
retail commercial development that covers over 5 acres.
Lewis 12 – City –Lewis River
Current Land Use: There are various commercial uses in the south half of this
reach including mobile home park, motel, fast food restaurants, a single
residence, strip retail, grocery store, office, and bar. Further north, there are more
residential uses, including single-family detached and apartments, as well as a
moderately sized vacant parcel, retail store and an office west of Goerig Street.
East of Goerig, there is a public/semipublic access point to the river at Cherry
Blossom Lane, vacant parcels and street ROW along Lewis River. Portions of the
shoreline are not within any tax lot. Shoreline vegetated area depths range from
33.8 feet to 323.7 feet, with an average depth of 71.5 feet. The average condition
score of the vegetated area, as estimated from aerial photos, is 3. The shoreline is
not armored within this reach, and there are no overwater structures. This
majority of this reach is designated with C-2- Highway Commercial/Light

Cowlitz County Shoreline Analysis Report
210
Industrial zoning, with smaller areas of LDR-6- Low-density Residential and
HDR- High Density Residential.
Water-dependent Uses and Water-related Uses: The river access point
represents a water-dependent use.
Future Land Use: The Comprehensive Plan includes commercial, high-density
residential, and low-density residential uses within this reach. There is likely to
be new commercial development in this reach in the future as there have been
various development scenarios for the existing shopping center. In the long-term,
the mobile home park may redevelop to a new residential use.
Lewis 13 – City –Lewis River
Current Land Use: There is diking and street ROW along east side of Goerig
Street, with residential, office and a fabricated metal plant located to the north
and east. Along the south side of Lewis River Road, there are single-family
residences, apartments, street ROW, several medium-size vacant parcels, a
mobile home park and two churches. A farm may have once been located
between Insel Road and Valley Way, and there are several access points to the
river through private property. A large portion of wetlands is not within any tax
lot parcel. Shoreline vegetated area depths range from 12.4 feet to 1,360.9 feet,
with an average depth of 262.4 feet. The average condition score of the vegetated
area, as estimated from aerial photos, is 2.1. The shoreline is not armored within
this reach, and there are no overwater structures. This reach is designated with a
large area of FW- Floodway Use District zoning surrounding an area of P/Q – P/I
zoning. Other, less prominent designations include MDR – Medium Density
Residential and HDR- High Density Residential, and very small areas of C-3-
Neighborhood Commercial, I-1- Light Industrial and LDR-6- Low-density
Residential.
Water-dependent Uses and Water-related Uses: The river access point
constitutes a water-dependent use in this reach.
Future Land Use: The Comprehensive Plan includes light industrial, commercial,
high-density residential, low-density residential, floodway/open space and
public/institutional uses within this reach. Portions of the shoreline are not given
any planning designation. There is unlikely to be any new development in this
reach due to the large amount of Floodway zoning.

The Watershed Company and Parametrix May 2014
211
Lewis 14 – City –Lewis River
Current Land Use: There are subdivided residential plots that include built
homes and vacant parcels along Misty Drive and Court. There are also single
family residential uses along Brothers and MacKenzie Roads. Some parcels do
not extend entirely to the shoreline. Shoreline vegetated area depths range from
48.3 feet to 471.2 feet, with an average depth of 181.5 feet. The average condition
score of the vegetated area, as estimated from aerial photos, is 1.8. The shoreline
is slightly armored within this reach, and there are no overwater structures. This
reach is designated with LDR-6- Low-density Residential, FW- Floodway Use
District and LDR-7.2- Low-density Residential zoning in the City of Woodland.
Water-dependent Uses and Water-related Uses: There are several single-family
residences that back onto the river and include in-water recreational structures
(either piers or docks) that constitute an accessory water-dependent use.
Future Land Use: The Comprehensive Plan includes floodway/open space and
low-density residential uses in this reach. Portions of the shoreline are not given
any planning designation. Some additional homes may be added to the existing
subdivision within this reach, but otherwise little new development is expected.
Lewis 15 – City –Lewis River
Current Land Use: There are several large vacant parcels in this reach as well as
one single-family residence on a large-acre parcel. A large portion of wetlands is
not within any tax lot parcel. Shoreline vegetated area depths range from 52.6
feet to 1036.90 feet, with an average depth of 554.9 feet. The average condition
score of the vegetated area, as estimated from aerial photos, is 1.9. The shoreline
is not armored within this reach, and there are no overwater structures. This
reach is designated with LDR-6- Low-density Residential and LDR-7.2- Low-
density Residential zoning in the City of Woodland.
Water-dependent Uses and Water-related Uses: There are no water-dependent
or water-related uses in this reach.
Future Land Use: The Comprehensive Plan includes low-density residential uses
in this reach but does not include land located closest to the shoreline. New low-
density residential development is expected in this area in the future but would
occur outside of shoreline jurisdiction.

Cowlitz County Shoreline Analysis Report
212
Lewis 16 – City –Lewis River
Current Land Use: There are two vacant parcels, several single family
residences, a mobile home and a bed and breakfast. The bed and breakfast and at
least two residences include a dock for personal boats on the river. Portions of
the shoreline are not within any tax lot. Shoreline vegetated area depths range
from 24.4 feet to 178.8 feet, with an average depth of 86.9 feet. The average
condition score of the vegetated area, as estimated from aerial photos, is 1.9. The
shoreline is limitedly armored within this reach, and there are a small number of
boat docks. This reach is not zoned by the City of Woodland.
Water-dependent Uses and Water-related Uses: There are several single-family
residences, as well as a bed and breakfast that back onto the river and include in-
water recreational structures (either piers or docks) that constitute an accessory
water-dependent use.
Future Land Use: The Comprehensive Plan includes low-density residential uses
in this reach. Some new low-density residential development is expected in this
area when this area is annexed to the City of Woodland.
5.12 Restoration Opportunities Applicable to All Assessment Units The Lower Columbia Salmon Recovery and Fish and Wildlife Subbasin Plan (2010)
identified several actions applicable to each of the subbasins within Cowlitz
County. Some of these actions apply to programs or regulations, while others
relate to projects that could be implemented at many sites throughout the
watershed (Table 5-46).
Table 5-46. Restoration opportunities applicable to all Assessment Units.
Action Status Entity
Land
Use
Pla
nnin
g/R
egul
atio
ns
Expand standards in local government comprehensive plans to afford adequate protections of ecologically important areas (i.e. stream channels, riparian zones, floodplains, CMZs, wetlands, unstable geology)
Expansion of existing program
County, Cities
Manage future growth and development patterns to ensure the protection of watershed processes. This includes limiting the conversion of agriculture and timber lands to developed uses through zoning regulations and tax incentives (consistent with urban growth boundaries)
Expansion of existing program
County, Cities
Prevent floodplain impacts from new development through land use controls and Best Management Practices
New program County, Cities, Ecology

The Watershed Company and Parametrix May 2014
213
Action Status Entity Fully implement and enforce the Forest Practices Rules (FPRs) on private timber lands in order to afford protections to riparian areas, sediment processes, runoff processes, water quality, and access to habitats
Activity is currently in place
WDNR
Conduct forest practices on state lands in accordance with the Habitat Conservation Plan in order to afford protections to riparian areas, sediment processes, runoff processes, water quality, and access to habitats
Activity is currently in place
WDNR
Review and adjust operations to ensure compliance with the Endangered Species Act; examples include roads, parks, and weed management
Expansion of existing program
County, Cities
Fund
ing/
Tec
hnic
al A
ssis
tanc
e
Increase funding available to purchase easements or property in sensitive areas in order to protect watershed function where existing programs are inadequate
Expansion of existing program
LCFRB, NGOs, WDFW, USFWS, BPA (NPCC)
Increase technical assistance to landowners and increase landowner participation in conservation programs that protect and restore habitat and habitat-forming processes. Includes increasing the incentives (financial or otherwise) and increasing program marketing and outreach
Expansion of existing program
NRCS, C/WCD, WDNR, WDFW, LCFEG, County, Cities
Increase technical support and funding to small forest landowners faced with implementation of Forest and Fish requirements for fixing roads and barriers to ensure full and timely compliance with regulations
Expansion of existing program
WDNR
Prot
ectio
n/R
esto
ratio
n Pr
ojec
ts
Create and/or restore lost side-channel/off-channel habitat for chum spawning and coho overwintering
New program LCFRB, BPA (NPCC), NGOs, WDFW, NRCS, C/WCD
Implement the prescriptions of the WRIA Watershed Planning Units regarding instream flows
Activity is currently in place
Ecology, WDFW, WRIAs, County, Cities
Increase the level of implementation of voluntary habitat enhancement projects in high priority reaches and subwatersheds. This includes building partnerships, providing incentives to landowners, and increasing funding
Expansion of existing program
LCFRB, BPA (NPCC), NGOs, WDFW, NRCS, C/WCD, LCFEG
Protect and restore native plant communities from the effects of invasive species
Expansion of existing program
Weed Control Boards (local and state); NRCS, C/WCD, LCFEG
Assess the impact of fish passage barriers throughout the basin and restore access to potentially productive habitats
Expansion of existing program
WDFW, WDNR, County, Cities, WSDOT, LCFEG

Cowlitz County Shoreline Analysis Report
214
6 SHORELINE MANAGEMENT OPTIONS AND RECOMMENDATIONS
The following are potential actions for translating inventory and characterization
findings into the draft SMP policies, regulations, environment designations, and
restoration strategies for areas within shoreline jurisdiction. In addition to the
following analysis-specific recommendations, the updated SMPs will incorporate
all other requirements of the Shoreline Management Act (RCW 90.58) and the
Shoreline Master Program Guidelines (WAC 173-26).
6.1 Environment Designations
6.1.1 Background
As outlined in WAC 173-26-191(1)(d), “Shoreline management must address a
wide range of physical conditions and development settings along shoreline
areas. Effective shoreline management requires that shoreline master programs
prescribe different sets of environmental protection measures, allowable use
provisions, and development standards for each of these shoreline segments.” In
WAC 173-26-211(2)(a), the Guidelines further direct development and
assignment of environment designations based on “existing use pattern, the
biological and physical character of the shoreline, and the goals and aspirations
of the community as expressed through comprehensive plans…” (note: The
methodology discussion in Section 6.1.2 below describes how the function
analysis scores presented in the Shoreline Analysis Report may be considered in
assigning preliminary designations.)
The current SMP utilizes a system of four Shoreline Management Districts:
Natural, Conservancy, Rural, and Urban. Descriptions and objectives for each
are provided in Table 6-1 below. The shoreline environment designation map
may no longer provide the best fit with the existing biological and land use
character or the community’s vision as expressed in the latest Comprehensive
Plan.
The Guidelines provide for six environment designations: Aquatic, Natural,
Urban Conservancy, Rural Conservancy, Shoreline Residential, and High-
Intensity. However, each jurisdiction may use alternate environment
designations, as appropriate, as long as they provide equal or better protection
than the standard. In cities and Urban Growth Areas (UGAs), consideration of
shoreline designations that parallel local zoning classifications also may provide

The Watershed Company and Parametrix May 2014
215
for greater integration of regulatory requirements between upland areas and
areas within shoreline jurisdiction.
Table 6-1, below summarizes Ecology’s suggested criteria for each of their
designations, and shows the approximate correlation between the County’s
existing system and Ecology’s system.

Cowlitz County Shoreline Analysis Report
216
Table 6-1. Comparison of existing and ecology shoreline environment designations.
Existing County
Designation Summary of County Designation Purpose
and Criteria Ecology
Designation
Summary of Ecology’s Designation Purpose and Criteria
(WAC 173-26-211) Comparison Urban Description: “Those shoreline areas suitable
for intensive recreation, residential, industrial, and commercial development.” Objective: “To identify those defined areas which are currently in such use and potentially capable of such use to satisfy the socio-economic needs of the present and future population of the county.”
Several Ecology designations fit this description. Most appropriate may be High Intensity, but others to consider include Shoreline Residential and Urban Conservancy
High Intensity: Purpose: “to provide for high-intensity water-oriented commercial, transportation, and industrial uses…” Criteria: “shoreline areas within incorporated municipalities, urban growth areas, and industrial or commercial ‘rural areas of more intense development’…if they currently support high-intensity uses related to commerce, transportation or navigation; or are suitable and planned for high-intensity water-oriented uses.”
Compared to Ecology’s High Intensity designation, the County’s Urban designation includes a broader scope of uses (e.g. residential and recreational). Residential areas within UGA’s and LAMIRDs could be designated as Shoreline Residential under Ecology’s criteria. Similarly, recreational areas within similarly developed areas could be designated as Conservancy (Rural or Urban depending upon intensity of surrounding development). Separate commercial, industrial and multi-family shoreline environment designations could be designated to parallel local zoning provisions.
Natural Description: “Those shoreline areas with unique natural features which would be severely affected by human intrusions.” Objective: “To preserve those defined areas which should be relatively free of human impact.”
Natural Natural: Purpose: "…to protect those shoreline areas that are relatively free of human influence or that include intact or minimally degraded shoreline functions intolerant of human use. These systems
The County and Ecology’s Natural designations are similar.

The Watershed Company and Parametrix May 2014
217
Existing County
Designation Summary of County Designation Purpose
and Criteria Ecology
Designation
Summary of Ecology’s Designation Purpose and Criteria
(WAC 173-26-211) Comparison require that only very low intensity uses be allowed...” Criteria: “…if any of the following characteristics apply: …shoreline is ecologically intact and therefore currently performing an important, irreplaceable function or ecosystem-wide process that would be damaged by human activity; …considered to represent ecosystems and geologic types that are of particular scientific and educational interest; …unable to support new development or uses without significant adverse impacts to ecological functions or risk to human safety.”
Rural Description: “Those shoreline areas with soil and land areas suitable for intensive agriculture, capable of recreation site development, public access, and limited residential development.” Objective: “To establish open spaces which will satisfy positive human needs for recreation, limit urban sprawl into areas beyond service capabilities, and preserve the limited agricultural resource base.”
Rural Conservancy
Rural Conservancy: Purpose: “…to protect ecological functions, conserve existing natural resources and valuable historic and cultural areas in order to provide for sustained resource use…and provide recreational opportunities. Examples of uses that are appropriate…include low-impact outdoor recreation uses, timber harvesting on a sustained-yield basis, agricultural uses, aquaculture, low-intensity residential development and other natural resource-based low-intensity uses.”
For the most part, Ecology’s Rural Conservancy designation is very similar to the County’s Rural designation. However, areas within UGA’s and LAMIRDs could be designated as Urban Conservancy under Ecology’s criteria.

Cowlitz County Shoreline Analysis Report
218
Existing County
Designation Summary of County Designation Purpose
and Criteria Ecology
Designation
Summary of Ecology’s Designation Purpose and Criteria
(WAC 173-26-211) Comparison Rural Conservancy Criteria: “if any of the following characteristics apply: …currently supporting lesser-intensity resource-based uses, such as agriculture, forestry, or recreational uses, or is designated agricultural or forest lands…; …currently accommodating residential uses outside urban growth areas and incorporated cities or towns; …shoreline is supporting human uses but subject to environmental limitations, such as properties that include or are adjacent to steep banks, feeder bluffs, or flood plains or other flood-prone areas; …high recreational value or with unique historic or cultural resources; …shoreline has low-intensity water-dependent uses.”
Conservancy Description: “Those shoreline areas endowed with resources which may be harvested and naturally replenished. Also, those areas which, through flooding, slide prone soils, or other natural parameters, are not suitable for intensive agriculture or high density human use.” Objective: “To maintain those defined areas for a sustained yield philosophy of resource management, establish suitable areas for non-intensive agriculture uses, non-intensive
Rural Conservancy
Most similar to Rural Conservancy as outlined above.
The County’s Conservancy and Ecology’s Rural Conservancy designations are similar although the County’s Conservancy designation would seem to be more restrictive to recreational uses and low intensity residential uses.

The Watershed Company and Parametrix May 2014
219
Existing County
Designation Summary of County Designation Purpose
and Criteria Ecology
Designation
Summary of Ecology’s Designation Purpose and Criteria
(WAC 173-26-211) Comparison recreation uses, and limited intensive public access.”
Other designations for consideration Urban Conservancy The County currently does not distinguish between urban and rural conservancy environment designations.
Urban Conservancy
Urban Conservancy Purpose: “…protect and restore ecological functions of open space, floodplain and other sensitive lands where they exist in urban and developed settings, while allowing a variety of compatible uses.” Urban Conservancy Criteria: “appropriate and planned for development that is compatible with maintaining or restoring of the ecological functions of the area, that are not generally suitable for water-dependent uses and that lie in incorporated municipalities, urban growth areas, or commercial or industrial "rural areas of more intense development" if any of the following characteristics apply: … suitable for water-related or water-enjoyment uses; …open space, flood plain or other sensitive areas that should not be more intensively developed; … potential for ecological restoration; … retain important ecological functions, even though partially developed; or … potential for development that is compatible with ecological restoration.”
The County’s current Urban environment contains the closest resembling designation for Ecology’s Urban Conservancy environment. An Urban Conservancy or similar type of designation may be appropriate for the incorporated cities and urban growth areas. A Rural Conservancy or similar type of designation may be appropriate for unincorporated areas. See discussion above under “Rural.”

Cowlitz County Shoreline Analysis Report
220
Existing County
Designation Summary of County Designation Purpose
and Criteria Ecology
Designation
Summary of Ecology’s Designation Purpose and Criteria
(WAC 173-26-211) Comparison Residential The County currently does not distinguish a separate residential environment for areas of more intense residential development.
Shoreline Residential
Shoreline Residential Purpose: “…accommodate residential development and appurtenant structures that are consistent with this chapter… provide appropriate public access and recreational uses.” Shoreline Residential Criteria: “inside urban growth areas, as defined in RCW 36.70A.110, incorporated municipalities, "rural areas of more intense development," or "master planned resorts," as described in RCW 36.70A.360, if they are predominantly single-family or multifamily residential development or are planned and platted for residential development.”
The County’s current Urban environment contains the closest resembling designation for Ecology’s Shoreline Residential environment. A Shoreline Residential designation may be appropriate for the incorporated cities and urban growth areas. Additionally, unincorporated areas of more intense residential development, such as that along parts of Silver Lake, may warrant a similar type of designation. Designation of separate multi-family designations may be appropriate in cities and UGAs.
The County currently does not establish an aquatic environment. Aquatic Purpose: “…to protect, restore, and manage the unique characteristics and resources of the areas waterward of the ordinary high-water mark.” Criteria: “…lands waterward of the ordinary high-water mark…may assign…to wetlands.”
An Aquatic designation will need to be created to address all areas waterward of the ordinary high water mark.

The Watershed Company and Parametrix May 2014
221
Existing County
Designation Summary of County Designation Purpose
and Criteria Ecology
Designation
Summary of Ecology’s Designation Purpose and Criteria
(WAC 173-26-211) Comparison Resource The Ecology designations in WAC 173-26-211 do not include a resource designation for agricultural and forest resource lands. Cowlitz County is currently developing its comprehensive plan and zoning regulations

Cowlitz County Shoreline Analysis Report
222
6.1.2 Methodology
It is difficult to describe a methodology for environment designation
recommendations as there are very few firm rules. In general, the environment
designation purpose and criteria will be utilized and further informed by the
findings of this Shoreline Analysis Report, including the following typical data:
Current land use
Planned land use
Ownership
Wetlands
Floodplains
Vegetation
Impervious surface
Ecological function scores (provided in this Shoreline Analysis Report)
While current and future land use provide basic context for a given segment of
land, recommended environment designations will not always correlate strongly
with those parameters, particularly on currently undeveloped shoreline areas
and shoreline areas with extensive critical areas (e.g., wetlands, floodways,
channel migration zones, other geologically hazardous areas). Parcels are often
quite large, and extend well beyond shoreline jurisdiction. For example, while
the current land use code may indicate a single-family residential use, the actual
development may not be in shoreline jurisdiction and would therefore not
necessarily result in adverse impacts to shoreline condition.
Vegetation (including identification of wetlands) and impervious surface data
provide better gauges of existing alteration level in shoreline jurisdiction, as well
as the ecological function scores. For this reason, parcels that have a current or
planned land use of residential (or other designation allowing alteration) may
ultimately have a Conservancy, or even Natural environment shoreline
designation if the function score is high and examination of aerial photos and
specific data layers provides additional support. The parcel can still
accommodate the use, perhaps even in shoreline jurisdiction, and satisfy the
WAC requirements for consistency between the environment designations and
the Comprehensive Plans (see WAC 173-26-211(3) for additional detail about
consistency requirements).
In the Cities of Castle Rock, Kelso, Kalama and Woodland, current land use will
be more strongly correlated with level of alteration and the resulting

The Watershed Company and Parametrix May 2014
223
environment designation because more often the entire parcel or a large portion
of the parcel is in shoreline jurisdiction and the allowed level of development
may already have occurred.
6.1.3 Recommendations
Based on the Background and Methodology outlined above, the following
specific recommendations are provided for development and assignment of
environment designations in the County and the Cities of Castle Rock, Kelso,
Kalama and Woodland:
It is recommended that the existing environment designations be updated
with clear statements of purpose, designation criteria, and policies that
incorporate any relevant elements of Ecology’s system and eliminate any
confusing criteria overlap, such as those related to objective intensities of
recreational and residential land use. Additional environment
designations should be considered to narrow the allowed uses as
appropriate to the existing landscape. For consistency, consider utilizing
Ecology’s recommended designation system at a minimum. The
Shoreline Master Program is required to be consistent with
comprehensive planning and other development regulations as required
by WAC 173-26-191(1)(e) and WAC 365-196-500. Consistency between
shoreline environment designations and the local comprehensive plan is
required by WAC 173-26-211(3) which notes that the comprehensive plan
constitutes the underlying framework within which master program
provisions should fit. The County is currently in the process of
developing a comprehensive plan, the City of Kelso is updating its
comprehensive plan, and the other cities have current comprehensive
plans.
Consider whether additional environment designations would be
appropriate to further delineate unique areas that might warrant
designation-specific use or modification regulations, such as levee
corridors, waterfront parks, or port related uses.
Substantively utilize inventory and characterization findings, such as GIS
information and/or function scores, in this report to inform assignment of
environment designations, as outlined in Methodology.

Cowlitz County Shoreline Analysis Report
224
6.2 General Policies and Regulations These recommendations do not constitute a full review of the County’s SMP in
meeting WAC Guidelines. Rather, the following discussions and
recommendations are based upon the findings of this Shoreline Analysis Report
and identify areas in the existing SMP which may need modification.
6.2.1 Archaeological and Historic Resources
The findings of this Shoreline Analysis Report do not suggest a need for
additional regulations beyond those mandated by the SMP Guidelines.
6.2.2 Critical Areas
Consider whether the County’s and Cities’ critical areas regulations
should be incorporated into the SMPs by reference or through direct
inclusion (as an appendix or embedded within the master program).
Either method of inclusion will likely require modification of the critical
areas regulations to meet SMA criteria. For example, any exceptions,
such as reasonable use, will need to be removed as the appropriate SMA
process for such action is through the Shoreline Variance.
The critical areas regulations will also need to be revisited to assess if
changes are needed to:
o “provide a level of protection of critical areas at least equal to that
provided by the local government's critical areas ordinances
adopted and thereafter amended pursuant to RCW
36.70A.060(2).”(RCW 90.58.090(4))
o Accommodate water-oriented and other preferred uses, consistent
with no net loss of ecological functions, which require an
exception to buffer requirements for those elements of a use that
must have direct access to the water.
In particular, the County’s existing fish and wildlife habitat conservation
area buffers (150 feet for all Shorelines of the State) are based on a general
classification system based on fish presence and not on the specific
ecological conditions present in specific reaches.
Options for designation, rating and classification of critical areas.
There is no universally accepted method for classifying rivers, streams,
and lakes or related habitat areas for regulatory purposes. In Washington,
there are a variety of classification systems used by different agencies
based on specific regulatory needs. For example, Ecology classifies water
types for the purposes of meeting water quality standards and employs a

The Watershed Company and Parametrix May 2014
225
system that emphasizes the use of the water and the requirements of the
Federal Clean Water Act, while DNR employs a system based on forest
practices needs.
o Washington DNR Stream Typing System. The DNR classification
system was developed for forest practices and generally is based
on the presence or absence of fish. This is the current system used
in Cowlitz County. The designation of shorelines of the state as a
separate classification is based primarily on the statutory
limitations on forest practices within shorelines of statewide
significance (in RCW 90.58.150) which allows only selective timber
cutting. In general, the designation of streams over 20 cfs as a
separate category may be relevant because of the wider range of
processes provided in streams with higher flows, but the DNR
designation is not based on the presence or absence of particular
geomorphic processes or ecological functions.
o Fish Species and Lifestage Stream Classification System. The
specific biological and ecological functions provided by individual
streams differ substantially. Therefore, one potential classification
system classifies stream reaches according to the fish species and
lifestages present within the reach. The presence of salmonids in
various life stages within a stream or river reach can indicate or
infer information on the habitat quality and quantity of that
specific reach. For example, if a headwater stream reach supports
bull trout, it may indicate that riparian buffer conditions within
that reach are relatively intact, and the buffers are of adequate size
to provide for adequate moderation of water temperature and
sediment filtration capability, because spawning bull trout require
cool water and clean gravel. Likewise, a reach known to be
occupied by spawning chum salmon can be assumed to be
accessible to all other salmon species, because chum salmon are
the least powerful swimmer of the salmon species. This approach
could use the WDFW SalmonScape database to assign fish
presence or life stage information. The database, however, is
limited to information gained from field surveys and may not be
accurate or complete for all stream reaches. The primary
advantages of this system are in its biological and ecological
relevance, coupled with a relatively complete, easily accessible
database.

Cowlitz County Shoreline Analysis Report
226
o Habitat Quality Based Classification System. A third type of
classification system is based on ecological functions using known
differences in habitat quality and limiting factors to classify
streams. The relative quality and quantity of individual
geophysical or habitat parameters have direct correlation to the
ecological functions that a particular stream reach or subbasin
provides. This approach would rely on review of available
reports on habitat conditions and limiting factors to assign a
classification system based on the relative ecological condition of a
stream reach or subbasin. The primary advantage of such a
classification system is that ecological relevance is built into the
system. However, several major disadvantages are also present.
For example, detailed, high-quality information on habitat quality
is not available for many stream and lake reaches within the study
area, and because different sources of information have used
different methods for habitat evaluation. Available information,
therefore, is not directly comparable. Furthermore, in many cases
this approach would require reliance on best professional
judgment to combine information on multiple ecological functions
in order to classify a particular stream or subbasin. Most likely,
the approach would be most practical to apply at a larger spatial
scale, such as the subbasin or subwatershed level, which could
potentially negate the benefits by blending ecological function.
o Landscape Assessment Options. An additional alternative
approach is to focus on the variety of functions provided by
particular elements within the landscape. The rationale for
focusing on functions rather than the stream classification is to
shift emphasis from a discrete element of the ecosystem, such as a
stream, to a system of indicators that are integrated with other
resource and habitat evaluations. Further, the current
methodology relies on discrete stream evaluations. The alternative
functional analysis would utilize structural components rather
than particular features, such as streams, as the basis for units
within sites. This also allows for a broader view of stream values
that provides opportunities for including other functions, such as
flood management functions, and evaluating water supply
functions such as seeps and springs that have an integral part in
aquatic ecological functions. This functional approach allows for a

The Watershed Company and Parametrix May 2014
227
detailed understanding of the ecosystem services provided by a
natural or impacted site. Quantitative values can be developed for
existing conditions in a natural or altered state, and alternatives
can be compared in both restoration and impact scenarios. These
values, or scores, allow for a clearer understanding of tradeoffs
under site selection, design, or mitigation analysis. The basis of
such a system is the stream rating system provided by this
inventory.
6.2.3 Buffer Options
The predominant means of regulating uplands adjacent to water bodies and
areas adjacent to wetlands and critical wildlife habitat has been through buffers.
References to buffers in the Shoreline Master Program Guidelines (WAC 173-26)
are numerous and include the following:
WAC 173-26-221(2)(c)(i)(D) Buffers. Master programs shall contain
requirements for buffer zones around wetlands. Buffer requirements shall
be adequate to ensure that wetland functions are protected and
maintained in the long term. Requirements for buffer zone widths and
management shall take into account the ecological functions of the
wetland, the characteristics and setting of the buffer, the potential impacts
associated with the adjacent land use, and other relevant factors.
WAC 173-26-221(5)(b) Local governments may implement these
objectives through a variety of measures, where consistent with Shoreline
Management Act policy, including clearing and grading regulations,
setback and buffer standards, critical area regulations, conditional use
requirements for specific uses or areas, mitigation requirements,
incentives and nonregulatory programs.
WAC 173-26-211(5)(f)(ii)(A) Standards for density or minimum frontage
width, setbacks, lot coverage limitations, buffers, shoreline stabilization,
vegetation conservation, critical area protection, and water quality shall
be set to ensure no net loss of shoreline ecological functions, taking into
account the environmental limitations and sensitivity of the shoreline
area, the level of infrastructure and services available, and other
comprehensive planning considerations.

Cowlitz County Shoreline Analysis Report
228
Wetland Regulations
The wetland classification system developed by Ecology, the Washington
State Wetland Rating System for Western Washington - Revised (Ecology
Publication #04-06-025, August 2004, annotated August 2006) is the most
common system used locally. It incorporates multiple parameters for
dividing wetlands into groups that have similar needs for protection. This
system represents a tested approach to understanding wetland functions,
ways to evaluate them, and what is needed to protect them. It provides a
quick snapshot characterization of a particular wetland. In many cases, it
provides enough information about existing wetland functions to allow
adequate plan review and land use decisions to be made without the
additional expense of a separate wetland functional assessment.
Exemptions based on wetland size are often included in local regulations
to exclude preservation of wetlands that would be isolated by
surrounding urban or rural development and that would lose much of
their ecosystem function due to the loss of the surrounding natural
features. The scientific literature does not support a particular size for
exempting wetlands based on function because many functions are not
determined solely by area. One approach endorsed by Ecology provides
multiple criteria for exempting wetlands and providing for mitigation,
often through consolidation in larger on-site wetland mitigation
programs or through watershed-based mitigation banks. Cowlitz County
and most of the cities employ wetland exemptions, based on size, that
Ecology believes are not supported by scientific literature.
Many jurisdictions also exempt activities that are believed to have little or
no environmental effect or are an emergency that threatens public health
or safety. In the case of emergency response activities that affect wetlands
and buffers, the responsible party may be required to obtain after-the-fact
permits and to rectify impacts. Cowlitz County and most of the cities
employ wetland use and emergency exemptions that Ecology has not
taken exception to.
Using wetland buffers as a management tool for protecting wetland
functions depends on the specific wetland function being protected, what
human activities are being separated from ecological functions or are
being mitigated by natural functions provided by the wetland, and what
ecosystem functions are being provided by the larger landscape including
the wetland and surrounding lands. The buffer function of improving

The Watershed Company and Parametrix May 2014
229
water quality through sediment removal and nutrient uptake is greatest
within the immediate outer portions of a buffer nearest the source of
sediment/nutrient. In urban areas where stormwater systems may divert
runoff into piped systems, buffers may not provide this function. To
protect wetland-dependent wildlife species, a critical factor is whether all
or only portions of their life cycles are contained within wetlands or
whether they require upland habitats adjacent to the wetland. Species
that rely on upland habitats need access to appropriate areas if upland
habitat and the opportunity to move safely between habitat areas across a
landscape to maintain viable populations is available.
Cowlitz County wetland buffer regulations summarized in Table 6-2 are
based on the Ecology wetland rating system. Ecology reviewers have
questioned references to delineation methods, exemptions for small
wetlands, and provisions for reduction of up to 50 percent of the buffer
dimension.
Table 6-2. Cowlitz County Wetland Buffer Regulations Summary.
Cowlitz County; 19.15.120.C.4
Wetland Category
Cat 1 Cat 2 Cat 3 Cat 4
Dev
elop
men
t In
tens
ity Low 50-150* 50-150* 40-75* 25
Moderate 75-225* 75-225* 60-110* 40
High 100-300* 100-300* 80-150* 50
* Range is based on a sliding scale determined by habitat scores Averaging No less than 50% of buffer width or 25 ft, whichever is greater
Reduction
Cat III (habitat score<20) and IV; reduction to 50% of standard buffer with enhancement
Cat I, II, and III (habitat score>20: reduction by one land use intensity rating provided management measures are implemented and habitat
corridors are established,
City of Castle Rock wetland buffer regulations are summarized in Table
6-3. Ecology has questioned use of the 1993 wetland rating system,
exemptions of wetlands based on size, and the designation of seven
dwelling units per acre as low-intensity land use as it affects adequacy of
wetland buffers to protect wetland habitat functions and mitigation.
Table 6-3. Castle Rock Wetland Buffer Regulations Summary.
Castle Rock; 18.10.120.C Wetland Category

Cowlitz County Shoreline Analysis Report
230
Cat 1 Cat 2 Cat 3 Cat 4
Dev
elop
men
t In
tens
ity Low 200 100 50 25
High (> 7 units per acre) 300 200 100’ 50
Averaging No less than 50% of buffer width or 50 ft, whichever is greater
City of Kelso buffer regulations summarized in Table 6-4 are based on the
1993 Ecology wetland rating system. Ecology has questioned exemption
of some wetlands, buffers which are at the low end of current
recommendations, and mitigation and buffer reduction provisions.
Table 6-4. Kelso Wetland Buffer Regulations Summary.
Kelso; 18.20.080.D Wetland Category Cat 1 Cat 2 Cat 3 Cat 4
200 100 50 50
Reduction To 75% with vegetation enhancement. To a maximum 50% or 25 feet.
City of Kalama wetland buffer regulations summarized in Table 6-5 are
based on the Ecology 1993 wetland rating system. Ecology has
questioned the rating system, exemptions for small wetlands, mitigation
standards, and buffer reductions.
Table 6-5. Kalama Wetland Buffer Regulations Summary.
Kalama; Table 15.02.120-1
Wetland Category
Cat 1 Cat 2 Cat 3 Cat 4
Dev
elop
men
t In
tens
ity Low 200 100 50 25
High 300 200 100 50
Averaging Based on criteria for function
Reduction To 75% or 50 feet for except for Category IV with low or moderate intensity land uses
City of Woodland buffer regulations summarized in Table 6-6 are based
on the Ecology wetland rating system. Ecology has questioned whether

The Watershed Company and Parametrix May 2014
231
the criteria for reduction of up to 50 percent of the buffer are supported
by relevant scientific literature.
Table 6-6. Woodland Wetland Buffer Regulations Summary.
Woodland; Table 15.08.400-2
Wetland Category
Cat 1 Cat 2 Cat 3 Cat 4
Dev
elop
men
t In
tens
ity Low 50-125* 50 to 150* 40-75* 25*
Moderate 75 to 225* 75-225* 60-110* 40*
High 100-300* 100-300* 80-150* 50*
* Range is based on a sliding scale determined by habitat scores Averaging To 75% or 50 feet. Reduction To 75% or 50 feet.
Riparian Buffers
A wide range of buffer widths have been analyzed for a variety of
functions. Variation in recommendations or buffer effectiveness is
frequently due to variation in site conditions such as side-slope angle,
stream type, geology, climate, etc. Design of riparian buffers must
consider the ecological, cultural, and economic values of the resource,
land use characteristics, and existing riparian quality throughout
watersheds in order to address the cumulative impacts on stream
functions and the resources being protected (Johnson and Ryba 1992;
Castelle et al. 1994; 2000; Wenger 1999).
Appropriate buffer sizes will depend on the area necessary to maintain
the desired riparian or stream functions for the given suite of land-use
activities. A wider buffer may be desired to protect streams from impacts
resulting from high-intensity land use while narrower buffers may suffice
in areas of low-intensity land use (May 2000). It should be noted though
that opportunities for protection or improvement of buffer conditions in
areas of high-intensity land use are often effectively foreclosed by existing
development, or the existing habitat conditions are already highly
altered. Under such conditions, establishing buffers wide enough to
provide an effective full-range of riparian functions is likely unattainable;
other actions may be required to improve habitat conditions beyond what
riparian buffers are able to provide. In addition, buffer vegetation type,
diversity, condition, and maturity are equally as important as buffer
width, and the best approach to providing high-quality buffers is to strive

Cowlitz County Shoreline Analysis Report
232
for establishing and maintaining mature native vegetation communities
(May 2000).
o Potential riparian, lake wetland and habitat buffer frameworks
include the following types, which are discussed in greater detail
below:
Standard Single-Zone Buffers – Fixed-distance stream
buffers based on the maintenance of individual aquatic
functions. The buffer widths may be further divided by
land use (e.g., urban versus rural) or by other variables.
Dual-Zone Buffers – This approach employs two smaller
adjacent buffer zones, which, when combined, make up
the overall riparian buffer. An inner “core” zone, directly
adjacent to the aquatic feature, consisting of an area where
uses are prohibited or severely restricted, and an outer
riparian zone, adjacent to the core zone, where uses are
still restricted, but to a lesser degree.
Reach Based Buffers – This approach is most relevant to
streams and lakes that have been altered by human use.
The approach focuses on “no net loss” of existing functions
as they currently exist.
o All of the above approaches could potentially incorporate buffer
averaging techniques, in cases where the overall buffer area will
be equal to un-averaged conditions, and it can be clearly
demonstrated that averaging will result in no net loss of aquatic
functions.
o Standard Single-Zone Stream Buffers – Single-zone buffers are the
most common type of riparian buffer, with a designated
minimum buffer for each class or type of stream/habitat as
defined by the applicable stream classification scheme. The
advantages of single-zone stream buffers are that they are the
most common buffer type and have had extensive best available
science (BAS) and legal review; are relatively simple to
understand from a public standpoint and lend themselves to
straightforward and efficient administrative processing; and
allow for buffer averaging. One disadvantage of such a system is
that riparian buffers are not uniform in the functions they provide
relative to the width of the buffer, as discussed further below.

The Watershed Company and Parametrix May 2014
233
o Table 6-2 summarizes this information in relation to the specific
aquatic functions that are of greatest importance in maintaining
conditions suitable to support fish and other aquatic life (e.g.,
LWD recruitment, stream temperature, sediment filtration). For
each buffer width, the suitability of the buffer is rated by its ability
to maintain these aquatic functions. Although this evaluation is
qualitative, it is firmly based on BAS regarding ecological
functions.
Table 6-7. Comparison of functions of stream and lake buffer widths.
Buffer Width Function 15 Feet 50 Feet 150 Feet 300 Feet 600 Feet
Microclimate X X N P F Wildlife Habitat X N P P F LWD Recruitment X N P F F Pollutant Removal N N P P F Sediment Filtration X N P F F Water Temperature X N F F F Organic Litter X P F F F Bank Stability X F F F F
KEY
F = Buffer width fully supports/maintains stream function.
P = Buffer width partially supports/maintains stream function.
N = Buffer width nominally supports/maintains stream function.
X = Buffer does not adequately support/maintain stream function.
Dual-Zone Stream Buffers – This approach, commonly used in forestry
applications, is similar to the single-zone stream buffer (see above).
However, the overall stream buffer is composed of two smaller adjacent
buffer zones, which when combined make up the overall riparian buffer.
The two zones are:
o An inner “core” buffer zone, located directly adjacent to the
aquatic feature. In this area land uses are prohibited or severely
restricted.
o An outer riparian zone, landward and adjacent to the core zone,
where land uses are still restricted, but to a lesser degree than
within the core area.
Dual-zone buffers are not as common as single-zone buffers and are more
complex from a public understanding and City administrative
standpoint, although buffer averaging could still occur within the outer
riparian zone. The primary advantage of this type of buffer system is that

Cowlitz County Shoreline Analysis Report
234
the dual-zone system recognizes that riparian buffers are not uniform in
the functions they provide relative to the width of the buffer. Examples of
specific ecologically relevant provisions that could be applied to the outer
buffer zone include:
o A limit to the amount of clearing allowed within the outer buffer
zone.
o A minimum amount of forest required to be retained within the
outer buffer zone.
o A limit to the amount of impervious surface allowed within the
outer buffer zone.
o A limit to the development density allowed within the outer
buffer zone.
In this system, the overall buffer width for the combined dual-zone
buffers would be wider than for the single-zone buffer, because more
uses are allowed within the outer portion of the dual-zone buffer. This
approach has the advantage that it is adaptable to a wide range of land
use activities, and gives the applicant choice on which approach is best
suited to their particular situation, while still maintaining equal levels of
aquatic habitat functions for the overall system. A disadvantage of the
system is that it may be more difficult to administer, as compared to a
single-zone buffer approach.
Reach Specific Stream or Lake Reach Buffers – An additional approach to
stream buffers that combines some of the advantages of both the
classification-based buffer system and a “no harm” approach are
applying specific buffers for specific reaches based on assessment of the
functions currently being provided by those reaches. This approach is
particularly applicable to streams in areas of existing high-intensity land
use where parcels are small and few remain undeveloped, and there is
little practical opportunity to achieve buffers that will provide the full
range of desired riparian functions. In this case, the objective of the
management approach is to preserve the existing functions and to
improve, if possible, a limited range of functions such as improving
temperature and water quality. Improving temperature through
providing effective overhead shade can be achieved to varying degrees
with intensive management of smaller buffers. Water quality
improvements can be achieved by stormwater management and control
of fertilizer and other chemical applications near streams.

The Watershed Company and Parametrix May 2014
235
“No Harm” Regulatory System – This type of regulatory system is best
known in Washington State in its application to agricultural use in Skagit
County. The approach was endorsed in challenges heard by the Growth
Management Hearings Board for Western Washington and the
Washington State Supreme Court (Swinomish v Skagit 2006). The “no
harm” approach may be regarded as an “adaptive management”
approach to protecting critical areas. Essential elements for such a
program are adequate monitoring, benchmarks, and the ability to require
changes to the program if benchmarks are not achieved. In assessing the
difference between a prescriptive approach such as buffers and a “no
harm” approach, both the hearings board and the court have held that
local governments must either be certain that their critical areas
regulations will prevent harm, or be prepared to recognize and respond
effectively to any unforeseen harm that arises. Application to urban
areas, however, would be substantially different than application to
agriculture where changes in farming practices may be developed. It
would be difficult to meet a “no harm” standard if monitoring of a
specific buffer area determined that a functional criterion was not being
met. If, for example, a particular buffer dimension was not effective, the
presence of physical improvements such as roads or buildings would
generally preclude its expansion. In addition, developing performance
standards, implementing a monitoring system, and taking action to
correct deficiencies would be very resource demanding both for property
owners and the local jurisdiction.
Cowlitz County and the cities of Castle Rock, Kalama, Kelso and
Woodland all utilize similar WDFW/DNR stream classifications with a
range of riparian buffer width regulations summarized in Table 6-8.
Several jurisdictions also vary buffers according to the presence of
adjacent mass wasting potential or according to stream width for Type 3
streams.
Table 6-8. Riparian Buffer Regulations.
Stream Type
Jurisdiction Type S Type F
(Type 2) Type F
(Type 3) Type Np Type Ns
Cowlitz County 150 150 100 50 50 Castle Rock 250 200 150 150 NA Kelso Other regulatory programs and best management practices Kalama 250 200 150 150 25

Cowlitz County Shoreline Analysis Report
236
Stream Type
Jurisdiction Type S Type F
(Type 2) Type F
(Type 3) Type Np Type Ns
Woodland 250 200 150 100 100
The jurisdictions have varying provisions for varying buffers based on
site-by-site assessments of conditions. These provisions allow
consideration of the existing buffer conditions and the functions the
stream may provide for aquatic and upland species. This site-by-site
review compensates somewhat for the fact that the WDFW/DNR water
classification system is based on fish presence and not the ecological
functions of the waterbody.
6.2.4 Flood Hazard Reduction
Cowlitz County and the cities generally regulate development in
floodplains through regulations designed to meet Federal Emergency
Management Agency (FEMA) criteria for eligibility for flood insurance.
These regulations focus on building construction standards such as
maintaining the lowest floor above flood levels. These provisions do not
address direction in 173-26-221(3) to preserve the dynamic physical
processes of rivers, including preservation of floodplains.
Levee systems are prevalent in the Columbia River, lower Cowlitz River,
and lower Lewis River Assessment Units, and are critical protection
elements for existing development and agriculture uses. Consistent with
the WAC provisions in the Guidelines, the County should provide
flexibility for developing and maintaining flood hazard reduction
measures as needed to continue protection of existing uses. Emphasis
should be given to maintaining existing ecological functions, at a
minimum, through Ecology’s no net loss criteria. The existing SMP
section on Shoreline Protection Works, which currently includes a wide
variety of shoreline stabilization methods, is too broad. Flood hazard
reduction regulations, should be separated from other shoreline
stabilization regulations.
6.2.5 Public Access
Provide policies and regulations that recognize and facilitate
implementation of existing parks, recreation, and open space plans.
Provide public access, as feasible, in new commercial, industrial and
multi-family development as well as publicly sponsored or financed
utility and flood control facilities.

The Watershed Company and Parametrix May 2014
237
Promote visual access where physical access is not feasible.
6.2.6 Shoreline Vegetation Conservation
Build on the existing protections provided in the County’s and Cities’
critical areas regulations, paying special attention to measures that will
promote retention of shoreline vegetation and development of a well-
functioning shoreline which provides both physical and habitat
processes.
Include clear standards for fill, grading, and excavation by environment
designation ensuring compliance with WAC requirements.
Ensure that vegetation provisions allow for appropriate modifications to
accommodate preferred uses, particularly water-oriented uses, public
access and single-family residential development.
Ensure that vegetation standards are clear regarding thinning, trimming
and pruning of nearshore vegetation to maintain views and to minimize
safety hazards.
Water Quality, Stormwater, and Nonpoint Pollution
Consider incorporating regulations to facilitate maximum
implementation of TMDL plans and controlling introduction of 303(d)-
listed pollutants for which TMDLs have not yet been prepared.
Ensure that regulations allow for placement of water quality
improvement related structures or facilities in shoreline jurisdiction.
Consider adding clarifying statements noting that the policies of the SMP
will also be policies of the County’s comprehensive plan (in
development) and that the policies also apply to activities outside
shoreline jurisdiction that affect water quality within shoreline
jurisdiction. However, the regulations apply only within shoreline
jurisdiction.
6.3 Shoreline Modification Provisions
6.3.1 Shoreline Stabilization
Separate bulkheads, riprap, revetments and other shoreline armoring
structures from other regulations which pertain to structures intended to
attenuate open water waves and currents such as breakwaters, jetties,
groins and weirs.

Cowlitz County Shoreline Analysis Report
238
Give preference to those types of shoreline modifications that have a
lesser impact on ecological functions. Policies and regulations should
promote "soft" over "hard" shoreline modification measures.
Ensure “replacement” and “repair” definitions and standards are
consistent with WAC 173-26-231(3)(a). Repair activities should be
defined to include a replacement threshold so that applicants and staff
will know when “replacement” requirements need to be met.
Otherwise, fully implement the intent and principles of the WAC
Guidelines. Reference appropriate exemptions found in the WAC related
to “normal maintenance and repair” and “construction of the normal
bulkhead common to single-family residences.” These are not
exemptions from the regulations, however; they are exemptions only
from a Shoreline Substantial Development Permit.
Incentives could be included in the SMP that would encourage
modification of existing armoring, where feasible, to improve habitat
while still maintaining any necessary site use and protection.
6.3.2 Piers and Docks
Develop detailed dimensional and material standards for new piers and
docks as well as replacement/modified structures, customized for river
and lake environments. Docks and piers have a variety of potential
impacts including the following (Carrasquero 2001):
o Avoidance of shaded areas by juvenile salmon
o Changes in the food network
o Changes in substrate and sediment movement
o Changes in predator/prey relationships
o Loss of habitat area, complexity and and fragmentation of
remaining habitat
Be consistent, to the extent practicable based on local conditions and
requirements for no net loss, with Washington Department of Fish and
Wildlife, Washington Department of Natural Resources, and U.S. Army
Corps of Engineers design standards, and recognize special local issues or
circumstances.
Place emphasis on joint-use or community piers and docks over single-
use structures.
Similar to the recommendation under Shoreline Stabilization, ensure
repair activities are defined to include a replacement threshold so that

The Watershed Company and Parametrix May 2014
239
applicants and staff will know when “replacement” requirements need to
be met.
Regulations may distinguish limit size of docks or prohibit them an based
on Shoreline Environmental Designations with a focus on protecting
ecological functions in conservancy and natural environmental
designations.
6.3.3 Fill
Restoration fills should be encouraged, including improvements to
shoreline habitats, material to anchor LWD placements, and as needed to
implement shoreline restoration.
Fills waterward of the OHWM to create developable land should be
prohibited, and should only be allowed landward of OHWM if not
inconsistent with the requirement to protect shoreline ecological
functions and ecosystem-wide processes.
6.3.4 Breakwaters, Jetties, Groins and Weirs
Consider prohibiting new breakwaters, jetties, groins, or weirs in the SMP
except where they are essential to restoration or maintenance of existing
water-dependent uses.
6.3.5 Dredging and Dredge Material Disposal
The Cowlitz and Columbia Rivers are subject to continued sedimentation
from upstream deposits resulting from the eruption of Mt. St. Helens. It
is likely that dredging for navigation and flood control will be needed for
the foreseeable future. Provisions to allow continued dredging as part of
a master program will facilitate needed dredging while addressing long
term ecological issues.
In watersheds not affected by Mt. St. Helens, restriction or prohibition of
dredging should be considered with exceptions for purposes of shoreline
restoration, flood hazard reductions, and maintenance of existing legal
moorage and navigation.
6.3.6 Shoreline Habitat and Natural Systems Enhancement Projects
Consider incentives to encourage restoration projects, particularly in
areas identified as having lower function. For example, allow
modification of impervious surface coverage, density, height, or setback
requirements when paired with significant restoration. Emphasize that
certain fills, such as streambed or nearshore gravels or material to anchor
logs, can be an important component of some restoration projects.

Cowlitz County Shoreline Analysis Report
240
To facilitate planned water-dependent uses within ports, it may be
advantageous to develop a region-wide mitigation system that targets
mitigation sites to locations where the greatest ecological productivity
will occur. This may include approval of resource banking sites.
6.4 Shoreline Uses
6.4.1 Agriculture
The findings of this Shoreline Analysis Report do not suggest a need for
additional regulations beyond those mandated by the SMP Guidelines.
Maintenance of existing agriculture is commercially and locally important to
Cowlitz County. Ensuring that agricultural uses and development are
allowed (except as currently prohibited in the Natural environment) should
be recognized in shoreline policies and regulations.
Consider allowing low-intensity agricultural uses in the Natural environment
per WAC 173-26-211(5)(a)(ii)(E).
6.4.2 Aquaculture
The findings of this Shoreline Analysis Report do not suggest a need for
additional regulations beyond those mandated by the SMP Guidelines.
However, the regulations should appropriately differentiate between
commercial aquaculture and species restoration aquaculture, and include
special provisions for aquaculture activities that are temporary in nature.
6.4.3 Boating Facilities
Cowlitz County includes a variety of commercial, public and private boating
facilities, including marinas, port uses, and community and park boat
moorage and launching facilities. Regulations for the over-water
components should be developed to provide applicants with as much
predictability as possible, while still allowing for an appropriate amount of
flexibility based on site-specific conditions and use-specific needs.
The County may consider additional requirements for demand analysis for
new marinas as a means to minimize cumulative impacts from multiple
facilities.
Public access should be included as components of new marinas or
expansions, where feasible.
6.4.4 Commercial Development
Recognize commercial uses and provide for a clear priority for water-
dependent, water-related and water-oriented uses.
The Watershed Company and Parametrix May 2014
241
Consider incentives to attract water-oriented uses in appropriate locations
along the shoreline.
Ensure water-dependent uses are not restricted by other regulatory
setbacks/buffers.
Make provisions for the public access and ecological restoration requirements
for non-water-dependent uses to provide clear requirements for those areas
where water-dependent uses are not practical. Identification of mitigation
sites or provisions for mitigation banking also could accommodate such
development.
6.4.5 Forest Practices
Provide general policies and regulations for forest practices according to the
SMP Guidelines. As provided for in WAC 173-26-241(3)(e), the master
program should rely on the Forest Practices Act for regulation of commercial
forestry. There are, however, specific limits on clear cutting provided in
RCW 90.58.150 which must be included, Exceptions to this standard should
be by conditional use review.
The SMP should apply to Class IV General forest practices where shorelines
are being converted to non-forestry uses.
6.4.6 Industry
Recognize industrial uses and provide for a clear priority for water-
dependent, water-related and water-oriented uses.
Consider incentives to attract water-oriented uses in appropriate locations
along the shoreline.
Ensure water-dependent uses are not restricted by other regulatory
setbacks/buffers.
Make provisions for the public access and ecological restoration requirements
for non-water-dependent uses to provide clear requirements for those areas
where water-dependent uses are not practical. Identification of mitigation
sites or provisions for mitigation banking also could accommodate such
development.
6.4.7 In-stream Structural Uses
Small and large-scale in-stream structures intended to produce energy,
moderate flooding, and retain sediment are found in Cowlitz County.
Therefore, policies and regulations should allow such in-stream structural
uses in the SMP while also ensuring the continued protection and
preservation of ecosystem functions and cultural resources.

Cowlitz County Shoreline Analysis Report
242
Regulations may distinguish appropriate areas for in-stream structures based
on Shoreline Environmental Designations or specific ecological functions.
6.4.8 Mining
Provide general policies and regulations for mining according to the SMP
Guidelines. Clearly differentiate between upland and aquatic mining.
Integrate mining regulations with requirements of land use and development
codes.
Regulations may distinguish appropriate areas for in-stream structures based
on Shoreline Environmental Designations or specific ecological functions.
6.4.9 Recreational Development
Policies and regulations related to parks management should provide clear
preferences for water-related recreation use and shoreline restoration
consistent with public access needs and uses. Existing natural parks should
be protected and enhanced.
Coordinate with State, County, City, and private park owners (i.e.
PacifiCorp) regarding applicable environment designations, existing and
future land uses/developments, and restoration opportunities to ensure
policies and regulations do not conflict with ongoing or future recreational
developments and park management plans.
Recreation access to the shoreline is a priority of the Act and should
recognize that water-dependent recreation is a preferred use in shoreline
jurisdiction. Include provisions for existing and potential recreational uses,
including boating, kayaking, swimming, and fishing.
Regulations may distinguish an appropriate intensity of recreation uses
based on Shoreline Environmental Designations with less intensive uses in
conservancy and natural Shoreline Environmental Designations.
6.4.10 Residential Development
Address specific unincorporated areas of more intense residential
development (i.e. Silver Lake) with appropriate regulations to match the
existing condition.
Incorporate clear dimensional criteria for residential development, including
setbacks/buffers, lot coverage, height limits, etc.
Recognize existing development patterns and existing ecological functions
provide in specific areas in providing buffers, and other regulations.
Include provisions which ensure that new development, including the
creation of new lots, would not require new shoreline stabilization. New

The Watershed Company and Parametrix May 2014
243
primary and accessory residential structures should be located far enough
from the shoreline to prevent such a need.
For residential subdivisions which create five or more lots, require public or
community access to the shoreline.
Although single-family residential development is a shoreline preferred use,
ensure that the master programs include provisions which assure meeting
Ecology’s no net loss standard.
6.4.11 Transportation and Parking
Allow for maintenance and improvements to existing transportation
facilities.
Ensure that location of new roads and parking areas considers alternatives to
location within shoreline jurisdiction and provide performance standards
and for necessary new roads and parking areas where other locations outside
of shoreline jurisdiction are not feasible.
6.4.12 Utilities
Allow for maintenance and improvements to existing utility facilities.
Ensure that location of new utilities considers alternatives to location within
shoreline jurisdiction and provide performance standards for necessary new
utilities where other locations outside of shoreline jurisdiction are not
feasible.
6.5 Restoration Plan A Restoration Plan document will be prepared at a later phase of the Shoreline
Master Program update process, consistent with WAC 173-26-201(2)(f). The
Shoreline Restoration Plan must address the following six subjects (WAC 173-26-
201(2)(f)(i-vi)) and incorporated findings from this analysis report:
(i) Identify degraded areas, impaired ecological functions, and sites with potential for
ecological restoration;
(ii) Establish overall goals and priorities for restoration of degraded areas and impaired
ecological functions;
(iii) Identify existing and ongoing projects and programs that are currently being
implemented, or are reasonably assured of being implemented (based on an
evaluation of funding likely in the foreseeable future), which are designed to
contribute to local restoration goals;

Cowlitz County Shoreline Analysis Report
244
(iv) Identify additional projects and programs needed to achieve local restoration goals,
and implementation strategies including identifying prospective funding sources
for those projects and programs;
(v) Identify timelines and benchmarks for implementing restoration projects and
programs and achieving local restoration goals; and
(vi) Provide for mechanisms or strategies to ensure that restoration projects and
programs will be implemented according to plans and to appropriately review the
effectiveness of the projects and programs in meeting the overall restoration goals.
The Restoration Plan will “include goals, policies and actions for restoration of
impaired shoreline ecological functions. These master program provisions
should be designed to achieve overall improvements in shoreline ecological
functions over time, when compared to the status upon adoption of the master
program.” The Restoration Plan will mesh potential projects identified in this
report with additional projects, regional or local efforts, and programs of each
jurisdiction, watershed groups, and environmental organizations that contribute
or could potentially contribute to improved ecological functions of the shoreline.
7 REFERENCES
Beamer, E., A. McBride, C. Greene, R. Henderson, G. Hood, K. Wolf, K. Larsen, C. Rice,
and K. Fresh. 2005. Delta and nearshore restoration for the recovery of wild
Skagit River Chinook salmon: Linking estuary restoration to wild Chinook
salmon populations. Supplement to the Skagit Chinook Recovery Plan.
Bottom, D. L., and C. A. Simenstad. 2001. Bottlenecks, barges, and super fish: rethinking
conservation of estuaries and salmon in Oregon Salmon: Essays on the State of
Fish at the Turn of the Millennium. Oregon Trout, Portland.
Bottom, D. L., C. A. Simenstad, J. Burke, A. M. Baptista, D. A. Jay, K. K. Jones, E.
Casillas, and M. H. Schiewe. 2005. Salmon at river's end: the role of the estuary in
the decline and recovery of Columbia River salmon. U.S. Department of
Commerce, National Oceanic Atmospheric Administration, National Marine
Fisheries Service.
BST Associates. Port of Kalama Comprehensive Plan and Scheme of Harbor
Improvements. Prepared for Port of Kalama. April 28, 2010. Available at:
http://www.portofkalama.com/File.ashx?cid=143 [Accessed May 17, 2012].

The Watershed Company and Parametrix May 2014
245
C-CAP zone 1 2006-Era Land Cover [computer file]. 2008. Charleston, SC: NOAA’s
Ocean Service, Coastal Services Center (CSC). Available at
http://www.csc.noaa.gov/crs/lca [Accessed November 2010].
City of Castle Rock. Comprehensive Plan. January 2006. Available at: http://ci.castle-
rock.wa.us/compplan/CP_CompleteCompPlan.pdf [Accessed March 30, 2012].
City of Castle Rock. Comprehensive Plan Map. Updated January 30, 2012. Available at:
http://ci.castle-
rock.wa.us/download/Castle_Rock_Comprehensive_Plan_Map_8x11.pdf
[Accessed March 30, 2012].
City of Castle Rock. Zoning Map. Updated January 21, 2010. Available at: http://ci.castle-
rock.wa.us/download/Castle_Rock_Zoning_Map_8x11.pdf [Accessed March 30,
2012].
City of Kalama. Zoning Districts [map]. Adopted November 17, 2007. Available at:
http://www.cityofkalama.com/buildingdepartment/1_09_Kalama_Zoning_11x17.
pdf [Accessed July 17, 2012].
City of Kelso. Comprehensive Plan for the City of Kelso. Adopted September 2, 1980.
Chapter Updates 1987 and 1992. Updates of Maps 1994.
City of Kelso. Kelso Land Use [map]. Available at:
http://www.kelso.gov/sites/default/files/images/cd-
documents/Official%20Kelso%20Land%20Use%20Map.pdf [Accessed March 30,
2012].
City of Kelso. Kelso Zoning [map]. Available at:
http://www.kelso.gov/sites/default/files/images/cd-
documents/Official%20Kelso%20Zoning%20Map.pdf [Accessed March 30, 2012].
City of Woodland. Comprehensive Plan Map. November 2005. Available at:
http://www.ci.woodland.wa.us/documents/planning/planning/maps/comp-plan-
map.pdf [Accessed March 30, 2012].
City of Woodland. Zoning Map. Effective January 3, 2011. Available at:
http://www.ci.woodland.wa.us/documents/planning/planning/maps/ZoningMap
_February2011.pdf [Accessed March 30, 2012].
Christy J.A., J.A. Putera. 1992. Lower Columbia River natural area inventory 1992.
Seattle, WA.

Cowlitz County Shoreline Analysis Report
246
Corps. 2002. Mount St. Helens Engineering Reanalysis Hydrologic, Hydraulics,
Sedimentation and Risk Analysis Design Documentation Report. April 2002,
Portland, OR.
Corps. 2007. Mount St. Helens Ecosystem Restoration General Reevaluation Study
Reconnaissance Report. Portland District.
Corps. 2012. Revised Draft Environmental Assessment- Sediment Retention Structure
(SRS) Spillway Raise Project: Mount St. Helens Sediment Management for Flood
Risk Reduction.
Carrasquero, J., Herrera Environmental Consultants, 2001. Over-Water Structures:
Freshwater Issues for Washington State Departments of Fish and Wildlife,
Ecology and Transportation. Available at:
http://wdfw.wa.gov/publications/pub.php?id=00052.
Cowlitz Conservation District. 1994. Silver Lake Watershed Management Plan.
Prepared for Cowlitz County. 304 pp.
Cowlitz County. Cowlitz County Comprehensive Plan. Adopted November 1, 1976.
Available at: http://www.co.cowlitz.wa.us/buildplan/planning/gma.html
[Accessed March 30, 2012].
Cowlitz County Assessor’s Office [GIS Data]. 2002 and 2012 Parcel Data Records.
Cowlitz County Park and Recreation Advisory Board. Cowlitz County Comprehensive
Park Plan Update. September 2010. Available at:
http://www.co.cowlitz.wa.us/files/Parks%20Comp%20Plan%202010%20.pdf
[Accessed April 2012].
Cowlitz-Wahkiakum Regional Planning Commission. Shorelines Management Master
Program for Cowlitz County, Washington. Prepared for Cowlitz County,
Washington. December 18, 1973. Adopted August 19, 1977. Available at:
http://www.co.cowlitz.wa.us/buildplan/planning/_SMMP_COWLITZ_1977.pdf
[Accessed March 30, 2012].
Dammers, W., P. Foster, M. Kohn, C. Morril, J. Serl, and G. Wade. 2002. Draft Cowlitz
River Subbasin Summary. Prepared for the Northwest Power Planning Council.
EDAW, Inc. and PacifiCorp. Draft Recreation Resource Management Plan. Lewis River
Hydroelectric Projects. April 2004. Available at:
http://www.pacificorp.com/content/dam/pacificorp/doc/Energy_Sources/Hydro/
Hydro_Licensing/Lewis_River/Appendix_B_Recreation_Resource_Management
_Plan.pdf [Accessed August 29, 2012].

The Watershed Company and Parametrix May 2014
247
Gendazsek, A.S., 2011. Hydrogeologic framework and groundwater/surface-water
interactions of the Chehalis River basin, Washington: U.S. Geological Survey
Scientific Investigations Report 2011-5160, 42 p.
Grays Harbor County Lead Entity. 2011. The Chehalis Basin Salmon Habitat
Restoration and Preservation Strategy for WRIA 22 and 23.
Gregory, R. S., and C. D. Levings. 1998. Turbidity reduces predation on migrating
juvenile Pacific salmon. Transactions of the American Fisheries Society 127:275-
285.
Habitat Work Schedule. Accessed at: http://hws.eksoystem.us [Accessed April 2011].
Johnson, L. 2010. Ecology and Natural History of Freshwater Tidal Forested Wetlands
of the Columbia River Estuary. Thesis. University of Washington, Seattle, WA.
Joint Aquatic Resources Permit Application (JARPA), Millennium Bulk Terminals
Longview, LLC (MBTL) Coal Export Terminal. Dated February 22, 2012.
Available at:
http://www.co.cowlitz.wa.us/buildplan/WhatsNew/6.%20JARPA%20Application
.PDF [Accessed August 2012].
Jones, R. and E. Salo. 1986. The status of anadromous fish habitat in the North and South
Fork Toutle River watersheds, Mt. St. Helens, Washington, 1984. Fisheries
Research Institute, University of Washington.
Keefe, M.L., R. Campbell, P. DeVries, S. Madsen, and D, Reiser. 2004. Kalama,
Washougal, and Lewis River Habitat Assessments. Prepared for the Lower
Columbia Fish Recovery Board.
Kukulka, T., and D. A. Jay. 2003. Impacts of Columbia River discharge on salmonid
habitat II. Changes in shallow-water habitat. Journal of Geophysical Research
108:C9-3294.
Levings, C. D., K. Conlin, and B. Raymond. 1991. Intertidal habitats used by juvenile
Chinook salmon (Oncorhynchus tshawytscha) rearing in the north arm of the
Fraser River estuary. Marine Pollution Bulletin 22:20-26.
Lichatowich J. 1999. Salmon without rivers: a history of the Pacific salmon crisis.
Washington, D.C.: Island Press.
LCFRB (Lower Columbia Fisheries Recovery Board). 2010. Lower Columbia Salmon
Recovery and Fish and Wildlife Subbasin Plan.

Cowlitz County Shoreline Analysis Report
248
LCREP (Lower Columbia River Estuary Partnership). 2011. 2011 Comprehensive
Conservation and Management Plan Update.
Marriott, D. and 27 contributors. 2002. Lower Columbia River and Columbia River
Estuary Subbasin Summary. Report Prepared for the Northwest Power Planning
Council, dated May 17, 2002. (Available at: http://www.cbfwa.org/).
McIvor, C.C. and W.E. Odum. 1988. Food, predation risk and microhabitat selection in a
marsh fish assemblage. Ecology 69(5): 1341‑1351.
National Wetlands Inventory [computer file]. 2010. Washington, D.C.: U.S. Fish and
Wildlife Service, Division of Habitat and Resource Conservation. Available at:
http://www.fws.gov/wetlands/ [Accessed August 2010].
NMFS (National Marine Fisheries, Service (NMFS), National Oceanic and Atmospheric
Administration (NOAA), US Department of Commerce). 2011. Endangered and
Threatened Species; Designation of Critical Habitat for the Southern Distinct
Population Segment of Eulachon. 65324 Federal Register / Vol. 76, No. 203 /
Thursday, October 20, 2011 / Rules and Regulations.
Neal, V. 1972, Physical aspects of the Columbia River and its Estuary. In The Columbia
River Estuary and Adjacent Ocean Waters: Bioenvironmental Studies, edited by
A. T. Pruter and D. L. Alverson (Seattle: University of Washington Press), pp. 19-
70.
PacifiCorp. 2008a. Lewis River Hydroelectric Projects Shoreline Management Plan.
FERC Project Nos. 935, 2071, 2111. Prepared by Kleinschmidt. December 2008.
PacifiCorp. 2008b. Lewis River Wildlife Habitat Management Plan. Volume I – Chapters.
December 2008.
Powers, P. and M. Tyler. 2009. Lower Kalama River Off-Channel Habitat Assessment.
Prepared for the Lower Columbia Fish Enhancement Group and Lower
Columbia Fish Recovery Board.
Sherwood, C. R., D. A. Jay, R. Bradford Harvey, P. Hamilton, and C. A. Simenstad. 1990.
Historical changes in the Columbia River Estuary. Progress in Oceanography
25(1):299–352.
Simenstad, C., J. Burke, E. O’Conner, C. Cannon, D. Heatwole, M. Ramirez, I. Waite, T.
Counihan, and K. Jones. 2011. Columbia River Estuary Ecosystem
Classification- Concept and Application. U.S. Geological Survey. Open File
Report 2011-1228.

The Watershed Company and Parametrix May 2014
249
Steel, A., A. Fullerton, Y. Caras, M. Sheer, P. Olson, D. Jensen, J. Burke, M. Maher, D.
Miller, and P. McElhany. May 2007. Lewis River Case Study Final Report: A
decision-support tool for assessing watershed-scale habitat recovery strategies
for ESA-listed salmonids. Lewis River Case Study Final Report. Northwest
Fisheries Science Center, Seattle, WA. 190 pgs.
TetraTech. 2007. Lower Cowlitz River and Floodplain Habitat Restoration Project Siting
and Design: Final Revised Report. Prepared for the Lower Columbia Fish
Enhancement Group and Lower Columbia Fish Recovery Board.
Wade, G. 2000a. Salmon and Steelhead Habitat Limiting Factors: Water Resource
Inventory Area 26- Final Report. Prepared for the Washington State
Conservation Commission.
Wade, G. 2000b. Salmon and Steelhead Habitat Limiting Factors: Water Resource
Inventory Area 27- Final Report. Prepared for the Washington State
Conservation Commission.
Wade, G. 2002. Salmon and Steelhead Habitat Limiting Factors: Water Resource
Inventory Area 25- Final Report. Prepared for the Washington State
Conservation Commission.
Washington State Department of Archaeology and Historic Preservation. 2009. Listed
Historic Places in Washington. Olympia, WA. December 17. Available:
http://www.dahp.wa.gov [Accessed: August 3, 2012].
Washington Department of Ecology, GIS Technical Services [Map]. 2009. Cowlitz
County WRIA Map. Available:
http://www.co.cowlitz.wa.us/buildplan/planning/WRIA/cowlitz_wria.pdf
[Accessed: September 6, 2012].
WEST Consultants, Inc. 2008. Technical Memo: Castle Rock Meadows Development –
Base Flood Elevation Study Results from Detailed HEC-RAS Modeling. January
3, 2008.
WDFW (Washington Department of Fish and Wildlife) 2013a Letter from George Fornes,
PHS Program. March 29, 2013. WDFW Comments on Significant Habitat Sites in
Cowlitz County Area Shoreline Jurisdiction.
WDFW (Washington Department of Fish and Wildlife) 2013b Letter from George Fornes,
PHS Program. March 29, 2013. Previous WDFW Comments on Cowlitz County
Critical Areas Ordinance Update.

Cowlitz County Shoreline Analysis Report
250
8 LIST OF ACRONYMS AND ABBREVIATIONS
ADA ............................. Americans with Disabilities Act
AWS ............................. Available Water Supply
BLM ............................. Bureau of Land Management
CAO ............................. Critical Areas Ordinance
C-CAP ......................... Coastal Change Analysis Program
CFS ............................... Cubic Feet per Second
Corps ........................... U.S. Army Corps of Engineers
CPP .............................. County-wide Planning Policies
DFIRM ......................... Draft Flood Insurance Rate Map
DU ............................... Ducks Unlimited
Ecology ........................ Washington Department of Ecology
EPA .............................. Environmental Protection Agency
ESA .............................. Endangered Species Act
FEMA .......................... Federal Emergency Management Agency
Ft ............................... Feet
GIS ............................... Geographic information systems
GMA ............................ Growth Management Act
HPA ............................. Hydraulic Project Approval
LCREP ......................... Lower Columbia Estuary Partnership
LWD ............................ Large Woody Debris
OHWM ........................ Ordinary High Water Mark
MOU ............................ Memorandum of Understanding
MUGA ......................... Municipal Urban Growth Area
NF ............................... North Fork
NOAA ......................... National Oceanographic and Atmospheric Administration
NPS .............................. National Parks Service
NPDES ......................... National Pollutant Discharge Elimination System
NRCS ........................... Natural Resources Conservation Service
NRL ............................. Natural Resources Lands
NWI ............................. National Wetlands Inventory
PAB .............................. Planned Annexation Boundary
PAH ............................. Polycyclic aromatic hydrocarbon
PCB .............................. Polychlorinated biphenyl
PHS .............................. Priority Habitats and Species
PNW ............................ Pacific Northwest

The Watershed Company and Parametrix May 2014
251
PSE ............................... Puget Sound Energy
PUD ............................. Public Utility District
RCW ............................ Revised Code of Washington
ROW ............................ Right-of-Way
RGP .............................. Regional General Permit
RM ............................... River Mile
RV ............................... Recreational Vehicle
SCL ............................... Seattle City Light
SEPA ............................ State Environmental Policy Act
SF ............................... South Fork
SMA ............................. Shoreline Management Act
SMP .............................. Shoreline Master Program
Spp. .............................. Species
SR ............................... State Route
SSURGO ...................... Soil Survey Geographic Database
SWSL ........................... Surface Water Source Limited
TMDL .......................... Total Maximum Daily Load
TPL ............................... Trust for Public Land
TWC ............................. The Watershed Company
UGA ............................. Urban Growth Area
UGB ............................. Urban Growth Boundary
USDA ........................... U.S. Department of Agriculture
USFS ............................ United States Forest Service
USFWS ........................ U.S. Fish and Wildlife Service
USGS ............................ U.S. Geological Service
WAC ............................ Washington Administrative Code
WDFW ......................... Washington Department of Fish and Wildlife
WDNR ......................... Washington Department of Natural Resources
WRIA ........................... Water Resource Inventory Area
WSR ............................. Wild and Scenic Rivers
WWRP ......................... Washington Wildlife and Recreation Coalition
Yr ............................... Year

Cowlitz County Shoreline Analysis Report
All appendices documents provided separately
APPENDIX A
Cowlitz County Assessment of Shoreline Jurisdiction
APPENDIX B
Shoreline Inventory Map Folio - County
APPENDIX C
Shoreline Inventory Map Folio - Cities
APPENDIX D
Cowlitz County Comprehensive Plan Map
APPENDIX E
Cowlitz County Zoning Maps
APPENDIX F
Functional Analysis Scoring Results by Reach
APPENDIX G
Demand for Water-oriented Uses
APPENDIX H
Longbell Log Pond Determination Letter
APPENDIX I
City of Castle Rock Supplemental Inventory