Embed Size (px)
Citation preview

The Supplemental Nutrition Assistance Program (SNAP) and Child Health
By Shivani Kuckreja, Ally Pyers, and Carolyn Chelius
____________________________________________________________________________ Introduction to SNAP and Child Health
In this paper, we investigate the effects of the Supplemental Nutrition Assistance Program (SNAP) on the health of children up to 18 years of age, using data from the Integrated Health Interview Series (IHIS). Our research is relevant, for SNAP is the U.S’s largest nutrition assistance program, and almost half of all SNAP recipients are children (Keith Jennings). The Supplemental Nutrition Assistance Program also aims to increase low income consumers’ access to healthy food. For this reason, we are interested in the link between SNAP program participation and child’s health.
Almost half of SNAP recipients are children (under 18 years of age) and 71% of SNAP benefits go to households with children (USDA 2012). Despite the SNAP program’s verbal commitment to increase the nutrients available to SNAP recipients, our findings show a negative relationship between SNAP recipiency and child health, which aligns with the results of similar studies focused on the relationship between SNAP and child health.
We will begin by detailing the circumstances under which one is considered eligible to receive SNAP benefits, and will contextualize SNAP participation rates in America today. Next, we will discuss preexisting literature focused on the relationship between SNAP and child health before introducing our descriptive statistics and our regressions. We will end the paper by highlighting any potential bias in our results before making our final remarks on our findings. SNAP Use and Eligibility SNAP Eligibility Eligibility for SNAP varies by state, however, all states’ eligibilities are based upon the following six metrics: resources, income, deductions, employment requirements, special rules for elderly or disabled, and immigrant eligibility. The metrics are further detailed below. See the Appendix for a flowchart on qualification for SNAP. Metric #1: Resources In order to be eligible to receive SNAP benefits, households’ countable resources (such as a bank account) may reach a maximum $2,250, or $3,250 if at least one person is elderly (age 60 or older), or disabled. SSI, TANF, and pensions are not included in resources. States have differing rules as to whether or not vehicles are included as resources. Metric #2: Income Income requirements include both gross and net income. Net income = gross income − allowable deductions (e.g childcare costs, high housing). The gross income must be 130% of poverty and the net income must be 100% of poverty in order for one to be eligible for SNAP benefits; for a family of four, this means $1,988 or less in monthly net income. Households with an elderly or disabled member only need to meet the net income standard in order to be offered SNAP benefits.
1

Metric #3: Deductions Deductions include: 20% earned income, dependent childcare costs (necessary for work), child support, medical expenses for elderly and disabled, excess shelter. Metric #4: Employment Requirements Able bodied adults without dependents may only receive SNAP benefits for 3 months in a 36month period if unemployed or not undergoing training. SNAP benefits do not have a time limit for working adults as long as the person benefitting still qualifies for SNAP. However, SNAP benefits must be renewed after a set amount of time, which varies by state. Most states require renewal after a 12 month period for ablebodied adults, 24 month period for elderly, and 36 month period for disabled persons. Metric #5: Special Rules for Elderly or Disabled Persons Described within the other eligibility requirements. Additional special rules are not applicable to our study on child health. Metric #6: Immigrant Eligibility Legal immigrants who have lived in the U.S. for five years, are disabled, or are under 18 qualify for SNAP benefits.
For various reasons that we explore later in the paper, some people of those eligible to receive SNAP benefits opt out of receiving them. Below is a table detailing the number of people who chose to receive SNAP benefits between 1969 and 2014.
The table below details SNAP participation and cost between the years of 1969 and 2014. This information provides context to the SNAP program’s usage and spending trends overtime.
Supplemental Nutrition Assistance Program Participation and Costs
(Data as of April 10, 2015)
Average Benefit Per Person 1]
All Other Costs 2]
Fiscal Year
Average Participation
Total Benefits Total Costs
Thousands Dollars Millions of Dollars
1970 4,340 10.55 549.70 27.20 576.90
1980 21,082 34.47 8,720.90 485.60 9,206.50
1990 20,049 58.78 14,142.79 1,304.47 15,447.26
2000 17,194 72.62 14,983.32 2,070.70 17,054.02
2

2001 17,318 74.81 15,547.39 2,242.00 17,789.39
2002 19,096 79.67 18,256.20 2,380.82 20,637.02
2003 21,250 83.94 21,404.28 2,412.01 23,816.28
2004 23,811 86.16 24,618.89 2,480.14 27,099.03
2005 25,628 92.89 28,567.88 2,504.24 31,072.11
2006 26,549 94.75 30,187.35 2,715.72 32,903.06
2007 26,316 96.18 30,373.27 2,800.25 33,173.52
2008 28,223 102.19 34,608.40 3,031.25 37,639.64
2009 33,490 125.31 50,359.92 3,260.09 53,620.01
2010 40,302 133.79 64,702.16 3,581.78 68,283.94
2011 44,709 133.85 71,810.92 3,876.25 75,687.18
2012 46,609 133.41 74,619.34 3,791.70 78,411.05
2013 47,636 133.07 76,066.32 3,862.83 79,929.15
2014 46,536 125.35 69,999.81 4,139.90 74,139.71
All data subject to revision. 1
1] Represents average monthly benefits per person. 2] Includes the Federal share of State administrative expenses, Nutrition Education, and Employment and Training programs. Also includes other Federal costs (e.g., Benefit and Retailer Redemption and Monitoring, Payment Accuracy, EBT Systems, Program Evaluation and Modernization, Program Access, Health and Nutrition Pilot Projects). 3] Puerto Rico initiated Food Stamp operations during FY 1975 and participated through June of FY 1982. A separate Nutrition Assistance Grant began in July 1982 . 2
Literature on SNAP and Child Health
There is a large amount of literature on the topic of the effects of the SNAP program on child health, both in academic and everyday forums. The change from the “Food Stamp Program” to the “Supplemental Nutrition Assistance Program” in 2008 (USDA 2012) has motivated many to study the relationship between SNAP and health, particularly for children. Many academics focus on the relationship between SNAP recipiency and obesity.
In their paper “The Effects of Childhood SNAP Use and Neighborhood Conditions on Adult Body Mass Index”, Thomas P. Vartanian and Linda Houser analyze the effects of child SNAP recipiency and the neighborhoods they grow up in on adult body mass index, and find a positive correlation between SNAP recipiency and adult BMI. In his paper, “The Effect of SNAP and WIC
1 Supplemental Nutrition Assistance Program (SNAP), United States Department of Agriculture, accessed April 14, 2015, http://www.fns.usda.gov/pd/supplementalnutritionassistanceprogramsnap. 2 Supplemental Nutrition Assistance Program (SNAP), United States Department of Agriculture, accessed April 14, 2015, http://www.fns.usda.gov/pd/supplementalnutritionassistanceprogramsnap.
3

Programs on Nutrient Intakes of Children,” Steven Yen analyzes the effect of participating in SNAP on the nutrients in children’s diets. He concludes that participation in SNAP has negligible effects on child health once children are already participating in WIC.
However, not all academics are in agreement that SNAP and obesity are positively correlated. Rebecca Burgstahler argues in “The Supplemental Nutrition Assistance Program, Financial Stress, and Childhood Obesity” that when controlling for income, obesity and SNAP recipiency are negatively related. Similarly, research by the Center on Budget Policy Priorities and the Economic Research Service (ERS) claims that “children in families receiving SNAP are less likely to be underweight or at risk of developmental delays than children in households that are eligible for, but not receiving, SNAP” (Keith Jennings). ERS studies support a relationship between SNAP participation and households’ overall dietary quality, as measured by the USDA Healthy Eating Index. Children, in particular, who participate in SNAP, report lower levels of nutrition deficiencies, and have higher levels of essential vitamins and minerals (Snap to Health). In November of 2012, Hilary Hoynes, Diane Whitmore Schanzenbach, and Douglas Almond reported that “access to food stamps in utero and in early childhood leads to significant reductions in metabolic syndrome conditions (obesity, high blood pressure, heart disease, diabetes) in adulthood” (Hoynes, et al. 2012).
The relationship between SNAP and health is also prevalent in the everyday media. Just this month, an article in the Huffington Post, titled “Food Stamp Recipients More Likely To Be Obese, Study Finds,” cited a recent study by the USDA that showed SNAP recipients were about 8% more likely to be obese than U.S citizens that qualified for, but did not receive SNAP benefits. The article points toward less healthy diets (particularly empty caloric consumption through soda) as the main cause.
The relationship between SNAP and health is particularly relevant from a policy perspective, as there is an ongoing debate as to whether or not to restrict which foods can be purchased with SNAP benefits. Currently SNAP benefits can be used to purchase all groceries except prepared meals. 3However, many policymakers feel SNAP should be remodeled to more closely mirror WIC a governmental program specifically targeted for women and children that restricts benefits to only healthy food options. In this paper, we build off of previous literature regarding SNAP and child health 4
to explore the question of whether restricting the foods that SNAP benefits can buy is an appropriate policy to pursue to decrease childhood obesity and improve child health.
Data and Descriptive Statistics
Data from the Integrated Health Interview Series (IHIS) was analyzed in this study. The IHIS was funded through the National Institute of Child Health and Development and harmonizes data from the United States National Health Interview Survey (NHIS) in order to allow samples from different years to be combined. This study uses samples from 2002, 2010, and 2013 in order to maintain an adequate sample size for all regressions.
Each sample is composed of individuallevel data collected by surveying a given household member about the other members of their household. Since SNAP eligibility is determined using a variety of householdlevel factors, several measures were recoded to indicate whether anyone in the 5
child’s household fit into a given category, rather than the children themselves (e.g. the proportion of employed adults in the household, and whether everyone living in the household was a citizen of the United States).
3 SNAP benefits also exclude purchasing of alcohol, tobacco, and restaurant foods. 4 “Healthy” indicates the products available to WIC recipients must comply with USDA Dietary Guidelines. 5 See Appendix.
4

Table 1: IHIS Dataset Variable Descriptions:
Dependent Variable Variable Description
bmikidrec Body Mass Index (BMI) for children between 12 and 17 years of age, calculated from responses from height and weight questions in the IHIS. Recoded to adjust for missing values, and multiplied by 0.01 for readability, since results were reported as BMI multiplied by a factor of 100 (e.g. a BMI of 25.00 was reported as 2500).
healthrec Selfreported health on a fivepoint scale, with 5= “Excellent,” 4= “Very Good,” 3= “Good,” 2= “Fair,” and 1= “Poor.” Recoded from IHIS which reported 5 as “Poor” and 1 as “Very Good,” and recoded to adjust for missing values.
prescriptionmed Indicator variable coded as 1 if a child needed prescription medication in the past three months, and coded as 0 if a child did not need prescription medication in this time period. Recoded to adjust for missing values.
sldayrrec Number of days that a child missed school in the past twelve months. Recoded to adjust for missing values, including marking the 173 children who did not attend school in the past twelve months as missing. Responses are highly skewed to the right, with slight clustering around multiples of five.
Independent Variable Variable Description
chsupfam Indicator variable coded as 1 if anyone in the child’s household received income from child support in the previous calendar year, and coded as 0 if no one in the household received income from child support in the previous calendar year.
citizenfam Indicator variable coded as 1 if all members of the child’s household are citizens of the United States, and coded as 0 if not all members of the household are citizens of the United States.
citizenrec Indicator variable coded as 1 if the child is a citizen of the United States, and coded as 0 if the child is not a citizen of the United States.
disabfam Indicator variable coded as 1 if anyone in the child’s household received SSI due to disability, and coded as 0 if no one in the household received SSI due to disability.
elderfam Indicator variable coded as 1 if anyone in the child’s household is 60 years of age or older, and coded as 0 if everyone in the household is under 60 years of age.
5

female Indicator variable coded as 1 if the individual is female, and coded as 0 if the respondent is male. Recoded from the IHIS variable “sex,” which coded male as 1 and female as 2, and recoded to adjust for missing values.
foodinsec Indicator variable coded as 1 if the individual’s household was “sometimes” or “often” worried that they would run out of food in the past 30 days, and coded as 0 if the individual’s household was “never” worried that they would run out of food in the past 30 days.
gotstampfamrec Indicator variable coded as 1 if any family member in the household received Food Stamps (SNAP) in the last calendar year. Recoded to adjust for missing values.
headstarevrec Indicator variable coded as 1 if the child ever attended a Head Start program, and coded as 0 if the child did not ever attend such a program. Recoded to adjust for missing values.
homeowner Indicator variable coded as 1 if the child’s family owns their home, and coded as 0 if the child’s family does not own their home.
povline15 Indicator variable coded as 1 if the household’s income is above 150% of the poverty level, and coded as 0 if the household’s income is below 150% of the poverty level. Recoded to adjust for missing values.
workfam Proportion of adults age 1860 in the child’s household who were employed (working in the past two weeks at the time of the survey).
6

Table 2: Descriptive Statistics for Sample of Children 18 Years or Younger (n = 80,876)
Variable n Mean Std. Dev. Min Max
bmikidrec 7997 22.429 4.971 7.97 57.63
chsupfam 80876 0.133 0.339 0 1
citizenfam 80876 0.771 0.420 0 1
citizenrec 80566 0.957 0.202 0 1
disabfam 80876 0.046 0.209 0 1
elderfam 80876 0.072 0.259 0 1
female 80876 0.486 0.500 0 1
foodinsec 28022 0.242 0.429 0 1
gotstampfamrec 79144 0.231 0.422 0 1
headstarevrec 73092 0.194 0.396 0 1
healthrec 80749 4.320 0.839 1 5
homeowner 79415 0.585 0.493 0 1
povline15 214772 0.717 0.451 0 1
prescriptionmed 36642 0.130 0.337 0 1
sldayrrec 25604 3.554 6.937 0 240
workfam 79533 0.723 0.339 0 1
7

Table 3: Means of Dependent Variables for Children in Treatment and Control Groups
Variable
Families Not Receiving SNAP Families Receiving SNAP
Mean Std. Deviation Mean Std. Deviation
healthrec 3.916 1.032 3.465 1.212
bmikidrec 22.396 5.040 23.460 5.821
sldayrrec 3.581 6.934 5.061 9.876
prescriptionmed 0.128 0.335 0.167 0.373
Modeling the Effects of SNAP Uptake on Child Health
To begin our analysis, we ran simple linear regressions of our child health variables on our
independent variable of interest, gotstampfamrec. gotstampfamrec is an indicator variable coded as 1 if any family member in the household received SNAP benefits in the last calendar year and as 0 if no family member in the household received SNAP benefits in the last calendar year. We chose four metrics to measure child health: the child’s health on a scale of 15 reported by the survey respondent (healthrec), the child’s body mass index (bmikidrec), whether the child needed prescription medication in the last three months (prescriptionmed), and the number of school days the child had missed in the past year (sldayrrec).
As shown in Table 3, children whose families received SNAP had a wider spread of results for all four of our health indicators. On average, this group had lower selfreported health (closer to “Good” than “Very Good”), had higher body mass indexes, missed more days of school, and was more likely to have needed prescription medication in the past three months. We began with these simple regressions in order to highlight the relationship albeit an extremely positively biased relationship that we suspect exists between SNAP receipt and child health outcomes.
Four Regression Models healthrec=B0+B1(gotstampfamrec)+ Ei; bmikidrec=B0+B1(gotstampfamrec)+ Ei;
prescriptionmed=B0+B1(gotstampfamrec)+ Ei; sldayrrec=B0+B1(gotstampfamrec)+ Ei
8

Table 4: Simple Regression Results
We found that SNAP receipt had a significant effect on all four of our health variables. Our
model predicts that children whose families received any SNAP benefits have selfreported health 0.342 points lower than children whose families do not receive SNAP, have body mass indexes 1.096 points higher than children whose families do not receive SNAP, are 3.4% more likely to have needed prescription medication in the past three months, and have missed about one more day of school in the past year. All four of these results demonstrate negative health effects for children whose families receive SNAP. However, since various factors that could also influence health outcomes also influence SNAP uptake, we cannot assume that this is a causal relationship. Additionally, our R2 values for these models indicate that the variation in SNAP receipt only accounts for 0% to 1% of the variation in the health variables, which indicates that these models are poorly fit to the data. While it is clear that children in families that receive SNAP have poor health outcomes in relation to children in families that do not receive SNAP, it is unclear what portion of these poor outcomes stems from background characteristics and what portion stems from SNAP receipt itself. In order to create a more powerful model, we must control for additional variables.
Multiple Regression
In our second round of analysis, we ran regressions that account for metrics used to assess SNAP eligibility, as well as other variables that may be correlated with both health outcomes and SNAP uptake.
Several of these metrics and variables were modified to be applicable to the children in our sample. We chose this familybased approach because if a person in the child’s household fits into these categories, there is a chance that the child’s health and wellbeing would be affected. Children with an elderly person in their household may indirectly benefit from programs designed to help the elderly, and children living in households in which most of the adults are employed may have different health outcomes than children in households in which few adults are employed. Thus, our second round of regressions includes variables indicating whether anyone in the child’s household received income from child support (chsupfam), whether everyone in the child’s household was a citizen of the United States (citizenfam), whether the child themself was a citizen of the United States (citizenrec), whether anyone in the child’s household received SSI payments due to disability (disabfam), whether anyone in the child’s household was over 60 years old (elderfam), and the proportion of adults in the child’s household who were employed for the past two weeks (workfam).
We controlled for the sex of the child (female) since there may be gender differences in health outcomes. We also controlled for whether the child’s family owned their own home (homeowner) and for whether the child’s household income was above or below 150% of the poverty level (povline15), since wealth and income can affect health outcomes. The value of 150% was selected to approximate
9

the gross household income level for SNAP eligibility, 130% of the poverty level. As well, we included a measure for household food insecurity (foodinsec) and a measure for whether a child had ever been enrolled in a Head Start program (headstarevrec), both of which could potentially correlate with health outcomes and with SNAP uptake.
Table 5 gives our results for these multiple regressions. With the control variables included, SNAP uptake still has a significant effect on selfreported health and missed days of school, but the magnitude of the effect is smaller than the magnitude of the effect in the simple regression, since our controls are accounting for the simple model’s bias. Additionally, when the control variables are included, SNAP uptake no longer has a significant effect on a child’s BMI or the likelihood that a child would have needed prescription medication. These results suggest that BMI and prescription medication use are closer linked to background characteristics of the child than to SNAP uptake by the child’s family.
In our health status regression, once our controls were added to the model, the magnitude of the effect of SNAP uptake on child health shrunk drastically. Respondents in families receiving SNAP reported children’s health only 0.089 points lower, on average, than respondents in families that did not receive SNAP, as opposed to 0.342 points lower in the simple model. This suggests that our results in the simple model were biased by some of the variables we are controlling for. The variable with the largest effect on child health was whether anyone in the household was receiving SSI payments related to a disability; respondents in these households rated their children’s health 0.307 points lower on average than respondents from other households did. Children in food insecure households, children in households where someone received child support, and children who attended Head Start programs were also were reported to have lower health (0.198, 0.054, and 0.146 points lower, respectively). Children living in households where everyone was a citizen were reported to have higher health than children living with noncitizens (0.117 points higher), yet children who were citizens were reported to have slightly lower health than children who were noncitizens (0.091 points lower). Children living above 150% of the poverty level were reported to have higher health than children living below 150% of the poverty level (0.093 points higher), and children in households where all of the adults were working were reported to have slightly higher health than children in households where fewer adults were working (0.036 point difference between 0% of adults working and 100% of adults working).
Our second model did not find a significant relationship between SNAP uptake and children’s BMI. However, the four significant variables in our BMI model highlight how poorer children tend to have higher BMIs. Children in food insecure households had BMIs 0.504 points higher than children in food secure households, children who had been enrolled in Head Start programs had BMIs 0.379 points higher than children who did not, and children living above 150% of the poverty line had BMIs 0.551 points lower than poorer children. Additionally, children living in households where someone received SSI payments related to a disability were predicted to have BMIs 0.979 points higher than children in other households. It is possible that children in these households may be less active, as they may care for or spend time with the disabled family member in lieu of physical activity. No other variables in this model had a significant impact on children’s BMI.
We also did not find a significant relationship between SNAP uptake and whether a child would have needed prescription medication in the past three months. Children in families in which someone received SSI payments due to a disability were 13.8% more likely to have needed prescription medication, which may imply a condition running in the family, or simply being part of a family that visits a doctor more often. Children in families receiving child support were 4.9% more likely to have needed prescription medication than other children, and children in households where everyone was a citizen were 6.3% more likely to have needed prescription medication. Both children in food insecure households and children who attended Head Start programs were 4.4% more likely to have needed prescription medication, and children living above 150% of the poverty level were 2.3% more likely to
10

have needed prescription medication than children living below this level. Female children were 2.8% less likely to have needed prescription medication than male children, and children in households where all adults worked were 3.2% less likely to have needed prescription medication than children in households where no adults worked.
Finally, our fourth model found a significant relationship between SNAP uptake and the number of school days a child missed per year. Children in families receiving SNAP missed 0.875 more days of school per year than children whose families did not receive SNAP. Children in households where everyone was a citizen missed 0.899 more days than children in households with noncitizens, children in food insecure households missed 0.976 more days than children in food secure households, children living above 150% of the poverty level missed 0.495 more days than children living below this level, and children in households where anyone was receiving SSI payments due to a disability missed 1.102 more days than children in other households. Children in families where all the adults were working missed 1.002 fewer days of school than children in households where no adults worked, likely due to a lack of available child care for sick children during school hours.
Two variables had zero significant effects on any of our variables of interest: the presence of an elder in the household and home ownership status. Since only 7.2% of children in our sample lived in households where an elder was present, the lack of significant findings may stem from high variation within the comparatively small sample, as elders may be living in the same households as children for a wide variety of reasons. Additionally, the effects of family homeownership status on child health may be encompassed within the more general effects of poverty and income levels on child health.
11

12

Results and Bias
There are several demographic characteristics that could influence both child health and SNAP eligibility. For one, children in lowerincome families may have limited access to health services, and thus poorer health. Income levels directly relate to SNAP eligibility, but families living in more extreme poverty may have different health outcomes than do families with slightly higher incomes. The significant effects of incomelinked variables, such as income below 150% of the poverty level and food insecurity, may help to explain why SNAP uptake did not have a significant effect on BMI and prescription medication use in our models.
As mentioned earlier, in their paper “The Effects of Childhood SNAP Use and Neighborhood Conditions on Adult Body Mass Index”, Thomas P. Vartanian and Linda Houser find a positive correlation between SNAP recipiency and adult BMI. Because we were unable to find countylevel data, we had trouble accounting for the influence of the neighborhood that a child lives in on child health. It is important to account for neighborhoods because neighborhoods can influence what and how much a child eats, how much a child exercises and in which ways a child exercises, and what type of environmental pollution a child may encounter that hinders him or her from spending time outside.
Additionally, although our research question focuses exclusively on SNAP, we recognize that additional government programs may also impact child health. Head Start, which targets lowincome children’s social, health, and cognitive development, is one such program. We included Head Start enrollment in our model to stand in for the effects of enrollment in a variety of additional government programs that may correlate with enrollment in SNAP.
The price of “healthier” foods has also risen in the past thirty years, as depicted by the graph below. The prices of cake, cupcakes, cookies, other sugars and sweets, and alcoholic beverages have increased but not as much as have the prices of fresh fruits and vegetables, which leads many to argue that healthy food has become unaffordable for many SNAP recipients and people of lower socioeconomic status. We were unable to account for this price increase of fruits and vegetables in our regressions, which could lead to an overestimated coefficient.
(Schanzenbach 2013)
13

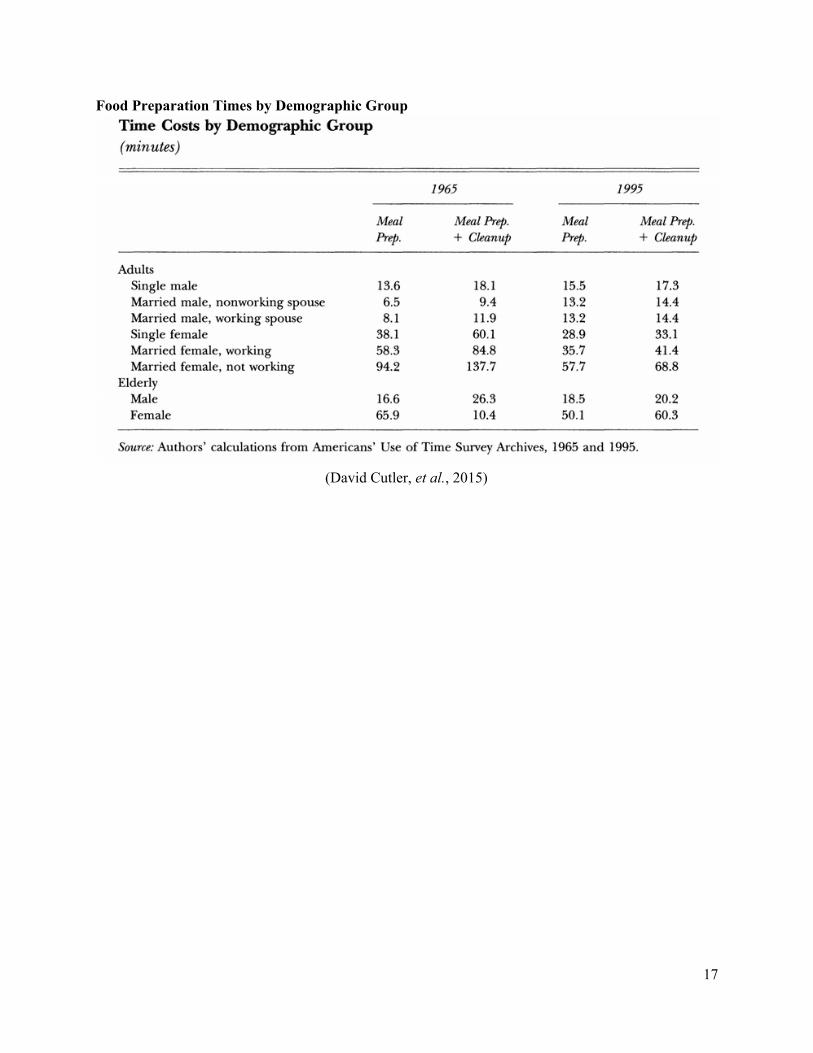
Furthermore, we could not account for the fact that healthier food often takes longer to prepare
than does unhealthy food, and that many parents of lower socioeconomic status may be too busy working many jobs to spend time preparing healthy food for their children. As the table below highlights, time allotted for food preparation has decreased overtime, which, as David Cutler et al. argues, has contributed to the obesity epidemic, however we could not account for the decrease in available meal preparation time in our regression.
(David Cutler, et al., 2015)
With the data available to us, we also could not account for the change in SNAP benefit
transactions in the year 2008. Prior to 2008, SNAP recipients needed to present coupons at the counter in order to receive items, thus many people felt “too proud” (NPR 2013) to take advantage of food stamps, as coupons made it quite obvious who was on food stamps and who was not. In 2008, SNAP recipients were granted the right to obtain SNAP benefits via credit card, or electronic benefit transfer (EBT). With this change in transaction method, the transaction of using SNAP benefits to purchase food mimics the transaction required for anyone without SNAP benefits to purchase food. Because those who are eligible for SNAP feel they can now take advantage of SNAP without the associated stigma, SNAP recipiency has increased since 2008. The change in the demographic of people that now take up SNAP that didn’t prior to 2008 may be associated with certain behaviors that are also related to health. This may may confound the magnitude of the relationship we find between SNAP and child health.
Additional confounds to our model include access to physical education in schools, environmental factors in the surrounding communities (secondhand smoke exposure, presence of waste disposal sites, buildings with lead paint in the neighborhood, etc.), and certain genetic traits. All three of these confounds could influence health outcomes, and could also influence SNAP eligibility, as the former two may be common in poorer neighborhoods, and medical bills for the latter could decrease monthly household income. While we cannot account for all confounds in our model, the IHIS sample size is large enough and diverse enough that any variation in these variables should balance out.
14

Conclusions
Our results contribute to the highly debated question of the effect of SNAP on health, but unsurprisingly do not offer concrete answers as to the sign and magnitude of this relationship. Our results show a negative relationship between SNAP recipiency and child health, which decreases in magnitude after controlling for other confounding variables, specifically variables that help decide whether or not one is eligible for SNAP. This was intended to isolate the effect of SNAP on child health, and not include the influence of other factors that might also be related to both SNAP recipiency and health (e.g. income, whether or not a household member is disabled.) If we have effectively controlled for other confounding variables, our results suggest that participation in the SNAP program does not lead to a healthier outcome, and the program should be reformed to ensure that it more closely aligns with the aim of providing low income families with supplemental nutrition assistance. However, it is very possible (given the low magnitude of the coefficients) that our results are biased, as is discussed in detail above.
Our results are consistent with literature that shows a negative relationship between child health and SNAP (Vartanian and Houser) but contradict literature that argues a positive relationship (Hoynes, ERS). Our study also shows that the effect of SNAP recipiency on BMI is not statistically significant, which contradicts Vartanian and Houser’s main finding, and one of the key questions of our study whether SNAP recipiency is correlated with obesity.
It is unsurprising that we did not find a strong positive correlation between SNAP recipiency and BMI (obesity), for there is an equal amount of literature that suggests the relationship is in the opposite direction.
While our study intends to add to the discourse on changing SNAP policy, the low values of our coefficients are too low for us to make make policy recommendations with significant conviction. We would want to see a statistically significant result between SNAP recipiency and BMI in order to suggest whether or not the SNAP program should be reformed, such as restricting purchases to healthy food.
Our study highlights the complex relationship between child health and SNAP recipiency, and underlines the challenges in creating health policy.
15

Appendix Flow Chart on Snap Eligibility
16
Food Preparation Times by Demographic Group
(David Cutler, et al., 2015)
17

Citations
David M. Cutler, Edward L. Glaeser and Jesse M. Shapiro. "Why Have Americans Become More Obese?" N.p., 2003. Web. 15 May 2015.
Hilary W. Hoynes, Diane Whitmore Schanzenbach, Douglas Almond. "LONG RUN IMPACTS OF CHILDHOOD ACCESS TO THE SAFETY NET." (n.d.): n. pag. Nov. 2012. Web. 15 May 2015.
Minnesota Population Center and State Health Access Data Assistance Center, Integrated Health Interview Series: Version 5.0. Minneapolis: University of Minnesota, 2012. Web. 15 May 2015. https://www.ihis.us
Schanzenbach, Diane. "Strengthening SNAP for a More FoodSecure, Healthy America." (n.d.): n. pag. Dec. 2013. Web. 15 May 2015.
"Signing Up For Food Stamps: The Choice And The Stigma." NPR. NPR, 25 Apr. 2013. Web. 15 May 2015.
United States Department of Agriculture, Food and Nutrition Service, Office of Research and Analysis. "Building a Healthy America: A Profile of the Supplemental Nutrition Assistance Program." (2012). Apr. 2012. Web. 15 May 2015.
"What's Behind the Rise in SNAP Participation?" USDA ERS . N.p., 01 Mar. 2012. Web. 15 May 2015.
18