Embed Size (px)
Citation preview

1
Vibration Exposure of Individuals Using Wheelchairs over Concrete Paver Surfaces
Erik Wolf, M.S.3,4, Jonathan Pearlman, M.S.3,4, Rory A. Cooper, Ph.D.1-4, Shirley G. Fitzgerald, Ph.D.1,2,4, Annmarie Kelleher, M.S., O.T.R./L, A.T.P.1,4, Diane
M. Collins, Ph.D., O.T.R./L.1,4, Michael L. Boninger, M.D. 1-4, and Rosemarie Cooper, M.P.T., A.T.P. 1,2,4
Departments of Rehabilitation Science & Technology1, Physical Medicine & Rehabilitation2, and Bioengineering3
University of Pittsburgh, Pittsburgh, PA 15261
HUMAN ENGINEERING RESEARCH LABORATORIES4 VA Rehabilitation Research and Development Centre
VA Pittsburgh Healthcare System Pittsburgh, PA, 15206
ADDRESS CORRESPONDENCE TO: Rory A. Cooper, Ph.D. Human Engineering Research Laboratories (151-R1) VA Pittsburgh Healthcare System 7180 Highland Drive Pittsburgh, PA 15206 TEL: (412) 365-4850 FAX: (412) 365-4858 e-mail: [email protected] November 10, 2004

2
Abstract
The vibration exposure produced by traversing nine surfaces was evaluated by having 10
individuals without disabilities propel over them in both a manual and powered
wheelchair. According to the International Standards Organization 2631-1 standard on
human vibration, individuals in a seated position are at risk of injury due to whole-body
vibrations when exposed for long periods of time. Wheelchair users fit this description
perfectly, however little research has been conducted to evaluate the amount of vibration
transmitted to a wheelchair user. The only distinguishing characteristic between the
surfaces was the height of their bevels and the pattern in which they were installed.
Power Wheelchair Results: The standard poured concrete surface was used as a norm
and compared to the other surfaces. Two surfaces resulted in higher vibration exposure
than the standard; an 8mm bevel ICPI surface in a 90 degree herringbone pattern and a
6mm bevel ICPI surface in a 90 degree herringbone pattern. Manual Wheelchair
Results: Three surfaces resulted in higher vibration exposure than the standard surface;
the 8mm bevel surface in a 90 degree herringbone pattern, and the two 6mm bevel
surfaces placed in 90 and 45 degree patterns Recommendations: Using smaller bevels
on pavers exposes individuals using wheelchairs to less vibration. Also, pavers installed
in a 90 degree herringbone pattern produced lower vibration exposures. It is
recommended that only pavers of 6 mm bevel or less be used, with a 90 degree
herringbone pattern.
KEYWORDS:
Wheelchairs, Vibration, Injury, Sidewalks, Accessible Surface
3
1. Introduction
People who use wheelchairs as their primary means of mobility often use their
wheelchairs throughout the course of the entire day. While propelling a wheelchair, users
encounter obstacles such as bumps, curb descents, and uneven driving surfaces. These
obstacles cause vibrations on the wheelchair and in turn, the wheelchair user, which
through extended exposure can cause low-back pain, disc degeneration, and other
harmful effects to the body (1-3). To date, little research has been conducted to assess
the vibrations experienced by people who use wheelchairs (4-5). Van Sickle et al. (6)
recorded the forces that resulted from using the American National Standards
Institute/Rehabilitation Engineering and Assistive Technology Society of North America
(ANSI/RESNA) Standards double drum and curb drop tests, and compared them to the
vibrations experienced during ordinary propulsion. Van Sickle et al. (7) also
demonstrated that wheelchair propulsion produces vibration loads that exceed the ISO
2631-1 standards at the seat of the wheelchair, as well as the head of the user. The
International Standards Organization (ISO) and ANSI (8) developed a Standard for
whole-body vibration measurement. This Standard includes the amplitudes of vibrations
considered harmful and the associated exposure times for the vibrations ranges that were
identified as hazardous. The Standard describes some of the physical effects that can
occur from whole-body vibration exposure.
Research has found correlations between whole-body vibrations and secondary injuries in
the trucking and construction industries (9-10). Seidel et al. (1) reported that occupational
4
groups (e.g., tractor, bus, and truck drivers, etc.) exposed to whole-body vibrations near
or above the ISO exposure limit had increased risk of secondary musculoskeletal injury.
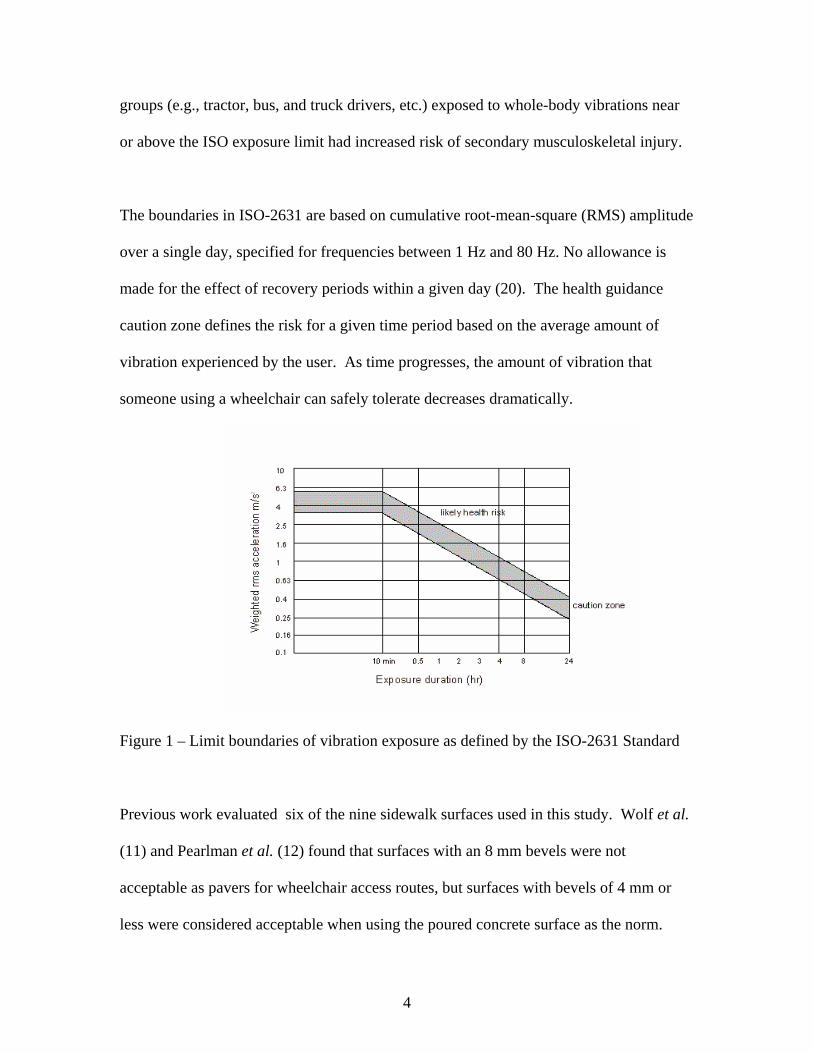
The boundaries in ISO-2631 are based on cumulative root-mean-square (RMS) amplitude
over a single day, specified for frequencies between 1 Hz and 80 Hz. No allowance is
made for the effect of recovery periods within a given day (20). The health guidance
caution zone defines the risk for a given time period based on the average amount of
vibration experienced by the user. As time progresses, the amount of vibration that
someone using a wheelchair can safely tolerate decreases dramatically.
Figure 1 – Limit boundaries of vibration exposure as defined by the ISO-2631 Standard
Previous work evaluated six of the nine sidewalk surfaces used in this study. Wolf et al.
(11) and Pearlman et al. (12) found that surfaces with an 8 mm bevels were not
acceptable as pavers for wheelchair access routes, but surfaces with bevels of 4 mm or
less were considered acceptable when using the poured concrete surface as the norm.

5
Cooper et al. produced similar results when performing frequency analyses comparing
the six sidewalk surfaces (13). They reported that only the 8 mm beveled surface
produced significantly higher, and potentially injurious, levels of whole-body vibrations;
the other surfaces with 4 mm or smaller bevels could be safely traversed by those using
wheelchairs. Further, no significant differences were found in the work required to
propel over the ICPI surfaces compared to the poured concrete surface.
Rigorous measurements of vibration exposure due to traversing different sidewalk
surfaces—a daily task for most wheelchair users—has not been reported in the literature.
If vibration exposure is significant and related to the types of surfaces traversed, this
information would be vital in the development of standards for appropriate sidewalks
surfaces, and thus, would impact regional departments of public works and the
manufacturers of sidewalk surfaces. Therefore, we performed this study to better
understand the vibration exposure experienced by people using both an electric powered
and a manual wheelchair as they traversed over selected sidewalk surfaces. The study
provides support for determining criteria for defining a wheelchair pedestrian access
route that does not require excessive propulsive work, or expose people using
wheelchairs to potentially harmful vibrations.

6
2. Methods
2.1 Test Surfaces
We tested nine different types of sidewalk surfaces.
Surfaces 1, 2, and 3
Surfaces 4, 5, and 6
Surfaces 7, 8, and 9
Figure 2 – Photograph of the Nine Surfaces Tested
All of the sidewalk surfaces were approximately four feet wide and 25 feet long. One
surface was a poured concrete sidewalk with a brush finish to represent the norm (Surface
1). Six sidewalk surfaces were made from interlocking concrete pavement and two of the
surfaces were clay brick; all were installed to industry specifications (Figure 3) (14).

7
Dimension (mm)
# Name Edge Detail Composition A B C Pattern Installed
1 Pour concrete (Norm)
Not applicable Concrete N/A N/A N/A smooth
2 Holland Paver Square - no chamfer Concrete 198 98 60 90o
3 Holland Paver 2 mm chamfer Concrete 198 98 80 90o
4 Holland Paver 8 mm chamfer Concrete 198 98 60 90o
5 Whitacre-Greer 4 mm chamfer Brick 204 102 57 45o
6 Pathway Paver Square - no chamfer Brick 204 102 57 45o
7 Holland Paver 6 mm chamfer Concrete 198 98 60 90o
8 Holland Paver 6 mm chamfer Concrete 198 98 60 45o
9 Holland Paver 4 mm chamfer Concrete 198 98 60 90o
Figure 3: Specifications of Sidewalks Tested
An Interlocking Concrete Pavement Institute (ICPI) certified contractor installed all of
the sidewalks. Data were collected in Pittsburgh, Pennsylvania, during June and July of
2004 for the first six surfaces, and during September of 2004 for the additional three
surfaces. All surfaces were tested while dry. All of the surfaces were installed outdoors
with the same slope of about 1.3 degrees for drainage, and no-cross slope. The
approximate temperature during testing for June and July was 19.1o C and for September
was 17.6o C (15).

8
2.2 Test Wheelchairs
The manual wheelchair (Quickie GP, Sunrise Medical Ltd.) used was a rigid frame
design with 127 mm (5”) diameter polyurethane tires, and standard 610 mm (24”)
diameter rear wheels (Figure 4).
Figure 4 – Setup of the Quickie GP manual wheelchair.
The seat width, depth, and backrest height were 406 mm, 458 mm, and 410 mm
respectively. The rear axles were placed 45 mm in front of the backrest tubes.
SMARTWheels with solid foam inserts were used as the rear wheels during this study (16).
The mass of the manual wheelchair was 15.5 kg with the SMARTWheels attached.
The electric powered wheelchair (Quickie P200, Sunrise Medical Ltd.) used in the study
had a rigid frame with 203 mm (8”) front casters, and 254 mm diameter rear wheels
(Figure 5).

9
Figure 5 – Setup of the Quickie P200 electric powered wheelchair.
The seat width, depth, and backrest height were 406 mm, 415 mm, and 435 mm
respectively for the electric powered wheelchair. A standard position-sensing joystick
was mounted to the right side armrest, and the manufacturer controller settings were
used. All tires were properly inflated to the rated air pressure (36 PSI for the caster, and
50 PSI for the rear wheels). The approximate mass of the electric powered wheelchair
with batteries was 89 kg. The frames of both the manual and the electric powered
wheelchairs were made from aircraft quality aluminum. All subjects sat on a 50 mm thick
polyurethane foam cushion during all testing.
2.3 Subjects
Ten unimpaired individuals used the same two wheelchairs during data collection: the
manual and electric powered wheelchairs previously described. All subjects provided
written informed consent prior to participating in the study. Five men and five women
were included in the study sample. The mean ± SD age of the subjects was 32.5 ± 11.2

10
years, and the range was 22 to 57 years. The average mass of the subjects was 72.8 ± 20.5
kg, with a range of 47 to 107 kg. The average height of the subjects was 170.9 ± 10.8 cm,
and the range was 157 to 183 cm. Subjects self-reported to be free from any shoulder
pain that would prevent them from propelling a manual wheelchair, and had no reported
history of cardiopulmonary disease.
2.3.1 Vibration Exposure during Electric Powered Wheelchair Driving
Subjects were asked to drive the electric powered wheelchair over nine sidewalk surfaces
a total of three times each, at two speeds (1 m/s and 2 m/s), for a total of 540 trials (540 =
10 subjects x 9 surfaces x 3 repetitions x 2 speeds). The manual wheelchair was driven at
1 m/s over each of the nine surfaces three times each for a total of 270 trials (270 = 10
subjects x 9 surfaces x 3 repetitions). Speed was verified for each trial using a stopwatch
over a known distance. Trials were considered acceptable when the time was within ±
0.5% of the target time. Speed was normalized because of the positive correlation
between vibration and speed. Tri-axial accelerations were collected at the footrests and
seat, using instrumentation described in a previous study (17). The seat accelerometer
was mounted on an aluminum plate (406mm x 406mm x 6mm), and was placed on the
seat under the cushion, so the user was not seated on a hard metal surface. The footrest
accelerometer was mounted to an aluminum plate and mounted to the footrests (Fig. 4). A
custom data-collection program was used to interface with a data acquisition card. The
acceleration data were calibrated and converted for analyses in custom software written
using Matlab (18).

11
2.4 Data Reduction
The data reduction consisted of converting each of the three axes of the accelerometers
from raw A/D data into acceleration vector data for both the seat and the footrest using
calibration constants for each of the accelerometers (Kacc). See equation 1.
rawaKa
rawaKarawaKa
zaxcz
yaxcy
xaxcx
×=
×=×=
(1)
The subscripts x, y and z represent the fore-aft, medial-lateral, and superior-inferior
directions, respectively.
The ISO-2631 Standard defines frequency weightings for accelerations in the time
domain for each axis of translation. The plots of these frequency weightings are shown
below in Figure 6. The fore-aft and the medial-lateral directions use the first weighting
scale, while the vertical direction is weighted differently.
10-2
10-1
100
101
102
103
104
-200
-100
0
100
200
Frequency (rad/s)
Pha
se (de
gree
s)
10-2
10-1
100
101
102
103
104
10-10
10-5
100
105
Frequency (rad/s)
Mag
nitu
de

12
10-2
10-1
100
101
102
103
104
-200
-100
0
100
200
Frequency (rad/s)
Pha
se (de
gree
s)
10-2
10-1
100
101
102
103
104
10-10
10-5
100
105
Frequency (rad/s)
Mag
nitu
de
Figure 6 – Frequency weightings for the accelerations. The top weighting is used for the
fore-aft and medial-lateral directions and the lower weighting is used for the vertical
direction (8).
Once the frequency weightings were applied to the accelerations, the root-mean squares
were calculated in each direction for the trial. The average root-mean square values in
the vertical direction over each of the surfaces were used as the metric of comparison for
this study.
2.5 Statistical Analysis
For all variables, distributions were examined for outliers and to determine whether data
were normally distributed. For all continuous variables, means and standard deviations
were calculated. Analyses were completed using SAS (19). A repeated-measures
(repeated: surfaces and subjects) Analysis of variance (ANOVA) was used to determine
if differences existed between the main effects of the surfaces, and a Tukey-Kramer post-
hoc test was used to determine whether the vibration produced by the surfaces differed

13
significantly. Significance levels were set at p < 0.05. Separate models were completed
for wheelchair types (manual and power), and separate models were developed for the
different speeds of the power wheelchair trials.
3. Results
3.1 Manual Wheelchair Propulsion
Preliminary examination of the data revealed one outlier for one subject due to sharp
increases in vibration at the end of the trial (due to popping a wheelie). The comparison
of the sidewalk surfaces revealed that, compared to the standard poured concrete surface,
(1) Surfaces 3, 5, 6, and 9 did not differ significantly in vibration level produced. Surface
2 was the only surface resulting in significantly lower vibration exposure than Surface 1
(norm), and Surfaces 4, 7, and 8 produced significantly higher vibration exposures.
A linear regression of the data as a whole revealed a positive correlation between the
RMS vertical vibration and the surface bevel, with a slope of 0.0455 and an R2 value of
0.57. Separate regressions were then run for the 45 degree and 90 degree herringbone-
patterned surfaces. The regression for 90 degree patterns had a slope of 0.0517 and an
R2 value of 0.77. The 45 degree regression produced a slope of .04 and an R2 value of
0.41.
3.2 Electric Powered Wheelchair Driving
At 1 m/s, the RMS accelerations at the seat significantly differed between the sidewalk
surfaces (p=0.004). The RMS accelerations at the seat for Surfaces 2, 3, and 5 were lower
than the standard sidewalk surface, Surfaces 6, 8, and 9 showed no significant

14
differences, and Surfaces 4 and 7 were significantly higher. At 2 m/s RMS of vibration
exposure of all of the surfaces were significantly lower than that the standard sidewalk
surface. A positive correlation at 1m/s with a 90 degree herringbone pattern was found in
the power wheelchair trials. The slope was 0.0655 and the R2 value was 0.83. The other
linear regressions demonstrated little or no correlation between vibration levels produced
and the bevel sizes. The 45 herringbone pattern at 1 m/s, and the 90 and 45 herringbone
pattern at 2 m/s had R2 values of .25, .002, and .016 respectively.
Table 1 shows displays the time that a wheelchair user would need to travel on each
surface to be exposed to a level of vibration that is considered a possible health risk.
Table 1 – Comparison to ISO 2631 lower boundary of the Health Guidance Caution Zone
Material, chamfer Manual Wheelchair Electric Powered Wheelchair
Surface width, herringbone
pattern angle Exposure Limit (hours) at 1 m/s
Exposure Limit (hours) at 1 m/s
Exposure Limit (hours) at 2 m/s
1 poured concrete 6.77 11.62 1.26 2 concrete, 0 mm, 90º 13.38 24.31 4.72 3 concrete, 2 mm, 90º 8.53 16.40 3.14 4 concrete, 8 mm, 90º 2.34 2.43 2.31 5 brick, 4 mm, 45º 6.38 15.98 2.52 6 brick, 0 mm, 45º 6.00 12.82 2.03 7 concrete, 6 mm, 90º 4.32 4.81 3.49 8 concrete, 6 mm, 45º 2.46 12.57 2.66 9 concrete, 4 mm, 90º 6.52 11.16 4.44
4. Discussion
For both the manual wheelchair and the electric powered wheelchair trials, several
interlocking concrete surfaces performed as well or better than the sidewalk surface
representing the norm.

15
Surfaces 4, 7 and 8 produced vibration levels that were statistically higher than the
standard poured concrete surface in the manual wheelchair trials. The bevel heights of
these surfaces were the three highest of the nine tested surfaces, which would explain the
findings. Another relevant finding is that Surface 8 produced vibration levels that were
statistically higher than Surface 7, suggesting the orientation of the herringbone pattern
(90deg and 45deg, respectively) is an important factor. Consistent results were found
between Surfaces 2 and 6, which had the same bevel heights (0 mm), however Surface 6
had a higher vibration output due to its 45 degree pattern orientation. These results lead
us to recommend the use of any surface with a bevel height of less than or equal to 6 mm.
However, when using the 6mm height bevels, the pavers should only be placed in a 90
degree herringbone pattern.
The linear regression model of the bevels versus the vibration levels produced with the 90
degree herringbone-patterned surfaces revealed a reasonably good fit, as the vibration
level produced increases with the bevel heights. The 45 degree pattern was not as good a
fit, but this result may be due to insufficient data. If additional 45 degree herringbone-
patterned surfaces had been available for testing, the regression might have provided a
better fit.
Results from the electric powered wheelchair were similar to those of the manual chair at
the 1 m/s speed. Only Surfaces 4 and 7 produced vibration levels statistically higher than
the standard Surface 1. However, at 2 m/s all of the surfaces produced vibration levels
that were statistically lower than the standard sidewalk surface. The higher speed of the
16
chair and its reaction to the sharp peak vibrations caused by the spaces in the sidewalk
may explain the results obtained from the 2 m/s trials. Another possible explanation may
be due to the fore-aft acceleration of the chair itself as it approached a constant velocity.
At the 2 m/s rate of speed, the surfaces were not long enough for the chair to reach
constant velocity for the entire trial.
The linear regression of the power wheelchair data was consistent with the manual chair
data only at the 1 m/s speed. The regression had a similar slope to its best-fit line, and
the R2 value was slightly better than that of the manual chair. Results from the 2 m/s
regression demonstrated a poor linear relationship; this is thought to be due to the limited
number of surfaces tested with a 45 degree herringbone pattern, and also the high
accelerations in the fore-aft direction (as discussed above which might have significantly
affected the vibration measurements in the vertical direction.
5. Conclusion
In the report, entitled “Building a True Community: Final Report of the Public Rights-of-
Way Access Committee”, produced by the U. S. Access Board, Section X02.1.6.1
Advisory includes the statement “Individual paving units, bricks or other textured
materials are examples of surfaces that are undesirable in the pedestrian access route
because of the vibration that they cause. They may, however, be used in the portions of
the public sidewalk that do not contain the pedestrian access route. The purpose of the
visually uniform surface is to provide uniformity in color along the pedestrian access
route as a way finding cue for person with low vision.” Based on the manual and power

17
wheelchair results of this study, use of selected ICPI pavers would be acceptable for any
route traveled by individuals using wheelchair. The results are as good as, and in some
cases better, than that of a standard sidewalk surface. A bevel of less than or equal to
6mm must be used for routes used by individuals using wheelchairs. Furthermore, a 90
degree herringbone pattern is preferred over the 45 degree pattern, while the 90 degreee
herringbone pattern is required for the 6mm beveled pavers to maintain safe levels of
vibration exposure.
Acknowledgements
This study was partially funded by a consortium of the Interlocking Concrete Pavement
Institute (ICPI), Brick Industry Association (BIA) and the National Concrete Masonry
Association (NCMA). In addition, funding was provided by the VA Rehabilitation
Research and Development Service, Veterans Health Administration, U.S. Department of
Veterans Affairs (F2181C), and the U.S. Department of Education, National Institute on
Disability and Rehabilitation Research (NIDRR) Rehabilitation Engineering Research
Center on Wheeled Mobility (H133E990001), and a National Foundation Graduate
Research Fellowship.

18
References
1. Seidel H and Heide R, Long term effects of whole-body vibration: a critical review of
the literature, International Archives of Occupational and Environmental Health.
1986; 58: 1-26
2. Magnusson M, Pope MH, Wilder DG and Areskoug B. Are occupational drivers at
an increased risk for developing musculoskeletal disorders? SPINE, 1996; 21: 710-
717
3. Fairley T. Predicting the discomfort caused by tractor vibration, Ergonomics, 1995;
38: 2091-2106
4. DiGiovine C. Analysis of whole-body vibration during manual wheelchair propulsion
using ISO standard 2631, Proceedings of the annual RESNA conference, 1999; 242-
244
5. Engel P. Aspects of wheelchair seating comfort, Ergonomics of Manual Wheelchair
Propulsion, 1991; 105-111
6. VanSickle D, Cooper RA, and Boninger ML. Road Loads acting on Manual
Wheelchairs, IEEE Transactions, 2000; 8: 371-384

19
7. VanSickle D, Cooper RA, Boninger ML, and DiGiovine CP. Analysis of vibrations
induced during wheelchair propulsion, Journal of Rehabilitation Research and
Development, 2001; 38: 409-421
8. International Standards Organization. Evaluation of Human Exposure to Whole-Body
Vibration - Part 1: General Requirements, 1995; ISO 2631-1
9. Mansfield N, and Griffin MJ. Difference threshold for automobile seat vibration,
Applied Ergonomics, 2000; 31: 255-261
10. Lee A, and Salman MA. On the design of active suspension incorporating human
sensitivity to vibration, Optimal Control Applications & Methods, 1989; 10: 189-
195
11. Wolf E, Cooper R, Kelleher A, Fitzgerald S, Ammer W, Assessment of Vibrations
During Manual Wheelchair Propulsion Over Selected Sidewalk Surfaces,
Proceedings of the annual RESNA conference, 2003
12. Pearlman P, Cooper R, Wolf E, Kelleher A, Fitzgerald S, Ammer W, Vibrations
During Manual Wheelchair Propulsion Over Selected Sidewalk Surfaces Are
Sensitive To Weather-Related Surface Wear, Proceedings of the annual RESNA
conference, 2004

20
13. Cooper RA, Wolf E, Fitzgerald S, Kelleher A, Ammer W, Boninger M, Cooper R,
Evaluation of Selected Sidewalk Pavement Surfaces, Journal of Spinal Cord
Medicine, In Press, 2004
14. Interlocking Block Association of Japan. The problem and measures of interlocking
block pavement for eyesight or walking disabled people, 1993; 6-24
15. National Weather Service, http://lwf.ncdc.noaa.gov/oa/climate/research/cag3/pa.html,
October 27, 2004
16. Asato K, Cooper RA, Robertson RN, and Ster JF. SMARTWheels: Development and
testing of a system for measuring manual wheelchair propulsion dynamics, IEEE
Transactions on Biomedical Engineering, 1993; 40: 1320-1324
17. DiGiovine C, Cooper RA, Wolf EJ, Hosfield J, and Corfman TA. Analysis of
vibration and comparison of four wheelchair cushions during manual wheelchair
propulsion, Proceedings of the annual RESNA conference, 2000; 242-244
18. MATLAB [6.0.1.13], 9-15-2000, Natick, MA, The MathWorks, Inc.
19. Littell RC, Milliken GA, Stroup WW, and Wolfinger RD. SAS System for Mixed
Models, Cary, NC: SAS Institute Inc. 1996

21
20. M.J. Griffin, Handbook of Human Vibrations, Academic Press Inc., San Diego CA
1990 pgs 173-186