Embed Size (px)
Citation preview

NTIS # PB2005-
SSC-445
STRUCTURAL SURVIVABILITY OF
MODERN LINERS
This document has been approved For public release and sale; its
Distribution is unlimited
SHIP STRUCTURE COMMITTEE 2005

Ship Structure Committee
RADM Thomas H. Gilmour U. S. Coast Guard Assistant Commandant,
Marine Safety and Environmental Protection Chairman, Ship Structure Committee
Mr. W. Thomas Packard
Director, Survivability and Structural Integrity Group
Naval Sea Systems Command
Senior Vice President
American Bureau of Shipping
Mr. Joseph Byrne
Director, Office of Ship Construction Maritime Administration
Mr. Gerard A. McDonald Director General, Marine Safety,
Safety & Security Transport Canada
Mr. Kevin Baetsen
Director of Engineering Military Sealift Command
Dr. Neil Pegg Group Leader - Structural Mechanics
Defence Research & Development Canada - Atlantic
Mr. Jaideep Sirkar (SNAME T&R Chair)
Society of Naval Architects & Marine Engineers
CONTRACTING OFFICER TECHNICAL REP.
Mr. Chao Lin / MARAD TBD / NAVSEA
Mr. Robert Sedat / USCG
EXECUTIVE DIRECTOR Lieutenant William A. Nabach
U. S. Coast Guard
SHIP STRUCTURE SUB-COMMITTEE
AMERICAN BUREAU OF SHIPPING DEFENCE RESEARCH & DEVELOPMENT ATLANTIC
Mr. Glenn Ashe Mr. Yung Shin Mr. Phil Rynn
Mr. William Hanzalek
Dr David Stredulinsky Mr. John Porter
MARITIME ADMINISTRATION MILITARY SEALIFT COMMAND
Mr. Chao Lin Mr. Carlos Setterstrom
Mr. Richard Sonnenschein
Mr. Joseph Bohr Mr. Paul Handler
Mr. Michael W. Touma
NAVAL SEA SYSTEMS COMMAND TRANSPORT CANADA
Mr. Jeffery E. Beach Mr. Allen H. Engle Mr. Charles L. Null
Mr. Val Smith
UNITED STATES COAST GUARD
Mr. Rubin Sheinberg Mr. Robert Sedat
Mr. H. Paul Cojeen Captain Ray Petow

Technical Report Documentation Page 1. Report No. SSC-445
2. Government Accession No. PB2005-
3. Recipient’s Catalog No.
4. Title and Subtitle Structural Survivability of Modern Liners
5. Report Date October 2005
6. Performing Organization Code
7. Author(s)
8. Performing Organization Report No. SR-1439
9. Performing Organization Name and Address Herbert Engineering Corp.
10. Work Unit No. (TRAIS)
927 West Street, Suite 202 Annapolis, MD 21407
11. Contract or Grant No. N00024-04-M-6621 13. Type of Report and Period Covered Final Report
12. Sponsoring Agency Name and Address Ship Structure Committee U.S. Coast Guard (G-MSE/SSC) 2100 Second Street, SW Washington, DC 20593
14. Sponsoring Agency Code G-M
15. Supplementary Notes Sponsored by the Ship Structure Committee. Jointly funded by its member agencies. 16. Abstract The analysis is comprised of the following parts:
• Definition of three typical loading conditions for the ship • Determination of three different flooding scenarios that produce different levels of heel angles and structural
loadings of the ship in calm water • Determination of a realistic wave loading for the flooded scenario • Evaluation of the ultimate or collapse strength of the ship in both the intact and damaged, heeled conditions • Comparison of the resulting loading to the strength capabilities of the ship • Comment on additional local factors that can affect the ultimate strength of the structure.
17. Key Words
18. Distribution Statement Distribution is available to the public through: National Technical Information Service U.S. Department of Commerce Springfield, VA 22151 Ph. (703) 487-4650
19. Security Classif. (of this report) Unclassified
20. Security Classif. (of this page) Unclassified
21. No. of Pages
22. Price

CONVERSION FACTORS
(Approximate conversions to metric measures) To convert from to Function Value
LENGTH inches meters divide 39.3701 inches millimeters multiply by 25.4000 feet meters divide by 3.2808 VOLUME cubic feet cubic meters divide by 35.3149 cubic inches cubic meters divide by 61,024 SECTION MODULUS inches2 feet2 centimeters2 meters2 multiply by 1.9665 inches2 feet2 centimeters3 multiply by 196.6448 inches4 centimeters3 multiply by 16.3871 MOMENT OF INERTIA inches2 feet2 centimeters2 meters divide by 1.6684 inches2 feet2 centimeters4 multiply by 5993.73 inches4 centimeters4 multiply by 41.623 FORCE OR MASS long tons tonne multiply by 1.0160 long tons kilograms multiply by 1016.047 pounds tonnes divide by 2204.62 pounds kilograms divide by 2.2046 pounds Newtons multiply by 4.4482 PRESSURE OR STRESS pounds/inch2 Newtons/meter2 (Pascals) multiply by 6894.757 kilo pounds/inch2 mega Newtons/meter2
(mega Pascals) multiply by 6.8947
BENDING OR TORQUE foot tons meter tons divide by 3.2291 foot pounds kilogram meters divide by 7.23285 foot pounds Newton meters multiply by 1.35582 ENERGY foot pounds Joules multiply by 1.355826 STRESS INTENSITY kilo pound/inch2 inch½(ksi√in) mega Newton MNm3/2 multiply by 1.0998 J-INTEGRAL kilo pound/inch Joules/mm2 multiply by 0.1753 kilo pound/inch kilo Joules/m2 multiply by 175.3

Structural Survivability of Modern Liners Table of Contents
Page 1
Table of Contents
1 EXECUTIVE SUMMARY....................................................................................................................2 2 INTRODUCTION AND BACKGROUND.............................................................................................3 3 SAMPLE SHIP ...................................................................................................................................4
General Description Structural Design
4 LOADS IN INTACT CONDITIONS .....................................................................................................7 Intact Loading Conditions (Still Water) Wave Loading
5 LOADS IN FLOODED CONDITIONS............................................................................................... 11 Flooding Scenarios
High extent two-compartment damage Raking Four-Compartment Damage Three compartment damage
Loading in the Flooded Condition Vertical and Horizontal Moments
6 ULTIMATE STRENGTH ANALYSIS ................................................................................................ 15 Methodology Intact Structure Damaged Structure Effects of Damage Extents
7 ADDITIONAL CONTRIBUTING LOCAL FACTORS ........................................................................ 20 Lateral pressure loads Initial deflections Welding induced residual stress End Connections Shear Forces
8 RESULTS – LOADS VS. CAPABILITIES ........................................................................................ 23 9 DISCUSSION OF RESULTS............................................................................................................ 24 10 REFERENCES................................................................................................................................. 25 APPENDIX A - LOAD CONDITION DETAILS ......................................................................................... 26
Structural Survivability of Modern Liners
Page 2
1 Executive Summary
This report is the continuation of Ref. 1, “Structural Survivability of a Modern Passenger Ship”, where initial studies were done to investigate the ultimate strength of modern passenger ships. The report presents results of an analysis of the ultimate strength of a second and significantly larger passenger ship in a flooded and structurally damaged, heeled condition. Additional factors that may contribute to the ultimate strength of passenger ships are also studied.
The analysis is comprised of the following parts:
• Definition of three typical loading conditions for the ship.
• Determination of three different flooding scenarios that produce different levels of heel angles and structural loadings of the ship in calm water.
• Determination of a realistic wave loading for the flooded scenario.
• Evaluation of the ultimate or collapse strength of the ship in both the intact and damaged, heeled conditions.
• Comparison of the resulting loading to the strength capabilities of the ship.
• Comment on additional local factors that can affect the ultimate strength of the structure
The results of this analysis indicate that the ultimate strength of the hull girder is not severely affected by heel angles up to 15 degrees. For the studied cases, the ultimate strength is reduced by approximately 10% compared to the upright condition of the ship.
As found before, extensive flooding in the middle of the ship can place the ship in a sagged condition in still water where the upper decks are subject to compression loading.
When combined with a realistic and moderate wave loading, the ultimate strength of this ship, even after being subjected to a severe structural damage, should be adequate to withstand the loading from the worst-case flooding.
Additional factors can also affect the ultimate strength of the ship, but many variables affect the severity of these factors. With the reported margin in ultimate strength it is believed that these factors will not affect the survivability of the ship.
Structural Survivability of Modern Liners
Page 3
2 Introduction and Background
This report describes the continuing work from SSC Project SR-1439, reported upon in HEC Report 2003-24-01, (Ref. 1). It presents a further investigation into the structural survivability of modern liners after flooding of multiple adjacent main compartments. The analysis is carried out using standard structural analysis and ultimate limit state analysis tools.
In addition to the work presented in Ref. 1, these more detailed studies are done to assess factors not accounted for in the previous study. The structural capacity of the damaged ship is evaluated with the ship in a heeled condition, accounting for factors such as horizontal bending moments and shear forces. Other additional tasks include providing commentary on the influence of lateral pressure, initial deflections, welding induced residual stresses and end conditions as well as studies of the transverse bulkheads of a damaged ship.
Discussions held at IMO’s Maritime Safety Committee, within various technical and research panels of SNAME, and at the Ship Structure Committee have drawn attention to the need to explore the survivability of modern cruise liners in the flooded condition after collision damage. In recent years modern cruise ships have grown in size to accommodate large numbers of passengers and crew. Measuring as much as 140,000 gross tons, these ships can carry as many as 5,000 persons.
Historical casualties have shown that a passenger ship may survive a flooding from a stability perspective but fail structurally. It is understood that passenger ships generally operate with a hogging still water bending moment that places the strength deck and other upper superstructure decks in tension and the bottom plating in compression. In the case of extensive flooding amidship, the additional weight of flood water potentially could substantially alter the bending moment and place the strength deck in compression. The structural capability of these ships to withstand this type of loading, after sustaining structural damage from a collision has not been extensively evaluated.
Herbert Engineering Corp. (HEC) has developed the HECSALV suite of naval architectural programs for the evaluation of ship casualties, salvage, and emergency response. The software is currently used by the casualty response departments of many of the major Classification Societies, by most major oil company fleets, by several navies, coast guards, and commercial salvors. HECSALV includes static intact and damage stability analysis, longitudinal bending analysis (in still water and superimposed on a static wave), and stress analysis based on specific intact or damage structural sections. The casualty analysis module of HECSALV has been extended to include pre- and post-processing of analysis from two US Navy applications, ULSTR and SMP, which are used in this investigation and are described in greater detail in Sections 4 and 5 of this report. The direct incorporation, model translation, and the pre/post-processing capabilities of ULSTR and SMP combined with the traditional naval architectural and casualty analysis capabilities of HECSALV make this the ideal tool to economically and efficiently meet the objectives of this SSC project.

Structural Survivability of Modern Liners
Page 4
3 Sample Ship
General Description All of the analyses in this report are based on an un-built design of a modern cruise liner. The data for this ship such as hull and compartment geometry, lightship weight distribution and structural section properties was received from the USCG and reviewed by HEC for this project. Permission to use the generic data, with details regarding the specific ship identification removed, has been given by the shipyard and potential owner/operator.
The main particulars of the ship are listed in the following Table.
LBP 242.28 m
Beam 36.00 m
Depth 30.00 m
Design Draft, keel 8.469 m
Number of Decks 15
Table 1 - Main Particulars
The ship’s hull and watertight compartments up to Deck 8 are modeled. All other spaces above Deck 8 are not part of the model and are assumed to be non-buoyant and free flooding in the flooded condition, see Fig. 1.
Figure 1 – HECSALV Model
Structural Survivability of Modern Liners
Page 5
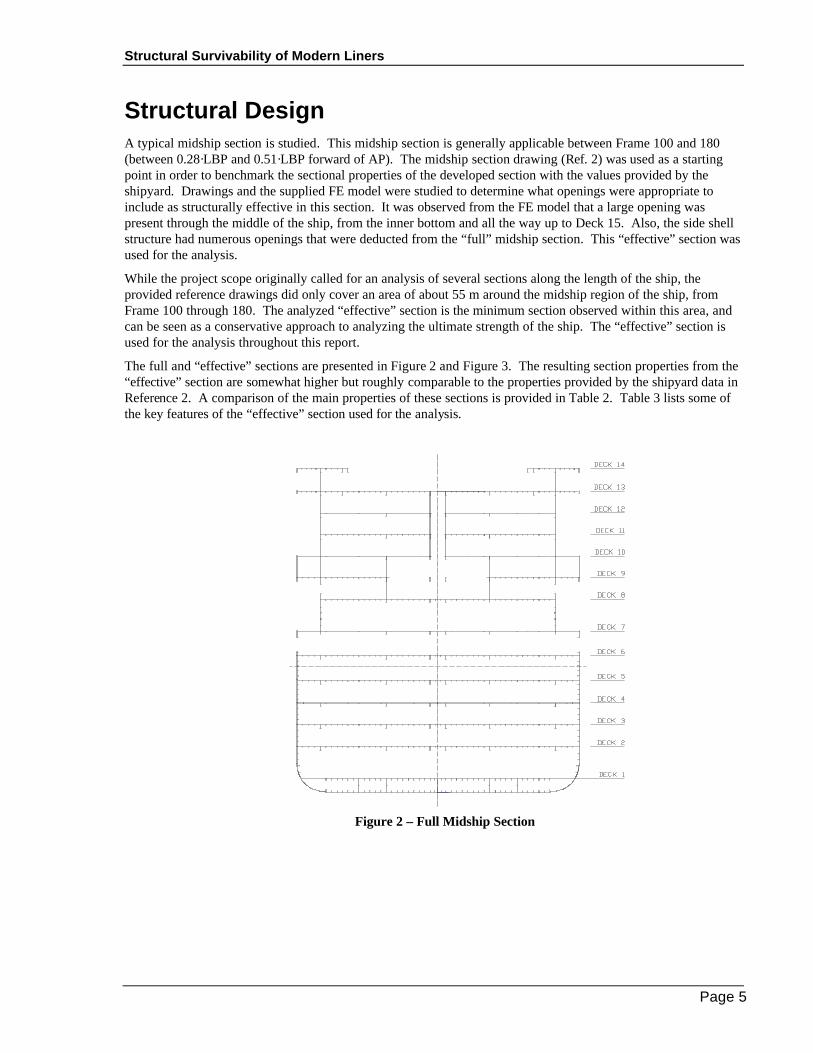
Structural Design A typical midship section is studied. This midship section is generally applicable between Frame 100 and 180 (between 0.28·LBP and 0.51·LBP forward of AP). The midship section drawing (Ref. 2) was used as a starting point in order to benchmark the sectional properties of the developed section with the values provided by the shipyard. Drawings and the supplied FE model were studied to determine what openings were appropriate to include as structurally effective in this section. It was observed from the FE model that a large opening was present through the middle of the ship, from the inner bottom and all the way up to Deck 15. Also, the side shell structure had numerous openings that were deducted from the “full” midship section. This “effective” section was used for the analysis.
While the project scope originally called for an analysis of several sections along the length of the ship, the provided reference drawings did only cover an area of about 55 m around the midship region of the ship, from Frame 100 through 180. The analyzed “effective” section is the minimum section observed within this area, and can be seen as a conservative approach to analyzing the ultimate strength of the ship. The “effective” section is used for the analysis throughout this report.
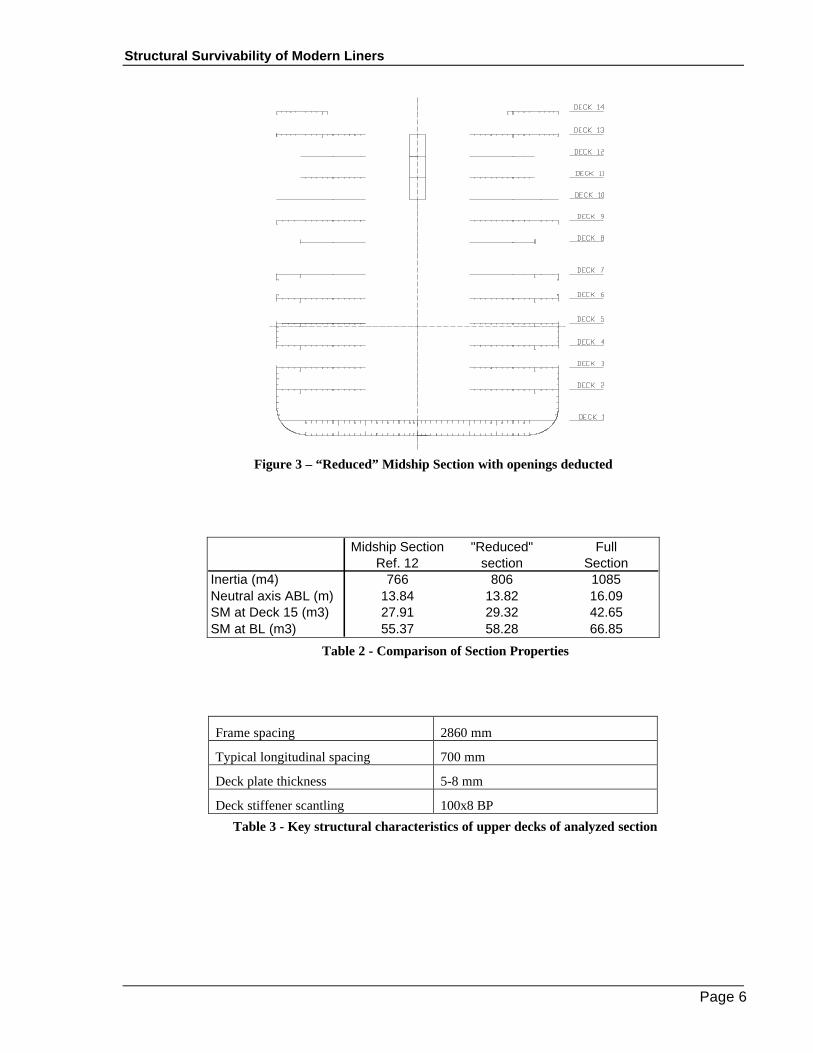
The full and “effective” sections are presented in Figure 2 and Figure 3. The resulting section properties from the “effective” section are somewhat higher but roughly comparable to the properties provided by the shipyard data in Reference 2. A comparison of the main properties of these sections is provided in Table 2. Table 3 lists some of the key features of the “effective” section used for the analysis.
Figure 2 – Full Midship Section
Structural Survivability of Modern Liners
Page 6
Figure 3 – “Reduced” Midship Section with openings deducted
Midship Section "Reduced" FullRef. 12 section Section
Inertia (m4) 766 806 1085Neutral axis ABL (m) 13.84 13.82 16.09SM at Deck 15 (m3) 27.91 29.32 42.65SM at BL (m3) 55.37 58.28 66.85
Table 2 - Comparison of Section Properties
Frame spacing 2860 mm
Typical longitudinal spacing 700 mm
Deck plate thickness 5-8 mm
Deck stiffener scantling 100x8 BP
Table 3 - Key structural characteristics of upper decks of analyzed section
Structural Survivability of Modern Liners
Page 7
4 Loads in Intact Conditions
Intact Loading Conditions (Still Water) Three sample intact loading conditions and three final stage flooding scenarios forming a matrix of 9 damage conditions are statically evaluated (in still water plus static hog and sag waves) to study a number of combinations of loading and damage scenarios.
The intact conditions were requested in the project scope and the first and second were directly recommended by SSC. The third intact condition was selected based on bending moment output for all the intact cases provided. The three intact conditions are:
1. Minimum Freeboard condition
2. Typical departure condition
3. Minimum still water hogging bending moment
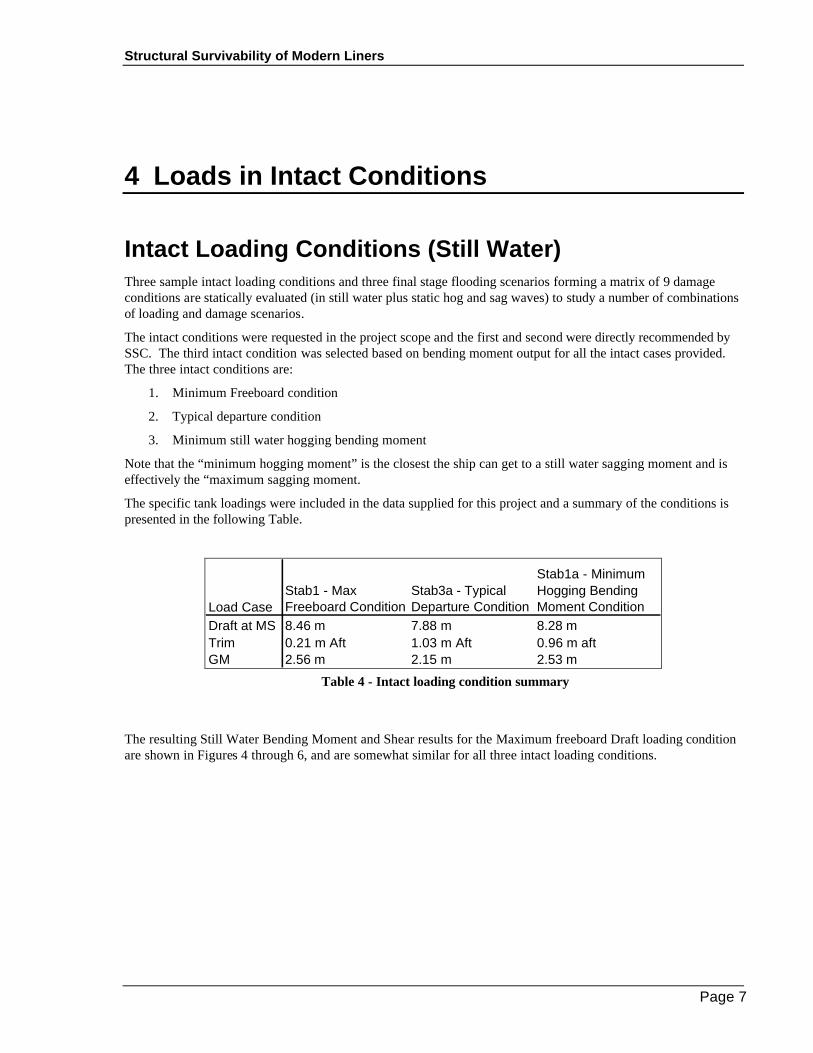
Note that the “minimum hogging moment” is the closest the ship can get to a still water sagging moment and is effectively the “maximum sagging moment.
The specific tank loadings were included in the data supplied for this project and a summary of the conditions is presented in the following Table.
Load CaseStab1 - Max Freeboard Condition
Stab3a - Typical Departure Condition
Stab1a - Minimum Hogging Bending Moment Condition
Draft at MS 8.46 m 7.88 m 8.28 mTrim 0.21 m Aft 1.03 m Aft 0.96 m aftGM 2.56 m 2.15 m 2.53 m
Table 4 - Intact loading condition summary
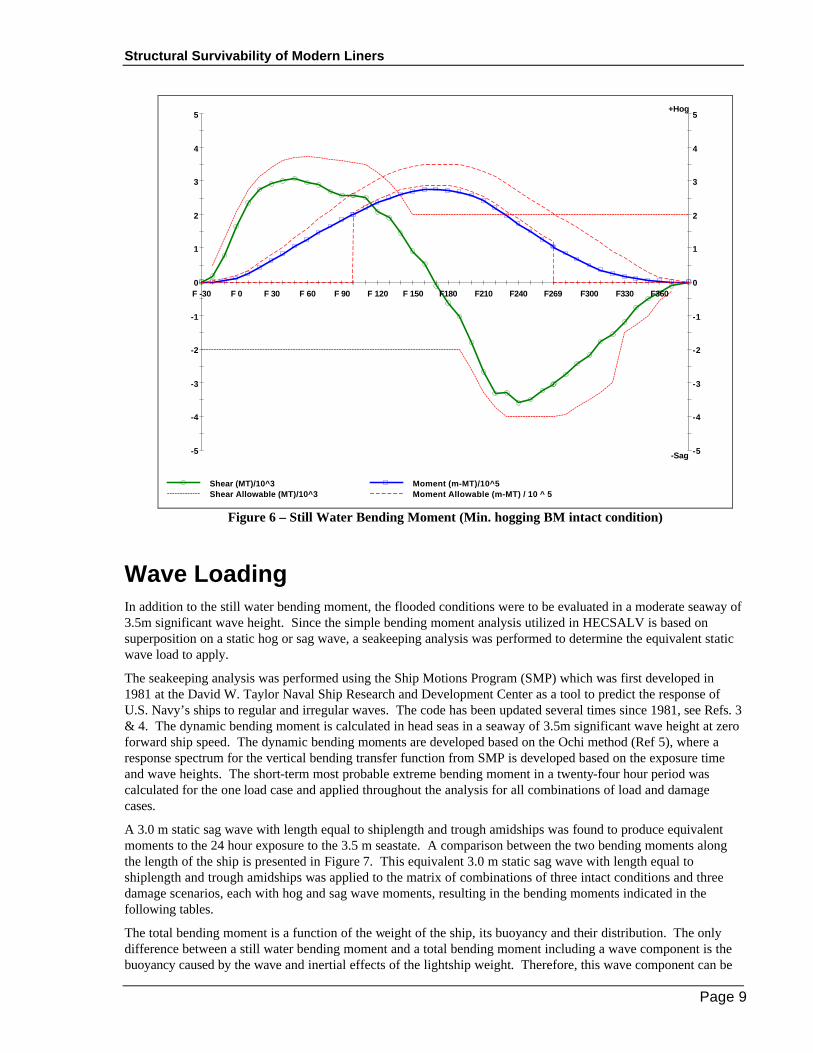
The resulting Still Water Bending Moment and Shear results for the Maximum freeboard Draft loading condition are shown in Figures 4 through 6, and are somewhat similar for all three intact loading conditions.

Structural Survivability of Modern Liners
Page 8
-5
-4
-3
-2
-1
0
1
2
3
4
5
F -30 F 0 F 30 F 60 F 90 F 120 F 150 F180 F210 F240 F269 F300 F330 F360
-5
-4
-3
-2
-1
0
1
2
3
4
5
Shear (MT)/10^3 Moment (m-MT)/10^5Shear Allowable (MT)/10^3 Moment Allowable (m-MT) / 10 ^ 5
+Hog
-Sag
Figure 4 – Still Water Bending Moment (Min. Freeboard intact condition)
-5
-4
-3
-2
-1
0
1
2
3
4
5
F -30 F 0 F 30 F 60 F 90 F 120 F 150 F180 F210 F240 F269 F300 F330 F360
-5
-4
-3
-2
-1
0
1
2
3
4
5
Shear (MT)/10^3 Moment (m-MT)/10^5Shear Allowable (MT)/10^3 Moment Allowable (m-MT) / 10 ^ 5
+Hog
-Sag
Figure 5 – Still Water Bending Moment (Typical departure intact condition)
Structural Survivability of Modern Liners
Page 9
-5
-4
-3
-2
-1
0
1
2
3
4
5
F -30 F 0 F 30 F 60 F 90 F 120 F 150 F180 F210 F240 F269 F300 F330 F360
-5
-4
-3
-2
-1
0
1
2
3
4
5
Shear (MT)/10^3 Moment (m-MT)/10^5Shear Allowable (MT)/10^3 Moment Allowable (m-MT) / 10 ^ 5
+Hog
-Sag
Figure 6 – Still Water Bending Moment (Min. hogging BM intact condition)
Wave Loading In addition to the still water bending moment, the flooded conditions were to be evaluated in a moderate seaway of 3.5m significant wave height. Since the simple bending moment analysis utilized in HECSALV is based on superposition on a static hog or sag wave, a seakeeping analysis was performed to determine the equivalent static wave load to apply.
The seakeeping analysis was performed using the Ship Motions Program (SMP) which was first developed in 1981 at the David W. Taylor Naval Ship Research and Development Center as a tool to predict the response of U.S. Navy’s ships to regular and irregular waves. The code has been updated several times since 1981, see Refs. 3 & 4. The dynamic bending moment is calculated in head seas in a seaway of 3.5m significant wave height at zero forward ship speed. The dynamic bending moments are developed based on the Ochi method (Ref 5), where a response spectrum for the vertical bending transfer function from SMP is developed based on the exposure time and wave heights. The short-term most probable extreme bending moment in a twenty-four hour period was calculated for the one load case and applied throughout the analysis for all combinations of load and damage cases.
A 3.0 m static sag wave with length equal to shiplength and trough amidships was found to produce equivalent moments to the 24 hour exposure to the 3.5 m seastate. A comparison between the two bending moments along the length of the ship is presented in Figure 7. This equivalent 3.0 m static sag wave with length equal to shiplength and trough amidships was applied to the matrix of combinations of three intact conditions and three damage scenarios, each with hog and sag wave moments, resulting in the bending moments indicated in the following tables.
The total bending moment is a function of the weight of the ship, its buoyancy and their distribution. The only difference between a still water bending moment and a total bending moment including a wave component is the buoyancy caused by the wave and inertial effects of the lightship weight. Therefore, this wave component can be

Structural Survivability of Modern Liners
Page 10
assumed to be relatively similar for all the checked conditions. Different drafts and different mass distributions from the intact cases might cause some small variation in the dynamic wave bending moments, but checks of the different cases indicate that this variance is negligible. Also, a heeled ship might cause some differences here, but SMP can only be run for an upright case.
The short-term most probable extreme shear force in a twenty-four hour period was also calculated with the same methodology as for the bending moment. These values are shown in Figure 8 below. Unlike for the bending moment, no single static wave will produce a curve similar to this calculated curve, so no further comparisons are made here.
20000
40000
60000
80000
100000
120000
-140 -120 -100 -80 -60 -40 -20 0 20 40 60 80 100 120 140
m-MS
POSSE 3.0m Wave Component 0.000 knots / 0.000 deg
Figure 7 - Dynamic Moment in a 3.5 m Seaway and the Equivalent Static Wave for 24 hours of exposure
0
400
800
1200
1600
2000
-140 -120 -100 -80 -60 -40 -20 0 20 40 60 80 100 120 140
Wave Shear Force
Figure 8 - Dynamic Shear Force (MT) in a 3.5 m Seaway for 24 hours of exposure

Structural Survivability of Modern Liners
Page 11
5 Loads in Flooded Conditions
Flooding Scenarios Three different flooding scenarios were considered for this report based on the damage scenarios described in Ref. 6 and the specifications in the project scope. These damage cases are the following:
1. Two-compartment high extent damage in the midship region
2. Four-compartment raking damage
3. Three-compartment damage in the midship region
Case 1 and 2 are cases specifically used in Ref. 6 and case 3 is the standard SOLAS damage extended longitudinally to 3 compartments. See Figure 13 for an illustration of the damage extents.
All these damage cases result in high sagging loads, which is the primary concern for a cruise ship with the low buckling capacity of the upper decks. While end damages can result in relatively high hogging loads, Reference 1 indicates that the hogging loads are still much lower than the ultimate capacity of the structure in hog.
While the damage extents describe what parts of the ship are damaged, the flooded areas are much larger due to progressive downflooding of compartments. These areas are therefore defined as flooded in HECSALV. The flooding extents are described in the following and the flooded compartments as defined in HECSALV are shown in Figure 9 through Figure 11.
High extent two-compartment damage This damage is defined in Ref. 6 and extends from Deck 2 (5.8 m ABL) to Deck 6 (17.4 m ABL). The damage extends 8 m longitudinally centered on the bulkhead at Frame 148. The longitudinal extent makes this a two-compartment damage. Although the lower vertical extent is at Deck 2 with the deck itself not damaged, the flooding scenario in Ref. 6 describes downflooding on Deck 1. The effective damage in HECSALV will then include flooding compartments between Deck 1 and 2.
Figure 9 - Flooded compartments for High extent two-compartment damage

Structural Survivability of Modern Liners
Page 12
Raking Four-Compartment Damage The four-compartment raking damage is a damage scenario that is expected to have a low probability of occurrence. The damage extends vertically 1 m around a base at 7.6 m above baseline and is on deck level 2 only. Longitudinally, the damage extends from aft of Frame 146 to fwd of Frame 198 with a total length of 36.6 m. Up- and downflooding points will effectively flood deck 1, 3 and 4 as well, so these compartments are also modeled as flooded in HECSALV.
Figure 10 - Flooded compartments for raking four-compartment damage
Three compartment damage This is the standard transverse and vertical damage extent as defined by SOLAS extended longitudinally to involve flooding of 3 compartments. It includes damage over three compartments in the longitudinal direction, extending over the full depth of the ship, and 20% of the beam. The inner bottom area would be damaged if it resulted in a more severe flooding and damage stability effects, but for this case it does not and the inner bottom area is therefore left intact.
Figure 11 - Flooded compartments for three-compartment damage
Structural Survivability of Modern Liners
Page 13
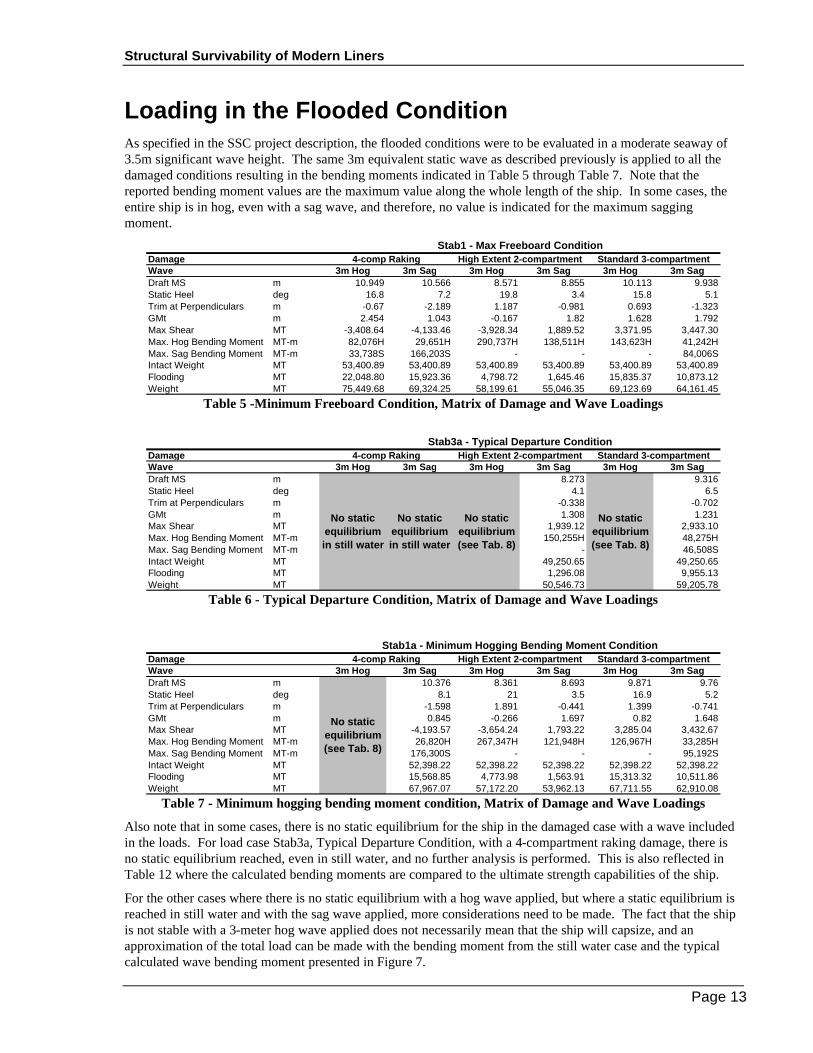
Loading in the Flooded Condition As specified in the SSC project description, the flooded conditions were to be evaluated in a moderate seaway of 3.5m significant wave height. The same 3m equivalent static wave as described previously is applied to all the damaged conditions resulting in the bending moments indicated in Table 5 through Table 7. Note that the reported bending moment values are the maximum value along the whole length of the ship. In some cases, the entire ship is in hog, even with a sag wave, and therefore, no value is indicated for the maximum sagging moment.
DamageWave 3m Hog 3m Sag 3m Hog 3m Sag 3m Hog 3m SagDraft MS m 10.949 10.566 8.571 8.855 10.113 9.938Static Heel deg 16.8 7.2 19.8 3.4 15.8 5.1Trim at Perpendiculars m -0.67 -2.189 1.187 -0.981 0.693 -1.323GMt m 2.454 1.043 -0.167 1.82 1.628 1.792Max Shear MT -3,408.64 -4,133.46 -3,928.34 1,889.52 3,371.95 3,447.30Max. Hog Bending Moment MT-m 82,076H 29,651H 290,737H 138,511H 143,623H 41,242HMax. Sag Bending Moment MT-m 33,738S 166,203S - - - 84,006SIntact Weight MT 53,400.89 53,400.89 53,400.89 53,400.89 53,400.89 53,400.89Flooding MT 22,048.80 15,923.36 4,798.72 1,645.46 15,835.37 10,873.12Weight MT 75,449.68 69,324.25 58,199.61 55,046.35 69,123.69 64,161.45
Standard 3-compartmentStab1 - Max Freeboard Condition
4-comp Raking High Extent 2-compartment
Table 5 -Minimum Freeboard Condition, Matrix of Damage and Wave Loadings
DamageWave 3m Hog 3m Sag 3m Hog 3m Sag 3m Hog 3m SagDraft MS m 8.273 9.316Static Heel deg 4.1 6.5Trim at Perpendiculars m -0.338 -0.702GMt m 1.308 1.231Max Shear MT 1,939.12 2,933.10Max. Hog Bending Moment MT-m 150,255H 48,275HMax. Sag Bending Moment MT-m - 46,508SIntact Weight MT 49,250.65 49,250.65Flooding MT 1,296.08 9,955.13Weight MT 50,546.73 59,205.78
No static equilibrium in still water
4-comp Raking High Extent 2-compartment Standard 3-compartment
No static equilibrium in still water
No static equilibrium (see Tab. 8)
No static equilibrium (see Tab. 8)
Stab3a - Typical Departure Condition
Table 6 - Typical Departure Condition, Matrix of Damage and Wave Loadings
DamageWave 3m Hog 3m Sag 3m Hog 3m Sag 3m Hog 3m SagDraft MS m 10.376 8.361 8.693 9.871 9.76Static Heel deg 8.1 21 3.5 16.9 5.2Trim at Perpendiculars m -1.598 1.891 -0.441 1.399 -0.741GMt m 0.845 -0.266 1.697 0.82 1.648Max Shear MT -4,193.57 -3,654.24 1,793.22 3,285.04 3,432.67Max. Hog Bending Moment MT-m 26,820H 267,347H 121,948H 126,967H 33,285HMax. Sag Bending Moment MT-m 176,300S - - - 95,192SIntact Weight MT 52,398.22 52,398.22 52,398.22 52,398.22 52,398.22Flooding MT 15,568.85 4,773.98 1,563.91 15,313.32 10,511.86Weight MT 67,967.07 57,172.20 53,962.13 67,711.55 62,910.08
No static equilibrium (see Tab. 8)
4-comp Raking High Extent 2-compartment Standard 3-compartmentStab1a - Minimum Hogging Bending Moment Condition
Table 7 - Minimum hogging bending moment condition, Matrix of Damage and Wave Loadings
Also note that in some cases, there is no static equilibrium for the ship in the damaged case with a wave included in the loads. For load case Stab3a, Typical Departure Condition, with a 4-compartment raking damage, there is no static equilibrium reached, even in still water, and no further analysis is performed. This is also reflected in Table 12 where the calculated bending moments are compared to the ultimate strength capabilities of the ship.
For the other cases where there is no static equilibrium with a hog wave applied, but where a static equilibrium is reached in still water and with the sag wave applied, more considerations need to be made. The fact that the ship is not stable with a 3-meter hog wave applied does not necessarily mean that the ship will capsize, and an approximation of the total load can be made with the bending moment from the still water case and the typical calculated wave bending moment presented in Figure 7.
Structural Survivability of Modern Liners
Page 14
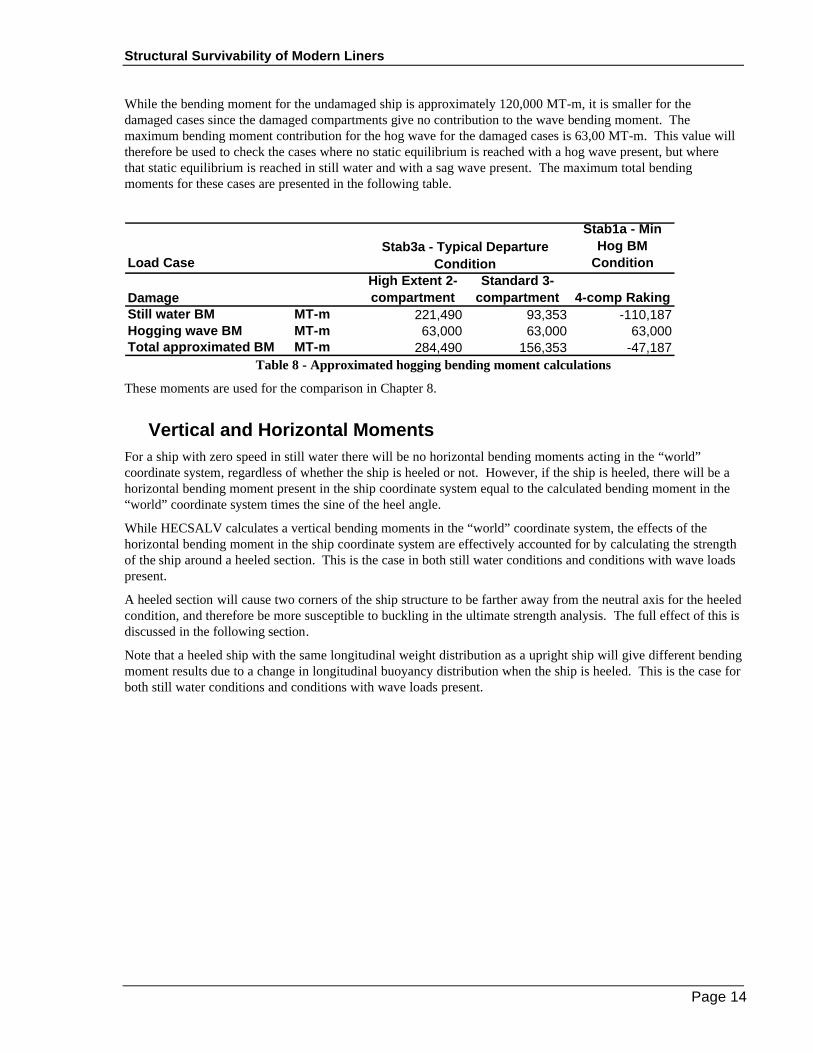
While the bending moment for the undamaged ship is approximately 120,000 MT-m, it is smaller for the damaged cases since the damaged compartments give no contribution to the wave bending moment. The maximum bending moment contribution for the hog wave for the damaged cases is 63,00 MT-m. This value will therefore be used to check the cases where no static equilibrium is reached with a hog wave present, but where that static equilibrium is reached in still water and with a sag wave present. The maximum total bending moments for these cases are presented in the following table.
Load Case
Stab1a - Min Hog BM
Condition
DamageHigh Extent 2-compartment
Standard 3-compartment 4-comp Raking
Still water BM MT-m 221,490 93,353 -110,187Hogging wave BM MT-m 63,000 63,000 63,000Total approximated BM MT-m 284,490 156,353 -47,187
Stab3a - Typical Departure Condition
Table 8 - Approximated hogging bending moment calculations
These moments are used for the comparison in Chapter 8.
Vertical and Horizontal Moments For a ship with zero speed in still water there will be no horizontal bending moments acting in the “world” coordinate system, regardless of whether the ship is heeled or not. However, if the ship is heeled, there will be a horizontal bending moment present in the ship coordinate system equal to the calculated bending moment in the “world” coordinate system times the sine of the heel angle.
While HECSALV calculates a vertical bending moments in the “world” coordinate system, the effects of the horizontal bending moment in the ship coordinate system are effectively accounted for by calculating the strength of the ship around a heeled section. This is the case in both still water conditions and conditions with wave loads present.
A heeled section will cause two corners of the ship structure to be farther away from the neutral axis for the heeled condition, and therefore be more susceptible to buckling in the ultimate strength analysis. The full effect of this is discussed in the following section.
Note that a heeled ship with the same longitudinal weight distribution as a upright ship will give different bending moment results due to a change in longitudinal buoyancy distribution when the ship is heeled. This is the case for both still water conditions and conditions with wave loads present.

Structural Survivability of Modern Liners
Page 15
6 Ultimate Strength Analysis
Methodology Ultimate strength was evaluated using the program ULTSTR. ULTSTR is a U.S. Navy developed program which evaluates the ultimate collapse strength and failure characteristics of ship structural sections. The components it uses to describe a structure are stiffened panels (gross panels) and hard corners. It provides a more sophisticated treatment of section failure than the simple correction factor applied to yield strength that is often used. Yielding, rupture (in tension), Euler beam-column buckling, and stiffener tripping are explicitly accounted for. Details of the analysis and file formats may be found in Refs. 7 and 8. The program also has the capabilities of analyzing a heeled section, and the final results incorporate an analysis of the sections at the flooded heel angle.
The ULTSTR Translator, which is incorporated as part of HECSALV, provides a means to perform ultimate strength analysis on structural sections defined in the HEC Section Modulus Editor. A model constructed with the Section Modulus Editor consists of a large number of independent parts. Stiffeners may be located next to plates, for instance, but no actual stiffened-plate relationship is described. Section Modulus models do not typically consist of components broken down into a form amenable to analysis by ULTSTR. The purpose of the translator is to determine the relationships between the structural pieces defined in the Section Modulus model, and to assemble them into the type of structural building blocks understood by ULTSTR.
The principal result of a typical analysis is the maximum moment which may be safely imposed upon the section. Details are also provided on the specific order of failure of structural elements and the failure mode they experienced.
All analysis is done on the “reduced” section as described in Chapter 3 of this report.
Intact Structure The results of the analysis of the ultimate strength of the intact structure are presented in Figure 12 in the typical moment-curvature format. As expected, the curve is highly asymmetric, with the reduced moments in the sag direction reflecting the low buckling resistance of the structure of the higher decks.
The ultimate capacity of the structure in Hog is about 920,000 T-m. This point reflects the instant where all the bottom panels reach their tripping buckling capacity and collapse.
The ultimate capacity of the structure in Sag is about 360,000 T-m. This is the point where the upper superstructure starts collapsing, and it occurs well before any yielding is present in the structure, at approximately 34% of the upper flange yield point.
Also included in the figure are curves of the ultimate strength of the intact structure at different heel angles. The capacity of the structure is reduced with increased heel angles, but not dramatically. A 15 degree heel angle resulted in a reduced capacity of about 12% in Hog and 10% in Sag.
Also worth noting is that the ultimate strength curve is a little bit flatter at the failure point as a result of the fact that in the heeled condition the decks are at an angle compared to the bending plane of the structure and do not collapse simultaneously.

Structural Survivability of Modern Liners
Page 16
-6.00E+05
-4.00E+05
-2.00E+05
0.00E+00
2.00E+05
4.00E+05
6.00E+05
8.00E+05
1.00E+06
-1.00E-04 -5.00E-05 0.00E+00 5.00E-05 1.00E-04 1.50E-04
Curvature (1/m)
Mo
men
t (m
-MT
)
Even keel 5 degrees heel 10 degrees heel 15 degrees heel
Figure 12 - Ultimate strengths of intact section at different heel angles
Damaged Structure The analysis of the damaged structure consists of two parts in order to properly capture the envelope of the loading changing from an upright ship to a ship in a heeled position. The ultimate strength of the damaged section is calculated in both the upright condition and in the heeled condition as described in Table 9. The ultimate strength is then compared to the total bending moment for the undamaged ship in the upright condition, and to the total bending moment for the damaged, heeled ship in the heeled condition.
High-extent 2-compartment 4-compartment raking 3-compartment
Figure 13 - Damage Extents

Structural Survivability of Modern Liners
Page 17
The results of the analysis for the upright condition of the damaged structure as presented in Figure 13, are presented in Figure 14. The 4-compartment raking damage is omitted from the analysis since the effective structural damage is very small. It is worth noting that the structural damage from the 2-compartment case also has very little influence on the calculated ultimate moment. The more significant structural damage in the 3-compartment case results in a significant reduction of the calculated ultimate moment.
-6.00E+05
-4.00E+05
-2.00E+05
0.00E+00
2.00E+05
4.00E+05
6.00E+05
8.00E+05
1.00E+06
-1.00E-04 -5.00E-05 0.00E+00 5.00E-05 1.00E-04 1.50E-04 2.00E-04
Curvature (1/m)M
om
ent (
m-M
T)
Intact 2-compartment damage 3-compartment damage
Figure 14 - Ultimate strengths of damaged structure in upright condition
The results of the analysis of the same damaged structure for the maximum draft loading condition are presented in Figure 15. The different combinations of load and damage cases are analyzed at the equilibrium heel angles in still water as reported in HECSALV (see Table 9). The same tendencies as for the intact section are repeated here where the heel angle represents relatively small differences in the ultimate strength of the structure. Small damages at the lower parts of the hull structure also have little impact of the ultimate strength of the structure, whereas larger damage definitions where parts of the upper decks are damaged result in a significant reduction of the ultimate strength.
Equilibrium Heel Angles in Still Water
4-comp raking
High-extent 2-comp
Standard 3-comp
10.3 10
Stab3a - Typical Departure Condition - 14.9 16.1
Stab1 - Max Freeboard Condition 11.5
Stab1a - Minimum Hogging Bending Moment Condition 13.4 10.9 10.4
Table 9 - Heel Angles

Structural Survivability of Modern Liners
Page 18
-6.00E+05
-4.00E+05
-2.00E+05
0.00E+00
2.00E+05
4.00E+05
6.00E+05
8.00E+05
1.00E+06
-1.00E-04 -5.00E-05 0.00E+00 5.00E-05 1.00E-04 1.50E-04Curvature (1/m)
Mo
men
t (m
-MT
)
2-comp 3-comp 4-comp Intact-Even keel Intact - 15 degrees heel
Figure 15 - Ultimate strengths of damaged structure in Max Freeboard Draft Condition
Effects of Damage Extents While the previous chapter describes the ultimate strength for the damaged structure with effective structural damage extents equal to the damage assumed for the flooding, several factors might influence the effectiveness of the remaining structure. Damage to transverse structure can cause the remaining part of a damaged deck to have reduced effectiveness, or no effectiveness at all. One can easily imagine that damage to the transverse structure of a deck will result in double the effective length of the remaining stiffeners on the deck.
A study was therefore done on the effects of transverse damage extents and effectiveness of remaining deck structure on the 2-compartment and 3-compartment damages described earlier. The following cases are studied:
1. Damage of the side shell only (standard damage for the 2-compartment case)
2. Damage of the side shell with double effective length on the part of the decks outboard of the longitudinal girders on the damaged side to account for damaged transverse structure
3. Damage into longitudinal girders on damaged decks
4. Damage into longitudinal girders with double effective length on the rest of the decks on the damaged side to account for damaged transverse structure
5. Damage to include all of the damaged decks
In addition, the standard transverse damage extent for the 3-compartment case (20% of beam) was included in the analysis. All cases were run with no heel. The ultimate moments from these studies are presented in the following table.

Structural Survivability of Modern Liners
Page 19
Damage Extent
Hog Ultimate Moment
Sag Ultimate Moment
Damage Extent
Hog Ultimate Moment
Sag Ultimate Moment
1 918,000 360,000 1 906,000 360,0002 914,000 360,000 2 901,000 333,0003 914,000 359,000 3 856,000 325,0004 911,000 357,000 4 845,000 237,0005 907,000 357,000 5 665,000 231,000
20% of B 744,000 263,000
High extent 2-comp SOLAS 3-comp
Table 10 –Ultimate Moment Capabilities for varying damage extents
For the high-extent 2-compartment damage case, all the damaged structure is relatively close to the neutral axis of the analyzed section, so the changing transverse damage extents has little impact on the ultimate moment, in the order of maximum 1%.
The SOLAS 3-compartment damage case shows different results since the vertical damage extent extends all the way from the inner bottom and through the full height of the ship. An interesting effect is observed, where the big steps in ultimate moment happens at different combinations of damage/double effective stiffener length. For instance, between Damage Extent 1 and 2, there is little change in the hog ultimate moment since most of the decks are in tension. No structure is removed between these two cases, but the part of the decks outboard of the outboard longitudinal girders has an effective buckling length of double the normal web frame spacing. In the sag case most of these decks are in compression and there is a much more significant drop in ultimate moment.
The drop in ultimate moment in the hog case first happens when these parts of the decks are completely removed from the structure, as is the case for Damage extent 3. Note that doubling the effective length of certain parts of the decks are almost identical to removing the structure from the analyzed section for the sag case. This can be seen from the relatively small drop in ultimate moment in sag from Damage Extent 2 to Damage Extent 3.
Completely removing the decks on one side of the structure, with bottom and inner bottom intact, reduces the ultimate moment in both hog and sag by approximately 27%.

Structural Survivability of Modern Liners
Page 20
7 Additional Contributing Local Factors
One of the purposes of this report is to comment on the effects of some local factors to the ultimate strength of the ship. Several factors are investigated qualitatively and they are presented in the following.
Lateral pressure loads Lateral pressure loads are usually not a factor in buckling of stiffeners in the longitudinal direction. The reason for this is that for most of the time, buckling of the stiffener will happen with deflections to alternating sides between the web frames, and the pressure will then alternate between constricting and aiding the buckling of the stiffener. For large lateral pressure loads a different buckling mode might occur (see the chapter End Connections below), and both these buckling modes are checked in ULTSTR. Also, typically for this ship the critical components which govern the ultimate strength in the sagging condition are the upper decks which are not subject to pressure loads.
Initial deflections The effect of initial deflections on the buckling and ultimate strength of stiffeners and plating is a very complex problem to assess. Initial deflections can in fact both increase and reduce the buckling strength of structural members, all based on what shape the initial deflection has. A shape similar to the buckling mode of the structural member will reduce the buckling strength, while an initial deflection shape different than the buckling mode can increase the buckling strength. This is studied in detail in Ref. 9. For design purposes, a somewhat pessimistic assumption can be made with an initial deflection shape similar to the most common buckling mode of the structure.
Note that the reduction in ultimate strength of a plate based on an initial deflection shape is dependent on the so-called slenderness ratio of the plate, with more reduction of ultimate strength for more “slender plates”. With the thin plating seen in the superstructure of passenger ships, this reduction can possibly be substantial.
Note that the ULTSTR program used for this analysis does not consider plate buckling a separate failure mode, but rather utilizes the reduced effective width of plating when stiffeners are buckling to account for plate buckling. For this analysis, the default initial deflections are assumed in ULTSTR with moderate to high distortions as defined in Faulkner’s Expression. More details on how this is handled in ULTSTR can be found in Ref. 8.
Welding induced residual stress In a ship structure, welding induced residual stresses will always be present. For a plate panel between stiffeners, parts of the plate will be in compression and parts of the plate will be in tension. A study on the effect of this was done in Ref. 9. It is noted that these residual stresses can significantly reduce the ultimate strength capacity of plate panels, but the magnitude of this reduction depends on several factors. First, the level of residual stresses will affect the reduction, but it is also noted that the reduction also depends on the assumed shape of the initial deflection of the plate panel.
ULTSTR has the possibility of defining residual stresses in two different ways; either by defining the residual compressive stress in the center of a plate panel as a factor of the yield stress, or by defining the extents of the tensile yield zone close to the stiffener as a multiplier of the plate thickness. For this analysis, the second option is used, with a tensile yield zone extent of 3 times the plate thickness on either side of the stiffener. The ULTSTR manual indicates that realistic values for the tensile yield zone can be in the range of 3 to 4.5 times the plate
Structural Survivability of Modern Liners
Page 21
thickness. A run with this value set to 5 gave about a 5% reduction in ultimate strength in sag, which is the loading condition of most interest here.
End Connections The end connections of the stiffeners of the longitudinal structure can serve several purposes for the strength of the structure. First, any kind of flat bar or bracket will reduce the effective length of the stiffener and thus increase the buckling capacity of the stiffener. The effectiveness of any triangular or radiused brackets depends on the bracket size relative to the stiffener size; a small bracket with a large stiffener will have little or no effect and vice versa.
Secondly, any brackets or flat bars will help transfer shear load into the web plating at the ends of the stiffener. With no brackets or flat bars at the ends, this entire load will have to be transferred through the weld between the stiffener and the web plate. This is not specifically considered in this study.
Thirdly, any soft toes of the brackets will increase the fatigue life of the stiffener end connection. In an ultimate strength analysis this will have no effect on the results.
In addition to all this, the assumptions on whether the stiffener ends are considered fixed or pinned will have a great impact on the buckling strength. In fact, the behavior of the stiffener and the end connections is dependent on what kinds of loads are present. The most common buckling mode would be with the stiffener buckling to alternate sides between the web frames. The stiffener will then behave as if it were pinned at the ends, and this is the normal assumption for stiffener buckling calculations. Another possibility is that the stiffener always buckles to one side with effective clamped end connections. This failure mode is more of a plastic strength limitation than a buckling strength limitation and would probably not happen unless there is a large pressure head on one side of the plating. In any case ULTSTR checks both these failure modes.
Shear Forces For a ship in an even keel intact condition, the shear forces will be vertical with most of these being resisted by the vertical plating of the ship such as side shell and longitudinal bulkheads. For passenger vessels, damage to the ship structure tends to increase these shear forces when compartments are flooded, and with damage to the structure, the shear capacity of the structure can also be reduced, with increased shear stresses in the remaining parts of the structure. This can lead to reduced buckling capacity of the plating of the side shell and longitudinal bulkheads if an interaction formula is used for calculating this. Although the plating might buckle earlier than if the structure was intact, two factors greatly reduce the importance of this effect.
First, the side shell and longitudinal bulkheads which are highly loaded in shear are not a major component of the bending strength of the hull structure. Therefore, buckling of parts of the side shell will not significantly reduce the overall bending strength of the hull structure. Also, the distribution of shear stresses is such that the highest shear stresses will be seen close to the neutral axis of the ship where the buckling stresses are low.
Secondly, plate buckling is not accounted for directly in ULTSTR. Buckling of single plate panels between stiffeners does not necessarily mean that the surrounding structure will fail, but it will reduce the buckling stiffness of attached stiffeners. This reduced effective width is accounted for in ULTSTR and therefore, plate buckling is incorporated in the evaluation of the ultimate strength of the structure.
A quick estimate of the whether the shear capacity of the hull is exceeded in any of the damaged cases studied here can be done by doing some simple but reasonable assumptions. The allowable positive still water shear force is approximately 3700 MT, and the ABS calculated positive wave shear force is approximately 3500 MT. It should therefore be safe to assume that the ship is designed to be able to take a total shear force of 7200 MT. The damage case mostly affecting the shear capacity of the structure, the SOLAS 3-compartment damage, has a reported worst shear force of 3500 MT, including the wave component from the assumed 3 meter wave. If a somewhat pessimistic assumption is made where only half the shear area is left after damage, the capacity could be approximately 3600 MT, and still higher than the reported shear force. This generally indicates that the shear

Structural Survivability of Modern Liners
Page 22
capacity of the ship is adequate, even after damage and flooding. More studies could be done where shear forces and capacities were studied in more detail along the length of the ship to obtain more accurate results.
Structural Survivability of Modern Liners
Page 23
8 Results – Loads vs. capabilities
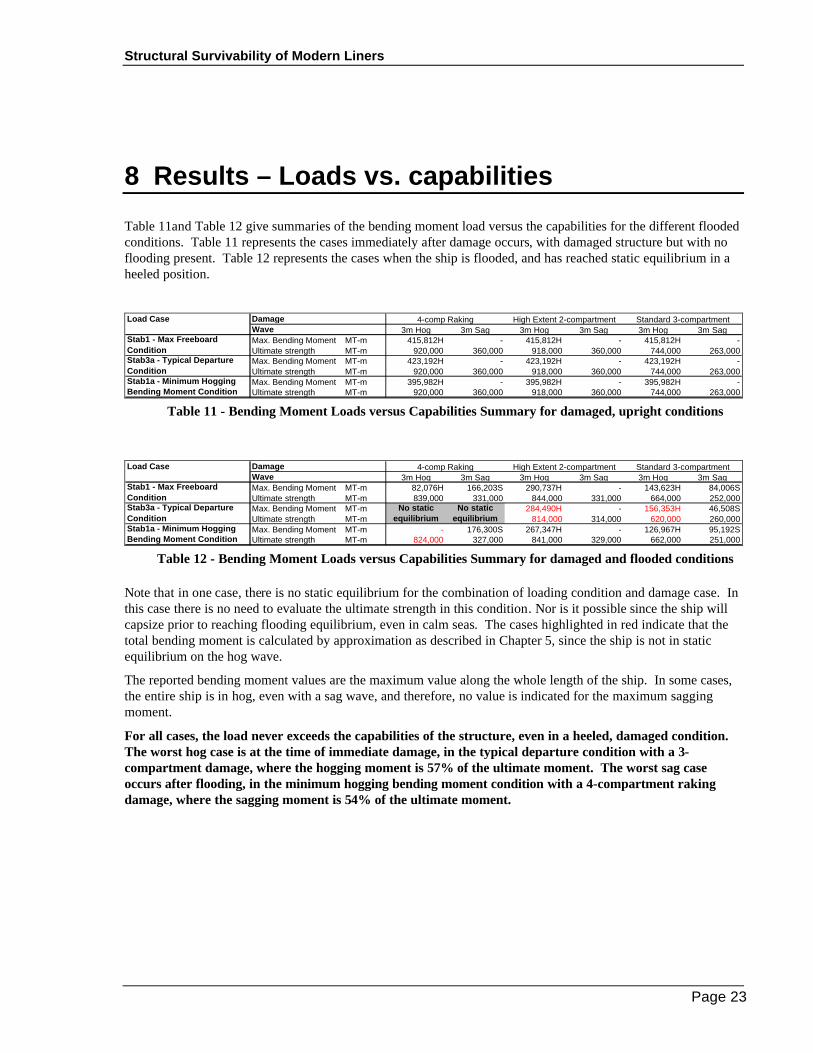
Table 11and Table 12 give summaries of the bending moment load versus the capabilities for the different flooded conditions. Table 11 represents the cases immediately after damage occurs, with damaged structure but with no flooding present. Table 12 represents the cases when the ship is flooded, and has reached static equilibrium in a heeled position.
Load Case Damage
Wave 3m Hog 3m Sag 3m Hog 3m Sag 3m Hog 3m SagMax. Bending Moment MT-m 415,812H - 415,812H - 415,812H -Ultimate strength MT-m 920,000 360,000 918,000 360,000 744,000 263,000Max. Bending Moment MT-m 423,192H - 423,192H - 423,192H -Ultimate strength MT-m 920,000 360,000 918,000 360,000 744,000 263,000Max. Bending Moment MT-m 395,982H - 395,982H - 395,982H -Ultimate strength MT-m 920,000 360,000 918,000 360,000 744,000 263,000
Stab1a - Minimum Hogging Bending Moment Condition
Stab3a - Typical Departure Condition
4-comp Raking High Extent 2-compartment Standard 3-compartment
Stab1 - Max Freeboard Condition
Table 11 - Bending Moment Loads versus Capabilities Summary for damaged, upright conditions
Load Case Damage
Wave 3m Hog 3m Sag 3m Hog 3m Sag 3m Hog 3m SagMax. Bending Moment MT-m 82,076H 166,203S 290,737H - 143,623H 84,006SUltimate strength MT-m 839,000 331,000 844,000 331,000 664,000 252,000Max. Bending Moment MT-m 284,490H - 156,353H 46,508SUltimate strength MT-m 814,000 314,000 620,000 260,000Max. Bending Moment MT-m - 176,300S 267,347H - 126,967H 95,192SUltimate strength MT-m 824,000 327,000 841,000 329,000 662,000 251,000
No static equilibrium
No static equilibrium
Standard 3-compartment4-comp Raking High Extent 2-compartment
Stab1 - Max Freeboard ConditionStab3a - Typical Departure ConditionStab1a - Minimum Hogging Bending Moment Condition
Table 12 - Bending Moment Loads versus Capabilities Summary for damaged and flooded conditions
Note that in one case, there is no static equilibrium for the combination of loading condition and damage case. In this case there is no need to evaluate the ultimate strength in this condition. Nor is it possible since the ship will capsize prior to reaching flooding equilibrium, even in calm seas. The cases highlighted in red indicate that the total bending moment is calculated by approximation as described in Chapter 5, since the ship is not in static equilibrium on the hog wave.
The reported bending moment values are the maximum value along the whole length of the ship. In some cases, the entire ship is in hog, even with a sag wave, and therefore, no value is indicated for the maximum sagging moment.
For all cases, the load never exceeds the capabilities of the structure, even in a heeled, damaged condition. The worst hog case is at the time of immediate damage, in the typical departure condition with a 3-compartment damage, where the hogging moment is 57% of the ultimate moment. The worst sag case occurs after flooding, in the minimum hogging bending moment condition with a 4-compartment raking damage, where the sagging moment is 54% of the ultimate moment.

Structural Survivability of Modern Liners
Page 24
9 Discussion of Results
This study demonstrates that the structural capabilities of a large modern passenger liner can generally withstand the loading of a heeled, damaged ship in a moderate seaway.
A matrix of three loading conditions and three damage scenarios is studied, and except for the cases where the ship does not survive from a flooding or stability standpoint, the total bending moments are well within the structural capabilities, even for the physically damaged structure. It should be noted that when the heeled, damaged ship is subject to head seas, the heel angle will vary with the wave position if asymmetrically flooded, and due to variation in wave direction in short-crested seas. All the analysis here is done at the static heel angle. The minimum reported ultimate strength in Sag, including both physical damage and heel, is approximately 250,000 MT-m. The highest combined total dynamic sagging bending moment is approximately 166,000MT-m or 67% of the ships ultimate strength capability. The minimum reported ultimate strength in Hog, including both physical damage and heel, is approximately 620,000 MT-m. The highest combined total dynamic hogging bending moment is approximately 290,000MT-m or 47% of the ships ultimate strength capability.
Additional factors such as lateral pressure, initial deflections, weld induced residual stresses, end connections and shear forces are commented on and can all reduce the ultimate strength of the hull structure to a limited extent. However, it is not likely that these additional factors will affect the overall capability of the hull structure to withstand the anticipated loads.
Structural Survivability of Modern Liners
Page 25
10 References
1. Structural Survivability of a Modern Passenger Ship, SSC Project SR-1439, HEC Doc. No. 2003-24-01, August 4, 2003
2. Principal Cross Section, Drawing, File Date March 4, 2004 3. “Users Manual for the Standard Ship Motion Program, SMP”, W. G. Meyers, T. R.
Applebee, and A.E. Baitis, David W. Taylor Naval Ship Research and Development Center, Ship Performance Department, September 1981, DTNSRDC/SPD-0936-01.
4. “SMP84: Improvements to Capability and Prediction Accuracy of the Standard Ship Motion Program SMP81”, William G. Meyers and A. Erich Baitis, David W. Taylor Naval Ship Research and Development Center, Ship Performance Department, September 1985, DTNSRDC/SPD-0936-04.
5. “Wave Statistics for the Design of Ships and Ocean Structures”, SNAME Transactions, Vol. 86, 1978, by M. K. Ochi.
6. Large Passenger Ship Safety, Time-to-flood simulations for a large passenger ship – initial study, June 5, 2003
7. Adamchak, John C., An Approximate Method For Estimating the Collapse of a Ship’s Hull in Preliminary Design, SNAME Proceedings, Extreme Load Symposium, 1984.
8. Adamchak, John C., ULTSTR(1996): The Revised Program for Estimating the Collapse of Ship Hulls or Hull Components Under Longitudinal Bending or Axial Compression.
9. Effect of Initial Deflection Shape on the Ultimate Strength Behavior of Welded Steel Plates Under Biaxial Compressive Loads, Journal of Ship Research, Vol. 48, No. 1, March 2004
10. HARDER WP3, “Wave Height Distributions According to Damage Statistics”, Report 3-00-W-2001-01-0, November 29, 2001.
11. SLF 45/3/5. “Investigations and proposed formulations for the factors “p”, “r”, and “v”; the probability of damage to a particular compartment or compartments, Report for the research project HARDER”, 19 April 2002.
12. Paik, Wang, Kim, and Thayanballi, “Ultimate Limit State Design of Ship Hulls” SNAME Transactions, 2002.
Structural Survivability of Modern Liners
Page 26
Appendix A - Load Condition Details
Structural Survivability of Modern Liners
Page 27
-5
-4
-3
-2
-1
0
1
2
3
4
5
F -30 F 0 F 30 F 60 F 90 F 120 F 150 F180 F210 F240 F269 F300 F330 F360
-5
-4
-3
-2
-1
0
1
2
3
4
5
Shear and Moment
Shear (MT)/10^3 Moment (m-MT)/10^5Shear Allowable (MT)/10^3 Moment Allowable (m-MT) / 10 ^ 5
+Hog
-Sag
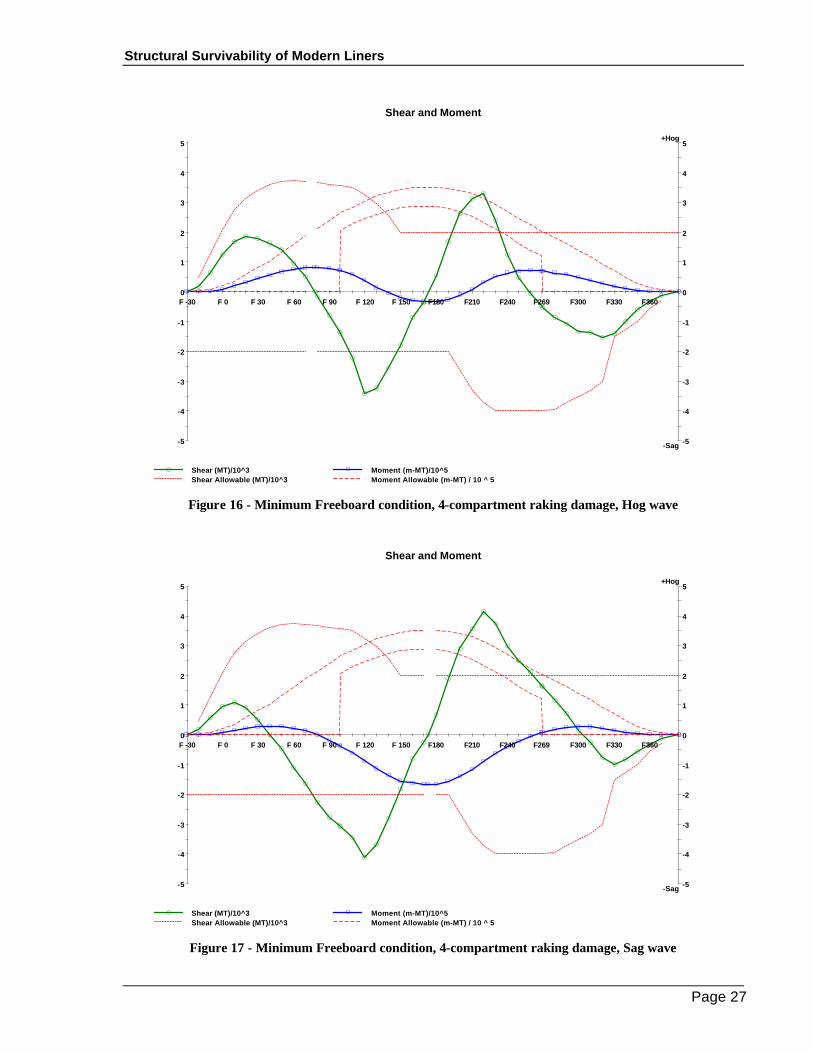
Figure 16 - Minimum Freeboard condition, 4-compartment raking damage, Hog wave
-5
-4
-3
-2
-1
0
1
2
3
4
5
F -30 F 0 F 30 F 60 F 90 F 120 F 150 F180 F210 F240 F269 F300 F330 F360
-5
-4
-3
-2
-1
0
1
2
3
4
5
Shear and Moment
Shear (MT)/10^3 Moment (m-MT)/10^5Shear Allowable (MT)/10^3 Moment Allowable (m-MT) / 10 ^ 5
+Hog
-Sag
Figure 17 - Minimum Freeboard condition, 4-compartment raking damage, Sag wave

Structural Survivability of Modern Liners
Page 28
-5
-4
-3
-2
-1
0
1
2
3
4
5
F -30 F 0 F 30 F 60 F 90 F 120 F 150 F180 F210 F240 F269 F300 F330 F360
-5
-4
-3
-2
-1
0
1
2
3
4
5
Shear and Moment
Shear (MT)/10^3 Moment (m-MT)/10^5Shear Allowable (MT)/10^3 Moment Allowable (m-MT) / 10 ^ 5
+Hog
-Sag
Figure 18 - Minimum Freeboard condition, 2-compartment damage, Hog wave
-5
-4
-3
-2
-1
0
1
2
3
4
5
F -30 F 0 F 30 F 60 F 90 F 120 F 150 F180 F210 F240 F269 F300 F330 F360
-5
-4
-3
-2
-1
0
1
2
3
4
5
Shear and Moment
Shear (MT)/10^3 Moment (m-MT)/10^5Shear Allowable (MT)/10^3 Moment Allowable (m-MT) / 10 ^ 5
+Hog
-Sag
Figure 19 - Minimum Freeboard condition, 2-compartment damage, Sag wave
Structural Survivability of Modern Liners
Page 29
-5
-4
-3
-2
-1
0
1
2
3
4
5
F -30 F 0 F 30 F 60 F 90 F 120 F 150 F180 F210 F240 F269 F300 F330 F360
-5
-4
-3
-2
-1
0
1
2
3
4
5
Shear and Moment
Shear (MT)/10^3 Moment (m-MT)/10^5Shear Allowable (MT)/10^3 Moment Allowable (m-MT) / 10 ^ 5
+Hog
-Sag
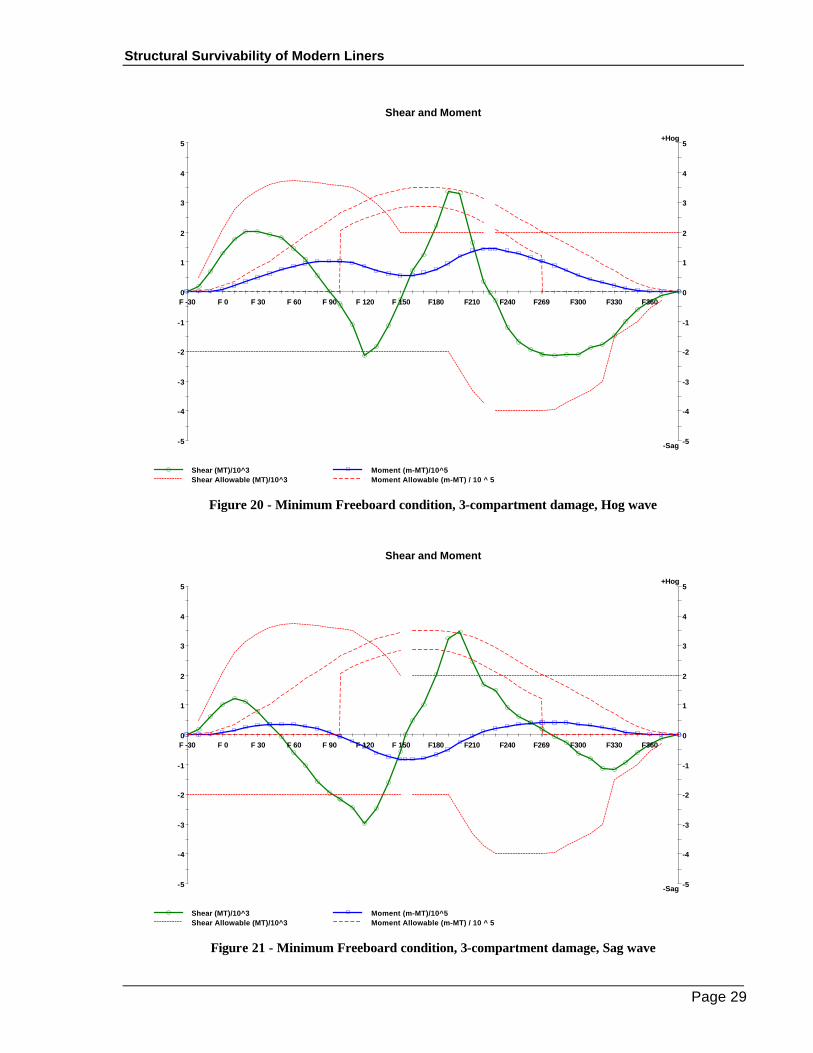
Figure 20 - Minimum Freeboard condition, 3-compartment damage, Hog wave
-5
-4
-3
-2
-1
0
1
2
3
4
5
F -30 F 0 F 30 F 60 F 90 F 120 F 150 F180 F210 F240 F269 F300 F330 F360
-5
-4
-3
-2
-1
0
1
2
3
4
5
Shear and Moment
Shear (MT)/10^3 Moment (m-MT)/10^5Shear Allowable (MT)/10^3 Moment Allowable (m-MT) / 10 ^ 5
+Hog
-Sag
Figure 21 - Minimum Freeboard condition, 3-compartment damage, Sag wave

Structural Survivability of Modern Liners
Page 30
-5
-4
-3
-2
-1
0
1
2
3
4
5
F -30 F 0 F 30 F 60 F 90 F 120 F 150 F180 F210 F240 F269 F300 F330 F360
-5
-4
-3
-2
-1
0
1
2
3
4
5
Shear and Moment
Shear (MT)/10^3 Moment (m-MT)/10^5Shear Allowable (MT)/10^3 Moment Allowable (m-MT) / 10 ^ 5
+Hog
-Sag
Figure 22 – Typical Departure condition, 2-compartment damage, Sag wave
Structural Survivability of Modern Liners
Page 31
-5
-4
-3
-2
-1
0
1
2
3
4
5
F -30 F 0 F 30 F 60 F 90 F 120 F 150 F180 F210 F240 F269 F300 F330 F360
-5
-4
-3
-2
-1
0
1
2
3
4
5
Shear and Moment
Shear (MT)/10^3 Moment (m-MT)/10^5Shear Allowable (MT)/10^3 Moment Allowable (m-MT) / 10 ^ 5
+Hog
-Sag
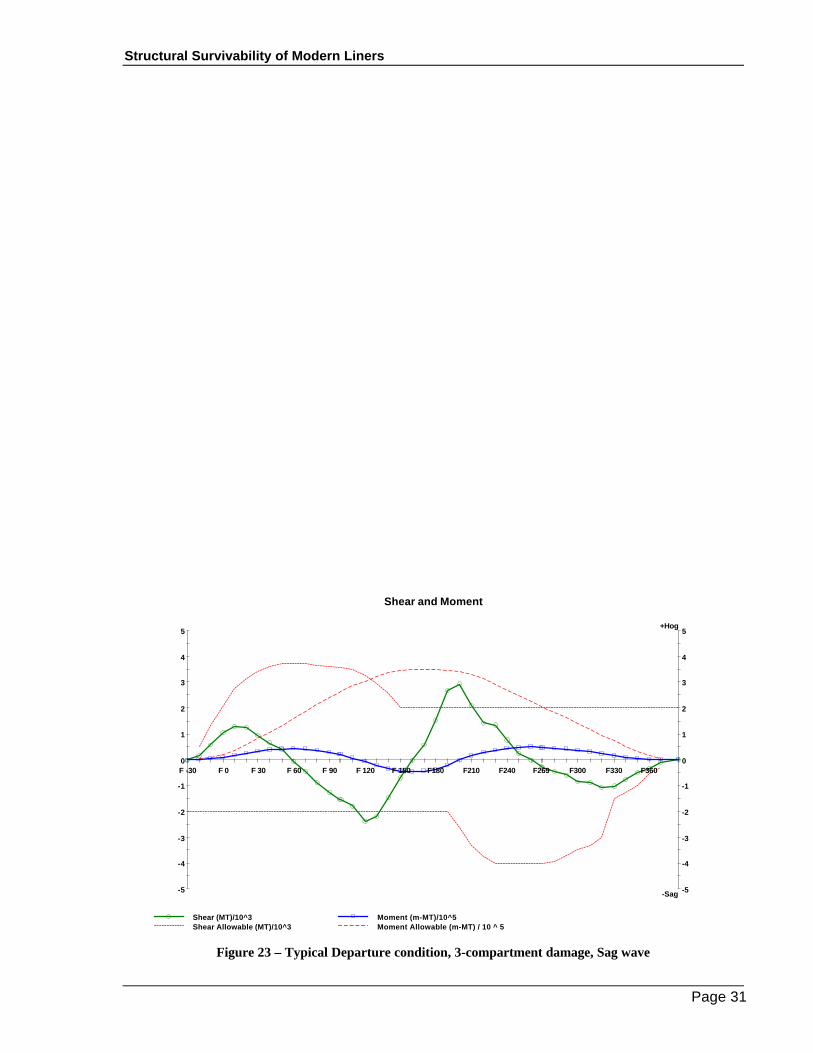
Figure 23 – Typical Departure condition, 3-compartment damage, Sag wave

Structural Survivability of Modern Liners
Page 32
-5
-4
-3
-2
-1
0
1
2
3
4
5
F -30 F 0 F 30 F 60 F 90 F 120 F 150 F180 F210 F240 F269 F300 F330 F360
-5
-4
-3
-2
-1
0
1
2
3
4
5
Shear and Moment
Shear (MT)/10^3 Moment (m-MT)/10^5Shear Allowable (MT)/10^3 Moment Allowable (m-MT) / 10 ^ 5
+Hog
-Sag
Figure 24 – Minimum hogging moment condition, 4-compartment raking damage, Sag wave

Structural Survivability of Modern Liners
Page 33
-5
-4
-3
-2
-1
0
1
2
3
4
5
F -30 F 0 F 30 F 60 F 90 F 120 F 150 F180 F210 F240 F269 F300 F330 F360
-5
-4
-3
-2
-1
0
1
2
3
4
5
Shear and Moment
Shear (MT)/10^3 Moment (m-MT)/10^5Shear Allowable (MT)/10^3 Moment Allowable (m-MT) / 10 ^ 5
+Hog
-Sag
Figure 25 – Minimum hogging moment condition, 2-compartment damage, Hog wave
-5
-4
-3
-2
-1
0
1
2
3
4
5
F -30 F 0 F 30 F 60 F 90 F 120 F 150 F180 F210 F240 F269 F300 F330 F360
-5
-4
-3
-2
-1
0
1
2
3
4
5
Shear and Moment
Shear (MT)/10^3 Moment (m-MT)/10^5Shear Allowable (MT)/10^3 Moment Allowable (m-MT) / 10 ^ 5
+Hog
-Sag
Figure 26 – Minimum hogging moment condition, 2-compartment damage, Sag wave
Structural Survivability of Modern Liners
Page 34
-5
-4
-3
-2
-1
0
1
2
3
4
5
F -30 F 0 F 30 F 60 F 90 F 120 F 150 F180 F210 F240 F269 F300 F330 F360
-5
-4
-3
-2
-1
0
1
2
3
4
5
Shear and Moment
Shear (MT)/10^3 Moment (m-MT)/10^5Shear Allowable (MT)/10^3 Moment Allowable (m-MT) / 10 ^ 5
+Hog
-Sag
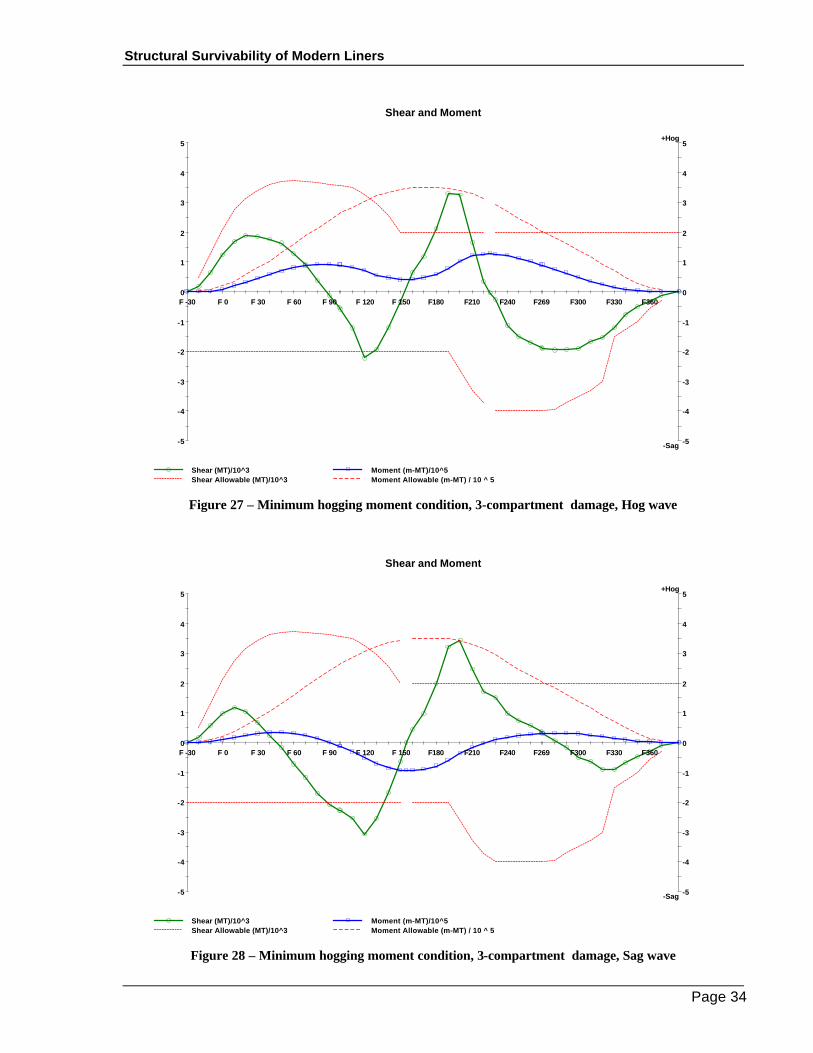
Figure 27 – Minimum hogging moment condition, 3-compartment damage, Hog wave
-5
-4
-3
-2
-1
0
1
2
3
4
5
F -30 F 0 F 30 F 60 F 90 F 120 F 150 F180 F210 F240 F269 F300 F330 F360
-5
-4
-3
-2
-1
0
1
2
3
4
5
Shear and Moment
Shear (MT)/10^3 Moment (m-MT)/10^5Shear Allowable (MT)/10^3 Moment Allowable (m-MT) / 10 ^ 5
+Hog
-Sag
Figure 28 – Minimum hogging moment condition, 3-compartment damage, Sag wave

PROJECT TECHNICAL COMMITTEE MEMBERS
The following persons were members of the committee that represented the Ship Structure Committee to the Contractor as resident subject matter experts. As such they performed technical review of the initial proposals to select the contractor, advised the contractor in cognizant matters pertaining to the contract of which the agencies were aware, performed technical review of the work in progress and edited the final report.
Chairman Mr. William S. Peters. USCG
Members Contracting Officer’s Technical Representative: Ms. Lynell Fox NAVSEA Project Technical Committee Members: Executive Director: LT Eric M. Cooper USCG Administrative Assistant: Ms. Jeannette Delaney ARTI, USCG
SHIP STRUCTURE COMMITTEE LIAISON MEMBERS
LIAISON MEMBERS American Iron and Steel Institute Mr. Alexander Wilson American Society for Testing & Materials Captain Charles Piersall (Ret.) American Society of Naval Engineers Captain Dennis K. Kruse (USN Ret.) American Welding Society Mr. Richard Frank Bath Iron Works Mr. Steve Tarpy Canada Ctr for Minerals & Energy Technology Dr. William R. Tyson Colorado School of Mines Dr. Stephen Liu Edison Welding Institute Mr. Rich Green International Maritime Organization Mr. Igor M. Ponomarev Int’l Ship and Offshore Structure Congress Dr. Jack Spencer INTERTANKO Mr. Dragos Rauta Massachusetts Institute of Technology Memorial University of Newfoundland Dr. M. R. Haddara National Cargo Bureau Captain Jim McNamara Office of Naval Research Dr. Yapa Rajapaksie Oil Companies International Maritime Forum Mr. Phillip Murphy Tanker Structure Cooperative Forum Technical University of Nova Scotia Dr. C. Hsiung United States Coast Guard Academy Commander Kurt Colella United States Merchant Marine Academy Dr. C. B. Kim United States Naval Academy Dr. Ramswar Bhattacharyya University of British Columbia Dr. S. Calisal University of California Berkeley Dr. Robert Bea University of Houston - Composites Eng & Appl. Dr. Jerry Williams University of Maryland Dr. Bilal Ayyub University of Michigan Dr. Michael Bernitsas University of Waterloo Dr. J. Roorda Virginia Polytechnic and State Institute Dr. Alan Brown Webb Institute Prof. Roger Compton Welding Research Council Dr. Martin Prager Worchester Polytechnic Institute Dr. Nick Dembsey Samsung Heavy Industries, Inc. Dr. Satish Kumar
RECENT SHIP STRUCTURE COMMITTEE PUBLICATIONS
Ship Structure Committee Publications on the Web - All reports from SSC 392 and forward are available to be downloaded from the Ship Structure Committee Web Site at URL:
http://www.shipstructure.orgSSC 391 and below are available on the SSC CD-ROM Library. Visit the National Technical
Information Service (NTIS) Web Site for ordering information at URL: http://www.ntis.gov/fcpc/cpn7833.htm
SSC Report Number Report Bibliography SSC 444 In-Service Non-Destructive Estimation of the Remaining Fatigue Life of
Welded Joints, Dexter R.J., Swanson K.M., Shield C.K. 2005 SSC 443 Design Guidelines for Doubler Plate Repairs on Ship Structures
Sensharma P.K., Dinovitzer A., Traynham Y. 2005 SSC 442 Labor-Saving Passive Fire Protection Systems For Aluminum And
Composite Construction E. Greene, 2005 SSC 441 Fire Degradation, Failure Prediction And Qualification Methods For
Fiber Composites R. Asaro, M. Dao, 2005 SSC 440 Deterioration of Structural Integrity Due to Chemical Treatment of
Ballast Water S. Tiku, 2005 SSC 439 Comparative Structural Requirements For High Speed Crafts K. Stone,
2005 SSC 438 Structural Optimization for Conversion of Aluminum Car Ferry to
Support Military Vehicle Payload, R.Kramer, 2005 SSC 437 Modeling Longitudinal Damage in Ship Collisions A.J. Brown, JAW
Sajdak 2005 SSC 436 Effect of Fabrication Tolerances on Fatigue Life of Welded Joints A.
Kendrick, B. Ayyub, I. Assakkaf 2005 SSC 435 Predicting Stable Fatigue Crack Propagation in Stiffened Panels R.J.
Dexter, H.N. Mahmoud 2004 SSC 434 Predicting Motion and Structural Loads in Stranded Ships Phase 1
A.J. Brown, M. Simbulan, J. McQuillan, M. Gutierrez 2004 SSC 433 Interactive Buckling Testing of Stiffened Steel Plate Panels Q. Chen,
R.S. Hanson, G.Y. Grondin 2004 SSC 432 Adaptation of Commercial Structural Criteria to Military Needs R.Vara,
C.M. Potter, R.A. Sielski, J.P. Sikora, L.R. Hill, J.C. Adamchak, D.P. Kihl, J. Hebert, R.I. Basu, L. Ferreiro, J. Watts, P.D. Herrington 2003


![Government Gazette No 21407 27 July 2000 · Government Gazette No 21407 ... obliged to pay in terms of a collective ... [wage board] Employment Conditions Commission in terms of section](https://img.dokumen.tips/doc/110x75/5af2b27a7f8b9ac57a91871d/government-gazette-no-21407-27-july-gazette-no-21407-obliged-to-pay-in-terms.jpg)