Embed Size (px)
Citation preview

Under its “Grand Design,” Mitsui Chemicals, Inc. aims to achieve sustained development through balanced management that addresses economic, environmental and social concerns. To this end, our three core operating business sectors are implementing the following.
>See page 18-19
GrowingPerformance Materials
along with the crucial and expanding envi-
ronmental technology market, we are boosting sales by focusing on the
functional film sheet business, including solar cell-related products.
>See page 20-21
ExpandingAdvanced Chemicals
our vision care, agrochemical and
catalyst operations, we are building a business structure that is immune to
market fluctuations and cultivating next-generation businesses.
>See page 22-23
CompetitiveBasic Chemicals
worldwide, we are bolstering
our international standing by leveraging partnerships to optimize product
operations in Japan and by shifting toward high-value-added products
while expanding into the growing Asian markets, particularly China and
India.
ContentsConsolidated Financial Highlights 1To Our Stakeholders 2An Interview with the President 4Corporate Governance 9CSR through R&D 12Special Feature 18 Main Products 24Review of Operations 26Intellectual Property Strategy 32Directors and Auditors 34Financial Section 35Subsidiaries and Major Affiliates 72Corporate Data 74Mitsui Chemicals Organization Chart 75Stock Information 76
Forward-Looking StatementsThis annual report contains forward-looking statements about the future plans, strategies, beliefs and performance of the Mitsui Chemicals Group as a whole and its individual consolidated companies. These forward-looking statements are not historical facts. They are expectations, estimates, forecasts and projections based on information currently available to the Mitsui Chemicals Group and are subject to a number of risks, uncertainties and assumptions, which, without limitation, include economic trends, fluctuations in foreign currency exchange rates, fluctuations in the price of raw materials, competition in markets where the Company is active, personal consumption, market demand, the tax system and other legislation. As such, actual results may differ materially from those pro-jected and the Mitsui Chemicals Group cannot guarantee that these forward-looking statements are accurate or will be achieved.
Growing
Expanding
Competitive
ANNUAL REPORT 2009Year Ended March 31, 2009
Shiodome City Center, 1-5-2, Higashi-Shimbashi,Minato-ku, Tokyo 105-7117, JapanTelephone: +81-3-6253-2100Facsimile: +81-3-6253-4245URL: http://www.mitsuichem.come-mail: [email protected]
Mitsui C
hemicals, Inc. A
nnual Rep
ort 2009
Finance, Accounting & IR division
Responsible Care

Under its “Grand Design,” Mitsui Chemicals, Inc. aims to achieve sustained development through balanced management that addresses economic, environmental and social concerns. To this end, our three core operating business sectors are implementing the following.
>See page 18-19
GrowingPerformance Materials
along with the crucial and expanding envi-
ronmental technology market, we are boosting sales by focusing on the
functional fi lm sheet business, including solar cell-related products.
>See page 20-21
ExpandingAdvanced Chemicals
our vision care, agrochemical and
catalyst operations, we are building a business structure that is immune to
market fl uctuations and cultivating next-generation businesses.
>See page 22-23
CompetitiveBasic Chemicals
worldwide, we are bolstering
our international standing by leveraging partnerships to optimize product
operations in Japan and by shifting toward high-value-added products
while expanding into the growing Asian markets, particularly China and
India.
ContentsConsolidated Financial Highlights 1To Our Stakeholders 2An Interview with the President 4Corporate Governance 9CSR through R&D 12Special Feature 18 Main Products 24Review of Operations 26Intellectual Property Strategy 32Directors and Auditors 34Financial Section 35Subsidiaries and Major Affi liates 72Corporate Data 74Mitsui Chemicals Organization Chart 75Stock Information 76
Forward-Looking StatementsThis annual report contains forward-looking statements about the future plans, strategies, beliefs and performance of the Mitsui Chemicals Group as a whole and its individual consolidated companies. These forward-looking statements are not historical facts. They are expectations, estimates, forecasts and projections based on information currently available to the Mitsui Chemicals Group and are subject to a number of risks, uncertainties and assumptions, which, without limitation, include economic trends, fl uctuations in foreign currency exchange rates, fl uctuations in the price of raw materials, competition in markets where the Company is active, personal consumption, market demand, the tax system and other legislation. As such, actual results may differ materially from those pro-jected and the Mitsui Chemicals Group cannot guarantee that these forward-looking statements are accurate or will be achieved.
Growing
Expanding
Competitive
ANNUAL REPORT 2009Year Ended March 31, 2009
Shiodome City Center, 1-5-2, Higashi-Shimbashi,Minato-ku, Tokyo 105-7117, JapanTelephone: +81-3-6253-2100Facsimile: +81-3-6253-4245URL: http://www.mitsuichem.come-mail: [email protected]
Mitsui C
hemicals, Inc. A
nnual Rep
ort 2009
Finance, Accounting & IR division
Responsible Care

29%
8%
61%
2%
Basic Chemicals
Performance Materials
Advanced Chemicals08 09
504.1
0
600
500
400
300
200
100
431.8
0
40
30
20
10
35.950.4
29.6
39.937.6
(16.0)
-10
-20
080
60
50
40
30
20
10
08
09
09
Net Sales
Billions of Yen
Capital Expenditures/DepreciationBillions of Yen
Operating Income(Loss)Billions of Yen
Capital ExpendituresDepreciation
FY
FY
FY
08
122.1
0
150
120
90
60
30
118.7
0
40
30
20
1010.8
7.3
6.2 6.3
19.0
7.6
080
20
16
12
8
4
08
Capital ExpendituresDepreciation
09 09 09FY FYFY
08 09
912.8
0
1,200
1,000
800
600
400
200
1,111.2
40
30
20
10
0
-40
-30
33.4
20.6
30.8
17.7
29.8
(32.0)
-10
-20
080
300
250
200
150
100
50
08
Capital ExpendituresDepreciation
FY
09 FY
FY 09
Providing raw material with differentiating functions using unique catalyst and polymer technologies.
• Automotive & Industrial Materials• Living & Energy Materials• Information & Electronics Materials• Polyurethane• Coatings & Engineering Materials
MAIN BUSINESSES• EPT • MILASTOMER™• TAFMER™• Polyethylene wax• Nonwoven fabrics for hygiene materials and breathable fi lms• TPX™ • APEL™
• NF3 gas• NEOFLEX™• PLAPACS™• ICROS TAPE™• Toner binder resin• Urethane chemicals (TDI/ MDI/PPG)• Polyurethane• SOLAR EVA™
MAIN PRODUCTS
At aGlance
Business Outline
The Mitsui Chemicals Groupdivides its business activities into three segments, offering society a variety of products used in both consumable and durable goods, spanning a broad range of fi elds, from automobiles, electronics and IT to medical, health-related, agricultural, housing, con-struction and household prod-ucts.
Performance Materials
Advanced Chemicals
Basic Chemicals
Others
Net Sales
(FY2009)
¥1,488 billion
Providing fi ne chemi-cals and agricultural chemicals with the world-class levels of functionality.
Providing a variety of raw materials that sup-port our lifestyle by chemically processing oil and natural gas.
• Fine & Performance Chemicals• Agrochemicals
MAIN BUSINESSES MAIN PRODUCTS
• Feedstocks• Phenols• PTA & PET• Industrial Chemicals• Polyolefi n• Licensing
MAIN BUSINESSES
• Ethylene • Propylene• Phenol• Bisphenol A• Acetone• Purifi ed terephthalic acid (PTA)• PET resins• Ethylene glycol
• Ethylene oxide• Polyethylene • Polypropylene• Licensing
MAIN PRODUCTS
• Ophthalmic lens materials• Plastics/glass coating materials• Pharmaceutical chemicals• Dental-related materials• Olefi n polymerization catalysts• Polymerization inhibitors and materials for wood/ tire adhesives
• Insecticides• Fungicides• Herbicides• Paddy rice seeds

29%
8%
61%
2%
Basic Chemicals
Performance Materials
Advanced Chemicals
504.1
0
600
500
400
300
200
100
431.8
0
40
30
20
10
35.950.4
29.6
39.937.6
-16.0
-10
-20
0
60
50
40
30
20
10
Billion of Yen
Net Sales
08 09 FY
Billion of Yen Billion of Yen
Operating Income(Loss)
08
09 FY
08 09 FY
Capital Expenditures/Depreciation
Capital Expenditures/Depreciation
122.1
0
150
120
90
60
30
118.7
0
40
30
20
1010.8
7.3
6.2 6.3
19.0
7.6
0
20
16
12
8
4
08 09 FY
Capital Expenditures/Depreciatio
08 09 FY 08 09 FY
912.8
0
1,200
1,000
800
600
400
200
1,111.2
40
30
20
10
0
-30
33.4
20.6
30.8
17.7
29.8
-32.0
-10
-20
0
30
25
20
15
10
5
08 09 FY08 09 FY 08
09 FY
Capital Expenditures/Depreciation
Providing raw material with differentiating functions using unique catalyst and polymer technologies.
• Automotive & Industrial Materials• Living & Energy Materials• Information & Electronics Materials• Polyurethane• Coatings & Engineering Materials
MAIN BUSINESSES• EPT • MILASTOMER™• TAFMER™• Polyethylene wax• Nonwoven fabrics for hygiene materials and breathable fi lms• TPX™ • APEL™
• NF3 gas• NEOFLEX™• PLAPACS™• ICROS TAPE™• Toner binder resin• Urethane chemicals (TDI/ MDI/PPG)• Polyurethane• SOLAR EVA™
MAIN PRODUCTS
At aGlance
Business Outline
The Mitsui Chemicals Groupdivides its business activities into three segments, offering society a variety of products used in both consumable and durable goods, spanning a broad range of fi elds, from automobiles, electronics and IT to medical, health-related, agricultural, housing, con-struction and household prod-ucts.
Performance Materials
Advanced Chemicals
Basic Chemicals
Others
Net Sales
(FY2009)
¥1,488 billion
Providing fi ne chemi-cals and agricultural chemicals with the world-class levels of functionality.
Providing a variety of raw materials that sup-port our lifestyle by chemically processing oil and natural gas.
• Fine & Performance Chemicals• Agrochemicals
MAIN BUSINESSES MAIN PRODUCTS
• Feedstocks• Phenols• PTA & PET• Industrial Chemicals• Polyolefi n• Licensing
MAIN BUSINESSES
• Ethylene • Propylene• Phenol• Bisphenol A• Acetone• Purifi ed terephthalic acid (PTA)• PET resins• Ethylene glycol
• Ethylene oxide• Polyethylene • Polypropylene• Licensing
MAIN PRODUCTS
• Ophthalmic lens materials• Plastics/glass coating materials• Pharmaceutical chemicals• Dental-related materials• Olefi n polymerization catalysts• Polymerization inhibitors and materials for wood/ tire adhesives
• Insecticides• Fungicides• Herbicides• Paddy rice seeds

1
Consolidated Financial Highlights
1,469
Net Sales Operating Income (Loss) Total Assets
05 06 07 08 09
1,787
1,488
0
500
1,000
1,500
2,000
05 06 07 08 09
80.5
58.7
77.2
(50)
0
(25)
25
50
75
100
05 06 07 08 09
1,205
1,329
1,498
1,189
0
400
800
1,200
1,600
92.4
(78.2)
Cash Flows
05 06 07 08 09
96.5
(33.1)
79.7
(58.2)
100.5
(133.6)
54.9
(76.3)
(150)
(100)
(50)
0
50
100
150
1,228
1,472
1,688
91.7
63.4
21.5
14.2
63.4
21.5
14.2
Operating activitiesInvesting activitiesFree cash flows
RemarksIn this report, FY (XX) indicates the fiscal year starting from April 1 of (XX-1) and ending at March 31 of (XX). For example, FY09 indicates the fiscal year from April 1, 2008 to March 31, 2009.
(FY)(FY)(FY)(FY)
(45.5)
(21.4)(33.1)
Billions of Yen Billions of Yen Billions of Yen Billions of Yen
Thousands of Millions of yen % Change U.S. dollars
FY2009 FY2008 FY2007 FY2009/FY2008 FY2009
For the year:Net sales ¥1,487,615 ¥1,786,680 ¥1,688,062 (11.9) $15,144,202
Operating income (loss) (45,493) 77,176 91,678 –— (463,128)
Net income (loss) (95,237) 24,831 52,297 –— (969,531)
Capital expenditures 81,041 84,667 72,671 (4.3) 825,012
R&D expenses 40,628 42,130 36,943 (3.6) 413,601
Cash Flows
Net cash provided by operating activities ¥ 54,882 ¥ 92,423 ¥ 100,565 (40.6) $ 558,709
Net cash used in investing activities (76,253) (78,206) (133,618) 2.5 (776,270)
Free cash flows (21,371) 14,217 (33,053) –— (217,561)
At year-end:Total assets ¥1,188,939 ¥1,469,248 ¥1,498,183 (19.1) $12,103,624
Total shareholders’ equity 349,908 500,044 504,509 (30.0) 3,562,130
Yen % Change U.S. dollars
Per share of common stock:Net income (loss) ¥(125.46) ¥ 32.22 ¥ 66.68 –— $ (1.28)
Shareholders’ equity 465.56 649.63 653.84 (28.3) 4.74
Cash dividends 9.00 12.00 10.00 (25.0) 0.09
Performance indicators:Return on equity –— 4.94% 10.80%
Return (operating income) on assets (3.42%) 5.20% 6.49%
For the years ended March 31
Notes: 1) U.S. dollar amounts have been translated from yen, for convenience only, at the rate of ¥98.23=U.S.$1, the approximate Tokyo foreign exchange market rate as of March 31, 2009. 2) Changes are between the years ended March 31, 2009 and 2008. 3) Total shareholders’ equity = Total net assets - Minority interests (as recorded on the balance sheet)

2
To Our Stakeholders
President & CEO Toshikazu TanakaChairman Kenji Fujiyoshi
We will redouble our efforts toward securing profitabilitythrough Emergency Measures.

3
Fiscal 2009 (The Fiscal Year Ended March 31, 2009)Business Environment and ResultsIn fiscal 2009, the Japanese economy experienced a pre-cipitous slowdown. From the first half of the fiscal year under review, the prices of such raw materials as crude oil and iron ore surged markedly. In addition to the drop in corporate-sector earnings, repercussions from the U.S. subprime mortgage problem, which triggered a global financial crisis, significantly impacted the real economy. As a result, domestic economic conditions deteriorated rapidly. In the chemical industry, companies took steps to revise product prices upward in the wake of sharp upswings in mate-rial and fuel costs, particularly during the first half of the fiscal year. Despite these endeavors, conditions remained harsh, with substantial downward pressure placed on earnings. After hitting historic highs, the prices of raw materials and fuels dropped rapidly from early autumn. Demand also plummeted sharply on the back of the global recession. Impacted by unprecedented volatility and change, the chemical industry confronted an extremely difficult business environment. Amid this climate of abrupt and dramatic fluctuation in operating conditions, the Mitsui Chemicals Group reported a significant drop in earnings. This was mainly attributable to the substantial decline in demand from the Group's mainstay business partners in the automotive and electronic informa-tion material fields that resulted in lower sales volumes and an unavoidable reduction in production facility and equipment utilization. Faced with this downturn in its overall performance, the Company took steps to implement Emergency Measures, reexamining every facet of its business activities. In the fiscal year under review, Mitsui Chemicals reduced compensation paid to directors and management personnel, drastically cut back operating overheads, undertook a comprehensive zero-based review of all investment projects and thoroughly rational-ized inventories. Despite the aforementioned endeavors, the Group suf-fered an across-the-board decline in its operating results. In addition to the drop in operating income, Mitsui Chemicals recorded a loss on valuation of inventories that reflected the overall decrease in market prices and undertook to reverse a portion of its deferred tax assets. Taking into account each of the aforementioned factors, the Group reported net sales of ¥1,487.6 billion, down ¥299.1 billion compared with the previ-ous fiscal year. From a profit perspective, the Mitsui Chemicals Group recorded an operating loss of ¥45.5 billion, a negative turnaround of ¥122.7 billion. Loss before income taxes and minority interests was ¥65.4 billion, ¥110.0 billion lower than the income before income taxes and minority interests disclosed in the previous fiscal year. After deducting income taxes and minority interests in earnings of consolidated subsidiaries, net income plummeted ¥120.0 billion year on year to a net loss of ¥95.2 billion. Recognizing the Company's responsibility to ensure an adequate return to its shareholders, Mitsui Chemicals has declared an annual dividend of ¥9 per share, comprising an interim dividend of ¥6 per share and a fiscal year-end dividend of ¥3 per share, for the fiscal year under review.
Priority Issues
In the fiscal year ending March 31, 2010, the global economy is expected to confront substantial change. As a nation histori-cally dependent on exports, Japan is expected to experience extremely harsh operating conditions. This is mainly due to the persistent and significant decline in overall demand. Moreover, the planned commencement of operations at large-scale ethyl-ene production facilities in the Middle East and Asia will further increase competition, and the Mitsui Chemicals Group fore-sees a prolonged downturn in the business environment. Working to lay the foundations for profit recovery, the Group has positioned the fiscal year ending March 31, 2010, as a critical period in which to improve earnings. Commensurate with changes in its business environment, the Company will endeavor to overcome its difficulties through the implementa-tion of Emergency Measures. With the aim of bolstering its earning capacity and capabilities, the Mitsui Chemicals Group is conducting a thorough review of its existing business strat-egies. Supported by basic policies aimed at cementing its foothold in the domestic market while expanding activities over-seas, the Group is dedicated to securing a return to profitability from the fiscal year ending March 31, 2011 and beyond. Guided by its Medium-Term Business Plan, a four-year roadmap launched in April 2008, the Mitsui Chemicals Group has also adopted a three-dimension management approach that focuses on balancing economic, environmental and social dimensions. Against the backdrop of projected harsh operat-ing conditions, Mitsui Chemicals will work diligently to address the following priority issues in the fiscal year ending March 31, 2010.
(Economy)(1) Survival in the domestic market and overseas expansion focusing mainly on Asia(2) Consolidation, strict selection and focus as well as expan- sion in performance materials(3) Reinforcement and expansion of operations that are in rela- tive terms immune to fluctuations in the economic environment
(Environment)Achievement of the greenhouse gas (GHG) reduction plan and proposal of further reduction targets
(Society)(1) Eradication of occupational accidents and injuries based on a unified Group-wide commitment(2) Elimination of statutory and regulatory infractions through a heightened Group-wide awareness of compliance
Working tirelessly to address these priority issues and to achieve each of our medium-to long-term goals, we ask for the continued support and understanding of stakeholders.
President & CEO Toshikazu Tanaka

4 Q1:
”
09/Jan.
Path to Profitability
Stabilize Profitability
Large Losses
Restore Profitability in Second Half of FY2010
Improve Profit Structure (Intensify Cost Cuts)Restructure Business (Overhaul Strategy)Enhance Marketing (Keep an extraverted perspective)
Exhaustive implementation of all possible measures to
improve profitability
Ope
ratin
g P
rofit
Emergency Measures
FY09 FY10 FY11
Basic Policies of Emergency Measures
Improve Profit Structure
(Intensify Cost Cuts)
Restructure Business
(Overhaul Strategy)
Enhance Marketing(Keep an Extraverted Perspective)
An Interview with the President
In this period of unprecedented economic crisis, how is the Company forging a path to profi tability?
A. In response to sharp hikes in the cost of such raw materi-als as crude oil and naphtha in the fi rst half of fi scal 2009, Mitsui Chemicals took steps to adjust its product prices. Just as these efforts were beginning to bear fruit, the abrupt down-turn in the global economy placed considerable downward pressure on the Group's principal Basic Chemicals Business Sector. Impacted by the drop in demand from both the auto-motive and electronic information material fi elds, we are bear-ing the brunt of a harsh operating environment. Against this backdrop of dramatic fl uctuation and change, we have posi-tioned fi scal 2010 as a period in which Mitsui Chemicals must improve its disappointing results. Through the exhaustive
implementation of all possible measures to boost performance, we plan to restore profi tability in the second half of the fi s-cal year ending March 31, 2010. Turning to fi scal 2011, the Company has drawn up additional Emergency Measures aimed at entrenching this profi t growth trajectory. Our efforts and goals extend beyond a single-minded focus on expenses. As a part of the Group's Emergency Measures, Mitsui Chemicals will improve its profi t structure by intensifying cost-cutting initiatives, restructure its business by overhaul-ing strategies and commence steps to reinforce its marketing capabilities.
Mitsui Chemicals has been implementing a set of Emergency Measures since January 2009. In an interview with the newly appointed President and CEO, Toshikazu Tanaka, we discuss the details of these measures and what led to their formulation.

5
Q2:
Q3:
0
3,000
1,500
6,000
4,500
9,000
7,000
0
40
20
80
60
100
Cutback in Personnel Expenses (med/long term)Labor Force (persons) Labor Cost (billion yen)(persons) (¥ Billion)
FY09 Actual FY10 Forecast FY11 Forecast FY16 Forecast
(78)
(90)
1.8 1.9
3.2
1.81.6
2.8
0
80
40
160
120
0
200
100
300
200
1.0
2.0
0
3.0
1Q 2Q 3Q 4Q 2Q 4Q
Improvements in Cash Flows 1. Selective Investments: 2. Inventory Optimization
Total 2 years�(¥132 billion)
(¥ Billion)
(¥ Billion)
WithinDepreciation
Actual
Dep
reciationD
epreciation
Forecast
FY09 FY10FY10FY09
MTP
(30)
(102)
MonthTarget
Total 2 years�(¥168 billion) Total 2 years�(¥168 billion)
Please tell us how you plan to improve your profi t structure.
A. Put simply, we are working to intensify cost cuts. In the January to March 2009 quarter, we reduced personnel costs a total of ¥2.5 billion. This was largely attributable to reductions in wages and compensation paid to directors, management and staff. From an operating expense perspective, we realized cost savings of ¥1.5 billion through reductions in fi xed costs at production sites. Successful efforts to optimize produc-tion processes and promote increased energy effi ciency also generated variable cost benefi ts of ¥1.0 billion. Thanks to the aforementioned factors, we realized total cost savings of ¥5.0 billion from January 1, 2009 to March 31, 2009. Looking ahead, we will further intensify our cost-cutting efforts. With the aim of improving the Group's profi t structure, Mitsui Chemicals is targeting total cost cuts of ¥30.0 billion for the full fi scal year ending March 31, 2010. Not satisfi ed with a short-term reduction in wages and compensation, we will continue to reduce personnel expenses over the medium to long term. In this context, we will adjust our personnel complement to achieve optimal balance between the approximately 400 employees that retire each year and
our annual intake of new recruits. With a target date of March 2016, we intend to reduce our workforce by 1,270 employ-ees. Building on this cutback in the Group's labor force, Mitsui Chemicals will continue to review wages, compensation and other working conditions with the aim of trimming labor costs a further ¥20.0 billion through to FY2016. In addition, we are striving to improve our cash fl ow. In prin-ciple, Mitsui Chemicals engages in investment and loan activi-ties within the general scope of depreciation and amortization. By adopting a more selective approach toward investment, we improved cash fl ow ¥30.0 billion in fi scal 2009 compared with the medium-term business plan. Together with projected cutbacks of ¥102.0 billion in fi scal 2010, we are targeting a two-year reduction in investments of ¥132.0 billion. In an effort to optimize inventories, we are targeting a reduction of ¥168.0 billion in fi scal 2010 compared with the third quarter of fi scal 2009. Looking at another key indicator, inventory months on hand, we plan to streamline the current annual average of between 1.8 months and 1.9 months to 1.6 months as of the end of fi scal 2010.
Why has Mitsui Chemicals restructured its business?
A. Impacted by structural changes in industry worldwide, Mitsui Chemicals has adopted a basic policy of ensuring its survival in the domestic market while expanding overseas with a focus on Asia. To meet the challenges of a contracting domestic market, we will optimize production in the Chiba area in collaboration with Idemitsu Kosan Co., Ltd.; integrate refi neries to improve business structure; strengthen and expand businesses to ensure our domestic market survival; and expand the high-performance fi lm sheet business.
Overseas, we will aim to expand business in China in col-laboration with Sinopac while participating in the collaborative construction of a refi nery in Vietnam.

6
Q4:
基本方針
Commence China Bisphenol A
ReplacePortfolio
Concentrate on Plants with
Competitive Edge
Expand Overseas Operations
Ichihara/Ethylene Glycol (2009)
Osaka/polystyrene (2009)
Iwakuni/plant 2 PTA (2009)
Ichihara/plant 2 EPT (review)
2 plants under review
Nagoya/Bisphenol A (2009)
PTA production to new plant
New hexane-1 Facility (2011)
Rearrange Low Earners
EPT production to new plant
PP production cut
Consolidation /DecommissionImprove StructureFundamental PolicyConsolidation/Decommissionof Facilities to Improve Structure
0
80
40
160
120
200
FY16
Strengthen/Expand High-PerformanceFilm Sheet Operations
Strengthen High-Performance Film Sheet Business by Reinforcing Tohcello Operations
Major Product AreasIT FilmsSolar Cell Film SheetsPackaging FilmsRestructureMerge
¥ Billion
FY09
IntegrationIntegrationTohcelloTohcello
MCIMCI
0
40
20
80
60
100
FY07
Strengthen/Expand Operations Not Affected by Economic Environment
Accelerate agrochemical business
Strengthen ingredient operations and product operations by formation of
Mitsui Chemicals Agro (April)
Increase domestic share/accelerate overseas operations
Acquire Daiichi Sankyo agrochemical
operations
¥ Billion ¥100 billion
FY08 FY10 FY16
An Interview with the President
What specifi c measures have you formulated to ensure the Company's survival in the domestic market?
A. In order to survive in the domestic market, Mitsui Chemicals has identifi ed four key measures. First, we will optimize production in the Chiba area in collaboration with Idemitsu Kosan. Given the commencement of operations on the part of large-scale ethylene production facilities in the Middle East and Asia, Japan's petro-chemicals industry now fi nds it imperative to reinforce its ability to compete in overseas markets. Following the decision in 2004 by Mitsui Chemicals and Idemitsu Kosan to conduct a comprehensive study toward realizing a cooperative setup in the Chiba area, both compa-nies have worked steadily to forge a productive relationship. Among a host of initiatives aimed at increasing competitive-ness, Mitsui Chemicals and Idemitsu Kosan established Prime Polymer Co., Ltd., a joint-venture company for the production of polyolefi ns, and joined the Research Association of Refi nery Integration for Group-Operation (RING), an association that seeks to revitalize Japan's refi ning and petrochemical com-plexes. In an effort to advance collaborative ties to the next level, the two companies have reached an agreement to establish an optimal production structure in the Chiba area. In this manner, a solid foundation is being laid to further enhance competitive strength and standing. While each company boasts signifi cant capabilities in its own right, collaboration through production optimization focusing on naphtha cracker units, coupled with the integration of refi ner-ies as well as petrochemical derivative facilities are expected to secure us a leading position in the domestic market. Confronted with a contracting domestic market, business expansion throughout the Asian region and the commence-ment of operations at large-scale production facilities in the Middle East and Asia resulting in the outfl ow of general-pur-pose resins, we will improve our business structure by accel-erating steps to consolidate and decommission facilities as a second key initiative. The third way in which we are working to ensure our domestic market survival involves strengthening and expand-ing businesses that are not affected by cyclical fl uctuation. In the Advanced Chemicals Business Sector, for example, the

7
Q5:
Q6:
外向き姿勢”への転換”
Outline of Participation in Nghi Son, Vietnam Project (Second Refinery Project in Vietnam)
39.8%
25.1%35.1%Idemitsu Kosan & MCI
Kuwait Int. OilPetro
Vietnam
Vietnam Government
Nghi Son Refinery Limited Liability Company
Intensify China Operations through Collaboration with Sinopec
Growth Strategy for Expanding Chinese Market
Feasibility Study in Process
PhenolMIBK, etc.
High Performance
Products(EPT etc.)
Bisphenol A*SSMC�
Commercial OperationJan 2009
Joint R&DNew Technology (Product, Process, Energy, Environment, etc.)
*SSMC: Shanghai Sinopec Mitsui Chemicals, Co., Ltd. (MCI 50%, Sinopec 50% joint venture)
Company's agrochemical and vision care operations continue to generate stable earnings despite the current harsh operat-ing environment. Our policy, therefore, is to further strengthen and expand business in these two areas. Kicking off these endeavors, we split off the Agrochemicals Division, absorbing it into Sankyo Agro Co., Ltd. to form Mitsui Chemicals Agro, Inc. on April 1, 2009. With the aim of consolidating our active ingredient and formulation activities, we are targeting net sales of ¥100.0 billion in the agrochemicals business in 2016.
Fourth, we will leverage our established strengths in specialty polymers to further reinforce and expand our high-performance fi lm sheet operations. To this end, Mitsui Chemicals increased its existing shareholding in Tohcello Co., Ltd. in April 2009, includ-ing the company in its scope of consolidation as a wholly owned subsidiary. By positioning Tohcello at the heart of our high-per-formance fi lm sheet business and further reinforcing operations, we are targeting an approximate twofold increase in net sales to ¥200.0 billion compared with fi scal 2010.
The Mitsui Chemicals Group is also looking to expand overseas. What measures do you plan to implement in this regard?
A. Following the course of their natural development, markets that are now mature are steadily declining. Our goal, therefore, is to actively pursue demand throughout Asia, including in China and India, emerging markets that are expected to enjoy signifi -cant growth. As one of two key measures, we will intensify our China operations by collaborating with China Petroleum & Chemical Corporation (Sinopec). Building on a relationship that extends over two decades, we established a joint venture in Shanghai in January 2009 for the annual production of 120,000 tons of bisphenol-A. In a more recent development, the two companies concluded a memorandum of understanding in April 2009 to foster closer ties in the petrifaction fi eld. Looking ahead, we plan to boost collaboration beyond petrifaction to include phenol operations that encompass such high-performance products as ethylene propylene terpolymers. By securing a strong foothold in this lucrative market, we will position China as a core business. In addition to China, we see Vietnam as a market of signifi -cant potential. Taking the lead in the collaborative construction of a refi nery in Vietnam, Japanese participants are coordinating with oil-producing and developing countries to establish a business scheme of considerable interest. In another venture focusing entirely on Asia, we are participat-ing in a project in which Japanese interests are taking the lead involving the extraction of local petroleum for the Vietnamese market using Japanese technology. With feasibility studies well under way, we anticipate fi nal determination by March 31, 2010.
A. In order to address drastic changes in the economic environ-ment, we must identify possible impacts on our business opera-tions by carefully looking at the outside environment. In addition, all of us, including top management, must pursue closer com-munication with customers to reinforce relationships of trust. This will be the fi rst step in reinforcing of our marketing capabilities. As they strive to achieve closer ties, not only front-line sales person-
What is your basic stance toward strengthening marketing capabilities?
nel but also other employees in such divisions as R&D, distribu-tion, manufacturing and quality assurance should work to fully understand the purpose of the marketing capability reinforce-ment initiative and support each other through robust collabora-tion. Specifi cally, we are planning to develop marketing personnel, reinforce the collaboration between the R&D and operating divi-sions and strengthen marketing activities in the Asian region.

Grand DesignThe Mitsui Chemicals Group formulated a Grand Design, which lays out the Group’s corporate growth targets for the next 10 to 15 years.
Management Target
Our Corporate Mission
The Mitsui Chemicals Group is “to contribute broadly to society by providing high-quality products and services to customers through innova-tions and creation of materials, while keeping in harmony with the global environment.”
Our Corporate Target
We established the following target: “Chemistry, Innovation, Dreams.”
The Mitsui Chemicals Group is constantly pursuing innovation and materializing dreams with the wonder of chemistry.
Business Plan
We started the 4-year Mid-term Business Plan in fi scal 2008. We face the challenge of “Creating New Value” through the creation of innovative new technologies and the establishment of three-pronged management focused on the economy, the environment and society.
Grand Design
Management Target
BusinessPlan
Corporate Mission
Corporate Target
Long-term Management Target
Medium-term Business Plan
The Action GuidelinesThe Action Guidelines
Economy
Environment Society
Create innovative new technologies
The 2008 Medium-term Business PlanComplete 3-dimensional strategy consisting of economy,
environment and society • Create innovative new technologies
• Gear up growth and expansion to achieve long-term fi nancial goals• Accelerate realization of targeted business goals • Create new innovative technologies
• Development of technologies utilizing non-fossil resources• Constrain of increase in GHG basic unit
• Achieve world top class safety level• Eradicate violation against laws and regulations• Raise awareness for safety group- widely• Establish best-suit framework to realize labor safety
Against the backdrop of global economic recession, Mitsui Chemicals focuses on emergency measures that address earnings issues. In the medium to long term, however, Mitsui Chemicals is aiming to enhance corporate value based on the Corporate Vision set out in the Grand Design.
8

9
CorporateGovernance
Corporate Governance Diagram
General Meeting of Shareholders
Appointment Appointment
Appointment
Board of Auditors5 auditors
Including 3 outside auditors
CSR Committee
Internal Control DivisionAudit
Audit
Accounting audit
Business Sector, Production & Technology Center, Research Center and Others
Board of Directors15 directors
Including 3 outside directors
Representative director
Risk & Compliance Committee
Management Committee
Accounting auditor
Basic Philosophy
As a key management issue, Mitsui Chemicals places the highest priority on enhancing corporate governance in order to retain the trust of shareholders and to fulfi ll its social responsi-bilities as a company. Accordingly, we ensure compliance with relevant laws and regulations and work continually to improve management transparency. As illustrated in the diagram below, Mitsui Chemicals has established a system that ensures that major decisions are implemented only after thorough discus-sion and examination by relevant committees and that all such decisions are compliant with relevant laws and Company regu-lations. Overseen by the Internal Control Division and the Risk & Compliance Committee, our internal control system empha-sizes the corporate auditor function. Moreover, to enhance the effectiveness of corporate governance, we actively promote investor relations and public relations activities involving the dis-closure of information to shareholders, investors, analysts, the media and others.
Corporate Governance
Composition and Management of the Board of DirectorsChaired by the President and CEO, Mitsui Chemicals main-tains a Board of Directors that comprises 15 directors as of June,24,2009. In addition to its monthly ordinary meetings, the Board of Directors holds extraordinary meetings on an as-required basis. A total of 12 meetings were held during the fi scal year ended March 31, 2009. Three outside executives are appointed to the Board of Directors with the aim of enhancing transparency and objectiv-ity. This initiative also serves to strengthen the Board’s ability to adequately monitor directors in their execution of business. To the extent possible, directors are required to attend Board meetings, at which they collectively reach decisions regarding major matters touching on management and oversee individual directors’ execution of duties. With members boasting diverse backgrounds and experience in such areas as the legal pro-fession, academia and fi nance, Board of Directors’ meetings provide a forum for lively discussion and debate broadly based on the perspectives of governance and compliance. In order to clarify the division of responsibilities between management oversight and business execution, Mitsui Chemicals has adopted an executive offi cer system. This system helps to accelerate the management decision-making process, facilitates the smooth and timely business execution of each division and further strengthens and enhances the Company’s management structure and systems.

10
Auditing System
Mitsui Chemicals has established a Board of Auditors compris-ing five corporate auditors, three of whom are appointed from outside the Group. In order to carry out their audit function, corporate auditors exchange opinions about the yearly audit plan and audit results with the accounting auditor and the Internal Control Division while pursuing mutual coordination with respect to other pertinent matters. In the context of the Group’s corporate governance and decision-making processes, cor-porate auditors attend various important internal meetings and regularly exchange opinions with the president and other mem-bers of senior management. With representatives from the cor-porate, legal and administrative sectors, the Board of Auditors provide a wealth of wide-ranging expertise and knowledge while enforcing the objectivity of the Group’s audit process. Complementing the aforementioned corporate auditor and internal audit systems, Mitsui Chemicals’ accounting audit is conducted independently by certified public accountants Mari Sono, Kanji Tamitsu, Shuji Sudo and Shigeyuki Kano of Ernst & Young ShinNihon LLC. Both on an individual and board basis, corporate auditors frequently communicate and exchange opinions with the accounting auditor. Through mutual collabo-ration, all concerned parties endeavor to enhance the account-ing audit function.
The Internal Control Division
Mitsui Chemicals established the Internal Control Division as an internal auditing unit responsible for auditing the account-ing practices and business operations of the Mitsui Chemicals Group, including Group companies, based on annual audit plans deliberated and decided on in advance by the Management Committee. The principal role of the Internal Control Division is to ensure that the Group adheres strictly to all laws and regulations, and audit results are reported to the Management Committee. In addition to evaluating the effec-tiveness of the Group’s financial reporting procedures and capabilities, as prescribed under the Financial Instruments and Exchange Law, the Internal Control Division provides instruc-tional advice and guidance on an as-required basis to secure steady improvements in the adequacy and efficiency of busi-ness operations in individual divisions.The Mitsui Chemicals Group’s internal control systems as they relate to financial reporting have been deemed effective as of March 31, 2009.
Risk Management System Basic Policy
The Mitsui Chemicals Group is committed to thoroughly managing threats to its business activities in the form of risk, including that related to accidents, fire, market trends, busi-ness strategies and efforts to fulfill its social responsibility. The Risk & Compliance Committee, headed by the board director responsible for risk management, was established to review the Group’s risk management policy as well as maintain and operate its risk management system in accordance with estab-lished risk management regulations. Mitsui Chemicals’ basic risk management philosophy emphasizes early discovery as the principal means of pre-venting the materialization of risks. To this end, the Company introduced a Plan, Do, Check and Action cycle pertaining to risk management in line operations, for which the president bears ultimate responsibility. Mitsui Chemicals is boosting its readiness to prevent risk across the entire Group, including at subsidiaries and affiliates. As an adjunct to the aforementioned initiatives, the Company has established a risk hotline to facilitate the prompt reporting of identified risk. Employees who uncover poten-tial internal illegal activities can report their suspicions to and consult directly with the Risk & Compliance Committee or an outside attorney. In accordance with the Group’s internal rules and regulations, employees are assured that any consultation or report of a compliance violation will not result in their suffer-ing adverse repercussions or penalties. In the fiscal year ended March 31, 2009, Mitsui Chemicals received 16 reports and requests for consultation.
Business Continuity Plan
Mitsui Chemicals has formulated a business continuity plan (BCP*) to go into effect in the event of a major earthquake in the Tokyo metropolitan area. The plan calls for the creation of an emergency headquarters to quickly establish a command and control structure in the event head office functions become paralyzed as well as emergency customer response centers to provide prompt and appropriate support to the Group’s cus-tomers. In addition, BCPs have been created for coping with outbreaks of new strains of influenza and large-scale accidents anywhere within the Group’s plant network.
*: Business Continuity Plan (BCP): A practical plan for how an organiza tion will minimize the decrease in business activity levels as well as recover and restore partially or completely interrupted critical functions within a predetermined time after a disaster or extended disruption.
Risk & Compliance Management

11
Compliance
The complete awareness, understanding and appreciation of compliance of every employee are necessary and essential to a sound compliance structure and system. This includes full knowledge of the laws and regulations that must be observed. In its efforts to promote compliance throughout the Group, Mitsui Chemicals utilizes four broad tools: awareness-raising training to increase compliance awareness; workplace discus-sions encompassing case studies of various statutory and regulatory violations; training on the observance of laws and regulations to advance compliance knowledge; and a compli-ance handbook, which employees can refer to at any time.
Training on the Observance of Laws and RegulationsThe Mitsui Chemicals Group conducts training on statutory and regulatory compliance in an effort to improve employee knowl-edge of compliance matters. Training courses are currently divided into 15 subjects, each dealing with a specific law that is vital for employees in the conduct of their business activities. Of the aforementioned 15 subjects, e-learning classes have been created for 14 subjects. The subjects that employees must study are determined by individual duties. In order to ensure that employees keep abreast of the latest information and requirements, refresher courses must be taken every three years. As of fiscal 2009, a cumulative total of 29,000 employees had completed the rel-evant training requirements.
Promoting Compliance through Guidebook DistributionIn 2003, the Mitsui Chemicals Group published a compliance guidebook containing important information on how to bet-ter observe compliance. In an effort to boost awareness and understanding, updated editions in both Japanese and English were published in 2006 and distributed to all Group employ-ees. In addition to the existing Japanese and English editions, a Chinese-language guidebook encompassing relevant Chinese laws and regulations was published in 2009 and distributed to the employees of local subsidiaries in China. Through published materials, the Mitsui Chemicals Group strives to continuously promote compliance.
Takeover Defense Measures
Following the ordinary general meeting of shareholders held on June 26, 2007, Mitsui Chemicals adopted countermeasures against the large-scale acquisition of its shares effective for a period of three years. Mitsui Chemicals believes that the composition of its share-holders should be determined through free market transac-tions and that the final decision of whether to accept or reject a large-scale acquisition of the Company’s shares that would result in a transfer of control should be based on the will of all shareholders. Therefore, Mitsui Chemicals has adopted certain coun-termeasures to ensure that when deciding whether or not to approve a large-scale acquisition of the Company’s shares, shareholders are provided with sufficient information and time necessary to make an informed decision and to prevent actions antithetical to the interests of shareholders. For detailed information, please refer to the Company’s website: http://www.mitsuichem.com/ir/pdf/070403e.pdf

12
“The Challenge to Create Innovative Values”
Complete 3-dimensional strategy consisting of economy, environmentand society
Create innovative new technologies
Innovative New
Technologies
Environment Society
Economy
Basic Concept of the 08 MTP
05 06 07 08 09
28.5
26.2 26.0
29.1
0
15
20
25
30
10
5
16.0%
0.0%
2.0%
4.0%
6.0%
8.0%
10.0%
12.0%
14.0%
28.7 26.5
10.1%10.1%
42.726.030.2
28.3
11.5%11.5%
10.0% 9.1%9.1%
15.1%
10.5%10.0%
R&D Investment (non-consolidated) Environmental-related % of Environmental-related
Billions of Yen
FY
R&D Investment
Creation of Innovative New Technologies
CSR through R&D
Based on the Grand Design, the Mitsui Chemicals Group’s basic management framework, as well its 2008 Medium-Term Business Plan, Mitsui Chemicals has adopted a balanced approach to management that focuses on the three dimen-sions of Economy (economic growth), the Environment (har-mony with the global environment) and Society (harmony with society). Broadly contributing to society through our main busi-nesses is a concept that we have positioned at the foundation of our CSR efforts. To this end, Mitsui Chemicals believes it is absolutely vital to create innovative new technologies, and is taking up the challenge to create innovative values.
Mitsui Chemicals develops technologies and materials in harmony with the environment while maintaining a competi-tive advantage in its three business sectors: Performance Materials, Advanced Chemicals and Basic Chemicals. In addition to obtaining and maintaining superior levels of R&D competitiveness to drive forward the growth and expansion of the Mitsui Chemicals Group, we aim to vigorously address such themes as global warming, the conservation of fossil fuel resources and other issues that will be of global importance over the next 10 to 15 years by creating innovative new tech-nologies that harmonize with the global environment.
Increasing interest in environmental preservation has made environmental technologies a growth area. Mitsui Chemicals has therefore set management targets that include objectives related to environmental performance. We aim to be actively involved in addressing environmental issues, rather than just viewing such issues as constraints on economic progress. Under the 2008 Medium-Term Business Plan, emphasizing the importance of positioning environmental technologies as a future pillar of growth, we have devoted 15% of R&D invest-ment* to the development of environment-related technologies, an increase of 6 percentage points compared with the same period last year. Moreover, regarding corporate research, we are concentrating on the development of next-generation envi-ronmental technologies, doubling the investment to 30% from the same period a year ago.
R&D Sustaining “CSR through Our Main Businesses”
Direction of R&D
Investment in Environmental Technologies as an Opportunity for Growth
Economy• Strengthening of functional polymers portfolio• Development of innovative processes for olefi n and aroma productsEnvironmentDevelopment of technologies to utilize non-fossil resources• Development of bio-based polyurethane• Development of bio-olefi ns derived from inedible resourcesTechnologies to reduce greenhouse gas• Development technologies for chemical fi xation of CO2
Society • Development of innovative, highly safe processes
*Non-consolidated

13
CO2
H2
H2O
CH3OH
H2
O2
Facility to Realize Industrialization
Separation and capture of CO2
Hydrogen
Photocatalysts
Olefins, Aromas
Methanolsynthesiscatalysts
(Under development)
MCI Osaka Works is the Site of the Successful Synthesis of Methanol using CO2 as a Raw Material In anticipation of a shift away from oil to other resources as raw materials for chemical products, at Mitsui Chemicals we are advancing research into catalysis science. From 1990 to 1999, the Company took part in the “Chemical CO2 fi xation Project,” an initiative launched by the Research Institute of Innovative Technology for the Earth (RITE), and since then has continued to develop catalysts that synthesize methanol from CO2 and hydrogen.
Methanol is normally created from carbon monoxide (CO) and hydrogen. The manufacture of methanol from CO2, on the other hand, is made problematic due to this molecule’s high stability and low reactive properties.
Now, at a pilot facility located at the MCI Osaka Works, we have achieved the world’s fi rst successful synthesis of metha-nol using CO2 as a raw material. As methanol is a raw material for an array of chemical products, current annual production of this substance amounts to 40 million tons worldwide. If the raw material for methanol were changed to CO2, it is conceiv-able that an enormous amount of CO2 could be turned into a resource, thus contributing to reduction of greenhouse gases.
Case Study 1
CO2 Fixation Chart
Comment from Pilot Facility EngineerOur pilot facility has the capacity to produce approximately 100 tons of methanol per year. In addition to confi rming the ability to withstand catalyst operations , we accumulated the design data required to put a manufacturing plant into full operation in trials. Together with the entire Group, Mitsui Chemicals emits 5.14 million tons of CO2 every year. However, if this manufacturing method were to be fully utilized, not only would CO2 emissions balance out at zero, we would generate 3.7 mil-lion tons of methanol every year.
Toshihiro Takai Unit Leader, Process Unit Process Technology Center, Production & Technology Center
Ensuring Clean Technology that Reduces Greenhouse Gases

14
The“Carbon Neutral”Approach
H2OCO2
Released back into the atmosphere
Absorb and fixes CO2
Photosynthesis
Material processing
Use of resourses
Sunlight
Plant resources
Combustion
Biomass plastic (plant-derived polyurethane) Plant-derived
raw materials
Case Study 2
Aiming to bring about a “Copernican Revolution” in plastics manufacturing by replacing petroleum with non-petroleum materials, Mitsui Chemicals has succeeded in the develop-ment of polyurethane derived from inedible castor oil. Plant-derived polyurethane is a type of “biomass plastic.” Biomass plastics are made from plants that have absorbed CO2 from the atmosphere. When they are incinerated for thermal recycling they emit only as much CO2 as they have absorbed; therefore, they do not increase the CO2 con-centration in the atmosphere. This is called “carbon neutral”. Isocyanate and polyol are the major raw materials of polyure-thane. Mitsui Chemicals has been able to utilize inedible castor oil for polyol production, thereby developing a technology that contributes to the realization of carbon-neutral products. Polyurethane made from plant-derived castor oil-based polyol can be produced at various hardness levels, from flex-ible foam-like, low-resilience foam pillows and automotive seat cushions to rigid foam-like insulation. Thanks to promotional efforts, this product was adopted for automotive seat cush-ions in fiscal 2010. Mitsui Chemicals will continue to promote technological innovation aimed at wider product applications in pursuit of economic competitiveness.
Pursuing Further Technological InnovationThe current plant-derived polyurethane replaces only polyol with a non-petroleum-derived material. Mitsui Chemicals will achieve 100% petroleum-free polyurethane when it develops a plant-derived substitute material for isocyanate. Therefore, Mitsui Chemicals is working full out to develop 100% plant-derived polyurethane.
CSR through R&D
Making Plastic from Non-Petroleum Materials
The amount of CO2 that is fixed during cultivation is the same as the amount of CO2 that is released when the vegetable matter is incinerated. For this reason, the level of carbon moving in either direction is considered to be zero.
*Castor oil: Oil from the seeds of the castor plant (Ricinus communis), whichis in the spurge family (Euphorbiaceae).
Polyurethane Foam Made from “Inedible” Castor Oil
Plant-derived polyurethane developed by Mitsui Chemicals uses as its raw material inedible oil from castor seeds, which can be grown with little or no impact on food production, and thus helps to address issues related to food.
On the far left are castor seeds used as raw materi-als. To the right, castor oil is processed and refined into ricinoleic acid, which is used to make castor oil-based polyol, shown on the far right.
Two types of polyurethane foam with different level of hardness, which are made from castor oil.
Utilizing Inedible Castor Oil* forPlant-Derived Polyurethane

15
Mitsui Chemicals’Biocatalyst Technology
CO2
H2H2O
Molasses, Wood
Fatty acid
Glycerin
Alcohol
Methanol
Isocyanate
Polyol
Phenol
Lactic acid
Polyurethane
Olefins
Polylactic acid
Polyolefin
Biocatalyst technology
Plant oil(Castor oil)
Sugars
Microorganism
Recombined microorganism
Introduce useful genesE.coli etc.
Needless genesDelete needless genes
Useful genes
Practical Application of “Next-Generation Fermentation”—Development of Biocatalysts for Manufacturing Useful ChemicalsMitsui Chemicals positively engages in the development of technologies for utilizing non-fossil resources through the application of biocatalyst technology. In particular, fermentation technologies offer highly promising ways of converting non-fossil materials into chemicals using sugars, including glucose, as raw materials. Owing to the recent advance in gene-recom-bination technologies, it is now possible to produce certain chemicals that once could not be created by conventional fermentation methods. The new methodology is called next-generation fermentation. Currently, Mitsui Chemicals’ Catalysis Science Laboratory is developing an innovative manufacturing technology for use-ful chemicals using next-generation fermentation. The process includes the isolation of useful genes from a microorganism that produces a target compound, and introduction of these genes into another microorganism, such as E. coli, which can be widely used on an industrial scale. Subsequently, unneces-sary genes involved in the production of unwanted byproducts will be removed to create an ideal recombinant microorgan-ism. The new microorganism, or a biocatalyst, can be used to manufacture useful chemicals. The practical application of biocatalysts for manufacturing useful chemicals will enable the commercialization of propyl-ene derivatives, phenols and polylactate derived from inedible biomass materials such as wood. This would revolutionize the conventional chemical manufacturing process. At the end of April 2009, the Company completed the construction of a medium-scale testing facility in Mobara, Chiba Prefecture, and commenced testing of fermentative production using a bio-catalyst. Working in association with the Process Technology Center, the Company is striving to accelerate the development of both biological catalysts and bioprocesses, with the aim of realizing the earliest possible practical application.
Case Study 3
Mitsui Chemicals’ Advantage in Biocatalyst Development TechnologyMitsui Chemicals possesses E. coli that can be used to effi -ciently and selectively produce such chemicals as isopropyl alcohol (a raw material of propylene) and L-/D-lactic acids (a raw material of polylactic acid), boasting a world-class record in this area. With regard to D-lactic acid, for example, our bio-catalyst has a fi ve times higher productivity than the wild type E. coli, while its production of byproducts is one sixtieth of that of the wild-type level. This achievement is attributable to the Company’s competi-tive edge: its high gene recombination technology. Based on this technology, Mitsui Chemicals has developed technologies for introducing useful genes and deleting unnecessary genes, technologies that are 100 times more effi cient than the tech-nologies possessed by our competitors. In short, the development of biocatalysts by Mitsui Chemicals has led to the possibility of manufacturing many useful chemicals that can be used now and in the future.
Innovating the Chemical Manufacturing Process with Biocatalyst Technology
R&D Direction Regarding Environmental Concerns —Utilization of Inedible Resources —
This is only an image of a microorganism.

16
Creative Forums Shared Experience
The Global Science Network
Utilization of the Mitsui Research Triangle• Close collaboration among R&D centers in three locations in Chiba• Promotion of communication between researchers
Human Resource Development• Research fellow system• Dispatch of researchers (inside and outside Japan)• Training (expert technical education, marketing, intellectual property, etc.)
Information Dissemination• Presentations at academic conferences • Publication in academic journals
Collaboration with Industry,Academia and Government• Researcher advisor system• Promotion of joint research
Contribution to the Sustainable Development of Science and Technology• International symposia• Mitsui Chemicals Catalysis Science Award
CSR through R&D
Human Resources Management for Mitsui Chemicals’ R&DWith the establishment of the Human Resources Management Policy, the Mitsui Chemicals Group is taking action under two policies, namely, “toward the sustainable growth of the Group” and “toward the happiness and self-fulfillment of employees.” Fundamental to Mitsui Chemicals’ way of thinking is the impor-tance of treating its people well, an approach that enables the Company and its employees to stimulate and help each other to improve. In its R&D activities, the Mitsui Chemicals Group actively promotes the dispatching of its researchers to major universi-ties both in Japan and overseas for the purpose of conduct-ing joint research projects. In addition, the Research Fellow System supports those who have advanced knowledge and techniques while also providing a goal for other researchers aiming to become R&D specialists. The Group is also keen to provide professional technological training as well as educa-tional programs focusing on marketing and intellectual property. In this manner, the Mitsui Chemicals Group places particular emphasis on efforts to both nurture and effectively utilize R&D personnel. Mitsui Chemicals takes great pride in its Sodegaura Center, which, with over 1,200 researchers and engineers from Mitsui Chemicals and its Group companies, is the largest domestic R&D facility operated by a Japanese chemical company. This is a venue for “creative collaboration” and “experience sharing” where researchers from diverse backgrounds and with differ-ent approaches actively exchange opinions and ideas. The Sodegaura Center also serves as a venue for nurturing R&D personnel and for creating innovative new technologies and new materials.
Global Science Network Accelerates R&D Activities
Making Effective Use of the Global Science NetworkAgainst a backdrop of rapid development of globalization, the Mitsui Chemicals Group makes across-the-board efforts to acquire and develop human resources who can leverage their capabilities in the global market. By doing so, the Group is striving to secure its competitive edge. Apart from the internship and scholarship systems, the Mitsui Chemicals Group particularly emphasizes special R&D initiatives. The Group, for example, is building a “Global Science Network” that includes leading researchers from around the world in an effort to expand its knowledge base. In addition, many young researchers and students attend various international symposia involving leading scientists, including Nobel Prize Laureates. Accordingly, such symposia have become the venue to foster scientists of the future as well as for providing a means to experience the magnificence of science in more detail.
With the recognition of the growing importance of employees’ “work-life balance” to its business foundations, Mitsui Chemicals has developed a comfortable working environment by providing various programs ranging from child and family care. These include shorter working hours, leave to care for sick or elderly relatives at home, subsidies for babysitting and home-care services and housing and leisure support. The Company has partici-pated in the Work-Life Balance Project of the Ministry of Health, Labour and Welfare as a model company since fiscal 2008, and cooperated in the setting of specific measures to “create a working environment that facilitates a balance between childcare/family care and work” and “support efforts to create a time for relaxation.”
Development of a Comfortable Workplace

17
Bringing Together the World’s Top Specialists in Catalysis ScienceThe Mitsui Chemicals International Symposium on Catalysis ScienceIn March 2009, the Fourth Mitsui Chemicals International Symposium on Catalysis Science (MICS2009) was held. With the aim of “contributing broadly to society through innova-tions and the creation of materials while keeping in harmony with the global environment,” together with the aim of furthering the development of catalysis science, Mitsui Chemicals has been organizing the Mitsui Chemicals International Symposium on Catalysis Science (MICS) since 2003. The themes of the first, second and third symposia were “Advanced Catalysts for Polymers,” “Green Catalysts for Specialty Chemicals” and “Polymerization Catalysis–Current Status and Future Prospects.” At each symposium, world famous scientists in the field of catalysis science were invited to deliver lectures, after which they engaged in lively discussions with enthusiastic sym-posium participants. The Fourth Mitsui Chemicals International Symposium (MICS2009), under the theme of “Catalysis Science and Its Contribution to Future Human Development,” discussed the current status and future prospects of catalysis science, which plays a key role in resolving issues encompassing the environ-ment, energy and preservation of precious resources in the 21st century as well the sustainable development of future mankind. On the first day, the Nobel Prize Laureate in Chemistry for 1981, Professor Roald Hoffmann of Cornell University, deliv-ered a plenary lecture. The symposium was held free of charge and was attended by 1,600 people from around the world. Of particular note were the more than 300 students who attended and who will be the scientists of the future. Mitsui Chemicals intends to continue hosting the International Symposium as a forum for an extensive as well as an intensive interchange of opinions among researchers worldwide for the purpose of building upon existing knowledge.
Professor Roald Hoffmann, a theoretical chemist, has taught his colleagues how to think about the electrons influencing molecular structure and reactivity. He has developed approximate methods for calculating electronic structure and introduced new ways of thinking about electrons in molecules that have led to a better under-standing of stereoselectivity in organic chemical reactions (The Woodward-Hoffmann rules). He was awarded the 1981 Nobel Prize in Chemistry jointly with Dr. Ken-ichi Fukui “for their theories, developed independently, concerning the course of chemical reactions.” He is not only a chemist but also a writer of poems, plays and nonfiction, often related to science, but reaching a general audience. Prof. Hoffmann kindly lectured at MICS2009 under the title “Chemistry's Essential Tensions: Different Ways of Looking at a Science," a theme that focused on chemistry and its relationship with history, culture and art.
Professor Hoffmann’s Achievements
Kazusa Academia Hall (Kisarazu, Chiba Prefecture)
Professor Roald Hoffmann (Cornell University, U.S.A.)
Professor Henri B. Kagan (Universite Paris-Sud.)

18
GrowingPerformance materials Business Sector positions the burgeoning energy sector as a key market and is striving to reinforce the foundations of its solar cell-related business, with the aim of achieving ¥20 billion in sales in fiscal 2012.
Special Feature
19
Growing▲
▲
▲
Expanding Business for Photovoltaic and Secondary Battery- Related Materials
Establishment of Solar Cell Battery Components Development Dept. —Demonstrating Our Collective StrengthIn August 2008, Mitsui Chemicals set up the Solar Cell & Battery Components Development Dept., which was given the mission of imme-diately constructing a comprehensive business strategy for Photovoltaic and Secondary battery-related materials and accelerating the development of new products. Having positioned the high-growth renewable energy mar-ket as one of its focus areas, Mitsui Chemicals is taking the following steps to expand the energy market’s photovoltaic- related business.
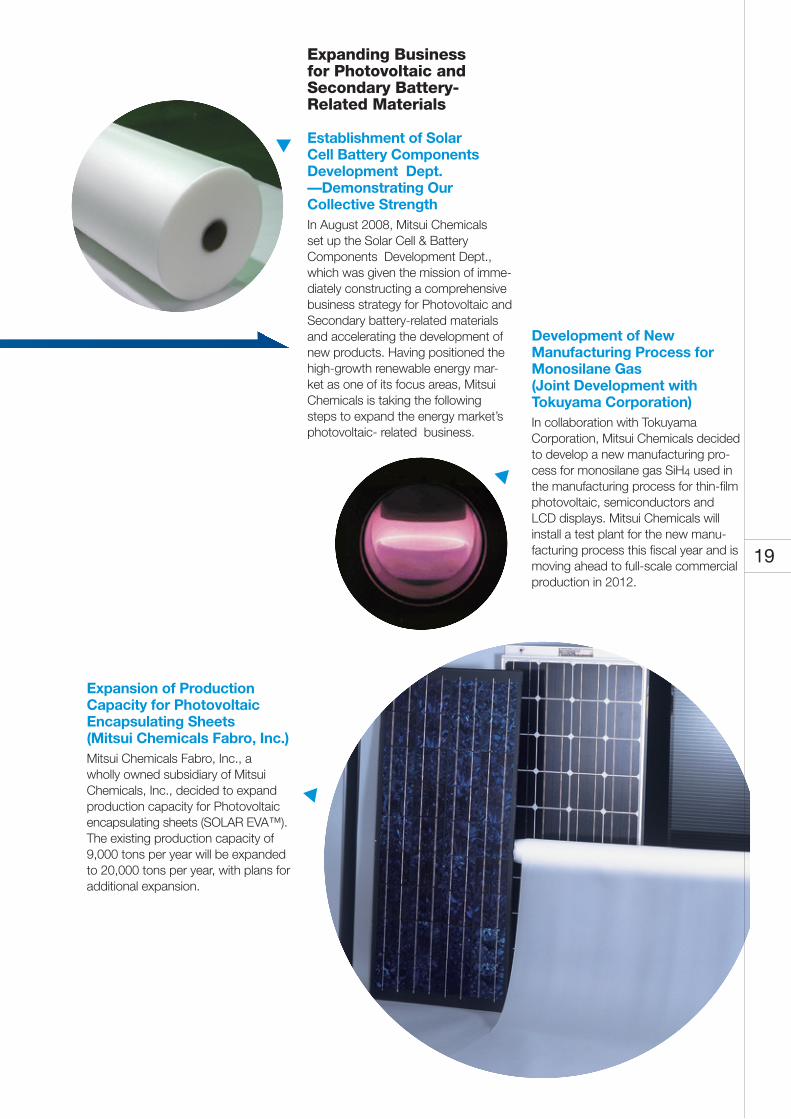
Expansion of Production Capacity for Photovoltaic Encapsulating Sheets (Mitsui Chemicals Fabro, Inc.)Mitsui Chemicals Fabro, Inc., a wholly owned subsidiary of Mitsui Chemicals, Inc., decided to expand production capacity for Photovoltaic encapsulating sheets (SOLAR EVA™). The existing production capacity of 9,000 tons per year will be expanded to 20,000 tons per year, with plans for additional expansion.
Development of New Manufacturing Process for Monosilane Gas (Joint Development with Tokuyama Corporation)In collaboration with Tokuyama Corporation, Mitsui Chemicals decided to develop a new manufacturing pro-cess for monosilane gas SiH4 used in the manufacturing process for thin-film photovoltaic, semiconductors and LCD displays. Mitsui Chemicals will install a test plant for the new manu-facturing process this fiscal year and is moving ahead to full-scale commercial production in 2012.

20
ExpandingAdvanced Chemicals Business Sector is to be Mitsui Chemicals’ “third pillar” by expanding the business scale of prospective growth fields such as, vision care materials, agrochemicals, and cata-lysts, especially through the aggressive leveraging of business collabo-ration with other companies.
Special Feature

21
Expanding▲
▲
▲
Mitsui Chemicals Agro, Inc.
A Member of the Mitsui Chemicals GroupAs an integral component of the core advanced chemicals business, Mitsui Chemicals Agro leverages the man-agement resource capabilities it has cultivated in the areas of R&D, technol-ogy and sales to create new value as a drug-discovery-oriented company. The company works diligently to provide in a timely manner competitive high-performance agrochemical and non-crop specialty products and services that are superior in terms of safety and function and that exert minor impact on the envi-ronment.
Business StrategiesMitsui Chemicals Agro will take steps to increase its share of the domestic market by strengthening its R&D capabilities, expanding its product lineup and further promoting sales. Overseas, the company will aggressively pursue market devel-opment in Europe, North America and Asia, all of which are expected to experi-ence significant increases in demand. Net sales of approximately ¥50.0 billion are forecast in fiscal 2010 with plans to double this figure in 2015 by comple-menting the above measures with efforts to expand the scale and scope of sales activities through strategic collaboration and tie-ups.
Product DevelopmentMitsui Chemicals Agro develops active ingredients and formulations for insecti-cides, fungicides and herbicides. In fis-cal 2010, we introduced two new active ingredients. There are now eight chemical compounds in our development pipeline that will be evaluated for usefulness in Japan and abroad. In the current fiscal year, we plan to launch 13 new chemical formulations.
Molecular model of MilbemectinMilbemectin is an active ingredi-ent of our insecticide/miticide, “MilbeknockTM”, “KoromiteTM” and “Matsu guardTM”
Molecular model of DinotefuranDinotefuran is an active ingredient of our insecticide, “StarkleTM,” “Starkle mateTM” and “AlbarinTM”.

22
Basic Chemicals make up 60% of Mitsui Chemicals’ net sales and are a revenue source that the Company counts on. Although fierce competition from the mass influx into Asia of inexpensive ethylene products from the Middle East is expected, we will work to strengthen our international competitiveness by increasing sales of competitive products that are based on our unique technologies, forging more regional partnerships and expanding the number of production sites.
Competitive
Special Feature

23
▲Competitive
▲
▲
Overseas strategies:
Ensure greater cost-competitiveness through the use of our own unique technologies and fortify and expand businesses in which we hold a competitive edge by increasing the number of production sites in Asia.
1. Leveraging our innovative in-house developed catalysis and process technologies, we will dramatically improve the cost-competitiveness of new plants for producing phnol, bisphenol A and propylene, which are to be constructed in the next period.
2. We will capture growth markets in Asia by building new production sites.
• Phenol/bisphenol A: In addition to the bisphenol A plant that came on stream in Shanghai, through our alliance with Sinopec, we will build a new phenol and second bisphenol A plant in China as well as new phenol and bisphenol A plants in Singapore.
• Polypropylene Compound: In addition to the new production site completed in India, we will expand existing sites in North America, Thailand and China.
Domestic strategies:
Reshuffle our business portfolio with differentiated technologies and design a top-class business petroleum complex by forging regional partnerships with oil refining companies.
1. Shut down plant producing EG, for which competition is intensifying. Utilize surplus ethylene, increase pro- duction capacity for metallocene products (EvolueTM, m-HDPE and m-PP) and produce 1-hexene inter- nally using our high-performance catalyst developed in-house.
2. Strengthen our cost-competitiveness through regional partnerships that have helped us to obtain the stable procurement of aroma raw materials, to increase the production of propylene that utilizes C4-fraction by-products, and to use cold LNG energy. Taking this a step further, by working together with Idemitsu Kosan to optimize production of naphtha cracker, refinery equipment and petrochemical products, we will achieve competitiveness as a top-class domestic petroleum complex.

24
Main Products
Food packagesN ADMERTM
(adhesive for resins of differ-ent properties)N CHEMIPEARLTM
(adhesive for resins of differ-ent properties)N TPXTM
(methylpentenecopolymer) N Mitsui HI-WRAPN TakenateTM
(Main components for packing adhesives)N TakelacTM (Main components for Packing adhesives)
Gas pipesN Mitsui PE gas pipe
system(pipes and fittings)
Gear oil/engine oil additiveN LUCANTTM
HosesN Mitsui EPT
Resin for headlamplensesN Bisphenol A(raw material for polycarbonate resin of high transparency and impact resistance)
Pipes and fittingsfor cold/hot waterN ELMEXTM
Instrument panelsN MILASTOMERTM
N CosmonateTM
(TDI) N ActcolTM
(PPG) N PRIME POLYPROTM
N TAFMERTM
CushionsN CosmonateTM
(TDI) N ActcolTM
(PPG)N TAFNELTM
(spunbonded nonwoven polypro-pylene matting)
AntifreezeN Ethylene glycol
Battery separatorN HI-ZEX MILLIONTM
(ultrahigh molecularweight poly-ethylene)
BumpersN PRIME POLYPROTM
N TAFMERTM
(material modified with impactre-sistant resin)N UNISTOLETM
(primer for painting resin)
Tire adhesiveN Resorcinol
TermicideN MikeblockTM
N VermitolTM
N LenatopTM
Mud guardN MILASTOMERTM
* Adblue is trademark of Verband der Automobilindustire.
Glass run channelN LUBMERTM
Rear monitoringcamerasN PLAPACSTM
(plastic package for image sensors)
Gasoline tanksN HI-ZEXTM
N ADMERTM
Clear coat paintN ALMATEXTM
NOx reducing additive agent diesel-powered vehiclesN AdBlue*TM
(high-quality aqueous urea)
Flat panel displaysN NOTIOTM
(Polyolefin Elastomer Designed by controlled crystal structure on a nano scale)N Functional dyesN PRIME POLYPROTM
Digital camerasN PLAPACSTM
(plastic packages for image sensors)
CDs and DVDsN Bisphenol A(raw material for highlytransparent polycarbonate resin)
HDD suspensionsN NEOFLEXTM
(All polyimide flexible cop-per clad laminates)
N ARLENTM
(heat-resistant resin suit-able for use with lead-free solder)N Nitrogen trifluoride(cleaning agent for semi-conductor and liquid crys-tal production equipment)N Monosilane(raw material for siliconmembranes)N Bisphenol A(raw material for poly-carbonate resin of high impact resistance and weather resistance)
Personal computersN LC-STRUCTBONDTM
(liquid crystal sealant)N ICROS TAPETM
(protective tape used when grind a backside of semi-conductorwafer)N Mitsui MP(dust-proof membrane applied on photo mask)N OPULENTTM
(release film for the processof manufacturing flexiblecircuit boards)
DVD drivesN APELTM
(resin used in pickup lenses)
Disposable diapersN SYNTEXTM
(nonwoven fabrics for softdiapers)N ESPOIRTM
(liquid impermeable andwater vapor permeablemicroporous film)
Mobile phonesN NEOFLEXTM
(flexible printed-circuit board materials)N PLAPACSTM
(pre-mold plastic package for image sensors that excels in humidity resistance and dimen-sional accuracy)N APELTM
(materials for compact and highly precise camera lens)N OPULENTTM
(release film for printed circuit board)
PrintersN Mitsui EPT(used in printer paperfeeder/discharger rolls)N Hi-WAX(toner additive)N FTRTM
(toner additive)N ALMATEXTM
(toner binder resin)N TakenateTM
(Casting prepolymer)N HiprenTM
(Casting prepolymer)N AURUMTM
(thermoplastic polyimide)
Newspaper andcorrugated cardboardN Acrylamide(raw material for paper rein-forcing agent)N BONRONTM
(paper processing resin)
SneakersN TAFMERTM
(midsoles)
Insulator forrefrigeratorsN CosmonateTM
(TDI)N ActcolTM
(PPG)
Tea bagsN SWPTM
(heat-seal type tea bags)
Polyester fibersN Purified terephthalic
acidN Ethylene glycol(polyester fiber feedstock)
Detergentand food packagesN HI-ZEXTM
N ULTZEXTM
N EVOLUETM
N PRIME POLYPROTM
N MIRASONTMDrugN Taurine
PET bottlesN Mitsui PETN PRIME POLYPROTM
Lithium batteryN MiReTTM

25
Electric wire sheathingN HI-ZEXTM
N EVOLUETM
Raw material for transparentresin for windowsN Bisphenol A(raw material for polycarbonate resin of high trans-parency, weather resistance and impact resistance)
FertilizerN Urea
Solar cellsN SOLAREVATM
(photo voltaic solar module encapsulating sheets)N Monosilane(raw material for silicon mem-branes)N TakenateTM
(Urethane adhesives for back-sheet)N TakelacTM
AgrochemicalsN TrebonTM
N StarkleTM
N AlbarinTM
N KoromiteTM
N MilebeknockTM
(dinotefuran) termicideN TachigarenTM
N NebijinTM Products(flusulfamide) Ingredients fungicide Soil fungicideN ChloropicrinAgricultural soil fumigant
GlassesN MR series(materials for high refrac-tive-index plastic lenses)
Medical instrumentsN PGA pellet (Bioabsorbable medical material)N Dental Materials
Prosthetic limbN HI-ZEX MILLIONTM
(ultrahigh molecularweight polyethylene)
Drug packagesN APELTM
N BAREXTM
N UNISTOLETM
MasksN SINTEXTM
N TECHNOROTETM
DisinfectantsN Meta/para-cresol
Infusion bagsN ULTZEXTM
N PRIME POLYPROTM
The Mitsui Chemicals Group divides its business activities into three segments, offering society a variety of products used in both consumable and durable goods, spanning a broad range of fields, from automobiles, electronics and IT to medical, health-related, agricultural, housing, construction and household products.
A variety of raw materials useful in our daily lives, pro-cessed through chemical technologies from petroleum and natural gas
Performance products from Mitsui Chemicals' organic chemistry and bio-chemistry
Materials with unique functions from Mitsui Chemicals' original catalyst and polymer technology
Performance Materials
Advanced Chemicals
Basic Chemicals
Hybrid rice seedsN MitsuhikariTM
2003, 2005

26
¥504.1 billion600
500
400
300
200
100
60
40
30
20
0
(10)
(20)
0
10
50 ¥431.8 billion
¥35.9 billion
¥(16) billion
FY08 FY09
Performance MaterialsBusiness Sector
“
”
Review of Operations
MAIN PRODUCTS• EPT (ethylene-propylene diene terpolymer)• MILASTOMER™ (thermoplastic olefin elastomer)• TAFMER™ (alpha-olefin copolymers)• Polyethylene wax• Nonwoven fabrics for hygiene materials and breathable films• TPX™ (methylpentene copolymers)• APEL™ (cycloolefin copolymers)• HI-ZEX MILLION™ (ultra-high molecular weight polyethylene)• NF3 gas• ICROS TAPE™ (protective tape for silicon wafer)• NEOFLEX™ (flexible printed circuit board materials )• PLAPACS™ (packages for CCD/CMOS image sensors)• Toner binder resins• Urethane chemicals (TDI/MDI/PPG)• Polyurethane• SOLAR EVA™(photovoltaic solar module encap sulating sheets)
Leveraging its global network, focusing mainly on Asia, Mitsui Chemicals strives to secure robust demand by strength-ening and expand-ing its activities in competitively priced, lightweight, envi-ronmentally friendly products.
OverviewAutomotive and industrial material sales decreased 6% year on year. In the first half of the fiscal year, domestic demand increased. In this sector, steps were taken to cultivate new customers, focus-ing mainly on Asian markets. These fac-tors were offset, however, by the sharp decline in automotive market demand from early autumn, which contributed to weak results. Industrial material sales contracted 7% compared with the previous fis-cal year. This was again attributable to the abrupt drop in demand from early autumn and countered growth in demand in the first half of the fiscal year for base resins for paint and polyolefin-based waxes. Hygiene material sales increased 8% compared with the previous fiscal year as demand for non-woven fabrics expanded in East and Southeast Asia, particularly in the Thai and Chinese mar-kets. Special polyolefin and engineering plastics saw a drop in demand mainly for IT-related uses. This led to a year-on-year decline in sales of 19%.
Semiconductor material sales were weak falling 24% compared with the previous fiscal year. This was attribut-able to the downturn in market demand as well as falling prices. Energy material sales surged 47% year on year on the back of robust demand for solar cell encapsulent mate-rials. Polyurethane sales decreased 27%. In addition to the sudden slow-down in demand for TDI/MDI, this downturn was caused by deterioration in market conditions overseas and appreciation in the value of the yen. Reflecting the aforementioned fac-tors, segment sales declined ¥72.3 billion compared with the previous fiscal year to ¥431.8 billion, comprising 29% of total sales. The segment recorded an operating loss of ¥16.0 billion, down ¥51.9 billion year on year. Despite efforts to curtail costs, this was attribut-able to a variety of factors, including hikes in raw material and fuel prices during the first half of the fiscal year, a slump in demand from early autumn and deterioration in market conditions and prices, which resulted in a loss on valuation of inventories.
■Net Sales (left scale)■Operating income (right scale)
Yukio HaraBusiness Sector PresidentPerformance Materials Business Sector

27
Tohcello Co., Ltd. Becomes a Wholly Owned Subsidiary of Mitsui Chemicals through a Share Exchange
On April 1, 2009, through a share exchange, Mitsui Chemicals became the parent company of Tohcello Co., Ltd. With this acquisition, the Performance Materials Business Sector strengthened and expanded its func-tional film sheet business by integrating the process of converting resins to film. Tohcello views the packaging film business, mainly for domestic food packaging, and the industrial film busi-ness, including silicone-coated film and heat-resistant release film, as its two key businesses. The packaging film business provides a continuous profit stream that can be reinvested into the business, while the industrial film business is aimed at increasing revenue through the introduction of new products, especially in new business fields. Making Tohcello a wholly owned subsidiary will help both companies reinforce their alliance and further increase corporate value. This initiative will not only help to strengthen product development capabilities and cost-competiveness by ensuring an integrated system from resins to film, but also increase the flexibility and efficiency of management through prompt decision mak-ing and shared management strategies while reinforcing business by maximizing the Group’s film sheet business synergies centered on Tohcello.
Mitsui Chemicals and Mitsui Chemicals Polyurethanes, Inc. Merge
On April 1, 2009, Mitsui Chemicals and Mitsui Chemicals Polyurethanes, Inc. (MCPU), a wholly owned subsidiary of Mitsui Chemicals, engaged in the polyurethane busi-ness, merged. Under the Performance Materials Business Sector’s basic strategy as set out in its 2008 Medium-term Business Plan of “expanding the functional polymer business,” Mitsui Chemicals has positioned the polyure-thane business—a functional polymer business—as the Company’s core business. To sharpen its competitive edge in the expanding ure-thane business, Mitsui Chemicals is merging with MCPU so as to expand business scale through the injection of rapid-acting and focused management resources while optimizing synergistic effects.
Highlights

28
200
150
100
50
0
20
12
10
5
0
¥122.1 billion
¥118.7 billion
¥10.8 billion
¥7.3 billion
FY08 FY09
Advanced ChemicalsBusiness Sector
“
”
OverviewOphthalmic lens materials as well as such healthcare materials as pharma-ceutical intermediates showed steady growth. In the fiscal year under review, sales increased 8% year on year. Chemical products, including polymerization inhibitors and materials for wood/tire adhesives experienced difficult conditions. Despite efforts to revise product prices in the wake of sharp hikes in the prices of raw materi-als and fuels during the first half of the fiscal year, sales decreased 26% due to a sluggish economy resulting in low demand. Agrochemical product sales edged up 2% compared with the previous fis-cal year. This was mainly attributable to firm sales of insecticides.
Review of Operations
Through strategic collaboration and tie-ups, Mitusi Chemicals is accelerating efforts to foster next gen-eration businesses as well as to expand its activities in each of the vision care, agrochemicals and catalyst domains.
MAIN PRODUCTS
• Ophthalmic lens materials• Plastics/glass coating materials• Pharmaceutical chemicals• Dental-related materials• Olefin polymerization catalysts• Polymerization inhibitors and materials for wood/tire adhesives• Insecticides• Fungicides• Herbicides• Paddy rice seeds
As a result, segment sales fell ¥3.4 billion to ¥118.7 billion, accounting for 8% of total sales. Despite growth in sales of insecticides and other prod-ucts, operating income contracted ¥3.5 billion year on year to ¥7.3 billion. Results were impacted by the sharp rise in raw material and fuel prices during the first half of the fiscal year under review and the sudden slump in demand, mainly for chemical products, from early autumn.
■Net Sales (left scale)■Operating income (right scale)
Kiichi SuzukiBusiness Sector PresidentAdvanced Chemicals Business Sector

29
Acquisition of U.S.-Based SDC Technologies, Inc.
As a part of the Group’s efforts to open up several promis-ing new areas, including entry into ophthalmic lens coating materials, Mitsui Chemicals acquired all of the outstand-ing shares of Silvue Technologies Group, Inc., the holding company for SDC Technologies, Inc., which manufactures and sells high-performance coating materials for plastics and non-ferrous metals, in June 2008. Looking ahead, every effort will be made to strengthen and expand the core Vision Care Material business by leveraging technological synergies inherent in each com-pany’s existing activities.
Business and Capital Tie-up with Shofu Inc.
To develop the medical materials business,particularly den-tal-related materials, into a next-generation core business, Mitsui Chemicals, Sun Medical Co., Ltd. (MCI subsidiary)and Shofu Inc. concluded an agreement for a business andcapital tie-up in May 2009. With the business environment becoming increasingly adverse due to governmental control of medical remunera-tion and the globalization of markets, the tie-up will fortify each company’s business capability by promoting the effi-cient use of management resources especially in its area of specialization while increasing market presence and raising corporate value.
Highlights
Agrochemicals Division and Sankyo Agro Co., Ltd. Merge
In March 2007, Mitsui Chemicals acquired Sankyo Agro Co., Ltd. from Sankyo Co., Ltd. (currently Daiichi Sankyo Co., Ltd.). To bolster its standing in the core agrochemicals business, this wholly owned subsidiary was merged with the Company's Agrochemicals Division in April 2009 to form Mitsui Chemicals Agro, Inc. Striving to maximize the synergistic effects of the merger by integrating the former Agrochemicals Division's capabilities in active ingredient discovery, development and manufacturing with the for-mer Sankyo Agro's renowned formulation technology and sales/marketing capabilities, the new company is work-ing to create a comprehensive operational structure that extends from the early discovery of active ingredients to the distribution of end-use products in the agrochemicals market.

30Business Sector
120
80
40
0
60
30
0
(30)
¥1,111.2 billion
¥912.8 billion
¥33.4 billion
¥(32.0) billion
FY08 FY09
Basic Chemicals
“Review of Operations
MAIN PRODUCTS• Ethylene • Propylene• Phenol• Bisphenol A• Acetone• Purified terephthalic acid (PTA)• PET resins• Ethylene glycol• Ethylene oxide• Polyethylene • Polypropylene• Licensing
In the Basic Chemicals Business Sector, Mitsui Chemicals is endeav-oring to reinforce its ability to compete in overseas markets by strengthening and enhancing its competi-tive advantage based on proprietary technol-ogies while launching new businesses built on unique capabilities.”
OverviewEthylene and propylene production declined 13% and 18%, respectively, year on year due to production adjust-ments from August 2008 in response to weak derivative demand. Phenol sales decreased 30% com-pared with the previous fiscal year. In addition to the drop in demand from early autumn forcing a downward adjustment in production, poor results were attributable to weak sales prices due mainly to the decline in raw material and fuel prices. Bisphenol A sales decreased 21%. Production was adjusted downward from early autumn, owing to falling demand for polycarbonate and epoxy resins, the principal uses for bisphenol A and sales prices dropped due to lower raw material and fuel prices. Purified terephthalic acid (PTA) sales decreased 26% compared with the previous fiscal year owing to stagnant demand and the decline in sales prices, which reflected weak raw material and fuel prices. Polyethylene terephthalate (PET) resin sales declined 16% year on year due
mainly to the drop in demand in Japan for bottled drinks. Ethylene glycol, ethylene oxide and derivatives sales were impacted by the slump in demand. Sales of these prod-ucts fell 23% year on year. Polyethylene and polypropylene sales decreased 8% and 11%, respec-tively. Despite product price revisions to accommodate sharp hikes in raw material and fuel prices during the first half of the fiscal year under review, this was attributable to the sudden drop in demand from early autumn. Taking into consideration the afore-mentioned factors, segment sales totaled ¥912.8 billion, down ¥198.4 bil-lion year on year. This represented 61% of total sales. In the fiscal year under review, the Mitsui Chemicals Group reported an operating loss of ¥32.0 bil-lion in this segment, down ¥65.4 billion compared with the previous fiscal year. This substantial negative turnaround was the result of lower sales due to the across-the-board drop in demand and the loss on valuation of inventories owing to weak market conditions and prices.
■Net Sales (left scale)■Operating income (right scale)
Junichi NakagawaBusiness Sector PresidentBasic Chemicals Business Sector
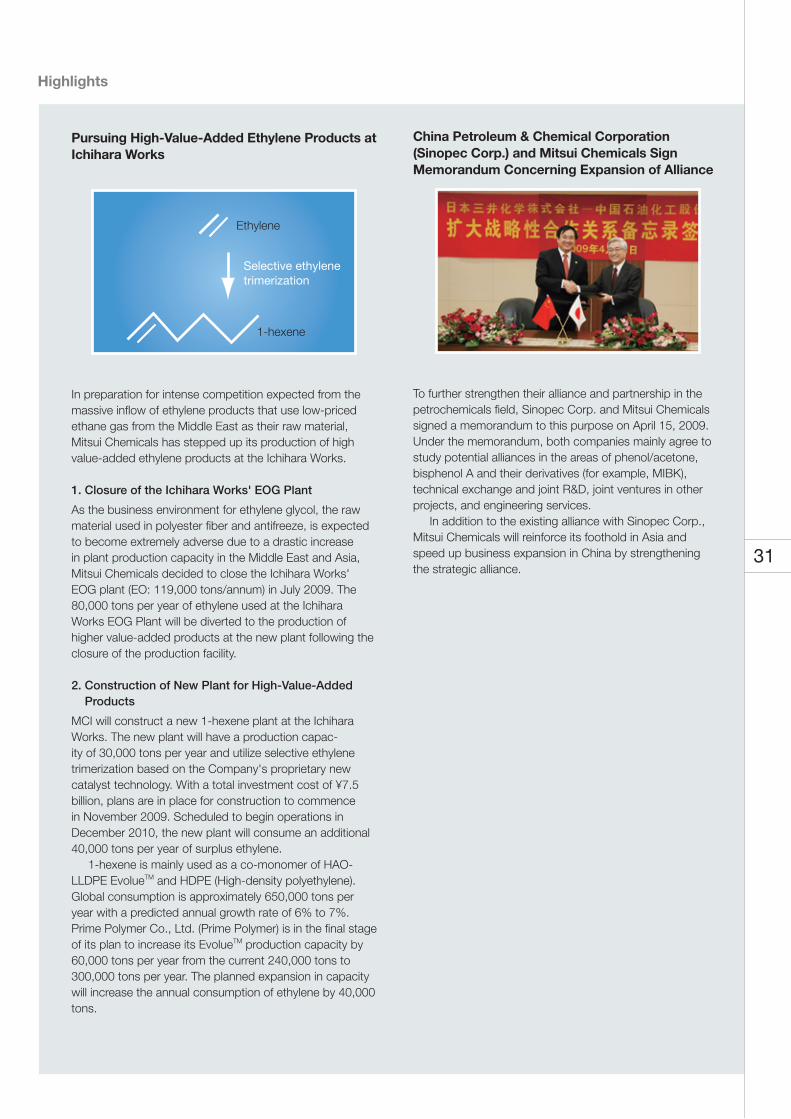
31
Ethylene
1-hexene
Selective ethylene trimerization
Highlights
Pursuing High-Value-Added Ethylene Products at Ichihara Works
In preparation for intense competition expected from the massive inflow of ethylene products that use low-priced ethane gas from the Middle East as their raw material, Mitsui Chemicals has stepped up its production of high value-added ethylene products at the Ichihara Works.
1. Closure of the Ichihara Works' EOG Plant
As the business environment for ethylene glycol, the raw material used in polyester fiber and antifreeze, is expected to become extremely adverse due to a drastic increase in plant production capacity in the Middle East and Asia, Mitsui Chemicals decided to close the Ichihara Works' EOG plant (EO: 119,000 tons/annum) in July 2009. The 80,000 tons per year of ethylene used at the Ichihara Works EOG Plant will be diverted to the production of higher value-added products at the new plant following the closure of the production facility.
2. Construction of New Plant for High-Value-Added Products
MCI will construct a new 1-hexene plant at the Ichihara Works. The new plant will have a production capac-ity of 30,000 tons per year and utilize selective ethylene trimerization based on the Company's proprietary new catalyst technology. With a total investment cost of ¥7.5 billion, plans are in place for construction to commence in November 2009. Scheduled to begin operations in December 2010, the new plant will consume an additional 40,000 tons per year of surplus ethylene. 1-hexene is mainly used as a co-monomer of HAO-LLDPE EvolueTM and HDPE (High-density polyethylene). Global consumption is approximately 650,000 tons per year with a predicted annual growth rate of 6% to 7%. Prime Polymer Co., Ltd. (Prime Polymer) is in the final stage of its plan to increase its EvolueTM production capacity by 60,000 tons per year from the current 240,000 tons to 300,000 tons per year. The planned expansion in capacity will increase the annual consumption of ethylene by 40,000 tons.
China Petroleum & Chemical Corporation (Sinopec Corp.) and Mitsui Chemicals Sign Memorandum Concerning Expansion of Alliance
To further strengthen their alliance and partnership in the petrochemicals field, Sinopec Corp. and Mitsui Chemicals signed a memorandum to this purpose on April 15, 2009. Under the memorandum, both companies mainly agree to study potential alliances in the areas of phenol/acetone, bisphenol A and their derivatives (for example, MIBK), technical exchange and joint R&D, joint ventures in other projects, and engineering services. In addition to the existing alliance with Sinopec Corp., Mitsui Chemicals will reinforce its foothold in Asia and speed up business expansion in China by strengthening the strategic alliance.

32
Japan Foreign
FY09
0
1,500
1,000
500
FY05 FY06 FY07 FY08
795
940
639
884
629
1,173
571
1,148
532
1,017
Number of Japanese and Foreign Patent Applications (Non-consolidated)
Intellectual Property Strategy
1. Mission and Goals
Mission:
Increase the total value of the Mitsui Chemicals Group by fur-ther developing and capitalizing upon intellectual property.
Goals:
Economy
Contribute to Group-wide business objectives with the com-prehensive integration of Group business strategy, R&D strat-egy and intellectual property strategy.
Environment
Develop intellectual property strategy based on the combina-tion of reduction of GHG emissions and utilizing non-fossil resources.
Society
Ensure complete compliance with intellectual property laws.
2. Facilitating Cooperation between Business, R&D and Intellectual Property Divisions
Mitsui Chemicals regards the intellectual properties as a wide range of intangible assets contributing to the business of Mitsui Chemicals, which include not only conventional patents, util-ity models, designs, trademarks and copyrights, but also employee expertise and a variety of internal information. In order to execute the intellectual property strategy, Intellectual Property Division is subdivided into four units: IP manage-ment; Business Support; R&DE Support; and Intelligence & Information Center, which achieve fi rm cooperative ties for supporting the business strategy and R&D strategy. For the purpose of further enhancing the quality of the intellectual prop-erty networks, the Intellectual Property Division constructs and analyzes the intellectual property portfolios that contain various kinds of intellectual properties, as one of the projects under this organizational framework. The Division contributes to boosting the corporate value of Mitsui Chemicals by sharing its intellec-tual property portfolio with the business and R&D divisions to enhance overall business strategy and R&D strategy.
The Intellectual Property Division is dedicated to developing and implementing strategies to achieve "management objectives focusing on the three dimensions of 'economy', 'environment' and 'society'" and “creation of new value with inno-vative new technologies", the fundamental goals of the Mitsui Chemicals Group's 2008 Medium-term Business Plan.

33
3. Reinforcing and Expanding Group Intellectual Property Capabilities
Mitsui Chemicals promotes the integration of its intellectual property portfolio with those of its affi liates. Analysis of this intel-lectual property portfolio contributes to reinforcing and expand-ing the Group intellectual property capabilities. Additionally, in cooperation with external experts, the Company further enriches its intellectual property education program that is designed appropriately according to each job class and level within the Group, aiming to cultivate human resources with knowledge and skills for managing intellectual properties.
4. Developing Intellectual Property Activities in Asia
In recent years, for expanding business operations in Asia, the necessity of the intellectual property risk management and its importance have been increasing. Mitsui Chemicals strives to understand and analyze the status of intellectual properties in each country, then take measures for them appropriately, while reinforcing their risk management by the co-work with its regional holding companies in Asia. In production bases and main consumer countries of Mitsui Chemicals' products in Asia, the Company develops the patent application strategies for every product in each country for securing its intellectual property right.
5. Application of Intellectual Property Licensing
In addition to the Basic Chemicals Business Sector, Mitsui Chemicals aims to promote the licensing of intellectual proper-ties of the Performance Materials Business Sector as a new approach to promoting the Performance Materials Business. By developing the licensing strategy taking into account of the market values of the intellectual properties, the Intellectual Property Division contributes to the further expansion of the Performance Materials Business.
0
60
40
80
FY09
%
FY07 FY08
27% 24%
119%
8% 4%
40%
120
China/EPC
India/EPC
Number of Patent Applications in China and India (vs. EPC)
0
20
60
40
80
FY09
%
FY07 FY08
59%
65%69%
17%10%
23%
Number of Patent Applications in China and India (vs. US)
China/US
India/US
*EPC.....European Patent Convention
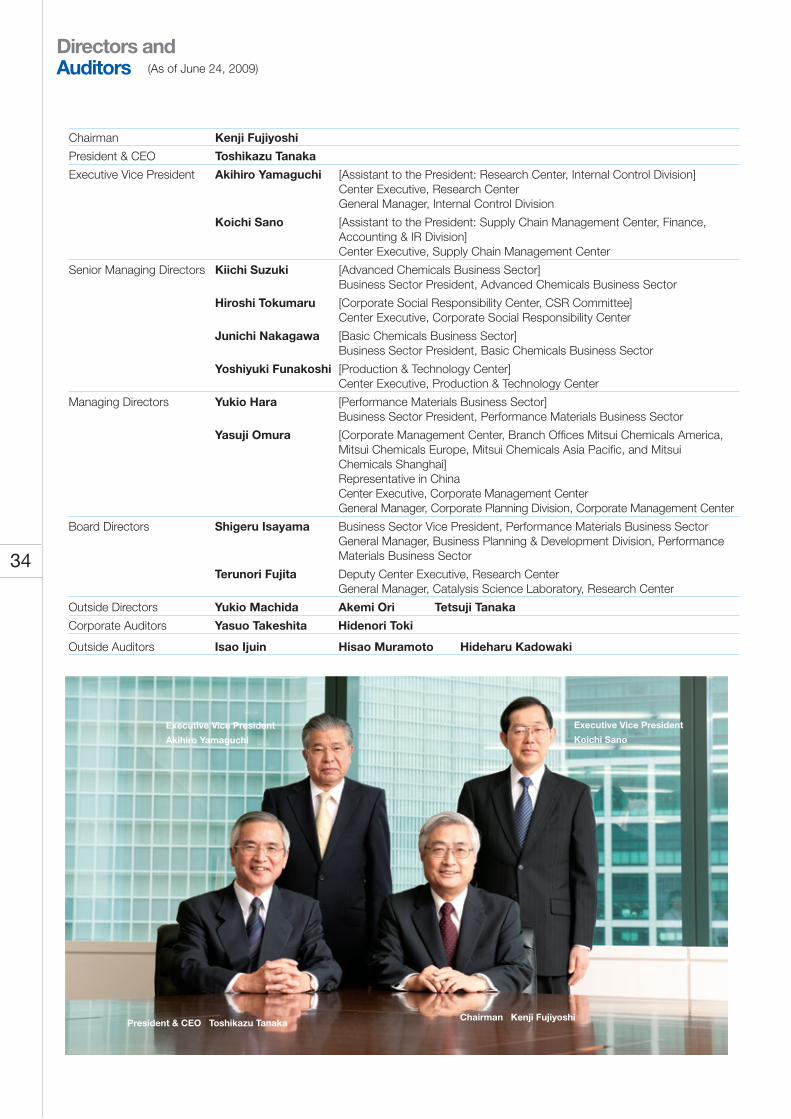
34
Chairman Kenji Fujiyoshi
President & CEO Toshikazu Tanaka
Executive Vice President Akihiro Yamaguchi [Assistant to the President: Research Center, Internal Control Division] Center Executive, Research Center General Manager, Internal Control Division
Koichi Sano [Assistant to the President: Supply Chain Management Center, Finance, Accounting & IR Division] Center Executive, Supply Chain Management Center
Senior Managing Directors Kiichi Suzuki [Advanced Chemicals Business Sector] Business Sector President, Advanced Chemicals Business Sector
Hiroshi Tokumaru [Corporate Social Responsibility Center, CSR Committee] Center Executive, Corporate Social Responsibility Center
Junichi Nakagawa [Basic Chemicals Business Sector] Business Sector President, Basic Chemicals Business Sector
Yoshiyuki Funakoshi [Production & Technology Center] Center Executive, Production & Technology Center
Managing Directors Yukio Hara [Performance Materials Business Sector] Business Sector President, Performance Materials Business Sector
Yasuji Omura [Corporate Management Center, Branch Offices Mitsui Chemicals America, Mitsui Chemicals Europe, Mitsui Chemicals Asia Pacific, and Mitsui Chemicals Shanghai] Representative in China Center Executive, Corporate Management Center General Manager, Corporate Planning Division, Corporate Management Center
Board Directors Shigeru Isayama Business Sector Vice President, Performance Materials Business Sector General Manager, Business Planning & Development Division, Performance Materials Business Sector
Terunori Fujita Deputy Center Executive, Research Center General Manager, Catalysis Science Laboratory, Research Center
Outside Directors Yukio Machida Akemi Ori Tetsuji Tanaka
Corporate Auditors Yasuo Takeshita Hidenori Toki
Outside Auditors Isao Ijuin Hisao Muramoto Hideharu Kadowaki
Chairman Kenji FujiyoshiPresident & CEO Toshikazu Tanaka
Executive Vice President
Akihiro Yamaguchi
Executive Vice President
Koichi Sano
Directors and Auditors (As of June 24, 2009)

35
Financial SectionSelected Consolidated Financial and Operating Data 36
Management’s Discussion and Analysis 38
Business Risks 48
Consolidated Balance Sheets 50
Consolidated Statements of Operations 52
Consolidated Statements of Changes in Net Assets 53
Consolidated Statements of Cash Flows 54
Notes to Consolidated Financial Statements 55
Independent Auditors’ Report 71

36
Selected ConsolidatedFinancial and Operating DataYears ended March 31
Reported Basis(Millions of yen except per share amounts) 2009 2008 2007 2006 2005 2004 2003 2002 2001 2000 1999 1998
For the Year
Net sales ¥1,487,615 ¥1,786,680 ¥1,688,062 ¥1,472,435 ¥1,227,547 ¥1,089,518 ¥1,053,182 ¥952,680 ¥939,782 ¥884,246 ¥855,942 ¥681,234
Cost of sales 1,341,106 1,509,308 1,402,022 1,217,564 968,230 861,965 823,523 730,059 720,524 659,327 632,036 532,414
SG&A 192,002 200,196 194,362 196,166 178,826 173,611 173,201 180,239 164,746 169,180 165,680 110,497
Operating income (loss) (45,493) 77,176 91,678 58,705 80,491 53,942 56,458 42,382 54,512 55,739 58,226 38,323
Other income (expenses) (19,936) (32,623) (7,136) 14,220 (25,839) (31,708) (17,496) (32,142) (26,118) (29,603) (36,099) (14,334)
Income (loss) before income taxes and minority interests (65,429) 44,553 84,542 72,925 54,652 22,234 38,962 10,240 28,394 26,136 22,127 23,989
Income taxes 40,619 19,430 27,416 27,681 23,053 7,923 13,465 1,830 10,523 8,182 12,674 11,290
Income (loss) before minority interests (106,048) 25,123 57,126 45,244 31,599 14,311 25,497 8,410 17,871 17,954 9,453 12,699
Net income (loss) (95,237) 24,831 52,297 44,125 26,192 12,466 20,320 7,651 17,068 16,042 7,739 11,702
Reference: Ordinary income (loss) (50,768) 66,146 95,478 61,989 79,737 47,694 48,716 37,394 49,067 55,902 43,870 32,507
At Year-End
Total current assets 529,606 726,361 733,150 608,995 497,287 440,517 445,239 486,642 563,245 544,837 548,668 616,871
Property, plant and equipment, net 522,641 564,805 542,340 532,324 520,886 548,799 580,830 583,949 552,759 530,827 513,268 530,860
Total investments and other non-current assets 136,692 178,082 222,693 187,571 187,012 199,150 199,125 227,272 198,509 161,515 146,232 150,505
Total assets 1,188,939 1,469,248 1,498,183 1,328,890 1,205,185 1,188,466 1,225,194 1,297,863 1,314,513 1,237,179 1,208,168 1,298,236
Total current liabilities 377,858 569,560 591,253 475,074 440,566 440,869 451,613 525,532 532,586 528,643 482,912 612,583
Total long-term liabilities 412,950 335,461 336,678 314,692 313,389 325,342 359,638 365,708 388,159 346,242 378,274 349,972
Total shareholders' equity 349,908 500,044 504,509 464,021 405,773 383,365 370,738 366,988 352,988 345,690 329,685 318,532
Per Share
Net income (loss) per share (basic) ¥(125.46) ¥32.22 ¥66.68 ¥56.20 ¥33.26 ¥15.78 ¥25.72 ¥9.70 ¥21.63 ¥20.57 ¥9.97 ¥21.53
Net income per share (diluted) — — — — — — ¥25.47 — ¥21.44 ¥20.41 — ¥20.98
Cash dividends per share ¥9.00 ¥12.00 ¥10.00 ¥8.00 ¥7.00 ¥6.00 ¥6.00 ¥6.00 ¥6.00 ¥6.00 ¥6.00 ¥6.00
Ratios
Return on sales (6.40%) 1.39% 3.10% 3.00% 2.13% 1.14% 1.93% 0.80% 1.82% 1.81% 0.90% 1.72%
Return on equity — 4.94% 10.80% 10.15% 6.64% 3.31% 5.51% 2.13% 4.89% 4.75% 2.39% 4.81%
Return (operating income (loss)) on assets (3.42%) 5.20% 6.49% 4.63% 6.73% 4.47% 4.48% 3.24% 4.27% 4.56% 4.65% 4.27%
Other
Depreciation and amortization 81,374 72,596 70,207 70,099 56,770 56,101 56,850 56,609 51,755 52,634 51,081 38,422
Capital expenditures 81,041 84,667 72,671 81,400 47,135 45,722 68,753 117,564 61,524 54,435 52,058 46,428
R&D expenses 40,628 42,130 36,943 37,146 34,881 32,894 37,114 39,012 36,543 38,141 39,295 28,036

37
Reported Basis(Millions of yen except per share amounts) 2009 2008 2007 2006 2005 2004 2003 2002 2001 2000 1999 1998
For the Year
Net sales ¥1,487,615 ¥1,786,680 ¥1,688,062 ¥1,472,435 ¥1,227,547 ¥1,089,518 ¥1,053,182 ¥952,680 ¥939,782 ¥884,246 ¥855,942 ¥681,234
Cost of sales 1,341,106 1,509,308 1,402,022 1,217,564 968,230 861,965 823,523 730,059 720,524 659,327 632,036 532,414
SG&A 192,002 200,196 194,362 196,166 178,826 173,611 173,201 180,239 164,746 169,180 165,680 110,497
Operating income (loss) (45,493) 77,176 91,678 58,705 80,491 53,942 56,458 42,382 54,512 55,739 58,226 38,323
Other income (expenses) (19,936) (32,623) (7,136) 14,220 (25,839) (31,708) (17,496) (32,142) (26,118) (29,603) (36,099) (14,334)
Income (loss) before income taxes and minority interests (65,429) 44,553 84,542 72,925 54,652 22,234 38,962 10,240 28,394 26,136 22,127 23,989
Income taxes 40,619 19,430 27,416 27,681 23,053 7,923 13,465 1,830 10,523 8,182 12,674 11,290
Income (loss) before minority interests (106,048) 25,123 57,126 45,244 31,599 14,311 25,497 8,410 17,871 17,954 9,453 12,699
Net income (loss) (95,237) 24,831 52,297 44,125 26,192 12,466 20,320 7,651 17,068 16,042 7,739 11,702
Reference: Ordinary income (loss) (50,768) 66,146 95,478 61,989 79,737 47,694 48,716 37,394 49,067 55,902 43,870 32,507
At Year-End
Total current assets 529,606 726,361 733,150 608,995 497,287 440,517 445,239 486,642 563,245 544,837 548,668 616,871
Property, plant and equipment, net 522,641 564,805 542,340 532,324 520,886 548,799 580,830 583,949 552,759 530,827 513,268 530,860
Total investments and other non-current assets 136,692 178,082 222,693 187,571 187,012 199,150 199,125 227,272 198,509 161,515 146,232 150,505
Total assets 1,188,939 1,469,248 1,498,183 1,328,890 1,205,185 1,188,466 1,225,194 1,297,863 1,314,513 1,237,179 1,208,168 1,298,236
Total current liabilities 377,858 569,560 591,253 475,074 440,566 440,869 451,613 525,532 532,586 528,643 482,912 612,583
Total long-term liabilities 412,950 335,461 336,678 314,692 313,389 325,342 359,638 365,708 388,159 346,242 378,274 349,972
Total shareholders' equity 349,908 500,044 504,509 464,021 405,773 383,365 370,738 366,988 352,988 345,690 329,685 318,532
Per Share
Net income (loss) per share (basic) ¥(125.46) ¥32.22 ¥66.68 ¥56.20 ¥33.26 ¥15.78 ¥25.72 ¥9.70 ¥21.63 ¥20.57 ¥9.97 ¥21.53
Net income per share (diluted) — — — — — — ¥25.47 — ¥21.44 ¥20.41 — ¥20.98
Cash dividends per share ¥9.00 ¥12.00 ¥10.00 ¥8.00 ¥7.00 ¥6.00 ¥6.00 ¥6.00 ¥6.00 ¥6.00 ¥6.00 ¥6.00
Ratios
Return on sales (6.40%) 1.39% 3.10% 3.00% 2.13% 1.14% 1.93% 0.80% 1.82% 1.81% 0.90% 1.72%
Return on equity — 4.94% 10.80% 10.15% 6.64% 3.31% 5.51% 2.13% 4.89% 4.75% 2.39% 4.81%
Return (operating income (loss)) on assets (3.42%) 5.20% 6.49% 4.63% 6.73% 4.47% 4.48% 3.24% 4.27% 4.56% 4.65% 4.27%
Other
Depreciation and amortization 81,374 72,596 70,207 70,099 56,770 56,101 56,850 56,609 51,755 52,634 51,081 38,422
Capital expenditures 81,041 84,667 72,671 81,400 47,135 45,722 68,753 117,564 61,524 54,435 52,058 46,428
R&D expenses 40,628 42,130 36,943 37,146 34,881 32,894 37,114 39,012 36,543 38,141 39,295 28,036

38
OverviewIn fiscal 2009, ended March 31, 2009, the Japanese economy experienced a precipitous slowdown. From the first half of the fiscal year under review, the prices of such raw materials as crude oil and iron ore surged markedly. In addition to the drop in corporate-sector earnings, repercussions from the U.S. subprime mortgage problem, which triggered a global finan-cial crisis, significantly impacted the real economy. As a result, domestic conditions deteriorated rapidly from the third quarter ended December 31, 2008. In the chemical industry, companies took steps to revise product prices in the wake of sharp upswings in material and fuel costs. Despite these endeavors, conditions remained harsh, with substantial downward pressure placed on earnings. After hitting historic highs, the prices of raw materials and fuels dropped rapidly from early autumn. Demand also plummeted sharply on the back of the global recession. Impacted by unprecedented volatility and change, the chemical industry confronted an extremely difficult business environment. Amid a climate of abrupt and dramatic fluctuation in operat-ing conditions, the Mitsui Chemicals Group reported a signifi-cant drop in earnings. This was mainly attributable to the substantial decline in demand from the Group’s mainstay business partners in the automotive and electronic information material fields that resulted in lower sales volume and an unavoidable reduction in production facility and equipment utilization. Faced with this downturn in its overall performance, the Group took steps to implement emergency measures, reexamining every facet of its business activities. In the fiscal year under review, the Mitsui Chemicals Group reduced com-pensation paid to directors and management personnel, drasti-cally cut back operating overheads, undertook a comprehensive zero-based review of all investment projects and thoroughly rationalized inventories. Despite the aforementioned endeavors, the Group suffered an across-the-board decline in its operating results. In addition to the drop in operating income, the Mitsui Chemicals Group recorded a loss on valuation of inventories reflecting the overall decrease in market prices and undertook to reverse a
portion of its deferred tax assets. The following summary of operating results for the fiscal year ended March 31, 2009 takes into account these and other factors. As of March 31, 2009, the Mitsui Chemicals Group com-prised 66 consolidated subsidiaries, three more than the previous fiscal year. This reflects the acquisition and consoli-dation of seven new companies, including U.S.-based SDC Technologies Inc., and the exclusion due to amalgamation and other reasons of four former subsidiaries, including Mitsui Chemicals Engineering Co., Ltd. The equity method is applied to 32 non-consolidated subsidiaries and affiliates, six fewer than the previous fiscal year.
Operating ResultsNet SalesNet sales fell 16.7% compared with the previous fiscal year to ¥1,487.6 billion (US$15.1 billion), a decrease of ¥299.1 billion (US$3.0 billion). Although increased prices drove up sales ¥5.2 billion (US$0.1 billion), the decrease was mainly attributable to a ¥304.3 billion (US$3.1 billion) drop in sales volume across all business segments that reflected the slump in demand.
Operating LossOperating loss for the fiscal year under review was ¥45.5 billion (US$0.5 billion), plummeting ¥122.7 billion (US$1.2 billion) year on year. Despite the positive effects of emergency measures, including efforts to curtail fixed expenses, the Mitsui Chemicals Group was unable to adequately preserve its profit margins due to a variety of factors. These factors included the decrease in sales volume, amendments to commercial terms of trade, most notably selling and purchasing price variances and movements in fixed and other costs, which caused profit to contract ¥76.4 billion (US$0.8 billion), ¥31.7 billion (US$0.3 billion) and ¥14.6 billion (US$0.1 billion), respectively. Further contributing to the operating loss was a loss on valuation of inventories of ¥19.2 billion (US$0.2 billion) that reflected the downturn in market conditions and prices. Results on an individual business segment and principal product basis were as follows
Management’sDiscussion and Analysis
0
500
1000
1500
2000
-50
0
50
100
150
Net Sales(Billions of yen)
Operating Income/Ratio to Net Sales(Billions of yen, %)
07 08 090
500
1,000
1,500
2,000
(50)
0
50
100
150
(4.0)
0
4.0
8.0
12.0
07 08
Operating income (left scale)
Ratio to net sales (right scale)
09
1,688.11,786.7
1,487.691.7
77.2
(45.5)
5.4
(3.1)
4.3

39
Segment InformationBusiness SegmentChanges of net sales and operating income by segment were as follows:
Net SalesBillions of yen
Change
2009
2008
Total
Volume
contribution
Price
contribution
Performance materials 431.8 504.1 (72.3) (81.9) 9.6Advanced chemicals 118.7 122.1 (3.4) (5.0) 1.6Basic chemicals 912.8 1,111.2 (198.4) (192.6) (5.8)Others 24.3 49.3 (25.0) (24.8) (0.2)Eliminations — — — — —
Total 1,487.6 1,786.7 (299.1) (304.3) 5.2
Operating Income (Loss)Billions of yen
Change
2009
2008
Total
Volume
contribution
Price*
Fixed cost and other cost differential
Performance materials (16.0) 35.9 (51.9) (27.4) (13.2) (11.3)Advanced chemicals 7.3 10.8 (3.5) (0.5) (1.0) (2.0)Basic chemicals (32.0) 33.4 (65.4) (46.5) (16.0) (2.9)Others 0.1 3.4 (3.3) (2.0) (1.5) 0.2Eliminations (4.9) (6.3) 1.4 — — 1.4
Total (45.5) 77.2 (122.7) (76.4) (31.7) (14.6)
*Price = Price contribution + Variable cost differential
Performance MaterialsMillions of yen
2009 2008 Change (%)
Net sales ¥431,834 ¥504,060 (14.3)Operating income (loss) (16,018) 35,857 —Total assets 432,205 489,968 (11.8)Depreciation and amortization 37,569 29,564 27.1Capital expenditures 39,894 50,383 20.8
Automotive and industrial material sales decreased 6% year on year. In the first half of the fiscal year, domestic demand increased. In this sector, steps were taken to cultivate new customers, focusing mainly on Asian markets. These factors were offset, however, by the sharp decline in automotive market demand from early autumn, which contributed to weak results.
Industrial material sales decreased 7% compared with the previous fiscal year. This was again attributable to the abrupt drop in demand from early autumn and countered growth in demand in the first half of the fiscal year for base resins for paint and polyolefin-based waxes. Hygiene material sales increased 8% compared with the previous fiscal year as demand for non-woven fabrics expanded in East and Southeast Asia, particularly in the Thai and Chinese markets. Special polyolefin and engineering plastics saw a drop in demand mainly for IT-related uses. This led to a year-on-year decline in sales of 19%. Semiconductor material sales were weak falling 24% compared with the previous fiscal year. This was attributable to the downturn in market demand as well as falling prices.

40
Energy material sales surged 47% year on year on the back of robust demand for solar cell encapsulent materials. Polyurethane sales decreased 27%. In addition to the sudden slowdown in demand for TDI/MDI, this downturn was caused by deterioration in market conditions overseas and appreciation in the value of the yen. Reflecting the aforementioned factors, segment sales declined ¥72.3 billion (US$0.7 billion) compared with the previous fiscal year to ¥431.8 billion (US$4.4 billion), compris-ing 29% of total sales. In the fiscal year under review, lower year-on-year sales volume had a negative impact of ¥81.9 billion (US$0.8 billion), while higher sales prices increased revenues by ¥9.6 billion (US$0.1 billion). The segment recorded an operating loss of ¥16.0 billion (US$0.2 billion), down ¥51.9 billion (US$0.5 billion) year on year. Despite efforts to curtail costs, this was attributable to a variety of factors, including hikes in raw material and fuel prices during the first half of the fiscal year, a slump in demand from early autumn and deterioration in market conditions and prices, which resulted in a loss on valuation of inventories. In specific terms, decreased sales volume, selling and purchas-ing price variances and movements in fixed and other costs lowered operating income by ¥27.4 billion (US$0.3 billion), ¥13.2 billion (US$0.1 billion) and ¥11.3 billion (US$0.1 billion), respectively, resulting in an operating loss.
Advanced ChemicalsMillions of yen
2009 2008 Change (%)
Net sales ¥118,658 ¥122,113 (2.8)Operating income 7,311 10,761 (32.1)Total assets 162,777 159,030 2.4Depreciation and amortization 7,622 6,328 20.4Capital expenditures 18,951 6,238 203.8
Optical lens materials as well as healthcare materials such as pharmaceutical intermediates showed steady growth. In the fiscal year under review, sales climbed 8% year on year.
Chemical products including polymerization inhibitors and adhesive materials for tires and lumber experienced difficult conditions. Despite efforts to revise product prices in the wake of sharp hikes in the prices of raw materials and fuels during the first half of the fiscal year, sales decreased 26% due to a sluggish economy resulting in low demand. Agrochemical product sales edged up 2% compared with the previous fiscal year. This was mainly attributable to firm sales of insecticides. As a result, segment sales fell ¥3.4 billion (US$0.03 billion) to ¥118.7 billion (US$1.2 billion), accounting for 8% of total sales. The year-on-year decline in sales volume brought revenues down ¥5.0 billion (US$0.1 billion). Sales prices, on the other hand contributed ¥1.6 billion (US$0.02 billion). Despite growth in sales of insecticides, operating income contracted ¥3.5 billion (US$0.04 billion) year on year to ¥7.3 billion (US$0.1 billion). Results were impacted by the sudden slump in demand mainly for chemical products from early autumn and the sharp rise in raw material and fuel prices during the first half of the fiscal year under review. In the full fiscal year ended March 31, 2009, the sales volume was down ¥0.5 billion (US$0.01 billion) from the previous fiscal year. Fluctuations in selling and purchasing price had a nega-tive ¥1.0 billion (US$0.01 billion) impact on operating income while rising fixed and other costs had an adverse effect of ¥2.0 billion (US$0.02 billion).
Basic ChemicalsMillions of yen
2009 2008 Change (%)
Net sales ¥912,779 ¥1,111,166 (17.9)Operating income (Loss) (32,006) 33,450 —Total assets 485,687 697,856 (30.4)Depreciation and amortization 29,840 30,767 (3.0)Capital expenditures 17,694 20,648 (14.3)
Ethylene and propylene production declined 13% and 18%, respectively, year on year due to production adjustments from August 2008 in response to weak derivative demand.

41
Phenol sales decreased 30% compared with the previous fiscal year. In addition to the drop in demand from early autumn forcing a downward adjustment in production, poor results were attributable to weak sales prices due mainly to the decline in raw material and fuel prices. Bisphenol A sales decreased 21%. Mirroring conditions for phenol, production was adjusted downward owing to falling demand for polycarbonate and epoxy resins, the principal uses for bisphenol A, from early autumn and the drop in sales prices due to lower raw material and fuel prices. Purified terephthalic acid (PTA) sales decreased 26% compared with the previous fiscal year owing to stagnant demand and the decline in sales prices, which reflected weak raw material and fuel prices. Polyethylene terephthalate (PET) resin sales declined 16% year on year due mainly to the drop in demand in Japan for bottled drinks. Ethylene, glycol, ethylene oxide and derivative sales were impacted by the slump in demand. Sales of these products fell 23% year on year. Polyethylene and polypropylene sales decreased 8% and 11%, respectively. Despite product price revisions to accom-modate sharp hikes in raw material and fuel prices during the first half of the fiscal year under review, this was attributable to the sudden drop in demand from early autumn. Taking into consideration the aforementioned factors, segment sales totaled ¥912.8 billion (US$9.3 billion), down ¥198.4 billion (US$2.0 billion) year on year. This represented 61% of total sales. The lower sales volume had a negative impact of ¥192.6 billion (US$2.0 billion) on revenue, while the downturn in sales prices had an adverse effect of ¥5.8 billion (US$0.1 billion) year on year. In the fiscal year under review, the Mitsui Chemicals Group reported an operating loss of ¥32.0 billion (US$0.3 billion) in this segment, down ¥65.4 billion (US$0.7 billion) compared with the previous fiscal year. This substantial negative turn-around was the result of lower sales due to the across-the-board drop in demand and the loss on valuation of inventories owing to weak market conditions and prices. In specific terms, the decreased sales volume, selling and purchasing price variances and movements in fixed and other costs lowered operating income by ¥46.5 billion (US$0.5 billion), ¥16.0 billion (US$0.2 billion) and ¥2.9 billion (US$0.03 billion), respectively, resulting in an operating loss.
OthersMillions of yen
2009 2008 Change (%)
Net sales ¥24,344 ¥49,341 (50.7)Operating income 84 3,390 (97.5)Total assets 46,244 71,897 (35.7)Depreciation and amortization 4,816 3,811 26.4Capital expenditures 2,730 5,589 (51.2)
Compared with the previous fiscal year, the reduction in sales volume of ¥24.8 billion (US$0.3billion) significantly impacted revenue in the others segment. As a result, segment sales contracted ¥25.0 billion (US$0.3 billion) to ¥24.3 billion (US$0.2 billion), accounting for 2% of total sales. Operating income dropped ¥3.3 billion (US$0.03 billion) year on year to ¥0.1 billion (US$1million). Principal contributing factors were the decrease in sales volume and amendments to commercial terms of trade including both selling and pur-chasing price variances, which accounted for ¥2.0 billion (US$0.02 billion) and ¥1.5 billion (US$0.02 billion), respec-tively, of this downturn.
Geographic DistributionJapanDespite successful efforts to revise product prices in response to sharp hikes in the cost of raw materials and fuels in the first half of the fiscal year under review, overall year-on-year sales in Japan declined. This was mainly attributable to the sharp and dramatic drop in demand from early autumn. In addition to the impact of lower sales volume, earnings in Japan were significantly affected by the Group’s inability to sufficiently maintain profit margins in the wake of violent fluctuations in raw materials and fuel prices. As a result, the Mitsui Chemicals Group recorded an operating loss in Japan. Taking into consideration the aforementioned factors, sales in Japan decreased ¥262.2 billion (US$2.7 billion) compared with the previous fiscal year to ¥1,204.4 billion (US$12.3 billion), accounting for 81% of total net sales. In the fiscal year under review, the Mitsui Chemicals Group reported an operat-ing loss in Japan of ¥41.5 billion (US$0.4 billion), a negative turnaround of ¥113.6 billion (US$1.2 billion).

42
AsiaMitsui Phenols Singapore Pte. Ltd., a subsidiary involved in the manufacture and sale of phenol and bisphenol A in Singapore, and Siam Mitsui PTA Co., Ltd., a subsidiary engaged in the manufacture and sale of PTA in Thailand, reported lower year-on-year sales. This downturn was exacer-bated by deterioration in market conditions as well as a decline in product prices. As a result, sales in Asia decreased, contributing to an operating loss for the fiscal year under review. In specific terms, sales in Asia contracted ¥27.8 billion (US$0.3 billion) to ¥187.8 billion (US$1.9 billion), accounting for 13% of total net sales. In the fiscal year ended March 31, 2009, earnings in the region fell ¥4.4 billion (US$0.04 billion) year on year for an operating loss of ¥3.2 billion (US$0.03 billion).
OthersIn the United States, a subsidiary involved in the manufacture and sale of resin compounds for automotive use saw its sales volume decline on the back of weak automobile sector demand. In addition to the resulting drop in sales, year-on-year earnings in other regions deteriorated from operating income to operating loss.
As a result, sales in this segment decreased ¥9.1 billion (US$0.1 billion) compared with the previous fiscal year to ¥95.4 billion (US$1.0 billion), representing 6% of total net sales. From operating income in the fiscal year ended March 31, 2008, segment earnings fell ¥4.8 billion (US$0.05 billion) for an operating loss of ¥0.9 billion (US$0.01 billion).
Overseas SalesIn the fiscal year under review, overseas sales amounted to ¥527.9 billion (US$5.4 billion), a year-on-year decrease of ¥168.4 billion. While accounting for 35.5% of total net sales, this was 3.5 percentage points lower than the previous fiscal year. Looking at overseas sales on a geographic basis, Asia accounted for ¥388.0 billion (US$3.9 billion), or 26.1% of the Group’s total net sales; North and Latin America contributed ¥75.9 billion (US$0.8 billion), or 5.1%; Europe generated ¥52.1 billion (US$0.5 billion), or 3.5%; and other regions recorded ¥11.9 billion (US$0.1 billion), or 0.8%. Comparing these figures with those for the previous fiscal year, the downturn was particularly significant in Asia, where sales declined ¥156.3 billion (US$1.6 billion) year on year. This decrease was the major contributing factor to the slump in overseas sales.
0
100
200
300
400
-10
-5
0
5
10
Operating Income at Overseas Bases/Share of Total Operating Income(Billions of yen, %)
(10)
(5)
0
5
10
(10.0)
(5.0)
0
5.0
10.0
07 08
Operating income at overseas bases (left scale)
Share of total operating income (right scale)
Sales at Overseas Bases/Share of Total Net Sales(Billions of yen, %)
0
100
200
300
400
0
10
20
30
40
07 08
Sales at overseas bases (left scale)
Share of total net sales (right scale)
09 09
275.3
320.16.7
7.36.6
(9.0)
5.1
(4.1)
283.2
16.317.9 19.0
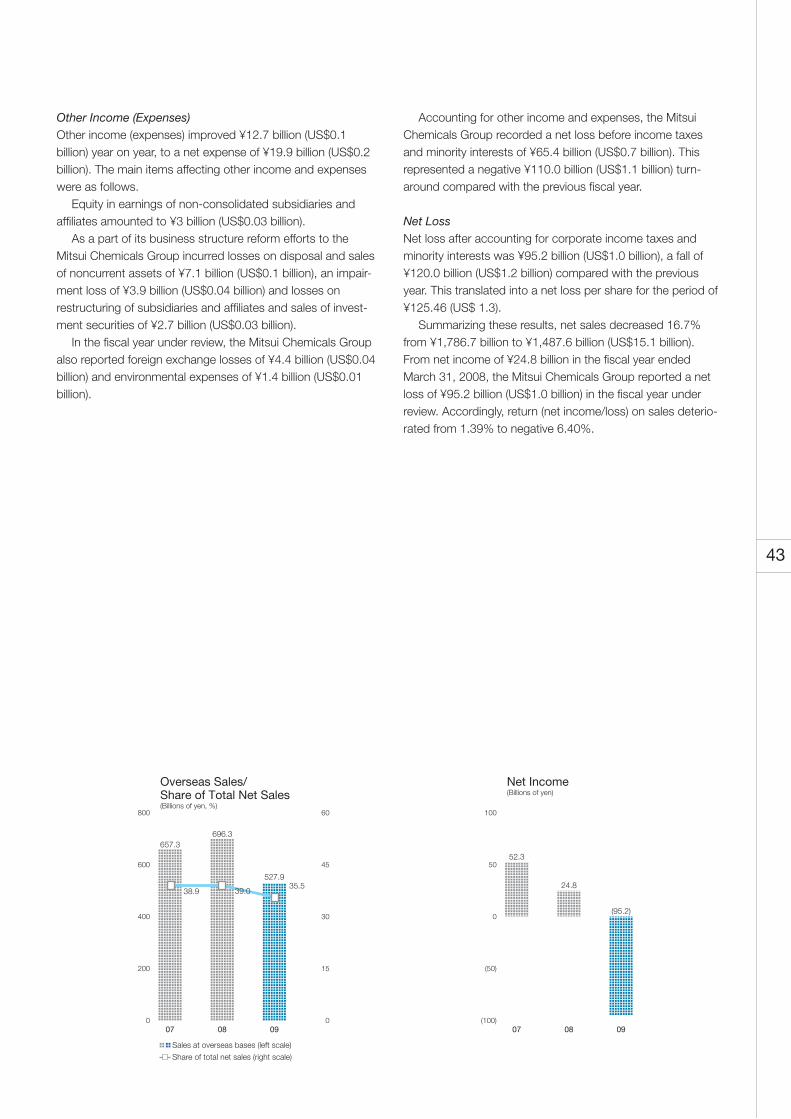
43
Other Income (Expenses)Other income (expenses) improved ¥12.7 billion (US$0.1 billion) year on year, to a net expense of ¥19.9 billion (US$0.2 billion). The main items affecting other income and expenses were as follows. Equity in earnings of non-consolidated subsidiaries and affiliates amounted to ¥3 billion (US$0.03 billion). As a part of its business structure reform efforts to the Mitsui Chemicals Group incurred losses on disposal and sales of noncurrent assets of ¥7.1 billion (US$0.1 billion), an impair-ment loss of ¥3.9 billion (US$0.04 billion) and losses on restructuring of subsidiaries and affiliates and sales of invest-ment securities of ¥2.7 billion (US$0.03 billion). In the fiscal year under review, the Mitsui Chemicals Group also reported foreign exchange losses of ¥4.4 billion (US$0.04 billion) and environmental expenses of ¥1.4 billion (US$0.01 billion).
Accounting for other income and expenses, the Mitsui Chemicals Group recorded a net loss before income taxes and minority interests of ¥65.4 billion (US$0.7 billion). This represented a negative ¥110.0 billion (US$1.1 billion) turn-around compared with the previous fiscal year.
Net LossNet loss after accounting for corporate income taxes and minority interests was ¥95.2 billion (US$1.0 billion), a fall of ¥120.0 billion (US$1.2 billion) compared with the previous year. This translated into a net loss per share for the period of ¥125.46 (US$ 1.3). Summarizing these results, net sales decreased 16.7% from ¥1,786.7 billion to ¥1,487.6 billion (US$15.1 billion). From net income of ¥24.8 billion in the fiscal year ended March 31, 2008, the Mitsui Chemicals Group reported a net loss of ¥95.2 billion (US$1.0 billion) in the fiscal year under review. Accordingly, return (net income/loss) on sales deterio-rated from 1.39% to negative 6.40%.
0
200
400
600
800
-100
-50
0
50
100
Net Income(Billions of yen)
(100)
(50)
0
50
100
07 08
Overseas Sales/Share of Total Net Sales(Billions of yen, %)
0
200
400
600
800
0
15
30
45
60
07 08
Sales at overseas bases (left scale)
Share of total net sales (right scale)
09 09
38.9 39.035.5
696.3657.3
527.9
52.3
24.8
(95.2)

44
Financial PositionOverviewTotal assets decreased ¥280.3 billion (US$2.9 billion) from ¥1,469.2 billion as of the end of the previous fiscal year to ¥1,188.9 billion (US$12.1 billion) as of March 31, 2009. Impacted by the negative year-on-year turnaround of ¥122.7 billion (US$1.2 billion), from operating income of ¥77.2 billion to an operating loss of ¥45.5 billion (US$0.5 billion), return (operating income/loss) on assets deteriorated from 5.20% in the fiscal year ended March 31, 2008 to negative 3.42% in the fiscal year under review. The debt-to-equity ratio was 1.53 as of the end of the fiscal year under review, up 0.56 of a point year on year.
AssetsTotal assets as of March 31, 2009 stood at ¥1,188.9 billion (US$12.1 billion), down ¥280.3 billion (US$2.9 billion) com-pared with the end of the previous fiscal year (March 31, 2008).
LiabilitiesTotal liabilities decreased ¥114.2 billion (US$1.2 billion) year on year to ¥790.8 billion (US$8.1 billion). Interest-bearing debt amounted to ¥535.4 billion (US$5.5 billion), an increase of ¥49.4 billion (US$0.5 billion) compared with March 31, 2008. As a result, the interest-bearing debt ratio was 45.0%, up 11.9 percentage points.
Net AssetsTotal net assets stood at ¥398.1 billion (US$4.1 billion) as of March 31, 2009, down ¥166.1 billion (US$1.7 billion) com-pared with the previous fiscal year-end. Of this total, shareholders’ equity was ¥364.4 billion (US$3.7 billion) as of the end of the fiscal year under review, ¥115.1 billion (US$1.2 billion) lower than March 31, 2008. This was mainly attributable to the net loss of ¥95.2 billion (US$1.0 billion) for the period and a decrease of ¥9.1 billion (US$0.1 billion) due to the payment of dividends. A share buyback program was initiated in September 2008 to provide the Mitsui Chemicals Group with additional flexibility in pursuit of its capital policies. This program was undertaken in response to changes in the Group’s business environment. The aggre-gate total of the share buyback program was ¥10.0 billion (US$ 0.1 billion). Valuation and translation adjustments were down ¥35.0 billion (US$0.4 billion) compared with the previous fiscal year-end to negative ¥14.5 billion (US$0.1 billion). This mainly reflected an ¥11.8 billion (US$0.1 billion) decline in net unreal-ized holding gain on securities caused by the fall in listed stock prices. Minority interests stood at ¥48.2 billion (US$0.5 billion) as of the end of the fiscal year under review, a decrease of ¥16.0 billion (US$0.2 billion) compared with the previous fiscal year-end. As a result, the equity ratio declined 4.6 percentage points to 29.4% as of March 31, 2009.
0
400
800
1200
1600
0
150
300
450
600
Interest-Bearing Liabilities(Billions of yen)
0
150
300
450
600
07 08
Total Assets/Return (Operating Income) on Assets(Billions of yen, %)
0
400
800
1,200
1,600
(6)
0
6
12
18
07 08
Total assets (left scale)
Return (operating income) on assets (right scale)
09 09
498.3 486.0
535.4
6.495.20
(3.42)
1,469.21,498.2
1,188.9

45
Capital Resources and LiquidityCash FlowsCash and cash equivalents (hereafter called “cash”) increased ¥22.4 billion (US$0.2 billion) to ¥ 47.9 billion (US$0.5 billion) as of the fiscal year-end.
Cash Flows from Operating ActivitiesNet cash provided by operating activities was ¥54.9 billion (US$0.6 billion), a decrease of ¥37.5 billion (US$0.4 billion) compared with the previous fiscal year. Despite a decline in income taxes paid and the implementation of various emer-gency measures including efforts to curtail inventories, which resulted in working capital savings, cash flow from operating activities decreased due mainly to the net loss before income taxes and minority interests for the period. As a result, the ratio of interest-bearing debt to operating cash flows increased from 5.3 in the previous fiscal year to 9.8, while the interest coverage ratio fell from 9.7 times to 5.9 in the fiscal year under review.
Cash Flows from Investing ActivitiesNet cash used in investing activities decreased ¥1.9 billion (US$0.02 billion) compared with the previous fiscal year to ¥76.3 billion (US$0.8 billion). Despite the acquisition of U.S.-based SDC Technologies, which produces and sells such products as coating material for glass lenses, this decrease was attributable to lower payments for the purchase of prop-erty, plant and equipment.
Cash Flows from Financing ActivitiesNet cash provided by financing activities amounted to ¥48.3 billion (US$0.5 billion). Major cash outflows comprised the acquisition of treasury stock and payment of cash dividends. This was offset by the increase in interest-bearing debt amid financial instability.
Cash Flow-Related Performance Indicators 2009 2008 2007 2006 2005
Shareholders’ Equity Ratio (%) 29.4 34.0 33.7 34.9 33.7Shareholders’ Equity Ratio on a Market Value Basis (%) 15.1 34.6 53.0 51.0 39.0Ratio of Interest-bearing Debt to Cash Flows 9.8 5.3 5.0 5.3 4.4Interest Coverage Ratio (Times) 5.9 9.7 12.8 13.4 14.7Note: Shareholders’ Equity Ratio: Shareholders’ equity to total assets Shareholders’ Equity Ratio on a Market Value Basis: Market capitalization
to total assets Ratio of Interest-bearing Debt to Cash Flows: Interest-bearing debt to
cash flows Interest Coverage Ratio: Cash flows to interest paid Each of the indicators was calculated using consolidated financial figures. The market capitalization was calculated by multiplying the closing share
price as of the end of the period with the number of shares outstanding (excluding treasury stock).
Operating cash flow figures have been used for cash flow calculations. The operating cash flow figures used are cash flows from operating activi-
ties as reported in the consolidated statements of cash flows. Interest-bearing debt is the portion of total debt booked on the consolidated balance sheet on which interest is being paid. Interest paid is the amount of interest paid as reported in the consolidated statements of cash flows.
0
150
300
450
600
Debt-to-Equity Ratio(Times)
0
0.4
0.8
1.2
1.6
07 08 09
Total Shareholders’ Equity/Return on Equity(Billions of yen, %)
0
150
300
450
600
(36)
(24)
(12)
0
12
07 08
Total assets (left scale)
Return (operating income) on assets (right scale)
09
0.99 0.97
1.5310.80
4.94
(22.41)
500.0504.5
349.9

46
Fund ProcurementIn connection with its fund procurement activities, the Mitsui Chemicals Group adopts the following basic policies.Maintain a high credit rating so that low-cost funds can be procured, mainly through bonds, loans and commercial paper whenever necessary.Utilize a certain level of indirect financing to preserve the stability of fund procurement activities.Employ securitization and other schemes to liquidate assets in an effort to diversify fund procurement means.
Financial LiquidityWith regard to asset efficiency, the Mitsui Chemicals Group will ensure sufficient levels of liquidity in hand while at the same time securing alternative sources of fund procurement, including credit and overdraft facilities.
Capital Expenditures (Summary)Mitsui Chemicals and its consolidated subsidiaries undertook capital expenditures totaling ¥81.1 billion (US$0.8 billion) in the fiscal year ended March 31, 2009. This amount includes expenditures on intangible fixed assets as well as long-term prepaid expenses. Expenditures by business segment were as follows.
Performance MaterialsIn the fiscal year under review, Mitsui Chemicals undertook the construction of facilities for the production of wafer circuit surface protection tapes. In addition, Mitsui Elastomers Singapore Pte. Ltd. continued construction of an alpha-olefin copolymer production facility. The total cost of these and other performance material-related capital expenditures was ¥39.9 billion (US$0.4 billion).
Advanced ChemicalsMitsui Chemicals expanded production capacity at its optical lens monomer production facility. The total cost of this and other capital expenditures in the advanced chemicals cat-egory amounted to ¥19.0 billion (US$0.2 billion).
Basic ChemicalsOsaka Petrochemical Industries, Ltd. undertook construction to increase the production capacity of its butane cracking furnace. Capital expenditures in this and other items in the basic chemicals category totaled ¥17.7 billion (US$0.2 billion).
Others and CorporateThe total cost of other and corporate capital expenditures in the fiscal year under review was ¥4.5 billion (US$0.05 billion).
Capital Expenditures(Billions of yen)
0
25
50
75
100
07 08 09
84.7
72.7
81.0

47
Research and DevelopmentResearch and development at Mitsui Chemicals and its con-solidated subsidiaries is conducted by the development centers of the Performance Materials and Advanced Chemicals business sectors; the production technology center of the production/technology business sectors; the research laboratories of the corporate research center; and the R&D divisions of consolidated subsidiaries. Research and development expenditures by Mitsui Chemicals and its con-solidated subsidiaries in the fiscal year ended March 31, 2009 amounted to ¥40.6 billion (US$0.4 billion).
Corporate Research and DevelopmentMitsui Chemicals took the lead in cultivating and improving basic technologies that can be applied to the research and development of a new generation of catalysts for use in the production of functional polymers and basic chemicals, new polyolefin resins and next-generation high-performance materials as well as applied research and development of next-generation high-performance materials. Total corporate research and development expenditures in the fiscal year ended March 31, 2009 were ¥5.5 billion (US$0.1 billion).
Strategic Research and DevelopmentIn order to expand and develop functional materials operations, Mitsui Chemicals took a central role in a new functional poly-mer development promotion project. In addition to a multi-purpose semi-commercial plant the Company develops highly functional elastomers for use in automobiles and electronic materials as well as next-generation functional films. Total strategic research and development expenditures in the fiscal year under review amounted to ¥3.7 billion (US$0.04 billion).
Performance MaterialsMitsui Chemicals and Mitsui Chemicals Polyurethane, Inc. took the lead in developing functional polymers and urethane resins for use in automotive-, IT-, energy- and lifestyle- related as well as industrial - fields in addition to finished products made from these materials. In the fiscal year ended March 31, 2009, research activities were mainly directed toward new elastomers, new resins for optical lenses, semiconductor materials, sealant materials for electronic and electric parts, functional finished products and solar battery-related materi-als. Research and development expenditures in the perfor-mance materials category totaled ¥16.5 billion (US$0.2 billion) in the fiscal year under review.
Advanced ChemicalsMitsui Chemicals plays a central role in the research and development of fine chemicals. Also, together with Sankyo Agro Co., Ltd., the Company takes the lead in the research and development of agrochemicals. In the fiscal year under review, considerable research and development weight was placed on display materials and agrochemicals. Emphasis was also given to the development and sale of organic elec-troluminescent dyes and various compounds based on the Starkle brand of insecticide. Research and development expenditures in this category were ¥7.6 billion (US$0.1 billion) in the fiscal year ended March 31, 2009.
Basic ChemicalsIn basic chemicals, Mitsui Chemicals took the lead, focusing on the development of new processes for innovative catalysts that can be used in the production of propylene, phenol and bisphenol A. In an effort to enhance the competitiveness of their polyolefin resins, Mitsui Chemicals and Prime Polymer Co., Ltd. took key roles in developing high-performance catalysts. These companies are also leading efforts to develop new high-performance brands aimed at cultivating new markets. Research and development expenditures in the basic chemicals category were ¥7.3 billion (US$0.1 billion) in the fiscal year under review.

48
Business RisksThe Mitsui Chemicals Group recognizes that management activities may be threatened by a wide range of conceivable and apparent risks. For this reason, the Group is dedicated to crafting initiatives able to prevent or minimize the escalation of these risks. The items detailed below represent some of the risks that could potentially and adversely impact the Group’s future operating performance and financial position. Readers are cautioned that this partial list does not constitute all of the risks faced by Mitsui Chemicals. Please note that the risks discussed below were those deemed relevant as of March 31, 2009.
(1) External operating environmentMitsui Chemicals Group businesses may be influenced by certain elements of the operating environment outside of the Group, including customers, market trends and the business operations of rival firms. With respect to products, a variety of risks could conceivably result in a decline in profitability. These include, but are not limited to, an erosion of market demand, the decision by customers to source products from overseas, deterioration in market conditions caused by oversupply due to increased production capacity at rival firms or the market entry of low-priced imports, and the appearance of alternative products. Profitability may also decline due to the changing cost of raw materials, as well as the impact of supply stop-pages due to accidents or bankruptcies at raw materialmanufacturers. Any or all of these risks could impair the Group’s production activities. Consequently, the occurrence of such risks could adversely impact the Group’s operating performance.
(2) Overseas activities (Country risk)The Mitsui Chemicals Group is involved in a wide range of activities outside of Japan, from the export of products to production at overseas bases. These activities overseas are subject to various risks, including deterioration in political and economic conditions, regulations regarding imports and foreign capital, deterioration in public safety and security, and the outbreak of terrorism or warfare. The occurrence of such risks could impair Group business activities overseas, which may adversely impact operating performance.
(3) Changes in laws and tightening of regulationsThe business development of the Mitsui Chemicals Group is subject to a wide range of legal acts and ordinances, which include a variety of licensing and regulatory requirements. Consequently, the Group remains keenly aware that its contin-ued survival as a corporation is contingent on strict compli-ance with laws and regulations. To this end, the Group has enacted training programs that incorporate examples of legal violations within and outside Mitsui Chemicals together with other initiatives aimed at promoting legal compliance. Other risks faced by the Mitsui Chemicals Group are the prospect of major changes to or a tightening of laws relevant to the Group, or unexpected amendments to laws and regula-tions overseas. Restrictions placed on Group activities, as well as increased costs associated with compliance with amended laws or more stringent regulations, could impair Group busi-ness activities, thus adversely impacting operating perfor-mance.
(4) Financial risksAmong the financial risks faced by the Mitsui Chemicals Group are increased concerns about confidence in customers due to deteriorating economic conditions, currency exchange losses due to dramatic fluctuations in exchange rates, and rising interest rates and a reluctance to lend by financial institutions with respect to fund procurement. The occurrence of any one of these risks could adversely impact the Group’s financial position.
(5) Accidents and disastersIn an effort to ensure workplace safety, the Mitsui Chemicals Group vigorously promotes OHSAS 18001 certification of the occupational health and safety management systems used in its production activities at plants. Business continuity plans have also been formulated to quickly reestablish the business chain of command in the event that head office functions are affected by a major earthquake in the Tokyo metropolitan area. Nevertheless, the Group faces risks from a variety of unforeseen events, including damage to production facilities caused by natural disasters such as major earthquakes and typhoons, plant accidents, and accidents during the course of product transport or storage at warehousing facilities outside the Group. The occurrence of these risks may not only impede plant operations or the supply of products to custom-ers, thereby adversely impacting the Group’s operating perfor-mance and financial position, but could also potentially undermine the social standing of the Mitsui Chemicals Group.
BusinessRisks

49
(6) QualityTo uphold its quality assurance system, the Mitsui Chemicals Group vigorously promotes efforts to obtain ISO 9001 certifi-cation of the quality management systems at each of its plants. Nevertheless, the Group faces risks from the discovery of unforeseen quality defects in its products and product liability lawsuits. Because many Group products are used as raw materials in finished consumer goods, the appearance of large-scale customer recalls due to product defects could potentially result in massive damages. The occurrence of these risks may not only adversely impactthe Group’s operating performance and financial position, but could also potentially undermine the social standing of the Mitsui Chemicals Group.
(7) The environmentAs a group that handles a wide range of chemical substances, the Mitsui Chemicals Group has made harmony with the environment one of its long-term management targets. In addition to ensuring compliance with environmental laws and regulations, the Group promotes initiatives for reducing green-house gas (GHG) emissions and minimizing the amount of industrial waste sent to landfill for final disposal. Environmental risks relevant to the Group include the incurrence of new social responsibilities due to tighter environ-mental regulations or changes in public sentiment regarding environmental protection, as well as the discovery of environ-mental pollution stemming from actions taken by the Group prior to the enactment of environmental laws. These and other situations could increase costs associated with legal compli-ance and environmental countermeasures and have other consequences, which could adversely impact the Group’s operating performance.

50
Millions of yen
Thousands of U.S. dollars
(Note 3)
ASSETS 2009 2008 2007 2009
Current assets:
Cash and cash equivalents (Note 4) ¥ 47,949 ¥ 25,502 ¥ 40,443 $ 488,130
Short-term investments 499 430 2,467 5,080
Receivables:
Trade notes and accounts receivable 174,845 332,953 346,659 1,779,955
Other 29,460 69,371 57,062 299,908
Inventories (Note 5) 250,654 269,229 257,069 2,551,705
Deferred tax assets — current (Note 10) 5,310 18,268 19,283 54,057
Other current assets (Note 6) 21,183 11,066 10,669 215,647
Allowance for doubtful accounts (294) (458) (502) (2,993)
Total current assets 529,606 726,361 733,150 5,391,489
Property, plant and equipment (Notes 7 and 9):
Land 169,822 172,140 173,106 1,728,820
Buildings and structures 308,596 303,888 296,416 3,141,566
Machinery and equipment 1,093,374 1,087,996 1,059,529 11,130,754
Construction in progress 30,277 50,448 22,651 308,226
1,602,069 1,614,472 1,551,702 16,309,366
Accumulated depreciation (1,079,428) (1,049,667) (1,009,362) (10,988,782)
Property, plant and equipment, net 522,641 564,805 542,340 5,320,584
Investments and other non-current assets:
Investment securities (Note 6):
Non-consolidated subsidiaries and affiliates 37,025 47,019 55,578 376,922
Other 55,901 74,434 114,901 569,083
Long-term receivables 4,520 6,621 6,463 46,014
Deferred tax assets — non-current (Note 10) 4,992 18,299 7,389 50,820
Other non-current assets (Note 7) 36,097 33,743 40,253 367,474
Allowance for doubtful accounts (1,843) (2,034) (1,891) (18,762)
Total investments and other non-current assets 136,692 178,082 222,693 1,391,551
Total assets ¥1,188,939 ¥1,469,248 ¥1,498,183 $12,103,624
The accompanying notes are an integral part of these consolidated financial statements.
ConsolidatedBalance SheetsMITSUI CHEMICALS, INC. AND CONSOLIDATED SUBSIDIARIES
March 31, 2009, 2008 and 2007

51
Millions of yen
Thousands of U.S. dollars
(Note 3)
LIAbILITIES And nET ASSETS 2009 2008 2007 2009
Current liabilities:
Short-term bank loans (Note 7) ¥ 149,304 ¥ 96,329 ¥ 133,690 $ 1,519,943
Current portion of long-term debt (Note 7) 27,938 36,860 42,213 284,414
Commercial paper (Note 7) 14,200 80,000 51,000 144,559
Payables:
Trade notes and accounts payable 98,394 239,031 242,866 1,001,670
Other 52,806 67,440 56,379 537,575
Employees’ savings deposits 579 712 1,261 5,894
Accrued expenses 18,260 22,584 23,701 185,890
Accrual for directors’ bonuses 49 122 160 499
Reserve for periodic repairs 12,433 8,703 11,601 126,570
Accrued income taxes (Note 10) 2,930 15,513 25,101 29,828
Other current liabilities (Notes 7 and 10) 965 2,266 3,281 9,824
Total current liabilities 377,858 569,560 591,253 3,846,666
Long-term liabilities:
Long-term debt due after one year (Note 7) 343,622 272,783 271,420 3,498,137
Accrued employees’ retirement benefits (Note 8) 33,373 33,564 50,353 339,743
Accrued directors’ and corporate auditors’ retirement benefits
443 369 1,288 4,510
Reserve for periodic repairs 2,658 4,874 2,290 27,059
Provision for environmental measures 11,948 11,106 — 121,633
Other non-current liabilities (Notes 7 and 10) 20,906 12,765 11,327 212,827
Total long-term liabilities 412,950 335,461 336,678 4,203,909
Contingent liabilities (Note 12)
net assets:
Shareholders’ equity (Note 11):
Common stock:
Authorized—3,000,000,000 shares
Issued – 792,020,076 shares in 2009, 2008 and 2007, 103,226 103,226 103,226 1,050,860
Capital surplus 69,238 69,238 69,257 704,856
Retained earnings 221,721 326,932 311,703 2,257,162
Treasury stock, at cost:
40,428,862 shares in 2009, 22,287,515 shares in 2008, and 20,407,827 shares in 2007
(29,827)
(19,826)
(18,280)
(303,644)
364,358 479,570 465,906 3,709,234
Valuation and translation adjustments:
Net unrealized holding gain on securities 7,319 19,125 34,290 74,509
Net unrealized holding gain (loss) on hedging derivatives (3) 39 21 (31)
Foreign currency translation adjustments (21,766) 1,310 4,292 (221,582)
(14,450) 20,474 38,603 (147,104)
Minority interests 48,223 64,183 65,743 490,919
Total net assets 398,131 564,227 570,252 4,053,049
Total liabilities and net assets ¥1,188,939 ¥1,469,248 ¥1,498,183 $12,103,624

52
Millions of yen
Thousands of U.S. dollars
(Note 3) 2009 2008 2007 2009
Net sales ¥1,487,615 ¥1,786,680 ¥1,688,062 $15,144,202
Cost of sales (Notes 8 and 14) 1,341,106 1,509,308 1,402,022 13,652,713
Gross profit 146,509 277,372 286,040 1,491,489
Selling, general and administrative expenses (Notes 8 and 14) 192,002 200,196 194,362 1,954,617
Operating income (loss) (45,493) 77,176 91,678 (463,128)
Other income (expenses):
Interest expense (9,323) (9,512) (8,096) (94,910)
Interest and dividend income 3,988 3,972 2,721 40,599
Equity in earnings of non-consolidated subsidiaries and affiliates 2,992 5,947 5,979 30,459 Loss on disposal of inventories — (5,462) (2,656) —
Foreign exchange losses (4,398) (6,149) — (44,772)
Gain on sales of investment securities (Note 6) 1,635 743 1,938 16,645
Loss on valuation of investment securities (1,932) — — (19,668)
Loss on sales and disposal of property, plant and equipment (7,093) (5,399) (5,979) (72,208)
Loss on impairment of fixed assets (Note 9) (3,935) (719) (1,347) (40,059)
Loss on restructuring of subsidiaries and affiliates (2,243) (2,871) (1,997) (22,834)
Gain on change in interests in consolidated subsidiary — — 3,102 —
Environmental expenses (1,400) (11,746) — (14,252)
Other, net 1,773 (1,427) (801) 18,048
(19,936) (32,623) (7,136) (202,952)
Income (loss) before income taxes and minority interests (65,429) 44,553 84,542 (666,080)
Income taxes (Note 10):
Current 5,700 20,067 28,875 58,027
Deferred 34,919 (637) (1,459) 355,482
40,619 19,430 27,416 413,509
Income (loss) before minority interests (106,048) 25,123 57,126 (1,079,589)
Minority interests in earnings of consolidated subsidiaries 10,811 (292) (4,829) 110,058
Net income (loss) ¥ (95,237) ¥ 24,831 ¥ 52,297 $ (969,531)
Millions of yen
U.S. dollars (Note 3)
Amounts per share of common stock:
Net income (loss) ¥(125.46) ¥32.22 ¥66.68 $(1.277)
Cash dividends applicable to the year 9.00 12.00 10.00 0.092
The accompanying notes are an integral part of these consolidated financial statements.
ConsolidatedStatements of OperationsMITSUI CHEMICALS, INC. AND CONSOLIDATED SUBSIDIARIES
For the years ended March 31, 2009, 2008 and 2007

53
Millions of yen
Number of shares of common
stock (Thousands)
Common stock
Capital surplus
Retained earnings
Treasury stock, at cost
Net unrealized holding gain on securities
Net unrealized holding
gain (loss) on hedging derivatives
Foreign currency
translation adjustments
Minority interests
Total net assets
Balance at March 31, 2006 789,156 ¥103,226 ¥66,945 ¥269,191 ¥ (3,593) ¥29,016 ¥— ¥ (764) ¥75,103 ¥539,124
Share exchange (Note 17) 2,864 — 2,310 — 2,667 — — — — 4,977
Cash dividends paid — — — (6,299) — — — — — (6,299)
Bonuses to directors and corporate auditors — — — (103) — — — — — (103)
Net income — — — 52,297 — — — — — 52,297
Purchase of treasury stock — — — — (17,866) — — — — (17,866)
Disposition of treasury stock — — 2 — 36 — — — — 38
Changes resulting from decrease in non-consolidated subsidiaries and affiliates accounted for by the equity method — — — (3,383) 476 — — — — (2,907)
Other changes — — — — — 5,274 21 5,056 (9,360) 991
Balance at March 31, 2007 792,020 ¥103,226 ¥69,257 ¥311,703 ¥(18,280) ¥34,290 ¥21 ¥4,292 ¥65,743 ¥570,252
Cash dividends paid — — — (9,256) — — — — — (9,256)
Net income — — — 24,831 — — — — — 24,831
Purchase of treasury stock — — — — (1,809) — — — — (1,809)
Disposition of treasury stock — — (19) (22) 263 — — — — 222
Changes resulting from decrease in non-consolidated subsidiaries and affiliates accounted for by the equity method — — — (324) — — — — — (324)
Other changes — — — — — (15,165) 18 (2,982) (1,560) (19,689)
Balance at March 31, 2008 792,020 ¥103,226 ¥69,238 ¥326,932 ¥(19,826) ¥19,125 ¥39 ¥1,310 ¥64,183 ¥564,227
Effect of changes in accounting policies applied to foreign subsidiaries — — — (588) — — — — — (588)
Cash dividends paid — — — (9,128) — — — — — (9,128)
Net loss — — — (95,237) — — — — — (95,237)
Purchase of treasury stock — — — — (10,629) — — — — (10,629)
Disposition of treasury stock — — — (258) 628 — — — — 370
Other changes — — — — — (11,806) (42) (23,076) (15,960) (50,884)
balance at March 31, 2009 792,020 ¥103,226 ¥69,238 ¥221,721 ¥(29,827) ¥ 7,319 ¥ (3) ¥(21,766) ¥48,223 ¥398,131
Thousands of U.S. dollars (Note 3)
Common stock
Capital surplus
Retained earnings
Treasury stock, at cost
Net unrealized holding gain on securities
Net unrealized holding
gain (loss) on hedging derivatives
Foreign currency
translation adjustments
Minority interests
Total net assets
Balance at March 31, 2008 $1,050,860 $704,856 $3,328,230 $(201,832) $194,696 $397 $13,336 $653,395 $5,743,938Effect of changes in accounting policies applied to foreign subsidiaries — — (5,986) — — — — — (5,986)
Cash dividends paid — — (92,925) — — — — — (92,925)
Net loss — — (969,531) — — — — — (969,531)
Purchase of treasury stock — — — (108,205) — — — — (108,205)
Disposition of treasury stock — — (2,626) 6,393 — — — — 3,767
Other changes — — — — (120,187) (428) (234,918) (162,476) (518,009)
balance at March 31, 2009 $1,050,860 $704,856 $2,257,162 $(303,644) $ 74,509 $ (31) $(221,582) $490,919 $4,053,049
The accompanying notes are an integral part of these consolidated financial statements.
ConsolidatedStatements of Changes in Net AssetsMITSUI CHEMICALS, INC. AND CONSOLIDATED SUBSIDIARIES
For the years ended March 31, 2009, 2008 and 2007
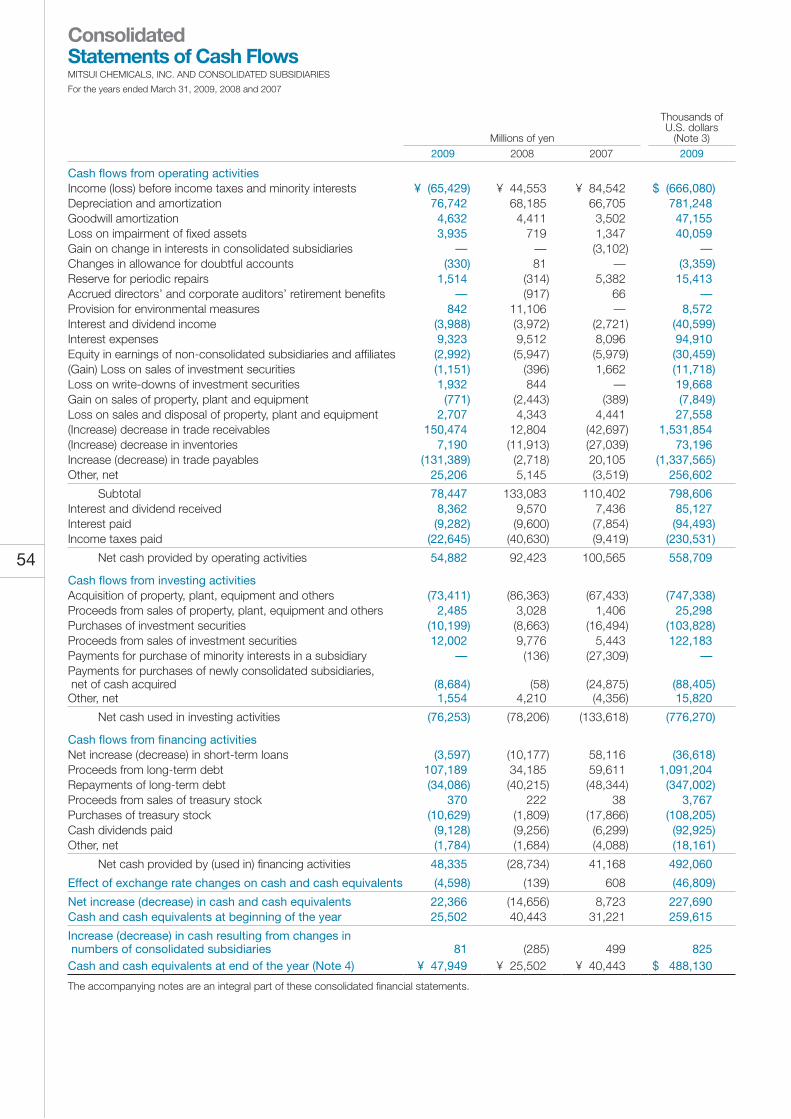
54
Millions of yen
Thousands of U.S. dollars
(Note 3) 2009 2008 2007 2009
Cash flows from operating activitiesIncome (loss) before income taxes and minority interests ¥ (65,429) ¥ 44,553 ¥ 84,542 $ (666,080)Depreciation and amortization 76,742 68,185 66,705 781,248Goodwill amortization 4,632 4,411 3,502 47,155Loss on impairment of fixed assets 3,935 719 1,347 40,059Gain on change in interests in consolidated subsidiaries — — (3,102) —Changes in allowance for doubtful accounts (330) 81 — (3,359)Reserve for periodic repairs 1,514 (314) 5,382 15,413Accrued directors’ and corporate auditors’ retirement benefits — (917) 66 —Provision for environmental measures 842 11,106 — 8,572Interest and dividend income (3,988) (3,972) (2,721) (40,599)Interest expenses 9,323 9,512 8,096 94,910Equity in earnings of non-consolidated subsidiaries and affiliates (2,992) (5,947) (5,979) (30,459)(Gain) Loss on sales of investment securities (1,151) (396) 1,662 (11,718)Loss on write-downs of investment securities 1,932 844 — 19,668Gain on sales of property, plant and equipment (771) (2,443) (389) (7,849)Loss on sales and disposal of property, plant and equipment 2,707 4,343 4,441 27,558(Increase) decrease in trade receivables 150,474 12,804 (42,697) 1,531,854(Increase) decrease in inventories 7,190 (11,913) (27,039) 73,196Increase (decrease) in trade payables (131,389) (2,718) 20,105 (1,337,565)Other, net 25,206 5,145 (3,519) 256,602
Subtotal 78,447 133,083 110,402 798,606Interest and dividend received 8,362 9,570 7,436 85,127Interest paid (9,282) (9,600) (7,854) (94,493)Income taxes paid (22,645) (40,630) (9,419) (230,531)
Net cash provided by operating activities 54,882 92,423 100,565 558,709
Cash flows from investing activitiesAcquisition of property, plant, equipment and others (73,411) (86,363) (67,433) (747,338)Proceeds from sales of property, plant, equipment and others 2,485 3,028 1,406 25,298Purchases of investment securities (10,199) (8,663) (16,494) (103,828)Proceeds from sales of investment securities 12,002 9,776 5,443 122,183Payments for purchase of minority interests in a subsidiary — (136) (27,309) —Payments for purchases of newly consolidated subsidiaries, net of cash acquired (8,684) (58) (24,875) (88,405)Other, net 1,554 4,210 (4,356) 15,820
Net cash used in investing activities (76,253) (78,206) (133,618) (776,270)
Cash flows from financing activitiesNet increase (decrease) in short-term loans (3,597) (10,177) 58,116 (36,618)Proceeds from long-term debt 107,189 34,185 59,611 1,091,204Repayments of long-term debt (34,086) (40,215) (48,344) (347,002)Proceeds from sales of treasury stock 370 222 38 3,767Purchases of treasury stock (10,629) (1,809) (17,866) (108,205)Cash dividends paid (9,128) (9,256) (6,299) (92,925)Other, net (1,784) (1,684) (4,088) (18,161)
Net cash provided by (used in) financing activities 48,335 (28,734) 41,168 492,060
Effect of exchange rate changes on cash and cash equivalents (4,598) (139) 608 (46,809)
net increase (decrease) in cash and cash equivalents 22,366 (14,656) 8,723 227,690Cash and cash equivalents at beginning of the year 25,502 40,443 31,221 259,615
Increase (decrease) in cash resulting from changes in numbers of consolidated subsidiaries 81 (285) 499 825Cash and cash equivalents at end of the year (note 4) ¥ 47,949 ¥ 25,502 ¥ 40,443 $ 488,130
The accompanying notes are an integral part of these consolidated financial statements.
ConsolidatedStatements of Cash FlowsMITSUI CHEMICALS, INC. AND CONSOLIDATED SUBSIDIARIES
For the years ended March 31, 2009, 2008 and 2007

55
1. BASIS OF PREPARATIONThe accompanying consolidated financial statements of Mitsui Chemicals, Inc. (the “Company”) and its consolidated subsidiaries have been prepared in accordance with accounting principles generally accepted in Japan and have been compiled from those prepared by the Company as required under the Financial Instruments and Exchange Law of Japan (formerly Securities and Exchange Law), which are different in certain respects as to the application and disclosure requirements of International Financial Reporting Standards. Effective April 1, 2008, the Company adopted the “Practical solution on Unification of Accounting Policies Applied to Foreign Subsidiaries for Consolidated Financial Statement (PITF No. 18).” In accordance with PITF No. 18, the accompanying consolidat-ed financial statements for the year ended March 31, 2009 have been prepared with necessary adjustments for certain items. In preparing the accompanying consolidated financial statements, certain reclassifications have been made to the consolidated financial statements issued domestically in order to present them in a form which is more familiar to readers outside Japan.
2. SIGNIFICANT ACCOUNTING POLICIES
a. ConsolidationThe accompanying consolidated financial statements include the accounts of the Company and significant companies over which the Company exerts control through majority voting rights or the existence of certain conditions evidencing substantial control by the Company. Investments in non-consolidated subsidiaries and affiliates, in which the Company has the ability to exercise significant influ-ence over their operating and financial policies, are accounted for by the equity method. Non-consolidated subsidiaries and affiliates in the process of liquidation are stated at cost or less. As of March 31, 2009, the numbers of consolidated subsidiaries and non-consolidated subsidiaries and affiliates accounted for by the equity method were 66 and 32, respectively. In the elimination of investments in subsidiaries, the portion of the assets and liabilities of a subsidiary attributable to the subsidiary’s shares acquired by the Company is recorded based on its fair value as of the respective dates when such shares were acquired. The amounts of assets and liabilities attributable to minority shareholders of the subsidiaries are recorded based on the finan-cial statements of each subsidiary. The excess of the cost of investments in consolidated subsidiaries over the net assets acquired is deferred as a consolidation difference and is amortized over a period of twenty years or less. All significant intercompany transactions and accounts have been eliminated in consolidation.
b. Foreign currency translationReceivables and payables denominated in foreign currencies are translated into Japanese yen at the year-end rates. The Company and its domestic consolidated subsidiaries have reported foreign currency translation adjustments as a component of valuation and translation adjustments and minority interests.
c. InventoriesInventories are stated primarily at cost by the last-in, first-out method (the balance sheet amount is written down based on the decrease in profitability). Previously, inventories were stated primarily at the lower of cost or market, cost being determined by the last-in, first-out meth-od. Effective the year ended March 31, 2009, the Company and its domestic consolidated subsidiaries adopted the “Accounting Standard for Measurement of Inventories” (ASBJ Statement No. 9, July 5, 2006). As a result of adopting this standard, for the year ended March 31, 2009, operating loss decreased by ¥7,207 million ($73,369 thousand) and loss before income taxes and minority interests decreased by ¥9,699 million ($98,738 thousand) compared to the amounts that would have been reported if the previous methods had been applied consistently.
d. SecuritiesSecurities other than equity securities issued by subsidiaries and affiliates, which is held by the Company and its subsidiaries, are classified into two categories: held-to-maturity or available-for-sale securities. Held-to-maturity securities are carried at amortized cost. Marketable securities classified as available-for-sale securities are carried at fair value with changes in unrealized holding gain or loss, net of the applicable income taxes, included directly in net assets. Non-marketable securities classified as available-for-sale securities are stated at cost by the moving-average method. Cost of securities sold is determined by the moving-average method.
e. Property, plant and equipment (Except for assets leased)Property, plant and equipment are stated at cost. Depreciation is calculated principally by the declining-balance method over the estimated useful lives of the respective assets except for buildings, which are depreciated using the straight-line method.
Notes toConsolidated Financial StatementsMITSUI CHEMICALS, INC. AND CONSOLIDATED SUBSIDIARIES
For the years ended March 31, 2009, 2008 and 2007

56
Maintenance, repairs and minor renewals are currently charged to income; major renewals and improvements are capitalized. For the year ended March 31, 2007, to unify the accounting policy among the Mitsui Chemicals Group, several consolidated subsidiaries, which were additionally wholly-owned by the Company, changed the depreciation method from the straight-line method to the declining-balance method for the property, plant and equipment except for buildings. As a result of this change, depreciation and amortization increased by ¥1,220 million and operating income and income before income taxes and minority interests decreased by ¥1,214 million compared to the amounts that would have been reported if the previous methods had been applied consistently. Effective the year ended March 31, 2008, the Company and its domestic consolidated subsidiaries changed the depreciation method for the property, plant and equipment acquired on or after April 1, 2007 due to the revision of Japanese Corporate Tax Law and its regulation. As a result of this change, for the year ended March 31, 2008, depreciation and amortization increased by ¥1,872 million and operating income and income before income taxes and minority interests decreased by ¥1,848 million com-pared to the amounts that would have been reported if the previous methods had been applied consistently. Effective the year ended March 31, 2008, the Company and its domestic consolidated subsidiaries started the depreciation for the property, plant and equipment, which were acquired on or before March 31, 2007 and were already depreciated to 5% of the acquisition cost. The depreciation of the difference of the acquisition cost and the nominal amount was calculated by the straight-line method over next five years after these assets were depreciated to 5% of the acquisition cost. The depreciation was charged to depreciation expense. As a result of this change, for the year ended March 31, 2008, depreciation and amortization increased by ¥993 million and operating income and income before income taxes and minority interests decreased by ¥967 million com-pared to the amounts that would have been reported if the previous methods had been applied consistently. The effect of this change on segment information is disclosed in note 16. Effective the year ended March 31, 2009, the Company and its domestic consolidated subsidiaries revised the useful life of machinery in response to the revision of the Corporate Tax Law. As a result, for the year ended March 31, 2009, this change had only minor impact on operating loss and loss before income taxes and minority interests.
f. Intangible assets (Except for assets leased)Amortization of intangible assets of the Company and its consolidated subsidiaries is calculated by the straight-line method.The cost of software intended for internal use is amortized using the straight-line method over its estimated useful life (five years).
g. Research and development expensesExpenses relating to research and development activities are charged to income as incurred.
h. LeasesThe Company and its consolidated subsidiaries lease certain machinery and equipment under noncancelable leases referred to as finance leases. Previously, finance leases other than those which transfer the ownership of the leased property to the lessees are accounted for in the same manner as operating leases. Effective the year ended March 31, 2009, the Company adopted the “Accounting Standard for Lease Transactions” (ASBJ Statement No. 13, revised on March 30, 2007) and the “Guidance on Accounting Standard for Lease Transactions” (ASBJ Guidance No. 16, revised on March 30, 2007), and such transactions are now account-ed for as ordinary sale and purchase transactions. Depreciation of leased assets is computed by the straight-line method over the respective lease terms. In addition, finance lease transactions starting before March 31, 2008 that do not transfer ownership of the leased property to the lessees are accounting for as operating leases. As a result, in the year ended March 31, 2009, this change had only minor impact on operating loss and loss before income taxes and minority interests.
i. Derivatives and hedge accountingThe Company and its consolidated subsidiaries state derivative financial instruments at fair value and recognize any changes in fair value as gains or losses unless the derivatives are being utilized for hedging purposes. If the derivatives meet certain hedging criteria, the Company and its consolidated subsidiaries defer recognition of gains or losses resulting from changes in fair value of the derivatives positions until the related losses or gains on the hedged items are recognized. However, in cases where forward foreign exchange contracts used as hedges meet certain hedging criteria, the existing foreign currency receivables or payables are translated at their respective contract rates. In addition, if interest-rate swap contracts meet certain hedging criteria, the net amount to be paid or received under these swap contracts is added to or deducted from the interest on the assets or liabilities for which the swap contracts were executed.
j. Allowance for doubtful accountsThe allowance for doubtful accounts is provided at amounts sufficient to cover probable losses on collection. It consists of the estimated uncollectible amounts with respect to identified doubtful accounts and an amount calculated by a formula based on actual collection losses incurred in the past with respect to the remaining receivables.

57
k. Employees’ retirement benefitsEmployees of the Company and its domestic consolidated subsidiaries are covered by an employees’ retirement benefit plan and two non-contributory defined benefit pension plans. In addition, the Company and certain of its consolidated subsidiaries have set up an employees’ retirement benefit trust. Under these plans, all eligible employees are entitled to certain benefits based on their abilities, occupational roles, work perfor-mances, length of service and certain other factors. The liabilities and expenses for severance and retirement benefits are determined based on the amounts calculated actuarially under certain assumptions. The Company and its consolidated subsidiaries have provided an allowance for employees’ severance and retirement benefits based on the estimated amounts of the projected benefit obligation less the fair value of the pension plan assets. Prior service cost is recognized as incurred or is amortized by the straight-line method over certain years (10 years) within the average estimated remaining service years of the eligible employees. Actuarial gain or loss is recognized by the straight-line method over certain years (10 to 13 years) within the average estimated remaining service years of the eligible employees commencing the year following the year in which the gain or loss was recognized.
l. Accrual for directors’ bonusesEffective the year ended March 31, 2007, the Company provided on accrual for bonuses to directors. Directors’ bonuses had been previously accounted for as a decrease in retained earnings. Effective the year ended March 31, 2007, the Company adopted a new accounting standard, “Accounting Standard for Directors’ Bonuses” (ASBJ Statement No. 4, November 29, 2005). As a result of adopting the standard, directors’ bonuses have been accounted for as an expense, not as a decrease in retained earnings. The Company provided an accrual for the estimated amount of directors’ bonuses at the end of the year. The effect on net income was not material. Reflecting a significant deterioration in its performance for the year ended March 31, 2009, the Company has reduced com-pensation paid to directors and management personnel. In addition, all directors will return to the Company, in full, the bonuses that they have received during the year ended March 31, 2009. Accounting for these activities, the Company has not provided for accrual for directors’ bonuses during the year ended March 31, 2009.
m. Directors’ and corporate auditors’ retirement benefitsCertain domestic consolidated subsidiaries accrue liabilities for the aggregate amount payable for directors’ and corporate audi-tors’ retirement benefits, pursuant to the internal regulations. Effective from the meeting of the Company’s shareholders held on June 28, 2005, the Company abolished its system of retire-ment benefits for directors and corporate auditors, but plans to pay out a suitable level of benefits applicable to directors and cor-porate auditors for their time in office up to the date of abolishment upon their retirement. Accordingly, while no further liabilities will be incurred for directors’ and corporate auditors’ retirement benefits due to the system’s abolishment, the remaining balance of liabilities will be cancelled as said directors and corporate auditors retire. Several domestic consolidated subsidiaries have abolished the system of retirement benefits for directors and corporate auditors. As a result, effective from the year ended March 31, 2008, Accrued directors’ and corporate auditors’ retirement benefits of the Company and those subsidiaries are shown in Other noncurrent liabilities.
n. Reserve for periodic repairsThe Company and several consolidated subsidiaries provide a reserve for the costs of periodic repairs of production facilities at plants. For the year ended March 31, 2007, to unify the accounting policy among the Mitsui Chemicals Group, several consolidated subsidiaries, which were additionally wholly-owned by the Company, provided a reserve for the costs of annual repairs. As a result of this change, for the year ended March 31, 2007, operating income decreased by ¥731 million and income before income taxes and minority interests decreased by ¥1,762 million compared to the amounts that would have been reported if the previous accounting policy had been applied consistently.
o. Provision for environmental measuresEffective from the year ended March 31, 2008, the Company provided a provision for environmental measures. As a result, income before income taxes and minority interests decreased by ¥11,106 million for the year ended March 31, 2008.
p. Amounts per share of common stockThe computation of net income per share is based on the weighted average number of shares of common stock outstanding dur-ing each year. Cash dividends per share represent the actual amount applicable to each respective year.
q. Cash and cash equivalentsIn preparing the consolidated statements of cash flows, cash on hand, readily-available deposits and short-term highly liquid investments with maturities not in excess of three months from the date of purchase are considered cash and cash equivalents.

58
r. Accounting standard for presentation of net assets in the balance sheetEffective the year ended March 31, 2007, the Company has adopted a new accounting standard entitled “Accounting Standards for Presentation of Net Assets in the Balance Sheet” (ASBJ Statement No. 5, December 9, 2005) and “Guidance on Accounting Standard for Presentation of Net Assets in the Balance Sheet” (ASBJ Guidance No. 8, December 9, 2005). Under the new accounting standard and the related guidance, “Net unrealized holding gain on hedging derivatives,” “Share subscription rights,” and “Minority interests” are required to be shown in net assets. At March 31, 2007, the amount corresponding to conventional “Total shareholders’ equity” in the consolidated balance sheet was ¥504,488 million. At March 31, 2008, the amount corresponding to conventional “Total shareholders’ equity” in the consoli-dated balance sheet was ¥500,005 million.
s. Accounting standard for statement of changes in net assetsEffective the year ended March 31, 2007, the Company and its consolidated domestic subsidiaries have adopted a new accounting standard entitled “Accounting Standard for Statement of Changes in Net Assets” (ASBJ Statement No. 6, December 27, 2005) and “Guidance on Accounting Standard for Statement of Changes in Net Assets” (ASBJ Guidance No. 9, December 27, 2005).
t. Accounting standards for business combinations and divestituresEffective the year ended March 31, 2007, the Company and its consolidated domestic subsidiaries have adopted a new account-ing standard entitled “Accounting Standard for Business Combinations in Japan” (Business Accounting Council, October 31, 2003), and “Accounting Standard for Business Divestitures” (ASBJ Statement No. 7, December 27, 2005), and its guidance enti-tled “Guidance on Accounting Standard for Business Combinations and Accounting Standard for Business Divestitures” (ASBJ Guidance No. 10, revised November 15, 2007).
u. Practical Solution on Unification of Accounting Policies Applied to Foreign Subsidiaries for Consolidated Financial StatementsEffective the year ended March 31, 2009, the Company adopted “Practical Solution on Unification of Accounting Policies Applied to Foreign Subsidiaries for Consolidated Financial Statements” (ASBJ Practical Issues Task Force No. 18, May 17, 2006) and has made necessary adjustment to the consolidated financial statements. As a result, in the year ended March 31, 2009, this change had only minor impact on operating loss and loss before income taxes and minority interests.
3. U.S. DOLLAR AMOUNTSThe translation of yen amounts into U.S. dollar amounts is included solely for the convenience of readers, using ¥98.23=US$1.00, the approximate rate of exchange in effect on March 31, 2009. The translation should not be construed as a representation that yen amounts have been, could have been, or could in the future be, converted into U.S. dollars at the above or any other rate.
4. SUPPLEMENTARY CASH FLOW INFORMATIONCash and cash equivalents consist of cash on hand, cash in banks which can be withdrawn at any time and short-term invest-ments with a maturity of three months or less when purchased which can easily be converted to cash and are subject to little risk of change in value. Cash and cash equivalents at March 31, 2009, 2008 and 2007 were as follows:
Millions of yen
Thousands of U.S. dollars
2009 2008 2007 2009
Cash ¥47,949 ¥21,752 ¥32,568 $488,130Cash equivalents — 3,750 7,875 —
Total ¥47,949 ¥25,502 ¥40,443 $488,130
The following is the summary of assets acquired and liabilities assumed through the acquisition of share of SDC Technologies, Inc. and other four companies for the year ended March 31, 2009, relating acquisition costs and net disbursement:
Millions of yen Thousands of
U.S. dollars
Current assets ¥ 711 $ 7,238Non-current assets 6,241 63,535Goodwill 6,685 68,055Current liabilities (2,456) (25,003)Long-term liabilities (2,276) (23,170)
Acquisition value of shares 8,905 90,655Cash and cash equivalents (221) (2,250)Net disbursement due to the acquisition ¥ 8,684 $ 88,405

59
5. INVENTORIESInventories at March 31, 2009, 2008 and 2007 were as follows:
Millions of yen
Thousands of U.S. dollars
2009 2008 2007 2009
Finished goods ¥183,314 ¥188,192 ¥183,135 $1,866,171
Work in process 3,826 4,313 5,685 38,949
Raw materials and supplies 63,514 76,724 68,249 646,585
Total ¥250,654 ¥269,229 ¥257,069 $2,551,705
6. SECURITIESA. The following tables summarize the acquisition cost and book value of marketable securities as of March 31, 2009, 2008 and
2007:Available-for-sale securitiesSecurities with book value exceeding their acquisition cost
Millions of yen
Thousands of U.S. dollars
2009 2008 2007 2009
Equity securities and bonds: Acquisition cost ¥17,484 ¥19,409 ¥30,386 $177,990 Book value 31,311 49,210 85,033 318,752 Difference 13,827 29,801 54,647 140,762
Securities with book value not exceeding their acquisition cost
Millions of yen Thousands of
U.S. dollars
2009 2008 2007 2009
Equity securities and bonds: Acquisition cost ¥8,320 ¥5,508 ¥8,153 $84,699 Book value 6,308 5,155 7,803 64,217 Difference (2,012) (353) (350) (20,482)
B. The following table summarizes the book value of non-marketable securities as of March 31, 2009, 2008 and 2007:
Millions of yen Thousands of
U.S. dollars
2009 2008 2007 2009
(a) Held-to-maturity debt securities: Government and municipal bonds ¥ 25 ¥ 41 ¥ 48 $ 255(b) Available-for-sale securities: Unlisted equity securities ¥13,476 ¥21,475 ¥22,200 $137,188 Unlisted preferred securities ¥ 5,400 — — $ 54,973
C. The redemption schedule of available-for-sale securities with maturities and held-to-maturity debt securities as of March 31, 2009, 2008 and 2007 were as follows:
Millions of yen
Thousands of U.S. dollars
2009 2008 2007 2009
Bonds: Due within one year ¥1,101 ¥1,716 ¥ 449 $11,208 Due over one year but within five years 816 1,924 3,628 8,307 Due over five years but within ten years — 1 6 — Due over ten years 101 100 93 1,028
Total ¥2,018 ¥3,741 ¥4,176 $20,543
D. Information related to sales of available-for-sale securities for the years ended March 31, 2009, 2008 and 2007 were as follows:
Millions of yen Thousands of
U.S. dollars
2009 2008 2007 2009
Sales – total ¥1,815 ¥771 ¥2,860 $18,477
Related gain – total 1,424 586 1,082 14,497
Related loss – total 20 27 2 204

60
7. SHORT-TERM DEBT AND LONG-TERM DEBTAt March 31, 2009, 2008 and 2007, short-term debts were as follows:
Millions of yen
Thousands of U.S. dollars
2009 2008 2007 2009
0.50% – 7.35% bank loans ¥149,304 ¥ 96,329 ¥133,690 $1,519,943
Commercial paper ¥ 14,200 ¥ 80,000 ¥ 51,000 $ 144,559
At March 31, 2009, 2008 and 2007, long-term debts were as follows:Bonds payable guaranteed by a bank: 0.80% bonds due in 2010 ¥ 33 ¥ 55 ¥ 77 $ 336Unsecured bonds payable: 2.95% bonds due in 2008 — 10,000 10,000 — 2.7% bonds due in 2008 — 10,000 10,000 — 2.07% bonds due in 2010 10,000 10,000 10,000 101,802 1.94% bonds due in 2011 10,000 10,000 10,000 101,802 1.84% bonds due in 2011 10,000 10,000 10,000 101,802 1.62% bonds due in 2011 10,000 10,000 10,000 101,802 0.79% bonds due in 2007 — — 10,000 — 1.04% bonds due in 2009 10,000 10,000 10,000 101,802 1.36% bonds due in 2012 10,000 10,000 10,000 101,802 0.56% bonds due in 2007 — — 10,000 — 0.78% bonds due in 2013 10,000 10,000 10,000 101,802 1.52% bonds due in 2015 10,000 10,000 10,000 101,802 1.57% bonds due in 2013 10,000 10,000 10,000 101,802 1.84% bonds due in 2016 10,000 10,000 10,000 101,802 2.09% bonds due in 2016 10,000 10,000 10,000 101,802 1.4% bonds due in 2012 10,000 10,000 10,000 101,802 1.96% bonds due in 2017 10,000 10,000 10,000 101,802 1.42% bonds due in 2012 10,000 10,000 — 101,802 1.93% bonds due in 2017 10,000 10,000 — 101,802 1.26% bonds due in 2009 2,000 2,000 2,000 20,360 1.45% bonds due in 2011 1,000 1,000 1,000 10,180Loans, principally from banks and insurance companies: Secured, at rates of 1.07% to 5.10% maturing through 2010 1,050 3,671 6,166 10,689 Unsecured, at rates of 0.75% to 11.65% maturing through 2019 217,477 132,917 134,390 2,213,956Lease obligations 327 — — 3,329
371,887 309,643 313,633 3,785,880Less current portion 27,951 36,860 42,213 284,546
¥343,936 ¥272,783 ¥271,420 $3,501,334
The aggregate annual maturities of long-term debt excluding lease obligations subsequent to March 31, 2009 are summarized as follows: Year ending March 31,
Millions of yen
Thousands of U.S. dollars
2010 ¥ 27,938 $ 284,4142011 50,359 512,6642012 39,471 401,8222013 43,432 442,1462014 and thereafter. 210,360 2,141,505
Total ¥371,560 $3,782,551
The aggregate annual maturities of lease obligations subsequent to March 31, 2009 are summarized as follows: Year ending March 31,
Millions of yen
Thousands of U.S. dollars
2010 ¥ 13 $ 1322011 75 7642012 35 3562013 35 3562014 and thereafter. 169 1,721
Total ¥327 $3,329
At March 31, 2009, the assets pledged as collateral for long-term debt were as follows:
Millions of yen Thousands of
U.S. dollars
Property, plant and equipment, net of accumulated depreciation ¥10,603 $107,941Other non-current assets 127 1,293

61
8. ACCRUED EMPLOYEES’ RETIREMENT BENEFITSThe liability for severance and retirement benefits included in the consolidated balance sheets as of March 31, 2009, 2008 and 2007 consisted of the following:
Millions of yen
Thousands of U.S. dollars
2009 2008 2007 2009
Projected benefit obligation ¥208,611 ¥207,245 ¥210,847 $2,123,699Unrecognized prior service cost (80) 12 16 (815)Unrecognized actuarial loss (73,851) (48,362) (36,888) (751,817)Less fair value of pension plan assets (101,662) (126,690) (124,821) (1,034,938)Prepaid pension and severance cost 355 1,359 1,199 3,614
Liability for severance and retirement benefits ¥ 33,373 ¥ 33,564 ¥ 50,353 $ 339,743
Included in the consolidated statements of income for the years ended March 31, 2009, 2008 and 2007 are severance and retire-ment benefit expenses which comprised of the following:
Millions of yen
Thousands of U.S. dollars
2009 2008 2007 2009
Service cost – benefits earned during the year ¥ 5,525 ¥ 5,655 ¥ 5,414 $ 56,245Interest cost on projected benefit obligation 5,050 5,110 5,021 51,410Expected return on plan assets (2,910) (2,954) (2,611) (29,624)Amortization of actuarial loss 6,232 4,958 4,522 63,443Amortization of prior service cost 10 (4) (4) 102
Severance and retirement benefit expenses ¥13,907 ¥12,765 ¥12,342 $141,576
The discount rate and rate of expected return on the pension plan assets assumed by the Company and its consolidated subsid-iaries were as follows: 2009 2008 2007
Discount rate 2.50% 2.50% 2.50%Rate of expected return on the pension plan assets Principally 2.5% 2.50% 2.50%
The estimated amount of all retirement benefits to be paid at future retirement dates is allocated equally to each service year over the estimated total service years. Prior service cost is recognized as incurred or is amortized by the straight-line method over 10 years. Actuarial gain/loss is recognized by the straight-line method over 10 to 13 years commencing the year following the year in which the gain or loss was recognized.
9. LOSS ON IMPAIRMENT OF FIXED ASSETSLoss on impairment of fixed assets for the year ended March 31, 2009 consisted of the following:
Location
Major use
Asset category
Millions of yen
Thousands of U.S. dollars
Remarks
Nagoya City, Aichi Prefecture Production Facilities Machinery and equipment, buildings and structures, others
¥1,046
$10,648
Business assets in use
Nerima City, Tokyo Metropolis
Company house for employees
buildings and structures, land
¥ 695
$ 7,075
At the point of recording: business assets in use/At the end of the year: idle property
Others 7 items Production Facilities Machinery and equipment, buildings and structures, others
¥1,608
$16,370
Business assets in use
5 items Company house for employees, etc.
buildings and structures, land, others
¥ 586
$ 5,966
Business assets in use or idle property
Total ¥3,935 $40,059
The Company and its consolidated subsidiaries have categorized assets used for business activities based on business divisions or units based on business divisions. Of these assets, those assets that are to be disposed of due to withdrawal from a business or for another reason are assessed on an individual basis. Those assets that are idle or not being used for production activities are assessed on an individual basis. Regarding assets used for business activities, the book value for assets to be disposed of due to withdrawal from a business or for another reason is, in cases where the recoverable amount is below book value, reduced to the recoverable amount. The resulting impairment loss amounting to ¥3,909 million ($39,794 thousand) was recorded as other expenses. This impairment loss comprised ¥1,948 million ($19,831 thousand) for machinery and equipment, ¥1,078 million ($10,974 thousand) for buildings and structures, ¥645 million ($6,566 thousand) for land, and ¥238 million ($2,423 thousand) for other assets.

62
In addition, the calculation of recoverable amounts based on either net sales price or utility value. The estimated sales prices were used as net sales price, meanwhile since there were no future cash flows, the utility values were zero. The book value of assets that are idle or not being used for production activities is, in cases where there are no specific plans for future use and where the recoverable amount is below its book value due to a decline in the market price of land or another reason, reduced to the recoverable amount. The resulting impairment loss amounting to ¥26 million ($265 thousand) was record-ed as other expenses. This impairment loss comprised ¥22 million ($224 thousand) for land and ¥4 million ($41 thousand) for other assets. In addition, the calculation of recoverable amounts based on net sales price which was based on the estimated sales prices.
10. INCOME TAXESThe Company and its consolidated domestic subsidiaries are subject to a number of income taxes in Japan which, in the aggre-gate, resulted in statutory tax rate of approximately 40.6% for the years ended March 31, 2008 and 2007. The consolidated over-seas subsidiaries are subject to the income taxes of their countries of domicile. The following table summarizes the significant differences between the statutory tax rate and effective tax rates for consolidat-ed financial statement purposes for the years ended March 31, 2008 and 2007:” 2009 2008 2007
Statutory tax rate — 40.6% 40.6%
Non-deductible expenses 2.1 1.9Equity in earnings of non-consolidated subsidiaries and affiliates (5.4) (2.9)Gain on change in interests in consolidated subsidiaries — (1.5)Increase (decrease) in valuation allowance — (4.2)Tax credits (2.5) (4.4)Differences of statutory tax rates in consolidated overseas subsidiaries 8.4 1.6Other 0.4 1.3
Effective tax rate — 43.6% 32.4%
The description regarding significant differences between the statutory tax rate and effective tax rates has been omitted for the year ended March 31, 2009 because of loss before income taxes and minority interests. The significant components of the Companys’ and its consolidated subsidiaries’ deferred tax assets and liabilities as of March 31, 2009, 2008 and 2007 were as follows:
Millions of yen
Thousands of U.S. dollars
2009 2008 2007 2009
Deferred tax assets: Allowance for doubtful accounts ¥ 572 ¥ 1,086 ¥ 1,036 $ 5,823 Employees’ retirement benefits 21,272 19,827 22,142 216,553 Accrued bonuses 3,819 4,704 5,286 38,878 Depreciation 5,145 7,089 8,225 52,377 Accrued enterprise taxes 204 1,020 2,242 2,077 Loss carryforwards of consolidated subsidiaries 29,971 2,296 2,851 305,110 Reserve for periodic repairs 6,122 5,503 5,613 62,323 Provision for environmental measures 4,851 4,509 — 49,384 Loss on write-down of inventories 3,644 3,352 1,937 37,097 Loss on write-down of investment securities 5,767 5,707 4,216 58,709 Loss on impairment of fixed assets 5,291 3,865 3,883 53,863 Other 6,475 10,282 8,188 65,917
Subtotal 93,133 69,240 65,619 948,111 Valuation allowance (81,176) (11,274) (10,202) (826,387) Total deferred tax assets 11,957 57,966 55,417 121,724
Deferred tax liabilities: Net unrealized holding gain on securities ¥ (3,768) ¥ (9,393) ¥(19,067) $ (38,359) Deferred gain on real properties (3,381) (3,510) (3,675) (34,419) Reserve for special depreciation — — (12) — Retained earnings of consolidated overseas subsidiaries, etc (1,375) (10,620) (8,708) (13,998) Employees’ retirement benefit trust — — — — Other (2,283) (2,305) (2,221) (23,241)
Total deferred tax liabilities (10,807) (25,828) (33,683) (110,017)
Net deferred tax assets ¥ 1,150 ¥32,138 ¥21,734 $ 11,707

63
11. SHAREHOLDERS’ EQUITYUnder the Corporate Law of Japan (the “Law”), the amount paid for new shares is required to be accounted for as common stock, although a company may account for the amount not exceeding one-half of the price of the new shares as additional paid-in capital, which is included in capital surplus. The Law provides that an amount equal to 10% of distribution from surplus shall be appropriated and set aside as legal earn-ings reserve or additional paid-in capital, until the total amount of legal earnings reserve and additional paid-in capital equals 25% of common stock. Legal earnings reserve and additional paid-in capital may be used to eliminate or reduce a deficit or may be transferred to common stock by resolution of the shareholders’ meeting. The Law also stipulates that the amount of any such excess is available for appropriations by resolution of the shareholders. Legal earnings reserve is included in retained earnings in the accompanying consolidated financial statements. The maximum amount that the Company can distribute as dividends is calculated based on the non-consolidated financial statements of the Company in accordance with the Law. Appropriations are not accrued in the financial statements for the period to which they relate, but are recorded in the subse-quent accounting period when the shareholders’ approval has been obtained. Retained earnings at March 31, 2009 include amounts representing the year-end cash dividends approved at the shareholders’ meeting held on June 24, 2009.The amounts of cash dividends relating to the year ended March 31, 2009 that has been approved is shown below.
Millions of yen Thousands of
U.S. dollars
Cash dividends of ¥3 ($0.03) per share ¥2,255 $22,956
12. CONTINGENT LIABILITIESContingent liabilities at March 31, 2009, 2008 and 2007 were as follows:
Millions of yen
Thousands of U.S. dollars
2009 2008 2007 2009
As endorser of trade notes discounted ¥ 6 ¥ 38 ¥ 86 $ 61As guarantor of indebtedness, principally of non-consolidated subsidiaries and affiliates
8,195 10,839 14,327 83,427
As issuer of commitments for guarantees 542 637 662 5,518
13. LEASESA. At March 31, 2009, 2008 and 2007, assets leased under finance lease transactions starting before March 31, 2008 that do not transfer ownership to the lessees were as follows:(a) Equivalent purchase amount, accumulated depreciation amount, accumulated impairment amount and balance at year-end:
Millions of yen
Thousands of U.S. dollars
2009 2008 2007 2009
Machinery and equipment: Equivalent purchase amount ¥7,638 ¥10,327 ¥12,497 $77,756 Equivalent accumulated depreciation amount 4,499 5,834 7,598 45,801 Equivalent accumulated impairment amount — — — — Equivalent balance at year-end 3,139 4,493 4,899 31,955
(b) Future minimum lease payments:
Millions of yen Thousands of
U.S. dollars
2009 2008 2007 2009
Due within one year ¥1,143 ¥1,730 ¥1,803 $11,636Due after one year 1,996 2,763 3,096 20,320
Total ¥3,139 ¥4,493 ¥4,899 $31,956
Impairment of lease assets amount on the balance sheet ¥ — ¥ — ¥ — $ —
(c) Paid lease fees, equivalent depreciation expense amount and impairment loss:
Millions of yen Thousands of
U.S. dollars
2009 2008 2007 2009
Paid lease fees ¥1,766 ¥2,006 ¥2,369 $17,978Reversal of leased asset impairment loss — — 103 —Equivalent depreciation expense amount 1,766 2,006 2,266 17,978
Impairment loss on lease assets ¥ — ¥ — ¥ — $ —

64
B. Obligations under noncancelable operating leases at March 31, 2009, 2008 and 2007, were as follows:
Future Minimum Lease Payments:
Millions of yen Thousands of
U.S. dollars
2009 2008 2007 2009
Due within one year ¥25 ¥33 ¥15 $255Due after one year 40 51 46 407
Total ¥65 ¥84 ¥61 $662
14. RESEARCH AND DEVELOPMENT EXPENSESResearch and development expenses for the years ended March 31, 2009, 2008 and 2007 were as follows:
Millions of yen
Thousands of U.S. dollars
2009 2008 2007 2009
Research and development expenses ¥40,628 ¥42,130 ¥36,943 $413,601
15.DERIVATIVESThe Company and its consolidated subsidiaries utilize derivatives transactions only for the purpose of hedging the currency risk associated with transactions denominated in foreign currencies and the interest-rate risk associated with loans payable. As the counterparties to the above financial derivatives transactions are major financial institutions, management of the Company believes that there is no significant risk of default by these counterparties. All derivatives transactions the Company and its consolidated subsidiaries enter into are approved by the directors of the finan-cial section. The conditions and results of such transactions are reported semiannually to the Management Meeting. The following summarizes the derivatives used by the Company and its consolidated subsidiaries as hedging instruments and the items hedged:
Hedging instruments: Hedged items:
Forward foreign exchange contracts Foreign currency trade receivables and trade payables, planned transactions denominated in foreign currencies
Interest-rate swap contracts Interest on loans payable
The Company and its consolidated subsidiaries assess the effectiveness of the hedges semiannually by comparing the cumulative changes in cash flows from, or the changes in fair value of, the hedged items and the corresponding changes in the value of the derivatives positions. The Company and certain of its consolidated subsidiaries had the following derivatives contracts outstanding at March 31, 2009:
Millions of yen Thousands of U.S. dollars Contract
amountFair
valueUnrealized gain (loss)
Contract amount
Fair value
Unrealized gain (loss)
Forward foreign exchange contracts: Selling U.S. dollar ¥ 616 ¥ 636 ¥(20) $ 6,271 $ 6,475 $(204) Buying U.S. dollar 6,758 6,788 30 68,798 69,103 305
The Company and certain of its consolidated subsidiaries had the following derivatives contracts outstanding at March 31, 2008:
Millions of yen Contract
amountFair
valueUnrealized gain (loss)
Forward foreign exchange contracts:Buying U.S. dollar ¥6,757 ¥6,379 ¥(378)Foreign currency swaps:Receiving Singapore dollar, paying U.S. dollar 242 51 51
The contract amounts of forward foreign exchange contracts and foreign currency swaps presented above exclude those for which deferral hedge accounting has been applied.
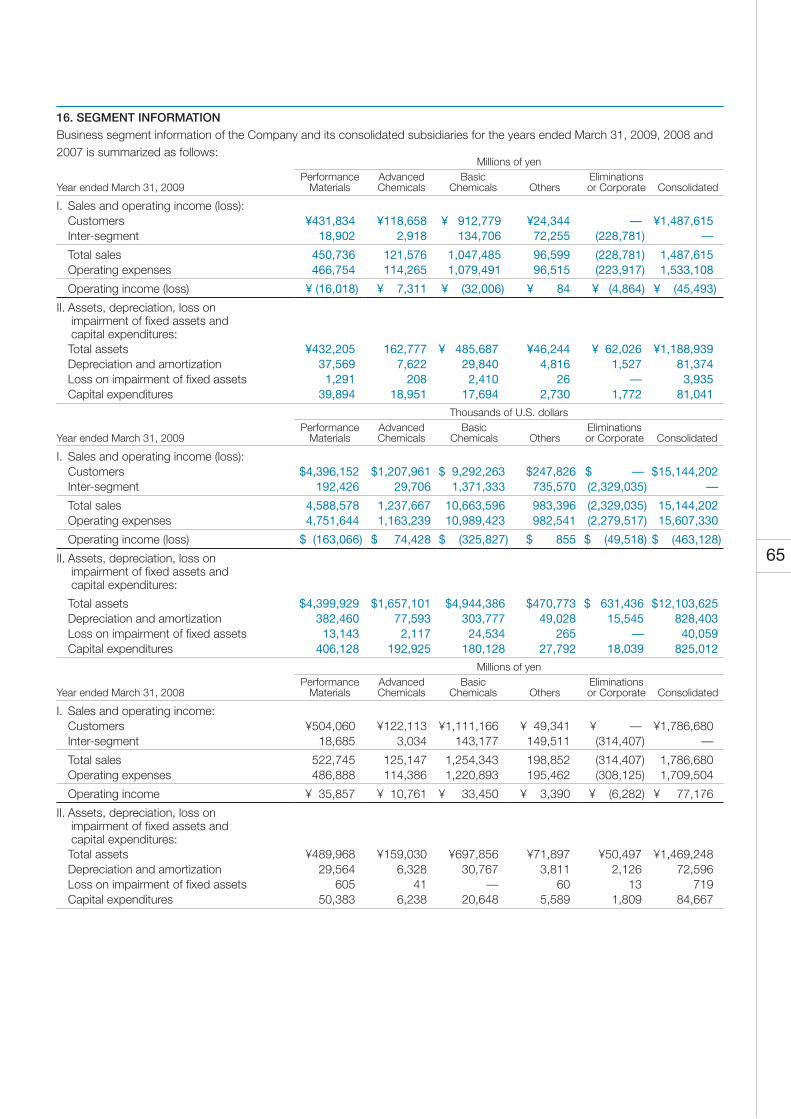
65
16. SEGMENT INFORMATIONBusiness segment information of the Company and its consolidated subsidiaries for the years ended March 31, 2009, 2008 and 2007 is summarized as follows:
Millions of yen Year ended March 31, 2009
Performance Materials
Advanced Chemicals
Basic Chemicals
Others
Eliminations or Corporate
Consolidated
I. Sales and operating income (loss): Customers ¥431,834 ¥118,658 ¥ 912,779 ¥24,344 — ¥1,487,615 Inter-segment 18,902 2,918 134,706 72,255 (228,781) —
Total sales 450,736 121,576 1,047,485 96,599 (228,781) 1,487,615 Operating expenses 466,754 114,265 1,079,491 96,515 (223,917) 1,533,108
Operating income (loss) ¥ (16,018) ¥ 7,311 ¥ (32,006) ¥ 84 ¥ (4,864) ¥ (45,493)
II. Assets, depreciation, loss on impairment of fixed assets and capital expenditures:
Total assets ¥432,205 162,777 ¥ 485,687 ¥46,244 ¥ 62,026 ¥1,188,939 Depreciation and amortization 37,569 7,622 29,840 4,816 1,527 81,374 Loss on impairment of fixed assets 1,291 208 2,410 26 — 3,935 Capital expenditures 39,894 18,951 17,694 2,730 1,772 81,041
Thousands of U.S. dollars Year ended March 31, 2009
Performance Materials
Advanced Chemicals
Basic Chemicals
Others
Eliminations or Corporate
Consolidated
I. Sales and operating income (loss): Customers $4,396,152 $1,207,961 $ 9,292,263 $247,826 $ — $15,144,202 Inter-segment 192,426 29,706 1,371,333 735,570 (2,329,035) —
Total sales 4,588,578 1,237,667 10,663,596 983,396 (2,329,035) 15,144,202 Operating expenses 4,751,644 1,163,239 10,989,423 982,541 (2,279,517) 15,607,330
Operating income (loss) $ (163,066) $ 74,428 $ (325,827) $ 855 $ (49,518) $ (463,128)
II. Assets, depreciation, loss on impairment of fixed assets and capital expenditures:
Total assets $4,399,929 $1,657,101 $4,944,386 $470,773 $ 631,436 $12,103,625 Depreciation and amortization 382,460 77,593 303,777 49,028 15,545 828,403 Loss on impairment of fixed assets 13,143 2,117 24,534 265 — 40,059 Capital expenditures 406,128 192,925 180,128 27,792 18,039 825,012
Millions of yen Year ended March 31, 2008
Performance Materials
Advanced Chemicals
Basic Chemicals
Others
Eliminations or Corporate
Consolidated
I. Sales and operating income: Customers ¥504,060 ¥122,113 ¥1,111,166 ¥ 49,341 ¥ — ¥1,786,680 Inter-segment 18,685 3,034 143,177 149,511 (314,407) —
Total sales 522,745 125,147 1,254,343 198,852 (314,407) 1,786,680 Operating expenses 486,888 114,386 1,220,893 195,462 (308,125) 1,709,504
Operating income ¥ 35,857 ¥ 10,761 ¥ 33,450 ¥ 3,390 ¥ (6,282) ¥ 77,176
II. Assets, depreciation, loss on impairment of fixed assets and capital expenditures:
Total assets ¥489,968 ¥159,030 ¥697,856 ¥71,897 ¥50,497 ¥1,469,248 Depreciation and amortization 29,564 6,328 30,767 3,811 2,126 72,596 Loss on impairment of fixed assets 605 41 — 60 13 719 Capital expenditures 50,383 6,238 20,648 5,589 1,809 84,667

66
Millions of yen Year ended March 31, 2007
Functional Chemicals & Engineered Materials
Functional Polymeric Materials
Basic Chemicals
Petrochemicals
Others
Eliminations or Corporate
Consolidated
I. Sales and operating income: Customers ¥213,955 ¥317,258 ¥553,471 ¥559,927 ¥ 43,451 ¥ — ¥1,688,062 Inter-segment 5,114 18,869 48,963 128,700 131,440 (333,086) —
Total sales 219,069 336,127 602,434 688,627 174,891 (333,086) 1,688,062 Operating expenses 205,546 313,894 591,446 643,291 172,809 (330,602) 1,596,384
Operating income ¥ 13,523 ¥ 22,233 ¥ 10,988 ¥ 45,336 ¥ 2,082 ¥ (2,484) ¥ 91,678
II. Assets, depreciation, loss on impairment of fixed assets and capital expenditures:
Total assets ¥265,064 ¥327,878 ¥326,966 ¥438,063 ¥ 62,485 ¥ 77,727 ¥1,498,183 Depreciation and amortization 12,914 18,318 16,781 18,838 2,572 784 70,207 Loss on impairment of fixed assets
141 303 148 — — 755 1,347
Capital expenditures 18,707 24,032 8,343 14,132 2,703 4,754 72,671
Effective the year ended March 31, 2008, the Company and its consolidated subsidiaries changed their business segment classi-fication. Business segment information based on the new classification for the year ended March 31, 2007 is summarized as fol-lows:
Millions of yen Year ended March 31, 2007
Performance Materials
Advanced Chemicals
Basic Chemicals
Others
Eliminations or Corporate
Consolidated
I. Sales and operating income: Customers ¥496,250 ¥ 93,929 ¥1,037,771 ¥ 60,112 ¥ — ¥1,688,062 Inter-segment 17,231 3,511 126,261 151,421 (298,424) —
Total sales 513,481 97,440 1,164,032 211,533 (298,424) 1,688,062 Operating expenses 487,555 85,752 1,110,969 207,956 (295,848) 1,596,384
Operating income ¥ 25,926 ¥ 11,688 ¥ 53,063 ¥ 3,577 ¥ (2,576) ¥ 91,678
II. Assets, depreciation, loss on impairment of fixed assets and capital expenditures:
Total assets ¥476,989 ¥160,005 ¥ 710,138 ¥ 88,552 ¥ 62,499 ¥1,498,183 Depreciation and amortization 30,012 5,437 31,241 2,621 896 70,207 Loss on impairment of fixed assets 176 268 148 — 755 1,347 Capital expenditures 42,084 7,930 14,940 4,113 3,604 72,671
(Year ended March 31, 2009)Effective the year ended March 31, 2009, the Company and its domestic consolidated subsidiaries adopted “Accounting Standard for Measurement of Inventories” (ASBJ Statement No. 9, July 5, 2006) and changed the evaluation standard and the evaluation method for inventories. The effect of this change was as follows:
Millions of yen, Thousands of U.S. dollars Performance
MaterialsAdvanced Chemicals
Basic Chemicals
Others
Eliminations or Corporate
Consolidated
Year ended March 31, 2009
Effect in operating income ¥893 ¥848 ¥5,393 ¥73 — ¥7,207Effect in operating income $9,091 $8,633 $54,902 $743 — $73,369
(Year ended March 31, 2008)Effective the year ended March 31, 2008, the Company and its consolidated domestic subsidiaries changed the depreciation method for the property, plant and equipment acquired on or after April 1, 2007 due to the revision of Japanese Corporate Tax Law and its regulation.

67
These changes have had the effect of increasing depreciation and reducing operating income as follows:Millions of yen
Performance Materials
Advanced Chemicals
Basic Chemicals
Others
Eliminations or Corporate
Consolidated
Year ended March 31, 2008Effect in depreciation ¥ 722 ¥ 97 ¥ 667 ¥ 69 ¥ 317 ¥ 1,872Effect in operating income ¥(711) ¥(92) ¥(659) ¥(69) ¥(317) ¥(1,848)
Effective the year ended March 31, 2008, accompanying the revision of Japanese Corporate Tax Law, the Company and its con-solidated domestic subsidiaries started the depreciation for the property, plant and equipment, which were acquired on or before March 31, 2007 and were already depreciated to 5% of the acquisition cost. The depreciation was calculated by the straight-line method within next five years after these assets were depreciated to 5 % of the acquisition cost. Depreciation was charged to depreciation expense. These changes have had the effect of increasing depreciation and reducing operating income as follows:
Millions of yen Performance
MaterialsAdvanced Chemicals
Basic Chemicals
Others
Eliminations or Corporate
Consolidated
Year ended March 31, 2008Effect in depreciation ¥ 297 ¥ 117 ¥ 528 ¥ 51 — ¥ 993Effect in operating income ¥(295) ¥(103) ¥(518) ¥(51) — ¥(967)
(Year ended March 31, 2007)Effective the year ended March 31, 2007, to unify the accounting policy among the Mitsui Chemicals Group, several consolidated subsidiaries, which were additionally wholly-owned by the Company, changed the depreciation method from the straight-line method to the declining-balance method for the property, plant and equipment except for buildings. As a result of this change, for the year ended march 31, 2007, depreciation cost increased by ¥1,220 million and operating income decreased by ¥1,214 million in Functional Polymeric Materials.
Effective the year ended March 31, 2007, to unify the accounting policy among the Mitsui Chemicals Group, several consolidated subsidiaries, which were additionally wholly-owned by the Company, provided a reserve for the costs of annual repairs. As a result of this change, for the year ended March 31, 2007, operating income decreased by ¥731 million in Functional Polymeric Materials.
Geographic segment information of the Company and its consolidated subsidiaries for the years ended March 31, 2009, 2008 and 2007 is summarized as follows:
Millions of yenYear ended March 31, 2009 Japan Asia* Others** Eliminations Consolidated
I. Sales and operating loss: Customers ¥1,204,422 ¥187,759 ¥95,434 ¥ — ¥1,487,615 Inter-segment 62,410 67,913 1,737 (132,060) —
Total sales 1,266,832 255,672 97,171 (132,060) 1,487,615 Operating expenses 1,308,333 258,858 98,062 (132,145) 1,533,108
Operating loss ¥ (41,501) ¥ (3,186) ¥ (891) ¥ 85 ¥ (45,493)
II. Total assets ¥1,084,167 ¥137,951 ¥50,318 ¥ (83,497) ¥1,188,939
Thousands of U.S. dollarsYear ended March 31, 2009 Japan Asia* Others** Eliminations Consolidated
I. Sales and operating loss: Customers $12,261,244 $1,911,422 $971,536 $ — $15,144,202 Inter-segment 635,346 691,367 17,683 (1,344,396) —
Total sales 12,896,590 2,602,789 989,219 (1,344,396) 15,144,202 Operating expenses 13,319,078 2,635,223 998,290 (1,345,261) 15,607,330
Operating loss $ (422,488) $ (32,434) $ (9,071) $ 865 $ (463,128)
II. Total assets $11,037,025 $1,404,367 $512,247 $ (850,015) $12,103,624

68
Millions of yenYear ended March 31, 2008 Japan Asia* Others** Eliminations Consolidated
I. Sales and operating income: Customers ¥1,466,628 ¥215,553 ¥104,499 ¥ — ¥1,786,680 Inter-segment 69,586 102,320 1,758 (173,664) —
Total sales 1,536,214 317,873 106,257 (173,664) 1,786,680 Operating expenses 1,464,153 316,708 102,321 (173,678) 1,709,504
Operating income ¥ 72,061 ¥ 1,165 ¥ 3,936 ¥ 14 ¥ 77,176
II. Total assets ¥1,300,926 ¥188,424 ¥ 52,047 (¥ 72,149) ¥1,469,248
Millions of yenYear ended March 31, 2007 Japan Asia* Others** Eliminations Consolidated
I. Sales and operating income: Customers ¥1,412,809 ¥178,414 ¥96,839 ¥ — ¥1,688,062 Inter-segment 53,439 87,652 2,299 (143,390) —
Total sales 1,466,248 266,066 99,138 (143,390) 1,688,062 Operating expenses 1,381,467 262,103 96,389 (143,575) 1,596,384
Operating income ¥ 84,781 ¥ 3,963 ¥ 2,749 ¥ 185 ¥ 91,678
II. Total assets ¥1,327,744 ¥179,844 ¥51,778 ¥ (61,183) ¥1,498,183
*Asia: China, Taiwan, Korea, Thailand, Singapore**Others: North America, Europe
(Year ended March 31, 2009)Effective the year ended March 31, 2009, the Company and its domestic consolidated subsidiaries adopted “ Accounting Standard for Measurement of Inventories” (ASBJ Statement No. 9, July 5, 2006) and changed the evaluation standard and the evaluation method for inventories. As a result of this change, for the year ended March 31, 2009, operating loss decreased by ¥7,207 million ($73,369 thousand) in Domestic (in Japan).
(Year ended March 31, 2008)Effective the year ended March 31, 2008, the Company and its domestic consolidated subsidiaries changed the depreciation method for the property, plant and equipment acquired on or after April 1, 2007 due to the revision of Japanese Corporate Tax Law and its regulation. As a result of this change, for the year ended March 31, 2008, depreciation cost increased by ¥1,872 million and operating income decreased by ¥1,848 million in Domestic (in Japan).
Effective the year ended March 31, 2008, accompanying the revision of Japanese Corporate Tax Law, the Company and its con-solidated domestic subsidiaries started the depreciation for the property, plant and equipment, which were acquired on or before March 31, 2007 and were already depreciated to 5% of the acquisition cost. The depreciation was calculated by the straight-line method within next five years after these assets were depreciated to 5 % of the acquisition cost. Depreciation was charged to depreciation expense. As a result of this change, for the year ended March 31, 2008, depreciation cost increased by ¥993 million and operating income decreased by ¥967 million in Domestic (in Japan).
(Year ended March 31, 2007)Effective the year ended March 31, 2007, to unify the accounting policy among the Mitsui Chemicals Group, several consolidated subsidiaries, which were additionally wholly-owned by the Company, changed the depreciation method from the straight-line method to the declining-balance method for the property, plant and equipment except for buildings. As a result of this change, for the year ended march 31, 2007, depreciation cost increased by ¥1,220 million and operating income decreased by ¥1,214 million in Domestic (in Japan).
Effective the year ended March 31, 2007, to unify the accounting policy among the Mitsui Chemicals Group, several consolidated subsidiaries, which were additionally wholly-owned by the Company, provided a reserve for the costs of annual repairs. As a result of this change, for the year ended March 31, 2007, operating income decreased by ¥731 million in Domestic (in Japan).

69
Overseas sales of the Company and its consolidated subsidiaries for the years ended March 31, 2009, 2008 and 2007 are sum-marized by geographic area as follows:
Millions of yen Year ended March 31, 2009
Asia*
North America and Latin America
Europe**
Others***
Overseas sales
Overseas sales ¥388,008 ¥75,895 ¥52,116 ¥11,927 ¥527,946Consolidated net sales ¥1,487,615Ratio of overseas sales to consolidated net sales 26.1% 5.1% 3.5% 0.8% 35.5%
Thousands of U.S. dollars Year ended March 31, 2009
Asia*
North America and Latin America
Europe**
Others***
Overseas sales
Overseas sales $3,949,995 $772,625 $530,551 $121,419 $5,374,590
Millions of yen Year ended March 31, 2008
Asia*
North America and Latin America
Europe**
Others***
Overseas sales
Overseas sales ¥544,347 ¥84,029 ¥52,409 ¥15,481 ¥696,266Consolidated net sales ¥1,786,680Ratio of overseas sales to consolidated net sales 30.5% 4.7% 2.9% 0.9% 39.0%
Millions of yen Year ended March 31, 2007
Asia*
North America and Latin America
Europe**
Others***
Overseas sales
Overseas sales ¥509,454 ¥81,645 ¥52,960 ¥13,246 ¥657,305Consolidated net sales ¥1,688,062 Ratio of overseas sales to consolidated net sales 30.2% 4.8% 3.1% 0.8% 38.9%
*Asia: China, Taiwan, Korea, Thailand, Singapore**Europe: Germany, France***Others: Oceania, Africa
17. GOODWILL AND NEGATIVE GOODWILLGoodwill and negative goodwill arising from the difference of cost and underlying net assets at the date of acquisition are amor-tized over a period of less than 20 years on a straight-line basis, except that immaterial amounts are charged or credited to income as incurred. The amounts of goodwill were offset by negative goodwill and the difference arising from the offsetting was included in intangi-ble assets. Offsetting amounts of goodwill and negative goodwill at March 31, 2009, 2008 and 2007 were as follows:
Millions of yen
Thousands of U.S. dollars
2009 2008 2007 2009
Goodwill ¥11,783 ¥12,280 ¥15,876 $119,953Negative goodwill 1,342 2,126 3,194 13,662Difference ¥10,441 ¥10,154 ¥12,682 $106,291
18.BUSINESS COMBINATIONSEffective the year ended March 31, 2007, the Company adopted new accounting standard “Accounting Standards for Business Combinations in Japan’’ (Business Accounting Council, October 31, 2003), and “Accounting Standard for Business Divestitures and the related Implementation Guidance” (ASBJ Statement No. 7, December 27, 2005), and its guidance; “Guidance on Accounting Standard for Business Combinations and Accounting Standard for Business Divestitures” (ASBJ Guidance No. 10, revised November 15, 2007).
For the year ended March 31, 2007, Making Yamamoto Chemicals Inc. a wholly-owned subsidiary by share exchangeA. Corporate name and business of the entity combined, legal form of business combinations, corporate name after business combinations, and overview of the transaction including purpose. (a) Corporate name and business of the entity combined Name : Yamamoto Chemicals, Inc. Business : dyes, pigments, industrial chemicals (b) Legal form of business combinations Share exchange (c) Corporate name after business combinations Yamamoto Chemicals, Inc. (name remains unchanged.)

70
(d) Overview of the transactions including purpose The Company and Yamamoto Chemicals, Inc. agreed to make Yamamoto Chemicals, Inc. as a wholly-owned subsidiary.
And the Company completed the procedures on April 1, 2006. The Company reinforces the partnership of the two companies and further enhance corporate values as written below in (i)
and (ii) by integrating Yamamoto Chemicals, Inc. as a wholly-owned subsidiary of the Company through the share exchange.
(i) Propelling the efficient operation of color formers (ii) Promoting effective manufacturing, marketing and R&D in functional dye and accelerating new product development.
B. Matters related to additional acquisition of shares of subsidiaries (a) Acquisition cost and its breakdown Consideration for acquisition Share of the Company ¥4,833 million Expenditure directly required for acquisition — Acquisition cost total ¥4,833 million (b) Ratio of allocations of shares 1.10 share of the Company were allocated to one share of Yamamoto Chemicals, Inc. (c) Basis for calculating the share exchange ratio The Company and Yamamoto Chemical’s agreed upon the ratio of the allocation of shares, referring the evaluations from
third parties. (d) Number of new shares of the Company allocated to share exchange Number of shares 7,463,723 ordinary shares Value of shares ¥5,083 million (e) Negative goodwill Negative goodwill ¥2,782 million were booked, due to the difference between the earning power of Yamamoto Chemicals,
Inc. and the cost for making Yamamoto Chemicals, Inc. as a wholly owned subsidiary. Amortization is done by equal amorti-zation over 5 years.
(f) Assets and liability gained by acquisition Current assets ¥4,973 million Non current assets ¥8,128 million Assets Total ¥13,101 million Current liabilities ¥1,514 million
Long-term liabilities ¥66 million Liabilities Total ¥1,580 million
19. SUBSEQUENT EVENTSThere were no applicable items under this category.
71
IndependentAuditors’ Report

72
*Consolidated subsidiary
Companies Major Products or Lines of Business
Paid-in Capital
(In millions)
Equity
Interest
(%)
Performance Materials
* Chiba Polyol Corporation Polypropylene glycol ¥ 100 90
* Japan Composite Co., Ltd. Unsaturated polyester resins and molding materials for FRP ¥ 1,005 65
* MC Industries, Ltd. Synthetic resin compounds and wood preservatives ¥ 300 100
* Mitsui Chemicals Fabro, Inc. Functional fabricated products ¥ 400 100
* Mitsui Chemicals Industrial Products, Co., Ltd. Civil engineering and construction materials ¥ 400 100
* Mitsui Chemicals Polyurethans, Inc. Urethane raw materials, urethane derivatives and organic acids ¥ 20,008 100
* Cosomo Polyurethane (Malaysia) Sdn, Bhd Urethane raw materials RM 2.5 51
* Saxin Corporation Molded synthetic resin ¥ 128 71.4
* Shimonoseki Mitsui Chemicals, Inc. Phosphoric acid and fertilizers ¥ 3,000 100
* Sun Alloys Co., Ltd. Compounded polymers ¥ 50 100
* Sunrex Industry Co., Ltd. Spunbonded nonwoven fabrics and plastic film ¥ 240 100
* Toyo Phosphoric Acid, Inc. Phosphoric acid ¥ 1,500 60
* Tohcello Co., Ltd. Plastic film ¥ 3,450 53.4
* Tohoku Uloid Co., Ltd. Synthetic resins, wood adhesives, formalin and other chemical
products
¥ 80 100
* Anderson Development Company Specialty chemicals US$ 19.20 100
* Cosmo Scientex (M) Sdn. Bhd. Urethane prepolymers for flexible packaging applications and
providing technical services and assistance to customers
RM 10 70
* Image Polymers Company Toner resin US$ 9.6 100
* Image Polymers Europe Limited Toner resin Pound 4.4 100
* Mitsui Elastomers Singapore Pte. Ltd. Elastomer US$ 96 100
* Mitsui Hygiene Materials (Thailand) Co., Ltd. Spunbonded nonwoven fabrics Baht 1,310 100
* P.T. Cosmo Polyurethane Indonesia Urethane premixture US$ 1.05 81
* Taiwan Mitsui Chemicals, Inc. Sales of electronics and information materials NT$ 14 100
* Thai Mitsui Specialty Chemicals Co., Ltd. Specialty chemicals Baht 318 51.9
* Tianjin Cosmo Polyurethane Co., Ltd. Urethane premixture Yuan 90 70
* Zhang Jia Gang Free Trade Zone Mitsui Link-Upon
Advanced Materials, Inc.
Engineering plastic compound US$ 4.66 60
Kumho Mitsui Chemicals, Inc. MDI Won 35,000 50
Polyimide Laminate Systems, LLC Polyimide flexible laminate US$ 0.10 50
Sun Alloys Europe GmbH Compounded polymers Euro 2 50
Advanced Chemicals
* Mitsui Fine Chemicals, Inc. Fine chemical products ¥ 400 80.03
* Sankyo Agro Co., Ltd. Agrochemical formulation products and public health
insecticides
¥ 350 100
* Sun Medical Co., Ltd. Dental materials ¥ 100 70
* Toyo Beauty Supply Corporation Cosmetics ¥ 40 60
* Utsunomiya Chemical Industry Co., Ltd. Agrochemical formulation products and public health
insecticides
¥ 20 100
* Yamamoto Chemicals, Inc. Dyes, pigments and industrial chemicals ¥ 350 100
* ESCO Company Limited Partnership Color former and catalyst US$ 18 100
* Yongsan Mitsui Chemicals, Inc. Acrylamide Won 3,850 50
* SDC Technologies, Inc. High performance coating materials for plastics and non-
ferrous metals
US$ 81 100
Honshu Chemical Industry, Ltd. Raw materials for synthetic resins, synthetic fibers, dyes,
pharmaceuticals, agricultural chemicals, rubber and other
chemicals
¥ 1,501 27.1
MT AquaPolymer, Inc. Organic flocculant ¥ 460 49
Subsidiariesand Major Affiliates(As of March 31, 2009)

73
*Consolidated subsidiary
Companies Major Products or Lines of Business
Paid-in Capital
(In millions)
Equity
Interest
(%)
Basic Chemicals
* Chiba Phenol Company, Limited Phenol and acetone ¥ 300 55
* Evolue Japan Co., Ltd. Polyethylene ¥ 400 75
* Kyodo Monomer Co., Ltd. Methacrylic acid and methyl methacrylate ¥ 400 100
* Mitsui Toatsu Inorganic Chemicals, Inc. Inorganic chemicals ¥ 100 100
* Osaka petrochemical Industries, Ltd. Ethylene, propylene and other basic petrochemical products ¥ 5,000 100
* Prime Polymer Co., Ltd. Polyolefin ¥ 20,000 65
* Ube Polypropylene Co., Ltd. Polypropylene ¥ 475 100
* Advanced Composites, Inc. Polypropylene compound US$ 44.3 62.8
* Advanced Composites Mexicana S.A. de C.V. Polypropylene compound US$ 2.60 100
* Mitsui Advanced Composites (Zhongshan) Co., Ltd. Polypropylene compound US$ 15.31 70
* Mitsui Phenols Singapore Pte Ltd. Phenol, acetone and Bisphenol-A US$ 120 95
* Mitsui Prime Advanced Composites India Pvt Ltd. Polypropylene compound Rupee 1,130 93
* Prime Polymer Asia Co., Ltd. Polyolefin HK$ 1 100
* Siam Mitsui PTA Co., Ltd. PTA Baht 3,300 50
* Smh Co., Ltd. Investment to Siam Mitsui PTA Co., Ltd. Baht 60 51
Japan Polystyrene Inc. Polystyrene ¥ 2,000 50
Keiyo Ethylene Co., Ltd. Ethylene, propylene and other basic petrochemical products ¥ 6,000 22.5
Grand Siam Composites Co., Ltd. Polypropylene compound Baht 63.7 48.2
P.T. Amoco Mitsui PTA Indonesia PTA US$ 160 45
P.T. Petnesia Resindo Polyethylene terephthalate resin for bottles US$ 28 49.6
Shanghai Sinopec Mitsui Chemicals, Co., Ltd. Bisphenol-A Yuan 307 50
Thai Pet Resin Co., Ltd. Polyethylene terephthalate resin for bottles Baht 900 40
Others
* Hokkaido Mitsui Chemicals, Inc. Wood adhesives, paper resins and foliar activator ¥ 1,500 100
* MC Business Support, Ltd. Placements, temporary work and insurance and travel agency ¥ 50 100
* MC Operation Support, Ltd. Operation support for MCI Production sites ¥ 10 100
* MCI Logistics (west), Inc. General trucking and warehousing ¥ 400 100
* Mitsui Chemical Analysis & Consulting Service, Inc.Performing analysis, physical property measurements, and
safety tests on chemicals
¥ 140 100
* Sanseikaihatsu Co., Ltd. Consignment from Mitsui Chemicals and miscellaneous ¥ 490 100
* Mitsui Chemicals America, Inc. Manufacture and sales of ADMER and marketing of Mitsui
Chemicals products
US$ 156 100
* Mitsui Chemicals Asia Pacific, Ltd. Marketing of Mitsui Chemicals products S$ 3 100
* Mitsui Chemicals Europe GmbH Manufacture of polypropylene compound, ADMER and
marketing of Mitsui Chemicals products
Euro 1.2 100
* Mitsui Chemicals (Shanghai) Co., Ltd. Marketing of Mitsui Chemicals products US$ 0.30 100
Du Pont-Mitsui Fluorochemicals Co., Ltd. Fluorocarbon resin and gas, and other chemicals ¥ 2,880 50
Du Pont-Mitsui Polychemicals Co., Ltd. Ethylene vinyl acetate copolymer and other ethylenic
copolymers
¥ 6,480 50
Mitsui Chemicals India, PVT. LTD. Sale, market development and market research for the MCI
Group’s products
Rupee 134 100

74
CorporateData(As of March 31, 2009)
Date IncorporatedJuly 25, 1947(Inaugurated October 1, 1997)
Paid-in Capital¥103,226 million
Number of Employees12,964 (Consolidated)
Shares of Common Stock Issued and Outstanding792,020,076
Number of Shareholders85,589
Stock ListingTokyo
Transfer AgentThe Chuo Mitsui Trust & Banking Co., Ltd.
OfficesHead OfficeShiodome City Center, 1-5-2, Higashi-Shimbashi,Minato-ku, Tokyo 105-7117, JapanPhone: +81-3-6253-2100Facsimile: +81-3-6253-4245URL: http://www.mitsuichem.com/e-mail: [email protected]
U.S.A.Mitsui Chemicals America, Inc.800 Westchester Avenue, Suite N607,Rye Brook, NY 10573, U.S.A.Phone: +1-914-253-0777Facsimile: +1-914-253-0790URL: http://mitsuichemicals.com/e-mail: [email protected]
GermanyMitsui Chemicals Europe GmbHOststrasse 10, 40211 Düsseldorf, GermanyPhone: +49-211-173320Facsimile: +49-211-323486URL: http://eu.mitsuichem.com/
SingaporeMitsui Chemicals Asia Pacific, Ltd.3 Harbour Front Place, #10-01 Harbour Front Tower 2,Singapore 099254Phone: +65-6534-2611Facsimile: +65-6535-5161URL: http://ap.mitsuichem.com/
ChinaMitsui Chemicals (Shanghai) Co., Ltd.Room 2309, Bank of China Tower,200 Yin Cheng Road, Central,Pudong New Area, Shanghai 200120, ChinaPhone: +86-21-5888-6336Facsimile: +86-21-5888-6337URL: http://cn.mitsuichem.com/

75
Planning & Coordination Div.
Purchasing Div.
Logistics Div.
Information Technology Planning Div.
Planning & Coordination Div.
Intellectual Property Div.
Catalysis Science Lab.
Material Science Lab.
CSR & Corporate Communications Div.
Safety & Environment Div.
Quality Assurance Div.
Corporate Administration Div.
Legal Div.
Human Resources & Employee Relations Div.
Corporate Planning Div.
Group Management Div.
Management Accounting Div.
Finance, Accounting & IR Div.
Research Center
Corporate Social Responsibility Center
Planning & Coordination Div.
Production & Technology Center
Process Technology Center
Kashima Works
Ichihara Works
Nagoya Works
Osaka Works
Iwakuni-Ohtake Works
Omuta Works
Internal Control Div.
Supply Chain Management Center
Corporate Management Center
Business Planning & Development Div.
Performance Materials Business Sector
Administration & Accounting Div.
Automotive & Industrial Materials Div.
Living & Energy Materials Div.
Information & Electronics Materials Div.
Polyurethane Div.
Coatings & Engineering Materials Div.
Materials Lab.
Product Development Lab.
Technology Lab.
(Tohcello Co., Ltd.)
Business Planning , Development & Administration Div.
Fine & Performance Chemicals Div.
(Mitsui Chemicals Agro, Inc.)
Business Planning, Development & License Div.
Advanced Chemicals Business Sector
Basic Chemicals Business Sector
Administration & Accounting Div.
Feedstocks Div.
Phenols Div.
PTA & PET Div.
Industrial Chemicals Div.
(Prime Polymer Co., Ltd.)
Nagoya Branch
Osaka Branch
Fukuoka Branch
Mitsui Chemicals America, Inc.
Mitsui Chemicals Europe GmbH
Mitsui Chemicals Asia Pacific, Ltd.
Mitsui Chemicals (Shanghai) Co., Ltd.
Development Center
Board of Directors
Chairman
President & CEO
Management Committee
Board of Corporate Auditors
Corporate Auditors
Mitsui ChemicalsOrganization Chart(As of April 1, 2009)

76
0
900
300
600
1,200
(¥) Nikkei 225 (right scale)
Stock Price (left scale)
(¥)
543209/11211109876543208/11211109876543207/11211109876542006/
0
15,000
30,000
Composition of Shareholders(As of March 31, 2009)
Securities Companies1.42%
Foreign Investors18.17%
Other Japanese Corporations14.59%
Financial Institutions44.24%
Japanese Individuals21.58%
Major Shareholders(As of March 31, 2009)
Number of shares held (Thousands)
Percentage of shares held
(%)
The Master Trust Bank of Japan, Ltd. (Trust account)
58,249 7.35
Japan Trustee Services Bank, Ltd. (Trust account)
41,797 5.27
Japan Trustee Services Bank, Ltd. (Toray Industries Inc. Retirement Benefit Trust Account re-entrusted by Chuo Mitsui Asset Trust and Banking Company, Ltd.)
37,425 4.72
Japan Trustee Services Bank, Ltd. (Trust account 4G)
37,341 4.71
Mitsui & Co., Ltd. (Standing Proxy: Trust & Custody Services Bank, Ltd.)
34,740 4.38
Sumitomo Mitsui Banking Corporation 21,946 2.77Japan Trustee Services Bank, Ltd. (Trust account 4)
21,730 2.74
Mitsui Life Insurance Co., Ltd. 18,030 2.27Mitsui Sumitomo Insurance Co., Ltd. 16,321 2.06The Chuo Mitsui Trust and Banking Co., Ltd. 16,317 2.06
Credit RatingsR&I (right scale)Moody’s (left scale)
Ba3
Ba2
Ba1
BBa3
BBa2
BBa1
A3
A2
A1
Aa3
Aa2
Aa1
Aaa
BB-
BB
BB+
BBB-
BBB
BBB+
A-
A
A+
AA-
AA
AA+
AAA
2008 20092007200620052004
Common Stock Price Range
StockInformation

Under its “Grand Design,” Mitsui Chemicals, Inc. aims to achieve sustained development through balanced management that addresses economic, environmental and social concerns. To this end, our three core operating business sectors are implementing the following.
>See page 18-19
GrowingPerformance Materials
along with the crucial and expanding envi-
ronmental technology market, we are boosting sales by focusing on the
functional film sheet business, including solar cell-related products.
>See page 20-21
ExpandingAdvanced Chemicals
our vision care, agrochemical and
catalyst operations, we are building a business structure that is immune to
market fluctuations and cultivating next-generation businesses.
>See page 22-23
CompetitiveBasic Chemicals
worldwide, we are bolstering
our international standing by leveraging partnerships to optimize product
operations in Japan and by shifting toward high-value-added products
while expanding into the growing Asian markets, particularly China and
India.
ContentsConsolidated Financial Highlights 1To Our Stakeholders 2An Interview with the President 4Corporate Governance 9CSR through R&D 12Special Feature 18 Main Products 24Review of Operations 26Intellectual Property Strategy 32Directors and Auditors 34Financial Section 35Subsidiaries and Major Affiliates 72Corporate Data 74Mitsui Chemicals Organization Chart 75Stock Information 76
Forward-Looking StatementsThis annual report contains forward-looking statements about the future plans, strategies, beliefs and performance of the Mitsui Chemicals Group as a whole and its individual consolidated companies. These forward-looking statements are not historical facts. They are expectations, estimates, forecasts and projections based on information currently available to the Mitsui Chemicals Group and are subject to a number of risks, uncertainties and assumptions, which, without limitation, include economic trends, fluctuations in foreign currency exchange rates, fluctuations in the price of raw materials, competition in markets where the Company is active, personal consumption, market demand, the tax system and other legislation. As such, actual results may differ materially from those pro-jected and the Mitsui Chemicals Group cannot guarantee that these forward-looking statements are accurate or will be achieved.
Growing
Expanding
Competitive
ANNUAL REPORT 2009Year Ended March 31, 2009
Shiodome City Center, 1-5-2, Higashi-Shimbashi,Minato-ku, Tokyo 105-7117, JapanTelephone: +81-3-6253-2100Facsimile: +81-3-6253-4245URL: http://www.mitsuichem.come-mail: [email protected]
Mitsui C
hemicals, Inc. A
nnual Rep
ort 2009
Finance, Accounting & IR division
Responsible Care