Embed Size (px)
Citation preview

C
Six Months Ended September 30, 2003
:
PAN1-5505
Interim
Rep
ort 20
03
SHIN
SEI BAN
K, LIM
ITED

We focused on intensive reduction of
problem loans to become a healthier
bank with a clean balance sheet. The
ratio of Shinsei’s non-performing
claims, as disclosed under the
Financial Revitalization Law, to total
non-consolidated claims dramatically
decreased to 4.11% at September 30,
2003.
We hav
¥701.2
equity
ratio. W
base, r
approp
capital
(%)24
18
12
6
0
1,200
900
600
300
0
(Billions of yen)
9/20033/20039/20023/2002
Balance of claims disclosed underthe Financial Revitalization LawClaims disclosed under the FinancialRevitalization Law as a percentage of total claims
Consolidated Total Shareholders’Equity and Capital Adequacy Ratio
Disclosure of Claims under theFinancial Revitalization Law
(Non-Consolidated)
Total shareholders’ equity Capital adequacy ratio
623.5653.3 679.8 701.2
17.04%20.10%
20.58%19.92%
1,113.6
793.8
154.2233.2
(%)24
18
12
6
0
800
600
400
200
0
(Billions of yen)
9/20033/20039/20023/2002
5.70%
4.11%
18.19%20.01%
Forward-Looking StatementsThis interim report contains statements that constitute forward-looking statements. These statements appear in a number of places in this interim report and include statements regarding our intent, belief or current expectations, and/or the current belief or current expectations of our officers with respect to the results of our operations and the financial condition of the Bank and its subsidiaries. Such statements reflect our current views with respect to future events and are subject to certain risks, uncertainties and assumptions. Our forward-looking statements are not a guarantee of future performance and involve risks and uncertainties, and actual results may differ from those in such forward-looking statements as a result of various factors.
Contents
To Our Customers, Partners and Shareholders 2
Institutional Banking Group:
Focusing Our Strengths to Create Better Banking 4
Retail Banking Group: Better Banking for Our Retail Customers 6
Summary of Performance 8
Financial Section 9
Management 36
Employees 36
Corporate Information 37
Profile (Consolidated)
Establishment December 1952
Total Assets ¥6,508.8 billion
Debentures ¥1,435.9 billion
Deposits, Including Negotiable Certificates
of Deposit ¥2,654.5 billion
Loans and Bills Discounted ¥3,277.4 billion
Securities ¥1,520.3 billion
Total Shareholders’ Equity ¥701.2 billion
Consolidated Capital Adequacy Ratio 20.58%
Non-Consolidated Capital Adequacy Ratio 20.17%
Number of Employees 2,360
Branches:
Domestic 29 Branches, Including Head Office; 1 Annex
Overseas 1 Branch, 1 Representative Office
(As of September 30, 2003)
Listi

We also focused on developing and
offering creative products and services to
meet our customers’ needs. Shinsei’s
unique, comprehensive PowerFlex
account, available 24/7, is attracting more
retail customers. A wide range of value-
added investment banking products and
services provide solutions for our
institutional customers. As a result of our
creative efforts, our non-interest income
increased to more than 50% of
consolidated total revenue for the year
ended September 30, 2003.
We have a strong capital base, with
¥701.2 billion in total shareholders’
equity and a 20.58% capital adequacy
ratio. We plan to increase our asset
base, represented by loans with
appropriate risks, utilizing our strong
capital base.
lders’y Ratio
16.7
51.8
33.3
61.5
32.3%
54.1%60
45
30
15
0
80
60
40
20
0
(Billions of yen) (%)
Consolidated Total Revenue and Non-Interest Income
9/2002 9/2003
Total revenueNon-interest incomeNon-interest income as a percentageof total revenue
.220.58%
(%)24
18
12
6
0003
clude
o actual
r 1952
billion
billion
billion
billion
billion
billion
0.58%
0.17%
2,360
Annex
Office
Summary of Events
2003 April Shinsei Investment Management Co., Ltd. (SIM), commenced operations
Opened Shiodome SIO-SITE Branch (relocated Hibiya Branch)
Opened Roppongi Hills Branch
May Converted Nagoya Branch into Shinsei Financial Center (SFC)
June Opened Futakotamagawa Branch
September Established Hibiya Kids Park, the first on-site child day care center among
Japanese banks, for staff at Head Office
October Relocated Sendai Branch and converted into SFC
November Changed organization of Institutional Banking Group to further integrate
relationship management and product teams
Was selected as sponsor of corporate revitalization process
for Matsuyadenki Co., Ltd.
Commenced “Shinsei Daily Bank” ATM services at Daily Yamazaki
convenience stores
December Won International Financing Review (IFR) magazine’s 2003 awards for best
securitization deal and team
Received approval to convert from long-term credit bank charter to
ordinary bank charter
2004 January Launched Housing Loan Centers in Tokyo, Yokohama and Osaka
Decided to adopt “Company with Committees” board model
(to be effective after general shareholders’ meeting in June 2004)
February Listed Bank’s common stock on First Section of Tokyo Stock Exchange
0, 2003)
Listing on Tokyo Stock Exchange
Sendai SFC

To Our Customers, Partners and Shareholders
2
Since its launch in March 2000 as a new bank, Shinsei has pursued a consistent strategy centered on
building financial strength by improving asset quality and expanding product offerings in both
investment banking and retail banking.
On February 19, 2004, we took a major step forward in our strategy when Shinsei’s shares were
listed on the First Section of the Tokyo Stock Exchange. This listing shows that our efforts and stable
performance have been recognized by the capital markets and our institutional and individual
customers. We greatly appreciate the support you have given us.
Our listing is but one of many steps in the Bank’s evolution. In April 2004, we will change our
charter to be that of an ordinary bank, enabling us to further broaden our range of products and
services. Shinsei’s goal is to achieve long-term profit growth through fiscal strength and
transparency and the highest levels of customer satisfaction—or, as we like to say, “Better Banking.”
Shinsei’s Financial Strength
For the six months ended September 30, 2003, consolidated net income totaled ¥34.0 billion. This was
up ¥7.5 billion from the same period the previous year, due mainly to steady growth in the
investment banking business.
We continued to focus on improving our asset quality for the six months ended September 30,
2003. Total problem claims amounted to ¥154.2 billion, or 4.1% of total credit, down ¥79.0 billion
compared with the end of March 31, 2003.
The capital adequacy ratio stood at 20.58% and the Tier I capital ratio was 15.44%.
Shinsei’s Creative Approach: Banking Solutions and Services
One of Shinsei’s unique qualities is our commitment to deliver superior financial solutions geared to
the specific needs and challenges faced by our institutional and retail banking customers. Creativity,
innovation and an ability to bring new ideas to the Japanese banking sector are crucial to moving
Shinsei beyond commercial lending into more rewarding advisory areas, where higher-margin fee
To Our Customers, Partners and Shareholders
03新生銀行中間英文 _P02-1 04.3.21 1:41 PM ページ 2

To Our Customers, Partners and Shareholders
3
and commission income play a larger part. In the period under review, non-interest income
accounted for 54.1% of consolidated total revenue, compared with 32.3% for the same period the
previous year.
In our institutional banking business, restructuring resulted in a much more effective
organization. By merging the relationship management and product groups, we are able to present
customers with a single, unified offering, delivering the full range of the Bank’s skills and services.
To further strengthen these, we enhanced the corporate revitalization and non-banking business
areas, which promise many business opportunities, and expanded our capital markets business for
financial institutions. In April 2004, the Real Estate Finance and Specialty Finance divisions will be
integrated into the Corporate Banking Business Sub-Group.
In addition to securitization, advisory businesses, non-recourse lending and credit trading, we
achieved satisfactory results in the corporate revitalization and non-banking business areas. In
corporate revitalization, the Shinsei group was selected to be the sponsor of the corporate
revitalization process for Matsuyadenki, Co., Ltd. In the non-banking area, we acquired the
installment credit business of Teijin Finance Limited and relaunched it as Shinsei Sales Finance
Co., Ltd.
In retail banking, Shinsei continued to move forward strongly. Retail customers appreciate our
flexible approach to their banking needs, and have decided in record numbers to bank with Shinsei.
Since the launch of our comprehensive PowerFlex account in June 2001, services such as internet
banking, telephone banking and ATMs available 24 hours a day, seven days a week, have resulted in
more than 550,000 new accounts, representing more than ¥1.5 trillion of assets under management.
During the period, we expanded our Shinsei Financial Centers and finished refurbishment of all
our existing branches. In addition, we opened new branches in several commercial districts,
including Shiodome SIO-SITE Branch and Roppongi Hills Branch in April 2003 and Futakotamagawa
Branch in June 2003. We also located our Tokyo Housing Loan Center close to Tokyo Station to
improve our home loan consultation services.
A Platform for the Future: Delivering Better Banking
Shinsei is now a stronger and more efficient organization with a high-caliber workforce. By
many financial and return measurements, we have already surpassed a number of incumbent
domestic banks.
Looking ahead, I expect our future success will largely be based on the same strategic elements
that have brought us this far, this fast: leveraging our skills to increase our financial strength, and our
commitment to bring new, creative ideas to our retail and institutional customers.
We firmly believe that our commitment to transparency will serve us well as a public company,
and we look forward to working together to build our successes in the future.
March 2004
Masamoto Yashiro
Chairman, President and CEO
03新生銀行中間英文 _P02-1 04.3.21 1:41 PM ページ 3

Institutional Banking Group: Focusing Our Strengths to Create Better Banking
4
Institutional Banking Group: Focusing Our Strengths to Create Better Banking
The Institutional Banking Group leverages Shinsei Bank’s strongest assets—our people, our
customers and our knowledge—to create a diverse range of solutions that meet the challenges
facing our corporate and financial institution customers, as well as to help make Shinsei Bank one
of Japan’s healthiest banks.
Building a Stronger Bank for Our Customers
Shinsei Bank has strategically focused on diversifying our income sources to produce stronger,
more stable revenue streams by creating a new business model that includes establishing
investment banking businesses, which generate fees, commissions and other non-interest income
that complement the interest income earned from lending. These businesses include securitization,
M&A, credit trading, private equity, leveraged finance and non-recourse lending, many of which are
new to the traditional Japanese banking industry, and all with good growth potential.
Established in January 2002, the Institutional Banking Group integrates relationship management
and product groups to create a unified, powerful banking team. This team continuously provides fast
and sophisticated financial solutions to our institutional customers’ funding and business
restructuring needs. In November 2003, in an effort to further improve service to our institutional
customers and focus resources on key business areas, we consolidated corporate restructuring-
related businesses into the Corporate Business Solutions Sub-Group, and established the Non-Bank
Financial Services Division and the Real Estate Finance Division.
In addition to helping our customers, these efforts significantly contributed to the Bank’s ability to
increase non-interest income to more than 50% of consolidated total revenue in the first half of fiscal 2003.
Creating Expertise through Alliances and Acquisitions
Sometimes the quickest and best way to meet our customers’ needs has been to team up with or
acquire companies with the necessary skills and expertise. A joint venture with NISSIN CO., LTD., a
partnership with SHINKI CO., LTD., and the acquisition of non-bank lending institutions EQUION
COMPANY, LIMITED (currently Shinsei Property Finance Co. Ltd.), and APOLLO FINANCE CO., LTD.,
are examples of how such initiatives have strengthened our financing capabilities to small and
medium-sized enterprises (SMEs).
Business partnerships have also played a key role in Shinsei’s asset management activities. We
entered into an exclusive distribution agreement and tie-up for launching new investment funds with
global asset management firms Ramius Capital Group, LLC, Investor Select Advisors Limited and
BlueBay Asset Management Limited. These relationships are managed by Shinsei Investment
Management Co., Ltd. (SIM), a wholly owned subsidiary established in April 2003.
Building on Our Strengths
In the first half of fiscal 2003, the Institutional Banking Group continued to actively provide and
improve on our top-quality M&A advisory, credit trading, securitization, project finance, leveraged
finance, and non-recourse and conventional lending services. Backed by our strong balance sheet, we
were able to focus on creating new solutions to customers’ unique financial challenges. These efforts
resulted in Shinsei Bank being first to market with numerous products and services in these areas.
In an effort to make non-recourse lending affordable for SMEs, we introduced the Multi-Asset
Program (MAP), a non-recourse loan conduit program. By providing non-recourse loans through a
Consolidated Total Revenue and Non-Interest Income
9/2002 9/2003
80
60
40
20
0
60
45
30
15
0
(Billions of yen) (%)
Total revenueNon-interest incomeNon-interest income as a percentage of total revenue
51.8
61.5
16.7
33.3
54.1%
32.3%
03新生銀行中間英文 _P02-1 04.3.21 1:41 PM ページ 4

Institutional Banking Group: Focusing Our Strengths to Create Better Banking
5
single special purpose company, MAP reduces the costs of funding, making it accessible to small
and medium-sized properties.
In August 2003, we arranged our second issuance of the groundbreaking Hydra Series. Hydra is
the first residential mortgage-backed securitization (RMBS) in Japan to pool housing loan
receivables from multiple originators. Its unique structure gives investors geographic diversification
and stable cash flows. It also enables us to securitize assets that are difficult to securitize on their
own. This innovation resulted in our winning IFR magazine’s 2003 awards for best Japanese
securitization and Japanese securitization house.
Our affiliates Shinsei Securities Co., Ltd., Shinsei Trust & Banking Co., Ltd., and Shinsei Servicing
Company (Shinsei Servicer), also stood out in their respective areas. International rating agency
Fitch Ratings assigned Shinsei Trust its first rating of a Japanese trustee, and Shinsei Servicer the
first Japanese residential mortgage primary servicing rating. Shinsei Securities continued to rank
near the top of the Japanese asset-backed securitization league tables.
Focusing on the Needs of Today’s Japan
In Japan’s current economic environment, Shinsei has targeted two key areas where our expertise
and capital can benefit our customers: corporate revitalization and non-banking financial services.
Corporate Revitalization
To effectively meet our customers’ corporate revitalization needs, the Institutional Banking Group’s
Corporate Business Strategy Sub-Group, which was instrumental in cleaning up Shinsei’s own
balance sheet, was relaunched as the Corporate Business Solutions Sub-Group in March 2003. This
group’s mission is to utilize its know-how to help customers dispose of problem loans and improve
corporate management so that they can regain their profit-generating capabilities and
competitiveness. This is being accomplished through balance sheet strengthening, business
divestiture, acquisition of companies and disposal of non-performing assets.
Non-Banking Business
Shinsei believes the Japanese non-bank financial sector has high growth potential and adequate
risk-adjusted return. To increase our presence in this area, in November 2002 we established Shinsei
Business Finance Co., Ltd., a joint venture between Shinsei Bank and veteran SME lender NISSIN.
The joint venture leverages Shinsei’s corporate analysis capabilities and NISSIN’s deep knowledge
of the market to create and provide products to meet SME funding needs overlooked by traditional
financial service providers. Our two new group companies, Shinsei Property Finance and APOLLO
FINANCE, grant loans secured through real estate to SMEs and individual customers, respectively.
In February 2004, the Shinsei group acquired the installment credit business of Teijin Finance, and
the subsidiary commenced operations under the new name Shinsei Sales Finance.
Corporate Revitalization Case Study—Matsuyadenki
In October 2003, the Shinsei group was selected to be the sponsor of the corporate revitalization process for Matsuyadenki, a consumer
electronics chain that applied to the Industrial Revitalization Corporation of Japan for assistance. As the sponsor, the Shinsei group has
financed Matsuyadenki’s acquisition by an investment fund, and we will employ our know-how in corporate revitalization, real estate
financing and other areas to restructure the company’s debt and enhance its profitability.
03新生銀行中間英文 _P02-1 04.3.21 1:41 PM ページ 5

Retail Banking Group: Better Banking for Our Retail Customers
6
Retail Banking Group: Better Banking for Our Retail Customers
Shinsei continually seeks to introduce new services and products that meet or exceed the needs of
our customers. Our creative and innovative approach is made possible by understanding our
customers’ expectations, applying advanced technology and keeping a tight control on costs.
Products and Services Matched to the Needs of Retail Customers
Beginning with the launch of PowerFlex, Shinsei’s comprehensive retail savings account, the Bank
has strived to introduce high-quality products and services that are at the forefront of Japanese retail
banking. Our most recent launches include PowerSmart housing loan, individual annuity products
and Shinsei American Express Card. In March 2003, Shinsei established a Specialty Products
Division, which offers creative asset management services for our customers, including investment
trusts and portfolio advice.
For high net worth clients, Shinsei’s Wealth Management Division provides advanced consulting
and portfolio management expertise, including sophisticated financial planning advice, consulting
services on inheritance approaches and the private placement of investment trusts.
Shinsei’s customer-oriented product development approach will be extended further to include
such services as yen time deposits with unmatched flexibility.
Branch and Infrastructure Expansion
Shinsei Financial Centers were introduced to provide a more open, relaxing and attractive banking
branch environment for our retail customers. We began by rebuilding existing branches to fit the
SFC model. Now all branches follow the SFC approach.
To maximize customers’ convenience and our profitability, we conducted a thorough review of
the branch network and decided to relocate nine branches. Our branch strategy focuses on
introducing new branches in business districts that have a high concentration of consumers and
working professionals, such as LaLaport SFC at Funabashi in Chiba Prefecture, Futakotamagawa SFC
Number of PowerFlex Accounts andBalance of Assets under Management
1,600
1,200
800
400
0
600
450
300
150
012/2001 6/2002 12/2002 6/2003 12/2003
(Billions of yen) (Thousands of accounts)
Assets under managementNumber of accounts
772.0
1,233.6
1,482.11,540.2
60
372
247
204.4
525
172
Comprehensive PowerFlex Account
Shinsei’s comprehensive retail banking account, PowerFlex, allows customers to manage a host of banking products and services
through a single account, and to conduct transactions 24 hours a day, 365 days a year through ATMs, by telephone with Shinsei
PowerCall, or over the internet with Shinsei PowerDirect. Domestic fund transfers via the internet are free of charge, as are ATM
services. Furthermore, Shinsei customers incur no fees, even when using another bank’s ATM network. The Bank also offers foreign
currency deposits, which allow customers to make transactions at almost real-time exchange rates. The most recent addition to this
program was New Zealand dollar deposits. We have also steadily improved the diversification of banking card functions, such as
through the inclusion of international local currency withdrawal services for customers traveling overseas and J-Debit debit card
services.
PowerFlex’s convenience and innovation has captured the attention of a growing number of retail customers. By the end of
December 2003, the number of accounts had surpassed 520,000, representing more than ¥1.5 trillion of assets under management.
PowerSmart Housing Loan
Shinsei’s PowerSmart housing loan was launched in February 2002 to meet customers’ desires to shorten their mortgage repayment
period. Early repayment without fees or charges was historically not allowed in the traditional Japanese banking system. PowerSmart
housing loan allows customers to prepay automatically without fees or charges. Customers can then overdraw from ATMs up to the
same amount as they previously contributed to the early repayment of their mortgage.
Housing Loan Center Tokyo
03新生銀行中間英文 _P02-1 04.3.21 1:41 PM ページ 6
Retail Banking Group: Better Banking for Our Retail Customers
7
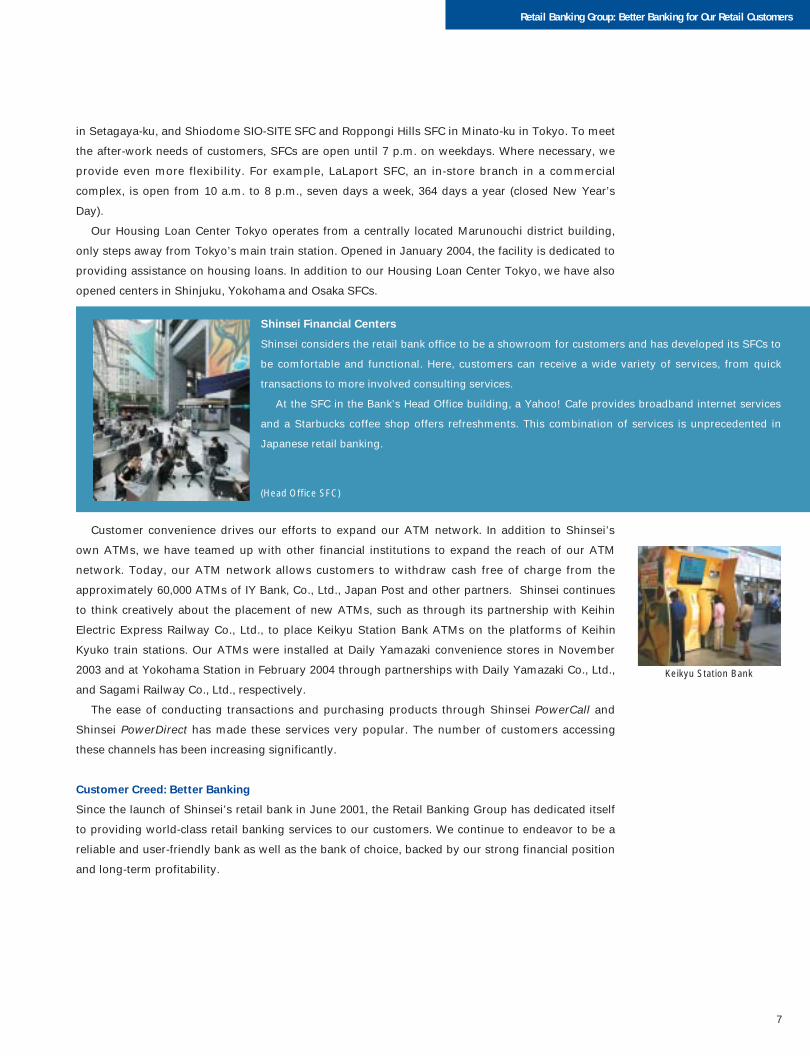
in Setagaya-ku, and Shiodome SIO-SITE SFC and Roppongi Hills SFC in Minato-ku in Tokyo. To meet
the after-work needs of customers, SFCs are open until 7 p.m. on weekdays. Where necessary, we
provide even more flexibility. For example, LaLaport SFC, an in-store branch in a commercial
complex, is open from 10 a.m. to 8 p.m., seven days a week, 364 days a year (closed New Year’s
Day).
Our Housing Loan Center Tokyo operates from a centrally located Marunouchi district building,
only steps away from Tokyo’s main train station. Opened in January 2004, the facility is dedicated to
providing assistance on housing loans. In addition to our Housing Loan Center Tokyo, we have also
opened centers in Shinjuku, Yokohama and Osaka SFCs.
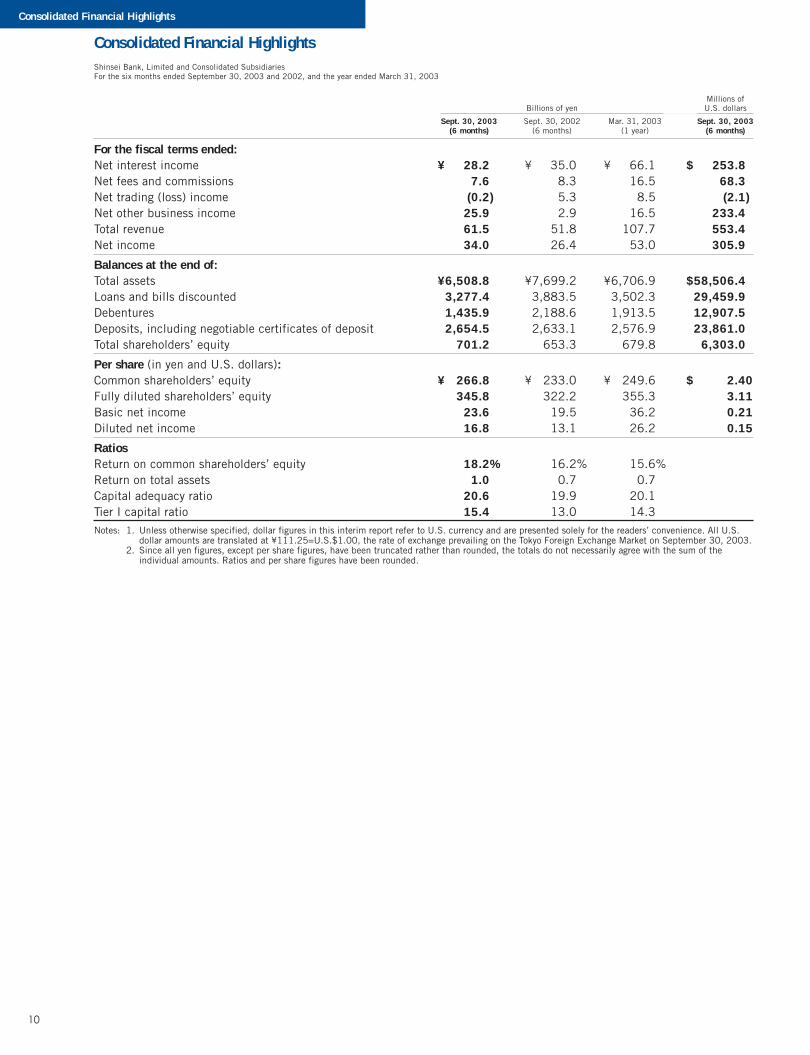
Customer convenience drives our efforts to expand our ATM network. In addition to Shinsei’s
own ATMs, we have teamed up with other financial institutions to expand the reach of our ATM
network. Today, our ATM network allows customers to withdraw cash free of charge from the
approximately 60,000 ATMs of IY Bank, Co., Ltd., Japan Post and other partners. Shinsei continues
to think creatively about the placement of new ATMs, such as through its partnership with Keihin
Electric Express Railway Co., Ltd., to place Keikyu Station Bank ATMs on the platforms of Keihin
Kyuko train stations. Our ATMs were installed at Daily Yamazaki convenience stores in November
2003 and at Yokohama Station in February 2004 through partnerships with Daily Yamazaki Co., Ltd.,
and Sagami Railway Co., Ltd., respectively.
The ease of conducting transactions and purchasing products through Shinsei PowerCall and
Shinsei PowerDirect has made these services very popular. The number of customers accessing
these channels has been increasing significantly.
Customer Creed: Better Banking
Since the launch of Shinsei’s retail bank in June 2001, the Retail Banking Group has dedicated itself
to providing world-class retail banking services to our customers. We continue to endeavor to be a
reliable and user-friendly bank as well as the bank of choice, backed by our strong financial position
and long-term profitability.
Shinsei Financial Centers
Shinsei considers the retail bank office to be a showroom for customers and has developed its SFCs to
be comfortable and functional. Here, customers can receive a wide variety of services, from quick
transactions to more involved consulting services.
At the SFC in the Bank’s Head Office building, a Yahoo! Cafe provides broadband internet services
and a Starbucks coffee shop offers refreshments. This combination of services is unprecedented in
Japanese retail banking.
(Head Office SFC)
Keikyu Station Bank
03新生銀行中間英文 _P02-1 04.3.21 1:41 PM ページ 7

Summary of Performance
8
Consolidated Net Income
9/2002 9/2003
40
30
20
10
0
(Billions of yen)
26.4
34.0
Consolidated Total Revenue and Non-Interest Income
9/2002 9/2003
80
60
40
20
0
60
45
30
15
0
(Billions of yen) (%)
51.8
61.5
Total revenueNon-interest incomeNon-interest income as a percentage of total revenue
16.7
54.1%
33.332.3%
Consolidated Total Shareholders’Equity and Capital Adequacy Ratio
9/2002 3/2003 9/2003
800
600
400
200
0
24
18
12
6
0
(Billions of yen) (%)
653.3
Total shareholders’ equityCapital adequacy ratio
679.8 701.2
20.10%20.58%
19.92%
Disclosure of Claims under the Financial Revitalization Law
(Non-Consolidated)
9/2002 3/2003 9/2003
800
600
400
200
0
(Billions of yen)
Substandard claimsDoubtful claimsClaims against bankrupt and quasi-bankrupt obligors
186.6
332.4
274.7
14.694.445.1
793.8
233.2
35.799.0
98.4 154.2
Summary of Performance
Consolidated Net Income
For the first half of fiscal 2003, ending March 31, 2004, consolidated net income totaled ¥34.0 billion,
a 28.6% increase compared with the same period in the prior fiscal year. Although net interest
income decreased 19.5%, as we continued to focus on improving asset quality by reducing loans,
this was more than offset by a significant increase in net other business income, including income
from our investment banking activities.
Consolidated Total Revenue and Non-Interest Income
Consolidated non-interest income, including gain on money held in trust, totaled ¥33.3 billion,
accounting for 54.1% of total revenue of ¥61.5 billion.
Consolidated Total Shareholders’ Equity and Capital Adequacy Ratio
At the close of the interim term, consolidated total shareholders’ equity was higher than at the end
of the previous fiscal year, at ¥701.2 billion.
The capital adequacy ratio was up 0.48 percentage point at the end of the interim term, from
20.10% at the end of fiscal 2002 to 20.58%.
Disclosure of Claims under the Financial Revitalization Law (Non-Consolidated)
Please see pages 13–15 for further information.
03新生銀行中間英文 _P02-1 04.3.21 1:41 PM ページ 8

Financial Section
9
Contents
Consolidated Financial Highlights.......................................................................................10
Financial Review ..............................................................................................................11
Summary of Consolidated Interim Statements of Income and Balance Sheets....................11
Summary of Non-Consolidated Interim Statements of Income and Balance Sheets.............13
Asset Quality and Disposal of Problem Loans (Non-Consolidated) .....................................13
Consolidated Interim Balance Sheets (Unaudited)................................................................18
Consolidated Interim Statements of Income (Unaudited) ......................................................19
Consolidated Interim Statements of Shareholders’ Equity (Unaudited) .................................. 20
Consolidated Interim Statements of Cash Flows (Unaudited) .................................................21
Notes to Consolidated Interim Financial Statements (Unaudited) ..........................................22
Non-Consolidated Interim Balance Sheets (Unaudited).........................................................34
Non-Consolidated Interim Statements of Income (Unaudited) .............................................. 35
03新生銀行中間英文 _P02-1 04.3.21 1:41 PM ページ 9
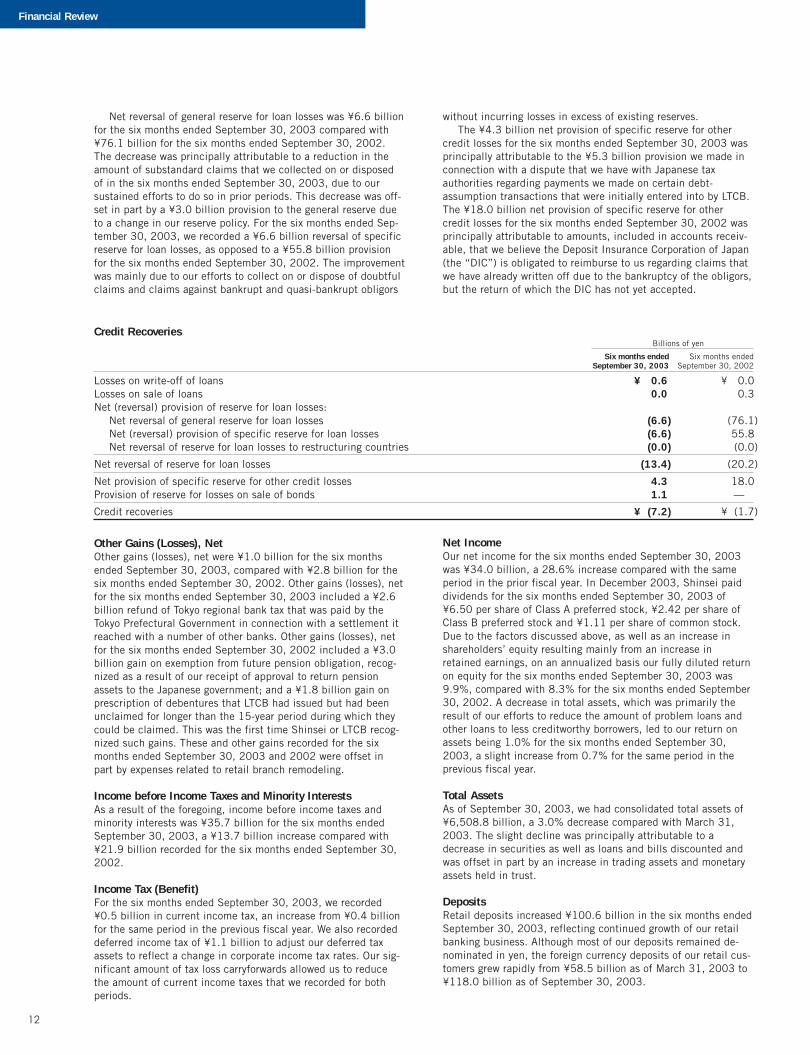
10
Millions ofBillions of yen U.S. dollars
Sept. 30, 2003 Sept. 30, 2002 Mar. 31, 2003 Sept. 30, 2003(6 months) (6 months) (1 year) (6 months)
For the fiscal terms ended:Net interest income ¥0,028.2 ¥0,035.0 ¥0,066.1 $00,253.8Net fees and commissions 7.6 8.3 16.5 68.3Net trading (loss) income (0.2) 5.3 8.5 (2.1)Net other business income 25.9 2.9 16.5 233.4Total revenue 61.5 51.8 107.7 553.4Net income 34.0 26.4 53.0 305.9
Balances at the end of:Total assets ¥6,508.8 ¥7,699.2 ¥6,706.9 $58,506.4Loans and bills discounted 3,277.4 3,883.5 3,502.3 29,459.9Debentures 1,435.9 2,188.6 1,913.5 12,907.5Deposits, including negotiable certificates of deposit 2,654.5 2,633.1 2,576.9 23,861.0Total shareholders’ equity 701.2 653.3 679.8 6,303.0
Per share (in yen and U.S. dollars):Common shareholders’ equity ¥0,266.8 ¥0,233.0 ¥0,249.6 $00,002.40Fully diluted shareholders’ equity 345.8 322.2 355.3 3.11Basic net income 23.6 19.5 36.2 0.21Diluted net income 16.8 13.1 26.2 0.15
RatiosReturn on common shareholders’ equity 18.2% 16.2% 15.6%Return on total assets 1.0 0.7 0.7Capital adequacy ratio 20.6 19.9 20.1Tier I capital ratio 15.4 13.0 14.3Notes: 1. Unless otherwise specified, dollar figures in this interim report refer to U.S. currency and are presented solely for the readers’ convenience. All U.S.
dollar amounts are translated at ¥111.25=U.S.$1.00, the rate of exchange prevailing on the Tokyo Foreign Exchange Market on September 30, 2003.2. Since all yen figures, except per share figures, have been truncated rather than rounded, the totals do not necessarily agree with the sum of the
individual amounts. Ratios and per share figures have been rounded.
Consolidated Financial HighlightsShinsei Bank, Limited and Consolidated SubsidiariesFor the six months ended September 30, 2003 and 2002, and the year ended March 31, 2003
Consolidated Financial Highlights
ShinseiIR/P1-P20/03年-1 04.3.21, 1:39 PMPage 10 Adobe PageMaker 6.0J/PPC

11
Summary of Consolidated Interim Statements of Incomeand Balance Sheets
Net Interest IncomeOur principal interest-earning assets are domestic loans and billsdiscounted as well as securities (other than securities held fortrading purposes), consisting mainly of Japanese governmentbonds and bonds issued by non-Japanese corporations. Ourprincipal interest-bearing liabilities are deposits (includingnegotiable certificates of deposit and foreign-currency deposits),debentures, and subordinated bonds and debt.
Net interest income for the six months ended September 30,2003 was ¥28.2 billion, a 19.5% decline compared with thesame period in the prior fiscal year, as total interest incomedecreased more than total interest expenses. Total interestincome for the six months ended September 30, 2003 declined¥15.2 billion to ¥44.9 billion and total interest expensesdeclined ¥8.4 billion to ¥16.7 billion.
Total interest income decreased because we reduced ourloans and bills discounted substantially as we continued to focuson improving asset quality.
Total interest expenses decreased mainly because we reducedour interest-bearing liabilities, particularly higher-cost deben-tures and subordinated debt, replacing them with deposits andother, generally less expensive, funding sources.
Net Fees and CommissionsFees and commissions include, among other things, prepayment,arrangement and other fees on loans and other financing prod-ucts, fees for securities services, particularly for structuring andunderwriting securitization transactions, fees for corporate advi-sory services, and commissions on sales of asset managementproducts.
For the six months ended September 30, 2003, we earned¥7.6 billion in net fees and commissions, a decrease of ¥0.7 bil-lion compared with the same period in the previous fiscal year.The main factor was a decrease in fees from loan prepaymentsfrom ¥2.2 billion for the six months ended September 30, 2002to ¥0.5 billion for the same period in the current fiscal year. Thisdecrease was offset in part by an increase in commissions onsales of asset management products.
Net Trading (Loss) IncomeNet trading income represents revenues from transactions under-taken for trading purposes (that is, transactions seeking to cap-ture gains arising from short-term changes in market value). Inaddition to investments in securities, we engage in foreign cur-rency and derivatives transactions as part of our trading activity.Net trading income also reflects income we derive from providingderivative products, including structured deposits, to customers.
Net trading loss for the six months ended September 30, 2003was ¥0.2 billion, compared with net trading income of ¥5.3 bil-lion for the same period in the prior fiscal year. The decrease wasdue mainly to a decline in revenue from derivatives transactions asa result of a decline in derivatives trading activity.
Net Other Business IncomeOur net other business income for the six months ended Septem-ber 30, 2003 was ¥25.9 billion, an increase of ¥22.9 billioncompared with the same period in the previous fiscal year. Theprincipal reason for the increase was the ¥19.0 billion improve-ment in net gain (loss) on securities and foreign exchanges,which was attributable to the losses we incurred on our U.S.corporate bond portfolio for the six months ended September 30,2002. We have taken a number of measures to limit thepotential losses on these investments.
Also contributing to the increase in net other business income
was a ¥5.9 billion increase in income on monetary assets heldin trust. The most significant factor in this increase was animprovement in gains from equity securities-related transactions,which was supplemented by gains on sales of loans in our credit-trading business and gains from the sale of securitized assets.
The “other, net” category of other business income includesprimarily income from our credit trading activities. Other, net was¥8.1 billion for the six months ended September 30, 2003, adecrease of 19.3% compared with the same period in the previ-ous fiscal year. The decrease was primarily attributable to a dropin net revenue from our credit-trading activities.
Total RevenueMainly as a result of the increase in net other business income,offset in part by the decrease in net interest income and nettrading income, total revenue for the six months ended Septem-ber 30, 2003 was ¥61.5 billion, 18.8% more than the sameperiod in the previous fiscal year.
General and Administrative ExpensesGeneral and administrative expenses for the six months endedSeptember 30, 2003 were ¥34.1 billion, 0.9% lower than thesame period for the prior fiscal year, as a result of our continuingefforts to maintain fiscal discipline to keep expenses low. Person-nel expenses decreased ¥1.1 billion, primarily as a result of earlyretirements and other departures of employees. These employeesretired or departed as part of a career planning and placementassistance program.
Though we increased the number of branches and subsidiar-ies, premises expenses were substantially unchanged from thesame period in the previous year, as we rationalized our use ofspace in our branches, satellite office and headquarters.
Technology and data processing expenses for the six monthsended September 30, 2003 increased 25.0% to ¥2.9 billioncompared with the six months ended September 30, 2002. Theincrease was principally due to increased investments in newinformation technology systems, as well as an increase in relatedmaintenance and depreciation expenses.
Deposit insurance premium increased ¥0.1 billion, mainlydue to an increase in the amount of retail banking deposits thatare subject to deposit insurance. Other general and administra-tive expenses were substantially unchanged, with the bulk ofsuch expenses consisting of outsourcing and temporary staffexpenses, professional and management advisory fees, andprinting, communication and stationery expenses.
As a result of the above, our overhead ratio, or the ratio ofgeneral and administrative expenses to total revenue, was 55.5%for the six months ended September 30, 2003, compared with66.6% for the same period in the prior fiscal year.
Credit RecoveriesThe principal components of credit recoveries are provisions orreversals of reserves. In accordance with Japanese regulatoryrequirements, we maintain general and specific reserves for loanlosses, a reserve for loan losses to restructuring countries, and aspecific reserve for other credit losses. See “Asset Quality andDisposal of Problem Loans (Non-Consolidated)” for a discussionof our loan loss reserve policies.
We recorded credit recoveries of ¥7.2 billion for the sixmonths ended September 30, 2003 compared with credit recov-eries of ¥1.7 billion for the six months ended September 30,2002. The principal reason for the overall improvement was largedecreases in the amount of net provision of specific reserves forboth loan losses and other credit losses for the six months endedSeptember 30, 2003 compared with the same period in the pre-vious fiscal year. These changes were offset in part by a decreasein the amount of net reversal of general reserve for loan losses.
Financial Review
Financial Review
ShinseiIR/P1-P20/03年-1 04.3.21, 1:39 PMPage 11 Adobe PageMaker 6.0J/PPC
12
Net reversal of general reserve for loan losses was ¥6.6 billionfor the six months ended September 30, 2003 compared with¥76.1 billion for the six months ended September 30, 2002.The decrease was principally attributable to a reduction in theamount of substandard claims that we collected on or disposedof in the six months ended September 30, 2003, due to oursustained efforts to do so in prior periods. This decrease was off-set in part by a ¥3.0 billion provision to the general reserve dueto a change in our reserve policy. For the six months ended Sep-tember 30, 2003, we recorded a ¥6.6 billion reversal of specificreserve for loan losses, as opposed to a ¥55.8 billion provisionfor the six months ended September 30, 2002. The improvementwas mainly due to our efforts to collect on or dispose of doubtfulclaims and claims against bankrupt and quasi-bankrupt obligors
without incurring losses in excess of existing reserves.The ¥4.3 billion net provision of specific reserve for other
credit losses for the six months ended September 30, 2003 wasprincipally attributable to the ¥5.3 billion provision we made inconnection with a dispute that we have with Japanese taxauthorities regarding payments we made on certain debt-assumption transactions that were initially entered into by LTCB.The ¥18.0 billion net provision of specific reserve for othercredit losses for the six months ended September 30, 2002 wasprincipally attributable to amounts, included in accounts receiv-able, that we believe the Deposit Insurance Corporation of Japan(the “DIC”) is obligated to reimburse to us regarding claims thatwe have already written off due to the bankruptcy of the obligors,but the return of which the DIC has not yet accepted.
Credit RecoveriesBillions of yen
Six months ended Six months endedSeptember 30, 2003 September 30, 2002
Losses on write-off of loans ¥(00.6 ¥(00.0Losses on sale of loans 0.0 0.3Net (reversal) provision of reserve for loan losses:
Net reversal of general reserve for loan losses (6.6) (76.1)Net (reversal) provision of specific reserve for loan losses (6.6) 55.8Net reversal of reserve for loan losses to restructuring countries (0.0) (0.0)
Net reversal of reserve for loan losses (13.4) (20.2)
Net provision of specific reserve for other credit losses 4.3 18.0Provision of reserve for losses on sale of bonds 1.1 —
Credit recoveries ¥0(7.2) ¥0(1.7)
Other Gains (Losses), NetOther gains (losses), net were ¥1.0 billion for the six monthsended September 30, 2003, compared with ¥2.8 billion for thesix months ended September 30, 2002. Other gains (losses), netfor the six months ended September 30, 2003 included a ¥2.6billion refund of Tokyo regional bank tax that was paid by theTokyo Prefectural Government in connection with a settlement itreached with a number of other banks. Other gains (losses), netfor the six months ended September 30, 2002 included a ¥3.0billion gain on exemption from future pension obligation, recog-nized as a result of our receipt of approval to return pensionassets to the Japanese government; and a ¥1.8 billion gain onprescription of debentures that LTCB had issued but had beenunclaimed for longer than the 15-year period during which theycould be claimed. This was the first time Shinsei or LTCB recog-nized such gains. These and other gains recorded for the sixmonths ended September 30, 2003 and 2002 were offset inpart by expenses related to retail branch remodeling.
Income before Income Taxes and Minority InterestsAs a result of the foregoing, income before income taxes andminority interests was ¥35.7 billion for the six months endedSeptember 30, 2003, a ¥13.7 billion increase compared with¥21.9 billion recorded for the six months ended September 30,2002.
Income Tax (Benefit)For the six months ended September 30, 2003, we recorded¥0.5 billion in current income tax, an increase from ¥0.4 billionfor the same period in the previous fiscal year. We also recordeddeferred income tax of ¥1.1 billion to adjust our deferred taxassets to reflect a change in corporate income tax rates. Our sig-nificant amount of tax loss carryforwards allowed us to reducethe amount of current income taxes that we recorded for bothperiods.
Net IncomeOur net income for the six months ended September 30, 2003was ¥34.0 billion, a 28.6% increase compared with the sameperiod in the prior fiscal year. In December 2003, Shinsei paiddividends for the six months ended September 30, 2003 of¥6.50 per share of Class A preferred stock, ¥2.42 per share ofClass B preferred stock and ¥1.11 per share of common stock.Due to the factors discussed above, as well as an increase inshareholders’ equity resulting mainly from an increase inretained earnings, on an annualized basis our fully diluted returnon equity for the six months ended September 30, 2003 was9.9%, compared with 8.3% for the six months ended September30, 2002. A decrease in total assets, which was primarily theresult of our efforts to reduce the amount of problem loans andother loans to less creditworthy borrowers, led to our return onassets being 1.0% for the six months ended September 30,2003, a slight increase from 0.7% for the same period in theprevious fiscal year.
Total AssetsAs of September 30, 2003, we had consolidated total assets of¥6,508.8 billion, a 3.0% decrease compared with March 31,2003. The slight decline was principally attributable to adecrease in securities as well as loans and bills discounted andwas offset in part by an increase in trading assets and monetaryassets held in trust.
DepositsRetail deposits increased ¥100.6 billion in the six months endedSeptember 30, 2003, reflecting continued growth of our retailbanking business. Although most of our deposits remained de-nominated in yen, the foreign currency deposits of our retail cus-tomers grew rapidly from ¥58.5 billion as of March 31, 2003 to¥118.0 billion as of September 30, 2003.
Financial Review
ShinseiIR/P1-P20/03年-1 04.3.21, 1:39 PMPage 12 Adobe PageMaker 6.0J/PPC

13
DebenturesAs of September 30, 2003, we had ¥1,435.9 billion in deben-tures outstanding, including ¥27.7 billion of subordinatedbonds. This represented 24.7% of our consolidated total liabili-ties and constituted a decline of 25.0% from March 31, 2003.Other than subordinated bonds, debentures are issued with termsof one, two, three or five years.
Shareholders’ EquityTotal shareholders’ equity as of September 30, 2003 increased¥21.3 billion, or 3.1%, to ¥701.2 billion, compared with March31, 2003, due primarily to an increase of ¥27.1 billion in retainedearnings, offset in part by a ¥6.6 billion decrease in net unrealizedgain on securities available-for-sale, net of taxes that was mainlyattributable to the impact of increasing interest rates on the marketvalue of our portfolio of Japanese government bonds.
Summary of Non-Consolidated Interim Statements ofIncome and Balance Sheets
We disclose non-consolidated interim financial information ofShinsei in addition to our consolidated interim financial state-ments. As a recipient of public funds, we are required by theFinancial Services Agency (the “FSA”) to update and report onShinsei’s achievement of non-consolidated performance targetsset forth in its Revitalization Plan on a quarterly basis, and pub-licly disclose that information semiannually. Shinsei’s plan wasinitially prepared by LTCB upon its emergence from nationaliza-tion and we have subsequently updated the plan in August 2001and August 2003.
Shinsei accounts for a substantial portion of our consolidatedfinancial condition and results of operations. For the fiscal yearended March 31, 2003, Shinsei accounted for 111.4% of ourconsolidated net income and 100.8% of our consolidated assets.As of and for the six months ended September 30, 2003, Shinsei
accounted for 93.6% of our consolidated net income and 100.6%of our consolidated assets. The increase in the portion of our con-solidated results attributable to our subsidiaries was due mainly tothe favorable results of some of our pre-existing subsidiaries, suchas Shinsei Securities Co., Ltd., as well as our acquisition in April2003 of Life Housing Loan Co., Ltd., a housing loan company.While we believe our subsidiaries may account for an increasinglygreater portion of our consolidated financial condition and resultsof operations in the future, we also believe our financial conditionand results of operations will continue to reflect predominantlythose of Shinsei.
Asset Quality and Disposal of Problem Loans(Non-Consolidated)
Disclosure of Claims Classified under the FinancialRevitalization Law (Non-Consolidated)Total problem claims decreased ¥78.9 billion, or 33.8%,between March 31, 2003 and September 30, 2003. Problemclaims of all three categories continued to decrease in the sixmonths ended September 30, 2003: claims against bankruptand quasi-bankrupt obligors decreased 59.1% to ¥14.6 billion,doubtful claims decreased 4.6% to ¥94.4 billion, and substan-dard claims decreased 54.1% to ¥45.1 billion. As a result ofthese dramatic reductions, the ratio of non-performing claimsdisclosed under the Financial Revitalization Law to total non-consolidated claims as of September 30, 2003 decreased to4.1%, compared with 18.2% as of September 30, 2002.
Shinsei’s other claims against caution obligors (sono tayochui-saki) totaled ¥147.6 billion as of September 30, 2003and a 40.7% decrease from the ¥249.0 billion as of March 31,2003. These claims represented 3.9% of total non-consolidatedclaims as of September 30, 2003, down from 6.1% as ofMarch 31, 2003.
Claims Classified under the Financial Revitalization Law (Non-Consolidated)Billions of yen, except percentages
As of September 30, As of March 31,2003 2003
Claims against bankrupt and quasi-bankrupt obligors ¥0,014.6 ¥0,035.7Doubtful claims 94.4 99.0Substandard claims 45.1 98.4
Total claims disclosed under the Financial Revitalization Law(1) 154.2 233.2Normal claims and claims against caution obligors excluding substandard claims 3,594.9 3,854.9
Total claims ¥3,749.2 ¥4,088.1
Ratio of total claims disclosed under the Financial Revitalization Law to total claims 4.1% 5.7%
Note:(1) Includes loans and bills discounted, customers’ liabilities for acceptances and guarantees and other exposure to or in respect of bankrupt and quasi-bankruptobligors and doubtful claims, as well as loans and bills discounted classified as substandard claims.
Financial Review
ShinseiIR/P1-P20/03年-1 04.3.21, 1:39 PMPage 13 Adobe PageMaker 6.0J/PPC
14
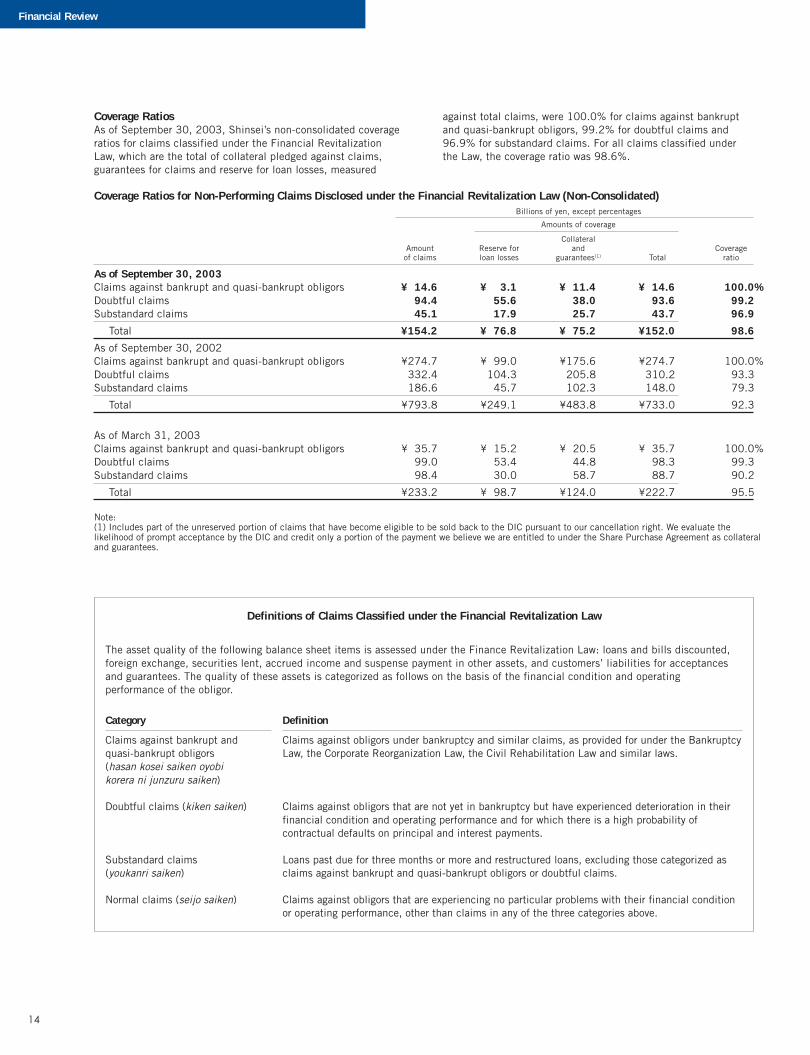
Coverage RatiosAs of September 30, 2003, Shinsei’s non-consolidated coverageratios for claims classified under the Financial RevitalizationLaw, which are the total of collateral pledged against claims,guarantees for claims and reserve for loan losses, measured
against total claims, were 100.0% for claims against bankruptand quasi-bankrupt obligors, 99.2% for doubtful claims and96.9% for substandard claims. For all claims classified underthe Law, the coverage ratio was 98.6%.
Coverage Ratios for Non-Performing Claims Disclosed under the Financial Revitalization Law (Non-Consolidated)Billions of yen, except percentages
Amounts of coverage
CollateralAmount Reserve for and Coverageof claims loan losses guarantees(1) Total ratio
As of September 30, 2003Claims against bankrupt and quasi-bankrupt obligors ¥014.6 ¥003.1 ¥011.4 ¥014.6 100.0%Doubtful claims 94.4 55.6 38.0 93.6 99.2Substandard claims 45.1 17.9 25.7 43.7 96.9
Total ¥154.2 ¥076.8 ¥075.2 ¥152.0 98.6
As of September 30, 2002Claims against bankrupt and quasi-bankrupt obligors ¥274.7 ¥099.0 ¥175.6 ¥274.7 100.0%Doubtful claims 332.4 104.3 205.8 310.2 93.3Substandard claims 186.6 45.7 102.3 148.0 79.3
Total ¥793.8 ¥249.1 ¥483.8 ¥733.0 92.3
As of March 31, 2003Claims against bankrupt and quasi-bankrupt obligors ¥035.7 ¥015.2 ¥020.5 ¥035.7 100.0%Doubtful claims 99.0 53.4 44.8 98.3 99.3Substandard claims 98.4 30.0 58.7 88.7 90.2
Total ¥233.2 ¥098.7 ¥124.0 ¥222.7 95.5
Note:(1) Includes part of the unreserved portion of claims that have become eligible to be sold back to the DIC pursuant to our cancellation right. We evaluate thelikelihood of prompt acceptance by the DIC and credit only a portion of the payment we believe we are entitled to under the Share Purchase Agreement as collateraland guarantees.
Definitions of Claims Classified under the Financial Revitalization Law
The asset quality of the following balance sheet items is assessed under the Finance Revitalization Law: loans and bills discounted,foreign exchange, securities lent, accrued income and suspense payment in other assets, and customers’ liabilities for acceptancesand guarantees. The quality of these assets is categorized as follows on the basis of the financial condition and operatingperformance of the obligor.
Category Definition
Claims against bankrupt and Claims against obligors under bankruptcy and similar claims, as provided for under the Bankruptcyquasi-bankrupt obligors Law, the Corporate Reorganization Law, the Civil Rehabilitation Law and similar laws.(hasan kosei saiken oyobikorera ni junzuru saiken)
Doubtful claims (kiken saiken) Claims against obligors that are not yet in bankruptcy but have experienced deterioration in theirfinancial condition and operating performance and for which there is a high probability ofcontractual defaults on principal and interest payments.
Substandard claims Loans past due for three months or more and restructured loans, excluding those categorized as(youkanri saiken) claims against bankrupt and quasi-bankrupt obligors or doubtful claims.
Normal claims (seijo saiken) Claims against obligors that are experiencing no particular problems with their financial conditionor operating performance, other than claims in any of the three categories above.
Financial Review
ShinseiIR/P1-P20/03年-1 04.3.21, 1:39 PMPage 14 Adobe PageMaker 6.0J/PPC

15
Disposal of Problem ClaimsShinsei uses a variety of methods for removing problem loans from its balance sheet, including sales, collections and, prior to the thirdanniversary of the closing date of the acquisition of LTCB, the return of loans to the DIC pursuant to our cancellation right. The followingtable sets forth a breakdown of disposals of substandard claims, doubtful claims and claims against bankrupt and quasi-bankrupt obligorson a non-consolidated basis:
Reduction of Problem Claims as Disclosed under the Financial Revitalization Law (Non-Consolidated)Billions of yen
Six months ended Year endedSeptember 30, 2003 March 31, 2003
Write-off/forgiveness ¥12.1 ¥035.2Sale 16.2 341.3Transferred to the DIC via exercise of cancellation right 44.3 284.5Securitization — —Collections (newly classified as problem claims), net 6.1 219.4
Total ¥78.9 ¥880.4
Reserve for Credit LossesThe following table sets forth a breakdown of our total reserve for credit losses on a non-consolidated basis as of the dates indicated:
Reserve for Credit Losses (Non-Consolidated)Billions of yen, except percentages
As of September 30, As of March 31,2003 2003
General reserve for loan losses ¥0,079.2 ¥0,096.5Specific reserve for loan losses 60.5 71.1Reserve for loans to restructuring countries 0.0 0.0
Subtotal of reserve for loan losses 139.7 167.7Specific reserve for other credit losses 53.1 48.8
Total reserve for credit losses ¥0,192.9 ¥0,216.5
Total claims(1) ¥3,749.2 ¥4,088.1Ratio of total reserve for loan losses to total claims 3.7% 4.1%Ratio of total reserves for credit losses to total claims 5.1% 5.3%
Note:(1) Total claims includes loans and bills discounted, foreign exchange claims, securities lent, accrued interest income and suspense payment in other assets, as wellas customers’ liabilities for acceptances and guarantees.
Risk-Monitored LoansRisk-monitored loans decreased by 33.5% during the six months ended September 30, 2003 to ¥152.4 billion as of September 30,2003. Most of the decline was attributable to the 70.8% or ¥52.6 billion decline in loans past due for three months or more to ¥21.6billion as of September 30, 2003.
The following tables set forth information concerning our consolidated and non-consolidated risk-monitored loans as of the datesindicated:
Risk-Monitored Loans (Consolidated)Billions of yen, except percentages
As of September 30, As of March 31,2003 2003
Loans and bills discounted ¥3,277.4 ¥3,502.3
Loans to bankrupt obligors (A) ¥0,010.4 ¥0,013.4Non-accrual delinquent loans (B) 96.6 117.3
Total loans (A)+(B) 107.1 130.7
Ratio to total loans and bills discounted 3.3% 3.7%Loans past due for three months or more (C) ¥0,021.6 ¥0,074.3Restructured loans (D) 23.5 24.2
Total risk-monitored loans (A)+(B)+(C)+(D) ¥0,152.4 ¥0,229.3
Ratio to total loans and bills discounted 4.7% 6.5%Reserve for credit losses ¥0,192.3 ¥0,216.5
Financial Review
ShinseiIR/P1-P20/03年-1 04.3.21, 1:39 PMPage 15 Adobe PageMaker 6.0J/PPC

16
Risk-Monitored Loans (Non-Consolidated)Billions of yen, except percentages
As of September 30, As of March 31,2003 2003
Loans and bills discounted ¥3,466.4 ¥3,673.1
Loans to bankrupt obligors (A) ¥0,010.0 ¥0,013.2Non-accrual delinquent loans (B) 95.3 116.0
Total loans (A)+(B) 105.4 129.2
Ratio to total loans and bills discounted 3.0% 3.5%Loans past due for three months or more (C) ¥0,021.6 ¥0,074.3Restructured loans (D) 23.4 24.1
Total risk-monitored loans (A)+(B)+(C)+(D) ¥0,150.5 ¥0,227.7
Ratio to total loans and bills discounted 4.3% 6.2%Reserve for credit losses ¥0,192.9 ¥0,216.5
Definitions of Categories of Risk-Monitored Loans
Risk-monitored loan is the collective term referring to loans to borrowers in bankruptcy, past due loans, loans past due for threemonths or more and restructured loans.
These disclosure categories do not take account of possible recoveries through the disposal of collateral pledged against suchloans. Therefore, these figures are not meant to imply that the full amounts are uncollectible. Definitions of risk-monitored loans areas follows.
Category Definition
Loans to bankrupt obligors Loans to legally bankrupt obligors.(hatan-saki saiken)
Non-accrual delinquent loans Loans to virtually bankrupt and possibly bankrupt obligors.(entai-saki saiken)
Loans past due for three months or Loans on which principal and/or interest are past due three months or more.more (san-ka-getsu ijou entai saiken)
Restructured loans (kashidashi jouken Loans with lending terms than have been changed in ways favorable to the borrower,kanwa saiken) including reducing interest rates, providing grace periods for repayment and forgiving a
portion of the debt.
Financial Review
ShinseiIR/P1-P20/03年-1 04.3.21, 1:39 PMPage 16 Adobe PageMaker 6.0J/PPC

17
Reserve Policies
Claims against obligors, as categorizedunder self-assessment guidelines Reserve policy
Claims against virtually and legally bankrupt We either write off directly or make a provision for, in the specific reserve forobligors loan losses, the full amount of the unsecured, unguaranteed portion of the claim.
Claims against possibly bankrupt obligors For most claims against possibly bankrupt obligors, we make a provision in thespecific reserve for loan losses in an amount calculated based on the discountedcash flow method.
For the remaining claims, we make a provision to that reserve for theunsecured, unguaranteed portion of the claims in the amount of the product ofthat portion and the higher of 70% or the estimated loss ratio, based on historicallosses on claims in this category, for the next three years.
Claims against substandard obligors For most claims against substandard obligors, we make a provision in the generalreserve for loan losses in an amount calculated based on the discounted cash flowmethod.
For the remaining claims, we make a provision to that reserve for the estimatedamount of losses over three years computed based on the expected loss ratio forclaims in this category.
Claims against caution obligors, other than We make a provision, in the general reserve for loan losses, for the estimatedclaims against substandard obligors amount of losses over the average remaining term of the loans computed based on
the expected loss ratio for claims in this category.
Claims against normal obligors We make a provision, in the general reserve for loan losses, for the estimatedamount of losses over a year computed based on the expected loss ratio for claimsin this category.
Capital RatiosOur capital adequacy ratio as of September 30, 2003 was20.58%, compared with 20.10% as of March 31, 2003. WhileTier II capital decreased, mainly due to the repayment of subor-dinated debt, the increase in Tier I capital, due primarily to ournet income as well as the overall decrease in risk assets as aresult of our efforts to reduce our problem loan balance, caused
our capital ratio to increase. Our Tier I capital ratio, or the ratioof Tier I capital to risk assets, also increased from 14.27% as ofMarch 31, 2003 to 15.44% as of September 30, 2003. Theamount of our net deferred taxes represented 2.8% of our Tier Icapital as of March 31, 2003 and 3.4% of our Tier I capital as ofSeptember 30, 2003.
Consolidated Capital RatiosBillions of yen, except percentages
As of September 30, As of March 31,2003 2003
Basic items (Tier I):Capital stock ¥0,451.2 ¥0,451.2
Total Tier I (A) 691.2 659.8
Supplementary items (Tier II):General reserve for loan losses 27.9 28.8Perpetual subordinated debt and bonds 197.1 235.8Non-perpetual subordinated debt and bonds 8.3 8.5
Total 233.4 273.3
Amount eligible for inclusion in capital (B) 233.4 273.3Deduction (C) 3.5 3.6
Total capital (D) [(A)+(B)–(C)] ¥0,921.2 ¥0,929.5
Risk assets:On-balance sheet items ¥3,883.3 ¥4,084.2Off-balance sheet items 592.0 538.5
Total (E) ¥4,475.3 ¥4,622.8
Consolidated capital adequacy ratio (D) / (E) 20.58% 20.10%Consolidated Tier I capital ratio (A) / (E) 15.44 14.27
Financial Review
ShinseiIR/P1-P20/03年-1 04.3.21, 1:39 PMPage 17 Adobe PageMaker 6.0J/PPC

18
Thousands ofMillions of yen U.S. dollars (Note 1)
Sept. 30, 2003 Sept. 30, 2002 Mar. 31, 2003 Sept. 30, 2003
ASSETSCash and due from banks (Notes 3 and 19) ¥0,188,231 ¥0,274,693 ¥0,245,337 $01,691,973Call loans — 88,100 536 —Collateral related to securities borrowing transactions 15,972 96,505 1,966 143,569Other monetary claims purchased (Note 4) 186,900 158,225 201,943 1,680,002Trading assets (Notes 5, 19 and 28) 597,955 433,081 361,175 5,374,880Monetary assets held in trust (Note 6) 305,191 218,067 170,045 2,743,298Securities (Notes 7 and 19) 1,520,345 2,246,089 1,770,996 13,666,025Loans and bills discounted (Notes 8, 19 and 27) 3,277,418 3,883,522 3,502,349 29,459,942Foreign exchanges (Notes 16 and 19) 10,683 8,624 10,273 96,031Other assets (Notes 9, 19 and 28) 443,614 423,027 503,635 3,987,550Premises and equipment (Note 10) 86,573 86,710 86,117 778,186Deferred discounts on and issuance expenses for debentures 165 244 185 1,487Deferred tax assets 23,233 17,202 18,435 208,842Customers’ liabilities for acceptances and guarantees (Note 18) 44,923 87,785 50,544 403,804Reserve for credit losses (Notes 11 and 30) (192,363) (322,637) (216,570) (1,729,111)
Total assets ¥6,508,845 ¥7,699,243 ¥6,706,971 $58,506,478
LIABILITIES, MINORITY INTERESTS IN SUBSIDIARIES AND SHAREHOLDERS’ EQUITYLiabilities:Debentures (Note 12) ¥1,435,968 ¥2,188,691 ¥1,913,556 $12,907,584Deposits, including negotiable certificates of deposit (Notes 13 and 19) 2,654,537 2,633,101 2,576,923 23,861,008Call money 109,100 76,887 — 980,674Payables under repurchase agreements (Note 19) 431,552 113,055 164,958 3,879,126Collateral related to securities lending transactions (Note 19) 258,157 726,136 397,344 2,320,514Trading liabilities (Notes 14 and 28) 117,092 182,707 117,497 1,052,516Borrowed money (Notes 15 and 19) 301,035 437,510 336,888 2,705,934Foreign exchanges (Note 16) 2 4 13 25Other liabilities (Notes 17, 19 and 28) 442,208 574,086 452,587 3,974,906Reserve for bonuses payable 4,804 5,258 9,098 43,187Reserve for retirement benefits 5,062 20,463 5,856 45,507Reserve for loss on disposition of premises and equipment 77 159 450 692Reserve for loss on sale of bonds 2,022 — 1,248 18,178Consolidation goodwill 939 — — 8,445Acceptances and guarantees (Notes 18 and 19) 44,923 87,785 50,544 403,804
Total liabilities 5,807,483 7,045,847 6,026,968 52,202,100
Minority interests in subsidiaries 144 2 166 1,297
Shareholders’ equity:Capital stock (Note 20):
Common stock 180,853 180,853 180,853 1,625,652Preferred stock 270,443 270,443 270,443 2,430,950
Capital surplus (Note 20) 18,558 18,558 18,558 166,817Retained earnings (Note 30) 221,815 168,101 194,666 1,993,849Net unrealized gain on securities available-for-sale, net of taxes 6,621 12,488 13,243 59,520Foreign currency translation adjustments 2,925 2,948 2,071 26,293Treasury stock, at cost (Note 20) (0) (0) (0) (0)
Total shareholders’ equity 701,217 653,393 679,837 6,303,081
Total liabilities, minority interests in subsidiaries and shareholders’ equity ¥6,508,845 ¥7,699,243 ¥6,706,971 $58,506,478
See accompanying Notes to Consolidated Interim Financial Statements.
Consolidated Interim Balance Sheets (Unaudited)Shinsei Bank, Limited and Consolidated SubsidiariesSeptember 30, 2003 and 2002, and March 31, 2003
Consolidated Interim Balance Sheets (Unaudited)
ShinseiIR/P1-P20/03年-1 04.3.21, 1:39 PMPage 18 Adobe PageMaker 6.0J/PPC
19
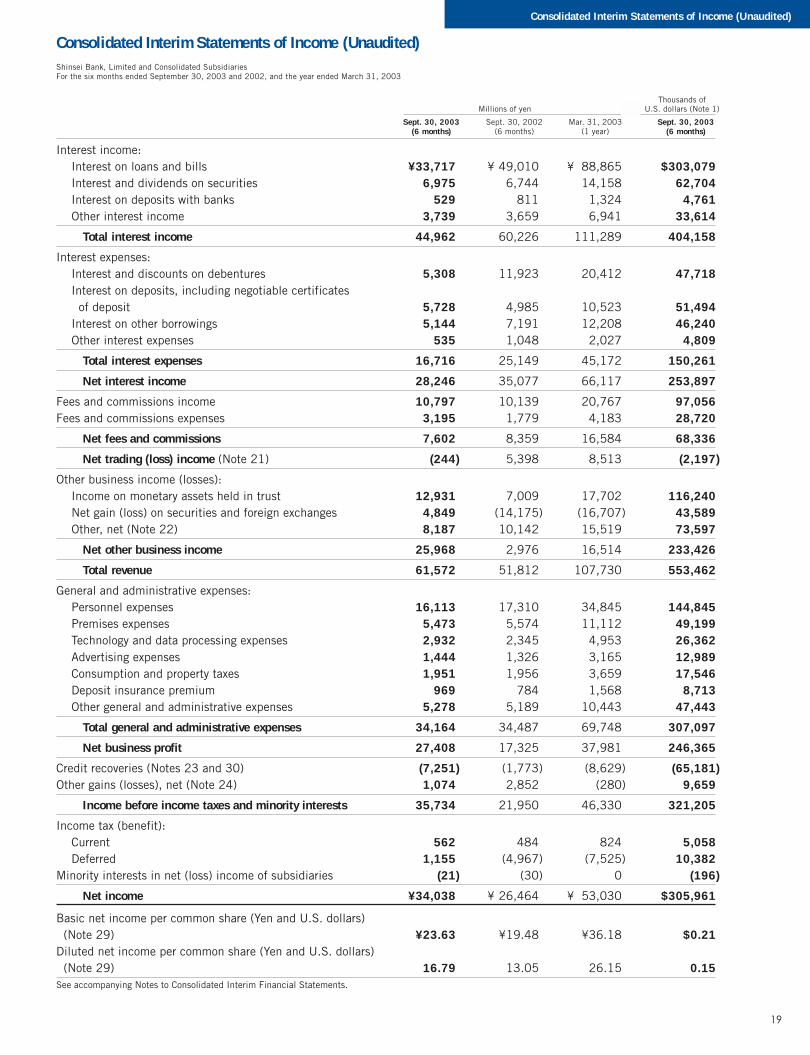
Thousands ofMillions of yen U.S. dollars (Note 1)
Sept. 30, 2003 Sept. 30, 2002 Mar. 31, 2003 Sept. 30, 2003(6 months) (6 months) (1 year) (6 months)
Interest income:Interest on loans and bills ¥33,717 ¥(49,010 ¥088,865 $303,079Interest and dividends on securities 6,975 6,744 14,158 62,704Interest on deposits with banks 529 811 1,324 4,761Other interest income 3,739 3,659 6,941 33,614
Total interest income 44,962 60,226 111,289 404,158
Interest expenses:Interest and discounts on debentures 5,308 11,923 20,412 47,718Interest on deposits, including negotiable certificates of deposit 5,728 4,985 10,523 51,494Interest on other borrowings 5,144 7,191 12,208 46,240Other interest expenses 535 1,048 2,027 4,809
Total interest expenses 16,716 25,149 45,172 150,261
Net interest income 28,246 35,077 66,117 253,897
Fees and commissions income 10,797 10,139 20,767 97,056Fees and commissions expenses 3,195 1,779 4,183 28,720
Net fees and commissions 7,602 8,359 16,584 68,336
Net trading (loss) income (Note 21) (244) 5,398 8,513 (2,197)
Other business income (losses):Income on monetary assets held in trust 12,931 7,009 17,702 116,240Net gain (loss) on securities and foreign exchanges 4,849 (14,175) (16,707) 43,589Other, net (Note 22) 8,187 10,142 15,519 73,597
Net other business income 25,968 2,976 16,514 233,426
Total revenue 61,572 51,812 107,730 553,462
General and administrative expenses:Personnel expenses 16,113 17,310 34,845 144,845Premises expenses 5,473 5,574 11,112 49,199Technology and data processing expenses 2,932 2,345 4,953 26,362Advertising expenses 1,444 1,326 3,165 12,989Consumption and property taxes 1,951 1,956 3,659 17,546Deposit insurance premium 969 784 1,568 8,713Other general and administrative expenses 5,278 5,189 10,443 47,443
Total general and administrative expenses 34,164 34,487 69,748 307,097
Net business profit 27,408 17,325 37,981 246,365
Credit recoveries (Notes 23 and 30) (7,251) (1,773) (8,629) (65,181)Other gains (losses), net (Note 24) 1,074 2,852 (280) 9,659
Income before income taxes and minority interests 35,734 21,950 46,330 321,205
Income tax (benefit):Current 562 484 824 5,058Deferred 1,155 (4,967) (7,525) 10,382
Minority interests in net (loss) income of subsidiaries (21) (30) 0 (196)
Net income ¥34,038 ¥(26,464 ¥053,030 $305,961
Basic net income per common share (Yen and U.S. dollars) (Note 29) ¥23.63. ¥19.48. ¥36.18. $0.21.Diluted net income per common share (Yen and U.S. dollars) (Note 29) 16.79. 13.05. 26.15. 0.15.See accompanying Notes to Consolidated Interim Financial Statements.
Consolidated Interim Statements of Income (Unaudited)Shinsei Bank, Limited and Consolidated SubsidiariesFor the six months ended September 30, 2003 and 2002, and the year ended March 31, 2003
Consolidated Interim Statements of Income (Unaudited)
ShinseiIR/P1-P20/03年-1 04.3.21, 1:39 PMPage 19 Adobe PageMaker 6.0J/PPC

20
Thousands ofMillions of yen U.S. dollars (Note 1)
Sept. 30, 2003 Sept. 30, 2002 Mar. 31, 2003 Sept. 30, 2003(6 months) (6 months) (1 year) (6 months)
Common stock:
Balance at beginning of period ¥180,853 ¥180,853 ¥180,853 $1,625,652
Balance at end of period 180,853 180,853 180,853 1,625,652
Preferred stock:
Balance at beginning of period 270,443 270,443 270,443 2,430,950
Balance at end of period 270,443 270,443 270,443 2,430,950
Capital surplus:
Balance at beginning of period 18,558 18,558 18,558 166,817
Balance at end of period 18,558 18,558 18,558 166,817
Retained earnings:
Balance at beginning of period 194,666 145,094 145,094 1,749,810
Dividends paid (6,888) (3,457) (3,457) (61,922)
Net income 34,038 26,464 53,030 305,961
Balance at end of period 221,815 168,101 194,666 1,993,849
Net unrealized gain on securities available-for-sale, net of taxes:
Balance at beginning of period 13,243 5,790 5,790 119,046
Net change during the period (6,622) 6,697 7,453 (59,526)
Balance at end of period 6,621 12,488 13,243 59,520
Foreign currency translation adjustments:
Balance at beginning of period 2,071 2,794 2,794 18,624
Net change during the period 853 154 (722) 7,669
Balance at end of period 2,925 2,948 2,071 26,293
Treasury stock, at cost:
Balance at beginning of period (0) (0) (0) (0)
Balance at end of period (0) (0) (0) (0)
Total ¥701,217 ¥653,393 ¥679,837 $6,303,081
See accompanying Notes to Consolidated Interim Financial Statements.
Consolidated Interim Statements of Shareholders’ Equity (Unaudited)Shinsei Bank, Limited and Consolidated SubsidiariesFor the six months ended September 30, 2003 and 2002, and the year ended March 31, 2003
Consolidated Interim Statements of Shareholders’ Equity (Unaudited)
ShinseiIR/P1-P20/03年-1 04.3.21, 1:39 PMPage 20 Adobe PageMaker 6.0J/PPC

21
Thousands ofMillions of yen U.S. dollars (Note 1)
Sept. 30, 2003 Sept. 30, 2002 Mar. 31, 2003 Sept. 30, 2003(6 months) (6 months) (1 year) (6 months)
Cash flows from operating activities:Income before income taxes and minority interests ¥(035,734 ¥(0,021,950 ¥(0,046,330 $(0,321,205Depreciation 1,568 1,467 3,183 14,099Net change in reserve for credit losses (24,427) (47,395) (153,462) (219,577)Net change in other reserves (4,759) (5,522) (14,749) (42,786)Interest income (44,962) (60,226) (111,289) (404,158)Interest expenses 16,716 25,398 45,172 150,261Investment (gains) losses (10,919) 8,277 10,123 (98,155)Net exchange loss 15,884 33,987 40,579 142,784Net change in trading assets (236,779) 10,083 81,806 (2,128,359)Net change in trading liabilities (404) 9,126 (56,083) (3,640)Net change in loans and bills discounted 220,782 913,140 1,292,884 1,984,561Net change in deposits, including negotiable certificates of deposit 80,804 372,336 316,158 726,332Net change in debentures (other than subordinated bonds) (476,732) (580,905) (846,846) (4,285,233)Net change in borrowed money (other than subordinated debt) (249) 6,465 777 (2,241)Net change in deposits with banks 20,514 25,576 98,744 184,397Net change in call loans, other monetary claims purchased and collateral related to securities borrowing transactions 5,962 145,102 286,356 53,598Net change in call money, commercial paper, payables under repurchase agreements and collateral related to securities lending transactions 236,506 2,979 (350,795) 2,125,902Net change in foreign exchange assets (409) 140,626 138,977 (3,684)Net change in foreign exchange liabilities (10) (61) (52) (93)Interest received 52,864 59,570 116,751 475,187Interest paid (19,492) (31,715) (56,140) (175,210)Net change in securities for trading purposes (17,171) — (34,283) (154,351)Net change in monetary assets held in trust for trading purposes (132,058) (126,349) (75,972) (1,187,039)Other, net 47,793 (41,398) (387,310) 429,601
Subtotal (233,246) 882,513 390,858 (2,096,599)Income taxes paid (823) (352) (449) (7,406)
Net cash (used in) provided by operating activities (234,070) 882,161 390,408 (2,104,005)
Cash flows from investing activities:Purchase of investments (970,837) (1,988,659) (3,369,105) (8,726,630)Proceeds from sales of investments 374,215 204,523 1,057,382 3,363,732Proceeds from maturity of investments 841,245 908,704 2,080,080 7,561,754Purchase of premises and equipment (3,254) (6,779) (9,515) (29,250)Proceeds from sales of premises and equipment 763 597 1,744 6,862Net payment for acquisition of new subsidiaries and affiliates (22) (5) (3,158) (198)
Net cash provided by (used in) investing activities 242,110 (881,618) (242,571) 2,176,270
Cash flows from financing activities:Repayment of subordinated debt (38,000) (23,000) (117,600) (341,573)Payment for redemption of subordinated bonds (50) (11,452) (19,398) (449)Dividends paid (6,888) (3,457) (3,457) (61,922)
Net cash used in financing activities (44,938) (37,910) (140,456) (403,944)
Net change in cash and cash equivalents (36,899) (37,367) 7,380 (331,679)Cash and cash equivalents at beginning of period 138,991 131,610 131,610 1,249,364
Cash and cash equivalents at end of period (Note 3) ¥(102,092 ¥(0,094,243 ¥(1,138,991 $(0,917,685See accompanying Notes to Consolidated Interim Financial Statements.Note: Investments consist of securities and monetary assets held in trust for other than trading purposes.
Consolidated Interim Statements of Cash Flows (Unaudited)Shinsei Bank, Limited and Consolidated SubsidiariesFor the six months ended September 30, 2003 and 2002, and the year ended March 31, 2003
Consolidated Interim Statements of Cash Flows (Unaudited)
ShinseiIR/P1-P20/03年-1 04.3.21, 1:39 PMPage 21 Adobe PageMaker 6.0J/PPC

22
1. Basis of PresentationThe accompanying consolidated interim financial statements of ShinseiBank, Limited (the “Bank”) and its subsidiaries (collectively, the“Group”), stated in Japanese yen, are prepared on the basis of accountingprinciples and practices generally accepted in Japan and in conformitywith the Banking Law of Japan, and compiled from the consolidatedinterim financial statements prepared under the provisions set forth in theAccounting Standards for Consolidated Interim Financial Statements (theBusiness Accounting Deliberation Council, March 13, 1998) and thestandards of the Securities and Exchange Law of Japan, which are differ-ent in certain respects as to application and disclosure requirements ofInternational Financial Reporting Standards. Accordingly, the accompany-ing consolidated interim financial statements are not intended to presentthe consolidated financial position, results of operations and cash flows inaccordance with accounting principles and practices generally acceptedin countries and jurisdictions other than Japan.
Certain reclassifications and rearrangements have been made topresent the accompanying consolidated interim financial statements in aform that is familiar to readers outside Japan. In addition, the accompa-nying notes include information that is not required under accountingprinciples and practices generally accepted in Japan, but is presentedherein as additional information.
The preparation of consolidated interim financial statements in confor-mity with generally accepted accounting principles requires managementto make estimates and assumptions that affect the reported amounts ofassets and liabilities and disclosures of contingent assets and liabilities atthe date of the consolidated interim financial statements and the reportedamounts of revenues and expenses during the reporting period. Actualresults could differ from those estimates.
As permitted by the Securities and Exchange Law of Japan, amountsless than one million yen have been omitted. As a result, the totals do notnecessarily agree with the sum of the individual amounts.
Yen amounts, other than per share amounts, have been rounded downto millions of yen. All U.S. dollar amounts, presented solely for the read-ers’ convenience, are translated at ¥111.25=U.S.$1.00, the rate ofexchange prevailing on the Tokyo Foreign Exchange Market onSeptember 30, 2003.
The inclusion of such dollar amounts is solely for convenience and isnot intended to imply that yen amounts have been or could have beenconverted, realized or settled in dollars at that or at any other rate.
The Bank was placed under temporary nationalization by the primeminister of Japan on October 23, 1998, under Section 1 of Article 36 ofthe Financial Revitalization Law, and continued its operations in accor-dance with Articles 47 and 48 of the same law. The Bank’s temporarynationalization status was terminated on March 1, 2000, when all com-mon shares of the Bank held by the Deposit Insurance Corporation ofJapan (the ‘’DIC’’) were transferred to New LTCB Partners C.V. in accor-dance with the Share Purchase Agreement dated February 9, 2000 (the“Share Purchase Agreement”).
2. Summary of Significant Accounting Policies(a) Principles of ConsolidationThe Group applied its consolidation scope using the control and influenceconcept. Under the control and influence concept, those companies inwhich the Bank, directly or indirectly, is able to exercise control overoperations are to be fully consolidated and those companies in which theBank, directly or indirectly, is able to exercise significant influence overoperations are to be accounted for by the equity method.
The number of subsidiaries and affiliates as of September 30, 2003and 2002 was as follows:
As of September 30,
2003 2002
Consolidated subsidiaries 40 27Unconsolidated subsidiary — 1Affiliates accounted for using the equity method 4 2
Major subsidiaries for the six months ended September 30, 2003 wereas listed below:
PercentageName Location ownership
Shinsei Trust & Banking Co., Ltd. Japan 100%Shinsei Securities Co., Ltd. Japan 100%Shinsei Investment Management Co., Ltd. Japan 100%Shinsei Bank Finance N.V. Netherlands 100%Shinsei Capital (USA), Ltd. USA 100%
All significant intercompany transactions, account balances and unreal-ized profits and losses have been eliminated in consolidation. As of Sep-tember 30, 2003, the six-month period ending dates are September 30for 31 subsidiaries, July 31 for 3 subsidiaries and June 30 for 6 subsid-iaries, of which one subsidiary is consolidated using its September 30financial statements and the other subsidiaries are consolidated using the
July 31 and the June 30 financial statements with appropriate adjust-ments made for significant transactions during the period from the endingdates of the six-month periods to the date of the interim consolidatedfinancial statements.
Any differences between the cost of an investment in subsidiaries andthe Bank’s share of the underlying equity in the net assets of the subsid-iaries are amortized within 20 years when incurred or charged to incomein the fiscal year incurred as long as such differences are considered tobe immaterial.
(b) Translation of Foreign Currency Financial Statements and TransactionsThe financial statements of foreign subsidiaries are translated into Japa-nese yen at exchange rates as of the balance sheet date, except for share-holders’ equity, which is translated at the historical exchange rates.Differences arising from such translation are shown as foreign currencytranslation adjustments as a separate component of shareholders’ equityin the accompanying consolidated interim balance sheets.
(i) Foreign currency-denominated assets and liabilities and theaccounts of overseas branches are translated into Japanese yen atthe exchange rates prevailing at the balance sheet date, except forinvestments in affiliates which are translated at the relevanthistorical exchange rates.
(ii) Foreign currency accounts held by foreign subsidiaries aretranslated into the currency of the subsidiary at the respectiveperiod-end exchange rates.
(c) Other Monetary Claims PurchasedComponents of other monetary claims purchased are principally loansheld for trading purposes. Loans held for trading purposes are recorded atestimated fair value and unrealized gains and losses are recorded in otherbusiness income (losses).
(d) Valuation of Trading Account ActivitiesTrading account positions entered into to generate gains arising fromshort-term changes in interest rates, currency exchange rates or marketprices of securities and other market-related indices, or from pricedifferences among markets, are included in trading assets and tradingliabilities on a trade date basis.
Trading securities and monetary claims purchased for trading purposesare stated at market value and derivative financial instruments related totrading positions are stated at the estimated amounts that would besettled if such positions were terminated at the end of the period, whichreflects liquidation and credit risks.
Trading revenue and trading expenses include interest received andpaid, the amount of increases/decreases in valuation gains/losses on thebalance sheet date for securities and monetary claims, and the netchange in valuation gains/losses during the period using the estimatedsettlement prices assuming settlement in cash on the balance sheet datefor derivatives.
(e) Monetary Assets Held in TrustThe components of trust assets are accounted for based on the standardappropriate for each asset type. Instruments held in trust for tradingpurposes are recorded at fair value and unrealized gains and losses arerecorded in other business income (losses). Instruments held in trust clas-sified as available-for-sale are recorded at fair value with the correspond-ing unrealized gains/losses recorded directly in a separate component ofshareholders’ equity. Instruments held in trust classified as held tomaturity are carried at amortized cost.
(f) SecuritiesSecurities other than investments in affiliates are classified into threecategories, based principally on the Bank’s intent, as follows:
Trading securities are securities held in anticipation of gains arisingfrom short-term changes in market value and/or held for resale for cus-tomers. Trading securities are carried at fair value with correspondingunrealized gains/losses recorded in income.
Securities being held to maturity are debt securities for which theGroup has positive intent and ability to hold until maturity. Securitiesbeing held to maturity are carried at amortized cost.
Securities available-for-sale are securities other than trading securitiesand securities being held to maturity. Securities available-for-sale are car-ried at fair value with the corresponding unrealized gains/losses recordeddirectly in a separate component of shareholders’ equity. Cost of sale ofthese securities is determined by the moving average method. Securitiesavailable-for-sale for which fair value is not readily determinable are car-ried at moving average cost or amortized cost determined by the movingaverage method.
Individual debt and equity securities are written down when a declinein fair value below the cost of such securities is deemed to be other thantemporary.
(g) Depreciation MethodPremises and equipment are stated at cost less accumulateddepreciation.
Notes to Consolidated Interim Financial Statements (Unaudited)
Notes to Consolidated Interim Financial Statements (Unaudited)
ShinseiIR/P1-P20/03年-1 04.3.21, 1:39 PMPage 22 Adobe PageMaker 6.0J/PPC

23
Depreciation of premises and equipment owned by the Group is com-puted principally using the straight-line method for premises and thedeclining-balance method for equipment over the estimated useful livesof the relevant assets. As for the depreciation expenses of premises andequipment under the declining-balance method for the six-month periods,the Group records estimated amounts of depreciation expensesattributable to the periods.
Capitalized software for internal use is depreciated using the straight-line method based on the Group’s estimated useful lives (mainly fiveyears). Capitalized software for internal use is included in other assets.
The estimated useful lives at September 30, 2003 were principally asfollows:
Buildings .................... 6 years to 50 yearsEquipment .................. 4 years to 15 years
(h) Accounting for Lease TransactionsUnder Japanese accounting standards for leases, finance leases where theownership of the property is deemed to transfer to the lessee are capital-ized, while other finance leases can be accounted for as operating leasesif the required information is disclosed in the notes to the consolidatedinterim financial statements. All leases by entered into the Bank and itsdomestic subsidiaries have been accounted for as operating leases.
(i) Deferred ChargesDeferred charges are amortized as follows.
Discounts on discount debentures are amortized by the straight-linemethod over the terms of the debentures.
Debenture issuance costs are amortized by the straight-line methodover the shorter of the terms of the debentures or the maximum three-yearperiod stipulated in the Japanese Commercial Code (the “Code”) and itsregulations.
Subsidiaries’ deferred charges on the issuance of debentures are amor-tized by the straight-line method over the terms of the debentures.
Formation costs of subsidiaries have been expensed in the periodincurred.
(j) Reserve for Credit LossesThe reserve for loan losses of the Bank and the domestic trust and bank-ing subsidiary has been established as detailed below based on the Bank’sinternal rules for establishing the reserve.
Under “Warranty of Loan-Related Assets” described in the SharePurchase Agreement, a precondition of exercise of the cancellation rightis the existence of a defect and a 20% reduction in value. To estimate thereserve amount, the precondition of exercise of the cancellation right hasbeen taken into account. Where management reaches conclusions as tothe exercise of the cancellation right are reached after the applicationdeadline for exercising the cancellation right under the “Warranty” clause,adjustments are made to reserve for credit losses in the fiscal period inwhich such events occur.
For claims to obligors who are legally bankrupt (due to bankruptcy, spe-cial liquidation, etc.) or virtually bankrupt, a specific reserve is providedbased on the amount of claims, after the charge-off stated below, net ofamounts expected to be collected through the disposal of collateral orexecution of guarantees.
For claims to obligors who are possibly bankrupt, the specific reserve isprovided for the amount considered to be necessary based on an overallsolvency assessment performed for the amount of claims net of amountsexpected to be collected through the disposal of collateral or execution ofguarantees.
Effective March 31, 2003, the Bank applied the “discounted cash flowmethod” (hereinafter referred to as the “DCF method”) in calculating theloan loss reserve amounts for most of the claims against obligors catego-rized as possibly bankrupt or substandard under the self-assessmentguidelines. Under the DCF method, the loan loss reserve is determined asthe difference between (a) relevant estimated cash flows discounted bythe original contractual interest rate and (b) book value of the claim. Incases where it is difficult to reasonably estimate future cash flow, theBank sets aside as reserves the product of the estimated loss ratios on theclaims and either (a) the balance of the claims, in the case of claimsagainst substandard obligors, or (b) the unsecured, unguaranteed portionof the claims, in the case of claims against possibly bankrupt obligors.
For other claims, the Bank provides a general reserve based onhistorical loan loss experience.
For specific foreign claims, there is a reserve for loans to restructuringcountries which has been established based on losses estimated byconsidering the political and economic conditions in those countries.
All claims are assessed by business divisions and branches based onthe Bank’s internal rules for the self-assessment of asset quality. TheCredit Assessment Division, which is independent from business divisionsand branches, conducts audits of these assessments, and the reserve isprovided based on the audit results.
For collateralized or guaranteed claims to obligors who are legally bank-rupt or virtually bankrupt, the amount of claims exceeding the estimatedvalue of collateral or guarantees, which is deemed uncollectible, hasbeen charged off as of March 31, 2003, and totals ¥9,956 million
(U.S.$89,496 thousand) as of September 30, 2003.The reserve for other credit losses primarily consists of reserves on
amounts, included in accounts receivable, that the Bank believes the DICis obligated to reimburse to it regarding claims that the Bank has alreadywritten off due to the bankruptcy of the obligors, but the return of whichthe DIC has not yet accepted, as well as a reserve taken on the Bank’scontribution to an industry-wide fund set up to purchase and collectloans.
The subsidiaries other than the domestic trust and banking subsidiarycalculate the general reserve for “normal” and “caution, including sub-standard” categories based on the specific actual past loss ratio, and thespecific reserve for the “possibly bankrupt” “virtually bankrupt” and“legally bankrupt” categories based on estimated losses, considering therecoverable value.
(k) Derivatives and Hedge AccountingDerivatives are stated at fair value. Derivative transactions that meet thehedge accounting criteria are accounted for under a deferral methodwhereby unrealized gains and losses are deferred as assets or liabilitiesuntil the profits and losses on the hedged items are realized.
(i) Hedge of interest rate risksIn previous periods, the Bank principally applied a “macro hedge” forinterest rate derivatives used to manage interest rate risks and its ALMactivities based on the transitional treatment prescribed in IndustryAudit Committee Report No. 24 issued by the Japanese Institute ofCertified Public Accountants (the “JICPA”). The effectiveness of themacro hedge was reviewed for a reduction in interest rate risk exposureand the actual risk amount of derivatives within the preapproved limitunder the Bank’s risk control policies. Effective April 1, 2003, theBank has adopted portfolio hedging in accordance with Report No. 24.Under portfolio hedging, a portfolio of hedged items such as depositsor loans with common maturities matched with a group of hedginginstruments such as interest rate swaps, which offset effect of fairvalue fluctuations of the hedged items by identified maturities, aredesignated as a hedge of the portfolio. The effectiveness of theportfolio hedge is accessed by each group.
Deferred hedge losses and deferred hedge gains recorded on thebalance sheet as of March 31, 2003 as a result of the macro hedgeaccounting are to be amortized as expenses or income over the remain-ing lives of the hedging instruments. The unamortized balance ofdeferred hedge losses and deferred hedge gains attributable to macro-hedge accounting as of September 30, 2003 were ¥6,274 million(U.S.$56,397 thousand) and ¥1,141 million (U.S.$10,257 thousand),respectively.
(ii) Hedge of foreign exchange fluctuation risksPrior to April 1, 2003, the Bank accounted for fund swap and certaincurrency swap transactions on an accrual basis by applying the one-year transitional treatment provided in Industry Audit CommitteeReport No. 25 of the JICPA. Fund swap transactions are foreignexchange swaps, and consist of spot foreign exchange either bought orsold and forward foreign exchange either sold or bought. Such transac-tions are contracted for the purpose of lending or borrowing in a differ-ent currency. Fund swap transactions are used to convert the principalequivalent amount into spot foreign exchange bought or sold withregard to the corresponding fund borrowing or lending. Such transac-tions convert the corresponding principal equivalents and foreign cur-rency equivalents to pay and receive, whose amounts and due dates arepredetermined at the time of the transactions, into forward foreignexchange either bought or sold.
Effective April 1, 2003, these swap transactions are accounted forusing deferral hedge accounting by fully applying Industry Audit Com-mittee Report No. 25. Under deferral hedge accounting, hedged itemsare identified by grouping the foreign-currency denominated financialassets and liabilities by currencies and designating derivative transac-tions such as currency swap transactions and forward exchange con-tracts as hedging instruments. Hedge effectiveness is reviewed bycomparing the total foreign currency position of the hedged items andhedging instruments by currency.
As a result of the application of this new accounting standard, otherassets decreased by ¥481 million (U.S.$4,325 thousand) and otherliabilities decreased by ¥1,437 million (U.S.$12,918 thousand) asof September 30, 2003, as compared to the previous method. Theapplication of the new accounting standard did not affect the Group’sresults of operations. Also as a result of the application of this account-ing standard, unrealized transaction gains and losses for foreign cur-rency forward transactions that were previously presented on a netbasis are now recorded on a gross basis as derivative financial instru-ments in other assets and other liabilities. This change resulted inincreases of other assets and other liabilities as of September 30,2003 of ¥5,428 million (U.S.$48,794 thousand), respectively.
The Bank also applies deferral hedge accounting and fair valuehedge accounting to translation gains or losses from foreign currencyexposures of a net investment in foreign affiliates and securities
Notes to Consolidated Interim Financial Statements (Unaudited)
ShinseiIR/P1-P20/03年-1 04.3.21, 1:39 PMPage 23 Adobe PageMaker 6.0J/PPC
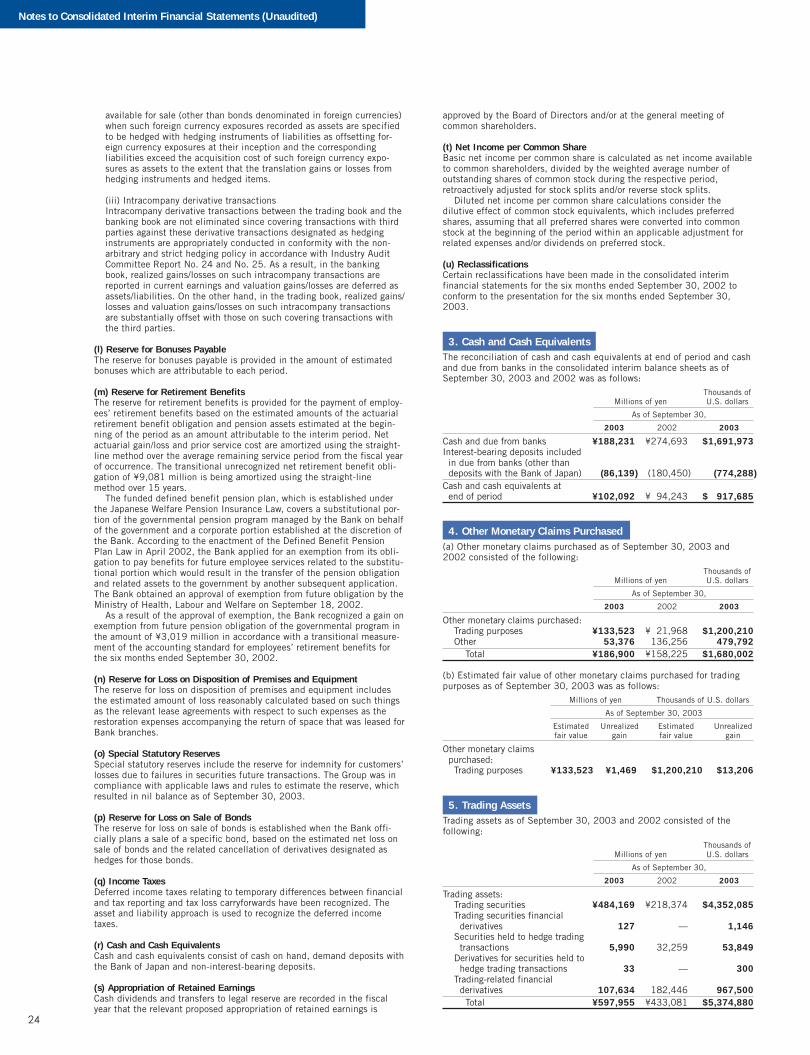
24
available for sale (other than bonds denominated in foreign currencies)when such foreign currency exposures recorded as assets are specifiedto be hedged with hedging instruments of liabilities as offsetting for-eign currency exposures at their inception and the correspondingliabilities exceed the acquisition cost of such foreign currency expo-sures as assets to the extent that the translation gains or losses fromhedging instruments and hedged items.
(iii) Intracompany derivative transactionsIntracompany derivative transactions between the trading book and thebanking book are not eliminated since covering transactions with thirdparties against these derivative transactions designated as hedginginstruments are appropriately conducted in conformity with the non-arbitrary and strict hedging policy in accordance with Industry AuditCommittee Report No. 24 and No. 25. As a result, in the bankingbook, realized gains/losses on such intracompany transactions arereported in current earnings and valuation gains/losses are deferred asassets/liabilities. On the other hand, in the trading book, realized gains/losses and valuation gains/losses on such intracompany transactionsare substantially offset with those on such covering transactions withthe third parties.
(l) Reserve for Bonuses PayableThe reserve for bonuses payable is provided in the amount of estimatedbonuses which are attributable to each period.
(m) Reserve for Retirement BenefitsThe reserve for retirement benefits is provided for the payment of employ-ees’ retirement benefits based on the estimated amounts of the actuarialretirement benefit obligation and pension assets estimated at the begin-ning of the period as an amount attributable to the interim period. Netactuarial gain/loss and prior service cost are amortized using the straight-line method over the average remaining service period from the fiscal yearof occurrence. The transitional unrecognized net retirement benefit obli-gation of ¥9,081 million is being amortized using the straight-linemethod over 15 years.
The funded defined benefit pension plan, which is established underthe Japanese Welfare Pension Insurance Law, covers a substitutional por-tion of the governmental pension program managed by the Bank on behalfof the government and a corporate portion established at the discretion ofthe Bank. According to the enactment of the Defined Benefit PensionPlan Law in April 2002, the Bank applied for an exemption from its obli-gation to pay benefits for future employee services related to the substitu-tional portion which would result in the transfer of the pension obligationand related assets to the government by another subsequent application.The Bank obtained an approval of exemption from future obligation by theMinistry of Health, Labour and Welfare on September 18, 2002.
As a result of the approval of exemption, the Bank recognized a gain onexemption from future pension obligation of the governmental program inthe amount of ¥3,019 million in accordance with a transitional measure-ment of the accounting standard for employees’ retirement benefits forthe six months ended September 30, 2002.
(n) Reserve for Loss on Disposition of Premises and EquipmentThe reserve for loss on disposition of premises and equipment includesthe estimated amount of loss reasonably calculated based on such thingsas the relevant lease agreements with respect to such expenses as therestoration expenses accompanying the return of space that was leased forBank branches.
(o) Special Statutory ReservesSpecial statutory reserves include the reserve for indemnity for customers’losses due to failures in securities future transactions. The Group was incompliance with applicable laws and rules to estimate the reserve, whichresulted in nil balance as of September 30, 2003.
(p) Reserve for Loss on Sale of BondsThe reserve for loss on sale of bonds is established when the Bank offi-cially plans a sale of a specific bond, based on the estimated net loss onsale of bonds and the related cancellation of derivatives designated ashedges for those bonds.
(q) Income TaxesDeferred income taxes relating to temporary differences between financialand tax reporting and tax loss carryforwards have been recognized. Theasset and liability approach is used to recognize the deferred incometaxes.
(r) Cash and Cash EquivalentsCash and cash equivalents consist of cash on hand, demand deposits withthe Bank of Japan and non-interest-bearing deposits.
(s) Appropriation of Retained EarningsCash dividends and transfers to legal reserve are recorded in the fiscalyear that the relevant proposed appropriation of retained earnings is
approved by the Board of Directors and/or at the general meeting ofcommon shareholders.
(t) Net Income per Common ShareBasic net income per common share is calculated as net income availableto common shareholders, divided by the weighted average number ofoutstanding shares of common stock during the respective period,retroactively adjusted for stock splits and/or reverse stock splits.
Diluted net income per common share calculations consider thedilutive effect of common stock equivalents, which includes preferredshares, assuming that all preferred shares were converted into commonstock at the beginning of the period within an applicable adjustment forrelated expenses and/or dividends on preferred stock.
(u) ReclassificationsCertain reclassifications have been made in the consolidated interimfinancial statements for the six months ended September 30, 2002 toconform to the presentation for the six months ended September 30,2003.
3. Cash and Cash EquivalentsThe reconciliation of cash and cash equivalents at end of period and cashand due from banks in the consolidated interim balance sheets as ofSeptember 30, 2003 and 2002 was as follows:
Thousands ofMillions of yen U.S. dollars
As of September 30,
2003 2002 2003
Cash and due from banks ¥188,231 ¥274,693 $1,691,973Interest-bearing deposits included in due from banks (other than deposits with the Bank of Japan) (86,139) (180,450) (774,288)Cash and cash equivalents at end of period ¥102,092 ¥094,243 $0,917,685
4. Other Monetary Claims Purchased(a) Other monetary claims purchased as of September 30, 2003 and2002 consisted of the following:
Thousands ofMillions of yen U.S. dollars
As of September 30,
2003 2002 2003
Other monetary claims purchased:Trading purposes ¥133,523 ¥021,968 $1,200,210Other 53,376 136,256 479,792
Total ¥186,900 ¥158,225 $1,680,002
(b) Estimated fair value of other monetary claims purchased for tradingpurposes as of September 30, 2003 was as follows:
Millions of yen Thousands of U.S. dollars
As of September 30, 2003
Estimated Unrealized Estimated Unrealizedfair value gain fair value gain
Other monetary claims purchased:
Trading purposes ¥133,523 ¥1,469 $1,200,210 $13,206
5. Trading AssetsTrading assets as of September 30, 2003 and 2002 consisted of thefollowing:
Thousands ofMillions of yen U.S. dollars
As of September 30,
2003 2002 2003
Trading assets:Trading securities ¥484,169 ¥218,374 $4,352,085Trading securities financial derivatives 127 — 1,146Securities held to hedge trading transactions 5,990 32,259 53,849Derivatives for securities held to hedge trading transactions 33 — 300Trading-related financial derivatives 107,634 182,446 967,500
Total ¥597,955 ¥433,081 $5,374,880
Notes to Consolidated Interim Financial Statements (Unaudited)
ShinseiIR/P1-P20/03年-1 04.3.21, 1:39 PMPage 24 Adobe PageMaker 6.0J/PPC

25
6. Monetary Assets Held in Trust(a) Monetary assets held in trust as of September 30, 2003 and 2002 consisted of the following:
Thousands ofMillions of yen U.S. dollars
As of September 30,
2003 2002 2003
Monetary assets held in trust:Trading purposes ¥295,863 ¥214,182 $2,659,446Other 9,328 3,885 83,852
Total ¥305,191 ¥218,067 $2,743,298
(b) Estimated fair value of monetary assets held in trust for trading purposes as of September 30, 2003 and 2002 was as follows:Millions of yen Thousands of U.S. dollars
As of September 30,
2003 2002 2003
Estimated Unrealized Estimated Unrealized Estimated Unrealizedfair value gain fair value loss fair value gain
Monetary assets held in trust:Trading purposes ¥295,863 ¥1,236 ¥214,182 ¥(1,161) $2,659,446 $11,118
(c) Acquisition cost and book value of other monetary assets held in trust as of September 30, 2003 and 2002 were as follows:Millions of yen
As of September 30, 2003 As of September 30, 2002
Gross Gross Gross GrossAcquisition unrealized unrealized Book Acquisition unrealized unrealized Book
cost gain loss value cost gain loss value
Monetary assets held in trust:Other ¥9,328 ¥0,0—. ¥0,0—. ¥9,328 ¥3,885 ¥0,—. ¥0,—. ¥3,885
Thousands of U.S. dollars
As of September 30, 2003
Gross GrossAcquisition unrealized unrealized Book
cost gain loss value
Monetary assets held in trust:Other $83,852 $00,0—. $00,0—. $83,852
7. SecuritiesSecurities as of September 30, 2003 and 2002 consisted of the following:
Thousands ofMillions of yen U.S. dollars
As of September 30,
2003 2002 2003
Securities:Trading securities ¥0,079,519 ¥0,012,950 $00,714,779Securities being held to maturity 20 20 183Securities available-for-sale:
Marketable securities, at estimated fair value 1,350,855 2,175,089 12,142,521Securities whose fair value is not readily determinable, at amortized cost 86,421 57,145 776,822
Equity of affiliates, using the equity method 3,528 883 31,720Total ¥1,520,345 ¥2,246,089 $13,666,025
Amortized cost and the estimated fair value of marketable securities (other than trading securities) as of September 30, 2003 and 2002 were as follows:Millions of yen
As of September 30, 2003
Gross GrossAmortized unrealized unrealized Estimated
cost gain loss fair value
Securities being held to maturity (Japanese national government bonds only) ¥0,000,020 ¥00,001 ¥000—. ¥0,000,021Securities available-for-sale:
Equity securities ¥0,001,450 ¥00,226 ¥0,049 ¥0,001,627Japanese national government bonds 1,049,613 594 4,951 1,045,256Japanese local government bonds 47,689 0 55 47,633Japanese corporate bonds 50,678 152 232 50,598Other 189,957 18,712 3,243 205,739
Total securities available-for-sale ¥1,339,389 ¥19,685 ¥8,532 ¥1,350,855
Notes to Consolidated Interim Financial Statements (Unaudited)
ShinseiIR/P1-P20/03年-1 04.3.21, 1:39 PMPage 25 Adobe PageMaker 6.0J/PPC

26
Millions of yen
As of September 30, 2002
Gross GrossAmortized unrealized unrealized Estimated
cost gain loss fair value
Securities being held to maturity (Japanese national government bonds only) ¥0,000,020 ¥00,001 ¥0000—. ¥0,000,022Securities available-for-sale:
Equity securities ¥0,008,514 ¥00,078 ¥00,531 ¥0,008,060Japanese national government bonds 1,733,483 9,770 228 1,743,025Japanese local government bonds 31 0 — 31Japanese corporate bonds 25,221 289 142 25,368Other 386,425 27,357 15,179 398,603
Total securities available-for-sale ¥2,153,676 ¥37,495 ¥16,082 ¥2,175,089
Gross unrealized losses as of September 30, 2002, as presented above, include the valuation losses related to certain securities with embeddedderivatives, which are carried at ¥110 million and for which the losses have been recorded in other business income (losses).
Thousands of U.S. dollars
As of September 30, 2003
Gross GrossAmortized unrealized unrealized Estimated
cost gain loss fair value
Securities being held to maturity (Japanese national government bonds only) $00,000,183 $000,011 $0000—. $00,000,194Securities available-for-sale:
Equity securities $00,013,040 $002,037 $00,448 $00,014,628Japanese national government bonds 9,434,725 5,344 44,507 9,395,562Japanese local government bonds 428,667 0 499 428,168Japanese corporate bonds 455,540 1,369 2,094 454,816Other 1,707,480 168,199 29,152 1,849,347
Total securities available-for-sale $12,039,452 $176,949 $76,700 $12,142,521
Gross unrealized gains as of September 30, 2003, as presented above, do not include the valuation gains related to certain securities with embeddedderivatives, which are carried at ¥313 million (U.S.$2,820 thousand) and for which the gains have been recorded in other business income (losses).
Securities available-for-sale sold during the six months ended September 30, 2003 and 2002 were as follows:Millions of yen
Six months ended September 30, 2003 Six months ended September 30, 2002
Total Total Total Totalamount of amount of amount of amount of
Proceeds gains on losses on Proceeds gains on losses onfrom sales sales sales from sales sales sales
Securities available-for-sale ¥373,584 ¥3,018 ¥1,321 ¥202,740 ¥4,233 ¥155
Thousands of U.S. dollars
Six months ended September 30, 2003
Total Totalamount of amount of
Proceeds gains on losses onfrom sales sales sales
Securities available-for-sale $3,358,059 $27,134 $11,882
In addition to the above, profit and loss resulting from the cancellation of derivative instruments used to hedge these investments was recorded in otherbusiness income (losses) for the six months ended September 30, 2003 and 2002.
Amortized cost of securities available-for-sale whose fair value is not readily determinable as of September 30, 2003 and 2002 was as follows:Thousands of
Millions of yen U.S. dollars
As of September 30,
2003 2002 2003
Equity securities ¥02,264 ¥02,019 $020,357Japanese corporate bonds 72,323 41,642 650,095Foreign securities 11,766 12,280 105,769Other 66 1,202 601
Total ¥86,421 ¥57,145 $776,822
Redemption schedules for held-to-maturity and available-for-sale debt securities as of September 30, 2003 and 2002 were as follows:Millions of yen
As of September 30, 2003
1 year Over 1 year Over 5 years Over or less to 5 years to 10 years 10 years
Bonds:Japanese national government bonds ¥484,122 ¥500,720 ¥060,434 ¥000—.Japanese local government bonds 47,624 0 13 —Japanese corporate bonds 43,094 54,402 25,381 39
Subtotal 574,840 555,122 85,828 39Other 9,576 75,463 107,058 3,497
Total ¥584,417 ¥630,586 ¥192,886 ¥3,537
Notes to Consolidated Interim Financial Statements (Unaudited)
ShinseiIR/P1-P20/03年-1 04.3.21, 1:39 PMPage 26 Adobe PageMaker 6.0J/PPC

27
Millions of yen
As of September 30, 2002
1 year Over 1 year Over 5 years Over or less to 5 years to 10 years 10 years
Bonds:Japanese national government bonds ¥1,090,438 ¥347,324 ¥305,262 ¥0000—.Japanese local government bonds 21 — 13 —Japanese corporate bonds 9,930 30,190 26,848 40
Subtotal 1,100,390 377,515 332,125 40Other 10,182 144,805 232,829 19,943
Total ¥1,110,573 ¥522,320 ¥564,955 ¥19,984
Thousands of U.S. dollars
As of September 30, 2003
1 year Over 1 year Over 5 years Over or less to 5 years to 10 years 10 years
Bonds:Japanese national government bonds $4,351,663 $4,500,855 $0,543,227 $0000—.Japanese local government bonds 428,081 5 118 —Japanese corporate bonds 387,364 489,009 228,146 356
Subtotal 5,167,108 4,989,869 771,491 356Other 86,083 678,324 962,321 31,442
Total $5,253,191 $5,668,193 $1,733,812 $31,798
8. Loans and Bills DiscountedLoans and bills discounted as of September 30, 2003 and 2002 consisted of the following:
Thousands ofMillions of yen U.S. dollars
As of September 30,
2003 2002 2003
Loans and bills discounted:Loans on deeds ¥2,438,111 ¥2,587,164 $21,915,612Loans on bills 400,688 871,089 3,601,697Bills discounted 868 971 7,803Overdrafts 437,697 424,188 3,934,359Other 52 108 471
Total ¥3,277,418 ¥3,883,522 $29,459,942
(a) Loans and bills discounted include loans to bankrupt obligors totaling ¥10,457 million (U.S.$94,004 thousand) and ¥196,531 million as ofSeptember 30, 2003 and 2002, respectively, as well as non-accrual delinquent loans totaling ¥96,699 million (U.S.$869,209 thousand) and ¥366,935million as of September 30, 2003 and 2002, respectively.
Non-accrual delinquent loans include loans classified as “possibly bankrupt” and “virtually bankrupt” under the Bank’s self-assessment guidelines.In addition to non-accrual delinquent loans as defined, certain other loans classified as “substandard” under the Bank’s self-assessment guidelines
include past due loans (three months or more).Past due loans (three months or more) consist of loans for which the principal and/or interest is three months or more past due but exclude loans to
bankrupt obligors and non-accrual delinquent loans. The balances of past due loans (three months or more) as of September 30, 2003 and 2002 were¥21,697 million (U.S.$195,036 thousand) and ¥127,140 million, respectively.
Restructured loans are loans where the Group relaxes lending conditions, such as by reducing the original interest rate, or by forbearing interest paymentsor principal repayments to support the borrower’s reorganization, but exclude loans to bankrupt obligors, non-accrual delinquent loans or past due loans(three months or more). The outstanding balances of restructured loans as of September 30, 2003 and 2002 were ¥23,578 million (U.S.$211,944thousand) and ¥59,600 million, respectively.
(b) The total outstanding amount deducted from the loan account for loan participations as of September 30, 2003 and 2002 was ¥327,881 million(U.S.$2,947,249 thousand) and ¥180,293 million, respectively. This “off-balance sheet” treatment was in accordance with the guideline issued bythe JICPA.
(c) The amount of loans sold through senior certificates under a collateralized loan obligation (“CLO”) securitization totaled ¥297,065 million(U.S.$2,670,247 thousand) and ¥242,058 million for the six months ended September 30, 2003 and 2002, respectively, with the subordinated certificatesretained by the Bank totaling ¥113,238 million (U.S.$1,017,879 thousand) and ¥89,873 million as of September 30, 2003 and 2002, respectively,recorded as loans.
A reserve for credit losses was established based on the aggregate amount of the senior and subordinated certificate portions described above, taking intoconsideration all credit risks to be absorbed by the subordinated certificates.
Notes to Consolidated Interim Financial Statements (Unaudited)
ShinseiIR/P1-P20/03年-1 04.3.21, 1:39 PMPage 27 Adobe PageMaker 6.0J/PPC

28
9. Other AssetsOther assets as of September 30, 2003 and 2002 consisted of thefollowing:
Thousands ofMillions of yen U.S. dollars
As of September 30,
2003 2002 2003
Other assets:Accrued income ¥030,496 ¥042,279 $0,274,126Prepaid expenses 684 755 6,156Fair value of derivatives 32,832 27,755 295,122Deferred losses on derivatives for hedging purposes 20,899 57,696 187,856Financial stabilization fund contribution 70,239 70,239 631,362Accounts receivable 135,026 135,181 1,213,717Other 153,437 89,119 1,379,211
Total ¥443,614 ¥423,027 $3,987,550
10. Premises and EquipmentPremises and equipment as of September 30, 2003 and 2002 consistedof the following:
Thousands ofMillions of yen U.S. dollars
As of September 30,
2003 2002 2003
Premises and equipment:Land ¥(38,834 ¥39,145 $349,079Buildings 41,573 41,080 373,698Equipment 10,085 8,316 90,655Security deposits 5,613 5,733 50,454Other 569 666 5,121
Total 96,677 94,944 869,007Accumulated depreciation (10,103) (8,233) (90,821)Net book value ¥(86,573 ¥86,710 $778,186
11. Reserve for Credit LossesReserve for credit losses as of September 30, 2003 and 2002 consistedof the following:
Thousands ofMillions of yen U.S. dollars
As of September 30,
2003 2002 2003
Reserve for credit losses:Reserve for loan losses:
General reserve ¥077,821 ¥097,471 $0,699,519Specific reserve 61,317 204,904 551,165Reserve for loans to restructuring countries 28 113 259Subtotal 139,167 302,488 1,250,943
Specific reserve for other credit losses 53,196 20,149 478,168
Total ¥192,363 ¥322,637 $1,729,111
12. DebenturesDebentures as of September 30, 2003 and 2002 consisted of thefollowing:
Thousands ofMillions of yen U.S. dollars
As of September 30,
2003 2002 2003
Debentures:Coupon debentures ¥1,335,512 ¥1,985,900 $12,004,603Discount debentures 72,677 165,128 653,280Subordinated bonds 27,779 37,662 249,701
Total ¥1,435,968 ¥2,188,691 $12,907,584
Annual maturities of debentures as of September 30, 2003 were asfollows:
Thousands ofMillions of yen U.S. dollars
As of September 30,
Through the year ending September 30,2004 ¥0,550,720 $04,950,2992005 262,449 2,359,0942006 312,406 2,808,1502007 126,252 1,134,8542008 and thereafter 184,139 1,655,187
Total ¥1,435,968 $12,907,584
13. Deposits, Including Negotiable Certificates of DepositDeposits, including negotiable certificates of deposit, as of September30, 2003 and 2002 consisted of the following:
Thousands ofMillions of yen U.S. dollars
As of September 30,
2003 2002 2003
Deposits:Current ¥0,022,023 ¥0,020,925 $00,197,961Ordinary 581,113 425,188 5,223,489Notice 27,276 30,280 245,183Time 1,422,783 1,633,072 12,789,068Negotiable certificates of deposit 394,338 399,364 3,544,611Other 207,002 124,269 1,860,696
Total ¥2,654,537 ¥2,633,101 $23,861,008
14. Trading LiabilitiesTrading liabilities as of September 30, 2003 and 2002 consisted of thefollowing:
Thousands ofMillions of yen U.S. dollars
As of September 30,
2003 2002 2003
Trading liabilities:Derivatives for securities held to hedge trading transactions ¥000,100 ¥000,112 $0,000,899Trading-related financial derivatives 116,406 182,594 1,046,351Other 585 — 5,266
Total ¥117,092 ¥182,707 $1,052,516
15. Borrowed MoneyBorrowed money as of September 30, 2003 and 2002 consisted of thefollowing:
Thousands ofMillions of yen U.S. dollars
As of September 30,
2003 2002 2003
Borrowed money:Subordinated debt ¥194,000 ¥326,600 $1,743,820Borrowings from the Bank of Japan and other financial institutions 107,035 110,910 962,114
Total ¥301,035 ¥437,510 $2,705,934
Notes to Consolidated Interim Financial Statements (Unaudited)
ShinseiIR/P1-P20/03年-1 04.3.21, 1:39 PMPage 28 Adobe PageMaker 6.0J/PPC

29
16. Foreign ExchangesThe assets and liabilities related to foreign currency trade financingactivities of the Bank as of September 30, 2003 and 2002 consisted ofthe following:
Thousands ofMillions of yen U.S. dollars
As of September 30,
2003 2002 2003
Foreign exchange assets:Foreign bills bought ¥00,038 ¥0,023 $00,344Foreign bills receivable 2,415 3,740 21,710Due from foreign banks 8,229 4,860 73,977
Total ¥10,683 ¥8,624 $96,031
Thousands ofMillions of yen U.S. dollars
As of September 30,
2003 2002 2003
Foreign exchange liabilities:Foreign bills payable ¥0 ¥0 $07Due to foreign banks 2 4 18
Total ¥2 ¥4 $25
17. Other LiabilitiesOther liabilities as of September 30, 2003 and 2002 consisted of thefollowing:
Thousands ofMillions of yen U.S. dollars
As of September 30,
2003 2002 2003
Other liabilities:Accrued expenses ¥043,858 ¥050,281 $0,394,230Unearned income 2,775 5,054 24,951Income taxes payable 673 494 6,053Fair value of derivatives 50,574 87,995 454,601Matured debentures, including interest 53,223 62,786 478,413Foreign exchange gains on currency swaps — 89,410 —Suspense receipts 112,020 102,399 1,006,929Other 179,082 175,664 1,609,729
Total ¥442,208 ¥574,086 $3,974,906
18. Acceptances and GuaranteesAcceptances and guarantees as of September 30, 2003 and 2002consisted of the following:
Thousands ofMillions of yen U.S. dollars
As of September 30,
2003 2002 2003
Acceptances and guarantees:Guarantees ¥44,674 ¥87,409 $401,569Letters of credit 244 376 2,196Other 4 — 39
Total ¥44,923 ¥87,785 $403,804
19. Assets Pledged as Collateral and Debts CollateralizedAssets pledged as collateral and debts collateralized as of September 30,2003 and 2002 consisted of the following:
Thousands ofMillions of yen U.S. dollars
As of September 30,
2003 2002 2003
Assets:Cash and due from banks ¥002,376 ¥0,002,835 $0,021,357Trading assets 481,156 229,345 4,324,998Securities 616,281 1,543,045 5,539,605Loans and bills discounted 2,294 109,570 20,627
Debts:Deposits, including negotiable certificates of deposit ¥012,879 ¥0,011,695 $0,115,772Payables under repurchase agreements 431,552 113,055 3,879,126Collateral related to securities lending transactions 258,157 726,136 2,320,514Borrowed money 2,834 10 25,481Other liabilities 3,075 — 27,648Acceptances and guarantees 2,340 5,762 21,042
In addition, ¥184,847 million (U.S.$1,661,553 thousand) of securi-ties and ¥55 million (U.S.$500 thousand) of foreign exchanges as ofSeptember 30, 2003 and ¥283,428 million of securities and ¥61 millionof foreign exchanges as of September 30, 2002 are pledged as collateralfor transactions, including exchange settlements, swap transactions andthe replacement of margin for future trading.
Also, ¥1,495 million (U.S.$13,439 thousand) and ¥2,592 million ofmargin deposits for futures transactions outstanding are included in otherassets as of September 30, 2003 and 2002, respectively.
20. Reverse Stock SplitThe Bank’s common shareholders approved a 1-for-2 reverse commonstock split at the general meeting of shareholders held on June 25, 2003.Consequently, as of July 29, 2003, the capital stock of the Bank con-sisted of 1,358,537 thousand shares of common stock, 74,528 thousandshares of Class A preferred stock and 600,000 thousand shares of ClassB preferred stock.
The Bank’s common shareholders approved the amendment of the con-version conditions of preferred stock simultaneously at the general meet-ing of shareholders held on June 25, 2003. Consequently, as of July 29,2003, the conversion conditions of preferred stock have been amendedas follows:
• For Class A preferred shares, the conversion price is changed to¥360 from ¥180, and the maximum number of shares of commonstock to one share of preferred stock is changed to two shares fromfour shares at the time of simultaneous conversion to common stock.
• For Class B preferred shares, a minimum conversion price ischanged to ¥600 from ¥300, and the maximum conversion price ischanged to ¥800 from ¥400. The maximum number of shares ofcommon stock to one share of preferred stock at the time of simul-taneous conversion to common stock is changed to 2/3 shares from4/3 shares, and the minimum is changed to 1/2 share from oneshare.
21. Net Trading (Loss) IncomeNet trading (loss) income for the six months ended September 30, 2003and 2002 consisted of the following:
Thousands ofMillions of yen U.S. dollars
Six months ended September 30,
2003 2002 2003
Net trading (loss) income:Income from trading securities ¥(271 ¥0,155 $(2,436(Loss on) income from derivatives for trading securities (615) 673 (5,532)Income from trading-related financial derivatives 177 3,986 1,592Other, net (77) 583 (693)
Total ¥(244) ¥5,398 $(2,197)
Notes to Consolidated Interim Financial Statements (Unaudited)
ShinseiIR/P1-P20/03年-1 04.3.21, 1:39 PMPage 29 Adobe PageMaker 6.0J/PPC

30
22. Other Business Income (Losses)“Other, net” in other business income (losses) for the six months endedSeptember 30, 2003 and 2002 consisted of the following:
Thousands ofMillions of yen U.S. dollars
Six months ended September 30,
2003 2002 2003
“Other, net” in other business income (losses):
Net gain on other monetary claims held for trading purposes ¥3,413 ¥09,107 $30,679Income from derivatives for banking purposes 4,318 1,000 38,818Equity in net income (loss) of affiliates 99 (128) 893(Losses) income from equity related derivatives (560) 6 (5,041)Amortization of goodwill 24 — 217Amortization of debenture issuance costs (104) (248) (936)Other, net 997 405 8,967
Total ¥8,187 ¥10,142 $73,597
23. Credit RecoveriesCredit recoveries for the six months ended September 30, 2003 and2002 consisted of the following:
Thousands ofMillions of yen U.S. dollars
Six months ended September 30,
2003 2002 2003
Credit recoveries:Losses on write-off of loans ¥(00,663 ¥(00,023 $(005,967Losses on sale of loans 7 377 65Net (reversal) provision of reserve for loan losses:
Net reversal of general reserve for loan losses (6,694) (76,138) (60,174)Net (reversal) provision of specific reserve for loan losses (6,685) 55,899 (60,095)Net reversal of reserve for loan losses to restructuring countries (23) (32) (214)
Subtotal (13,403) (20,271) (120,483)Net provision of specific reserve for other credit losses 4,366 18,096 39,250Provision of reserve for loss on sale of bonds 1,114 — 10,020
Total ¥0(7,251) ¥0(1,773) $0(65,181)
24. Other Gains, NetOther gains, net, for the six months ended September 30, 2003 and2002 consisted of the following:
Thousands ofMillions of yen U.S. dollars
Six months ended September 30,
2003 2002 2003
Other gains, net:Loss on disposal of premises and equipment ¥(1,228) ¥(1,088) $(11,039)Gain on exemption from future pension obligation — 3,019 —Pension-related costs (562) (598) (5,058)Gain on prescription of debentures 59 1,855 539Recoveries of written-off claims 698 0 6,280Provision for loss on disposition of premises and equipment (77) (159) (692)Refund of Tokyo regional bank tax 2,697 — 24,247Other, net (513) (176) (4,618)
Total ¥(1,074 ¥(2,852 $(09,659
25. Lease Transactions(1) Finance lease transactions, under which the ownership of the propertyis not deemed to transfer to the lessee, as of September 30, 2003 and2002 consisted of the following:
As LesseeAcquisition cost, accumulated depreciation and net balance of leasedproperty as of September 30, 2003 and 2002 were as follows:
Thousands ofMillions of yen U.S. dollars
As of September 30,
2003 2002 2003
Leased assetsAcquisition cost:
Equipment ¥238 ¥0,950 $2,144Other 179 390 1,613
Total 417 1,340 3,757Accumulated depreciation:
Equipment 119 682 1,071Other 72 309 651
Total 191 992 1,722Net balance:
Equipment 119 267 1,073Other 107 80 963
Total ¥226 ¥0,348 $2,036
Lease obligations as of September 30, 2003 and 2002 consisted ofthe following:
Thousands ofMillions of yen U.S. dollars
As of September 30,
2003 2002 2003
Obligations:Due within one year ¥080 ¥193 $0,724Due after one year 150 165 1,352
Total ¥230 ¥359 $2,076
Total lease payments were ¥47 million (U.S.$428 thousand) and ¥196million for the six months ended September 30, 2003 and 2002, respec-tively, depreciation expenses were ¥45 million (U.S.$409 thousand) and¥185 million for the six months ended September 30, 2003 and 2002,respectively, and interest expenses were ¥2 million (U.S.$24 thousand)and ¥6 million for the six months ended September 30, 2003 and 2002,respectively.
Depreciation expense is calculated using the straight-line method overthe life of the respective leased assets with zero residual value. The differ-ence between total lease payments and acquisition cost of leased assetsis charged to interest expense, and is allocated to each period using theinterest method.
As LessorThe Group did not act as a lessor during the six months ended September30, 2003. Therefore, no balance of leased assets was outstanding as ofSeptember 30, 2003.
Acquisition cost, accumulated depreciation and net balance of leasedproperty as of September 30, 2002 were as follows:
Millions of yen
As ofSeptember 30,
2002
Leased assetsAcquisition cost:
Equipment ¥7,414Other 2,118
Total 9,533Accumulated depreciation:
Equipment 5,271Other 1,234
Total 6,506Net balance:
Equipment 2,143Other 883
Total ¥3,026
Notes to Consolidated Interim Financial Statements (Unaudited)
ShinseiIR/P1-P20/03年-1 04.3.21, 1:39 PMPage 30 Adobe PageMaker 6.0J/PPC

31
Future lease payment receivables as of September 30, 2002 consistedof the following:
Millions of yen
As ofSeptember 30,
2002
Receivables:Due within one year ¥2,265Due after one year 873
Total ¥3,138
Total lease revenues, depreciation expenses and interest income were¥2,211 million, ¥1,738 million and ¥721 million, respectively, for thesix months ended September 30, 2002.
Depreciation expense is calculated using the straight-line method overthe lease term with zero residual value. The difference between total leaserevenues and acquisition cost of leased assets is charged to interestincome, and is allocated to each period using the interest method.
(2) Non-cancelable operating leases as of September 30, 2003 and 2002consisted of the following:
As LesseeThousands of
Millions of yen U.S. dollars
As of September 30,
2003 2002 2003
Obligations:Due within one year ¥2 ¥2 $20Due after one year 3 5 29
Total ¥5 ¥7 $49
As LessorMillions of yen
As ofSeptember 30,
2002
Receivables:Due within one year ¥20Due after one year —
Total ¥20
26. Segment Information(a) Business Segment InformationThe Group is engaged in banking and other related activities such astrust, securities and other businesses. Such segment information,however, has not been presented as the percentage of the otheractivities is not material to the banking business.
(b) Geographic Segment InformationSince the proportion of business that the Group conducts in Japanexceeds 90% of operating income and total assets, geographic segmentinformation is not presented.
(c) Foreign Operating IncomeForeign operating income comprises transactions at the Bank’s overseasbranch and income from the overseas consolidated subsidiaries. The com-position of this volume of transactions does not reach 10% of operatingincome, therefore foreign operating income segment information is notpresented.
27. Off-Balance Sheet Lending-Related Financial InstrumentsThe Bank issues commitments to extend credit and establishes creditlines for overdraft by making agreements to meet the financing needs ofits customers. Unfunded amounts of these commitments are ¥1,105,188million (U.S.$9,934,279 thousand) and ¥1,054,628 million as of Sep-tember 30, 2003 and 2002, respectively, out of which the original agree-ment terms of less than one year are ¥966,789 million (U.S.$8,690,242thousand) and ¥965,480 million as of September 30, 2003 and 2002,respectively. Since a large majority of these commitments expire withoutbeing drawn upon, the unfunded amounts do not necessarily representfuture cash requirements. Many of such agreements include conditions tothe effect that the Bank has the right to reject the drawdown or to reducethe amount depending on changes in financial circumstances, protectionof claims or other reasonable grounds.
In addition, the Bank obtains collateral when necessary to reducecredit risk related to these commitments.
28. Derivative Financial InstrumentsPurposesThe Group uses derivative financial instruments primarily to hedge risksfor customers, to maximize the profits of its own trading account and tomanage the potential risks in its own portfolios of assets and liabilities asa part of asset liability management.
Risk Management SystemThe Risk Management Division, which is independent of the front office,has the responsibility to manage the risk of the whole Bank. This divisioncontrols the measurement of market risk on a daily basis, monitors themarket risk status on both the banking and trading divisions and reportsperiodically to the directors in charge. Credit risk is also controlled by theunified credit line and major derivative products are dealt with within theestablished limits. Credit exposure is monitored accordingly and the Bankmay require such things as collateral to reduce credit risk on a case bycase basis.
It should be noted that the nominal contract value or notional principalamount is used in determining the value of receipts or payments of inter-est and as an indicator representative of the volume of transactions, butthose values do not necessarily reflect such things as market risk or creditrisk.
(a) Interest Rate-Related TransactionsInterest rate-related transactions as of September 30, 2003 and 2002were as follows:
Millions of yen
As of September 30, 2003
Contractual value Unrealizedor notional Market gain
principal amount value (loss)
Future contracts (listed) ¥0,126,583 ¥00,008 ¥00,008Interest rate options (listed) 89,994 (56) (19)Interest rate swaps (over-the-counter) 6,228,662 12,892 12,892Interest rate options (over-the-counter) 1,369,386 5,737 5,643
Total ¥18,583 ¥18,525
Millions of yen
As of September 30, 2002
Contractual valueor notional Market Unrealized
principal amount value gain
Future contracts (listed) ¥0,571,990 ¥00,144 ¥00,144Interest rate options (listed) 1,084,730 119 119Interest rate swaps (over-the-counter) 6,256,488 28,791 28,791Interest rate options (over-the-counter) 762,422 757 757
Total ¥29,813 ¥29,813
Thousands of U.S. dollars
As of September 30, 2003
Contractual value Unrealizedor notional Market gain
principal amount value (loss)
Future contracts (listed) $01,137,828 $000,079 $000,079Interest rate options (listed) 808,938 (506) (174)Interest rate swaps (over-the-counter) 55,987,982 115,890 115,890Interest rate options (over-the-counter) 12,309,088 51,576 50,724
Total $167,039 $166,519
Derivatives included in the table above were marked to market and theunrealized gains and losses were reported in the consolidated interimstatements of income. Derivatives for which hedge accounting wasadopted were excluded from the table above.
Notes to Consolidated Interim Financial Statements (Unaudited)
ShinseiIR/P1-P20/03年-1 04.3.21, 1:39 PMPage 31 Adobe PageMaker 6.0J/PPC
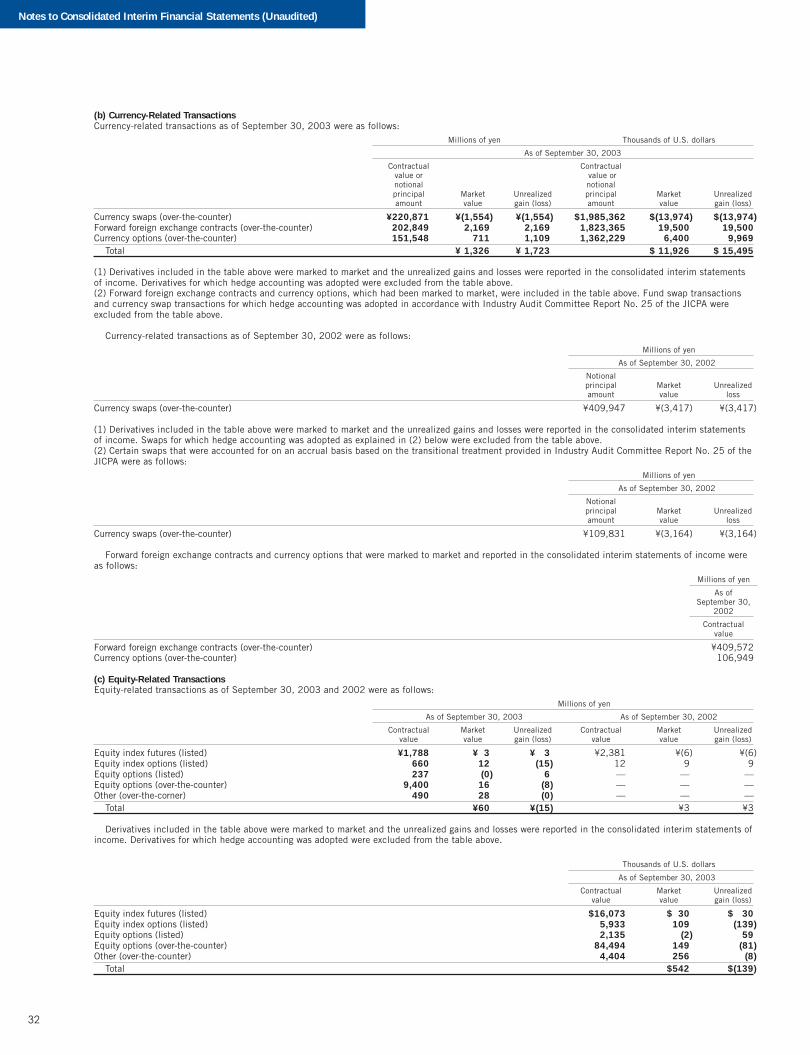
32
(b) Currency-Related TransactionsCurrency-related transactions as of September 30, 2003 were as follows:
Millions of yen Thousands of U.S. dollars
As of September 30, 2003
Contractual Contractualvalue or value ornotional notionalprincipal Market Unrealized principal Market Unrealizedamount value gain (loss) amount value gain (loss)
Currency swaps (over-the-counter) ¥220,871 ¥(1,554) ¥(1,554) $1,985,362 $(13,974) $(13,974)Forward foreign exchange contracts (over-the-counter) 202,849 2,169 2,169 1,823,365 19,500 19,500Currency options (over-the-counter) 151,548 711 1,109 1,362,229 6,400 9,969
Total ¥(1,326 ¥(1,723 $(11,926 $(15,495
(1) Derivatives included in the table above were marked to market and the unrealized gains and losses were reported in the consolidated interim statementsof income. Derivatives for which hedge accounting was adopted were excluded from the table above.(2) Forward foreign exchange contracts and currency options, which had been marked to market, were included in the table above. Fund swap transactionsand currency swap transactions for which hedge accounting was adopted in accordance with Industry Audit Committee Report No. 25 of the JICPA wereexcluded from the table above.
Currency-related transactions as of September 30, 2002 were as follows:Millions of yen
As of September 30, 2002
Notionalprincipal Market Unrealizedamount value loss
Currency swaps (over-the-counter) ¥409,947 ¥(3,417) ¥(3,417)
(1) Derivatives included in the table above were marked to market and the unrealized gains and losses were reported in the consolidated interim statementsof income. Swaps for which hedge accounting was adopted as explained in (2) below were excluded from the table above.(2) Certain swaps that were accounted for on an accrual basis based on the transitional treatment provided in Industry Audit Committee Report No. 25 of theJICPA were as follows:
Millions of yen
As of September 30, 2002
Notionalprincipal Market Unrealizedamount value loss
Currency swaps (over-the-counter) ¥109,831 ¥(3,164) ¥(3,164)
Forward foreign exchange contracts and currency options that were marked to market and reported in the consolidated interim statements of income wereas follows:
Millions of yen
As ofSeptember 30,
2002
Contractualvalue
Forward foreign exchange contracts (over-the-counter) ¥409,572Currency options (over-the-counter) 106,949
(c) Equity-Related TransactionsEquity-related transactions as of September 30, 2003 and 2002 were as follows:
Millions of yen
As of September 30, 2003 As of September 30, 2002
Contractual Market Unrealized Contractual Market Unrealizedvalue value gain (loss) value value gain (loss)
Equity index futures (listed) ¥1,788 ¥03 ¥(03 ¥2,381 ¥(6) ¥(6)Equity index options (listed) 660 12 (15) 12 9 9Equity options (listed) 237 (0) 6 — — —Equity options (over-the-counter) 9,400 16 (8) — — —Other (over-the-corner) 490 28 (0) — — —
Total ¥60 ¥(15) ¥3 ¥3
Derivatives included in the table above were marked to market and the unrealized gains and losses were reported in the consolidated interim statements ofincome. Derivatives for which hedge accounting was adopted were excluded from the table above.
Thousands of U.S. dollars
As of September 30, 2003
Contractual Market Unrealizedvalue value gain (loss)
Equity index futures (listed) $16,073 $030 $(030Equity index options (listed) 5,933 109 (139)Equity options (listed) 2,135 (2) 59Equity options (over-the-counter) 84,494 149 (81)Other (over-the-counter) 4,404 256 (8)
Total $542 $(139)
Notes to Consolidated Interim Financial Statements (Unaudited)
ShinseiIR/P1-P20/03年-1 04.3.21, 1:39 PMPage 32 Adobe PageMaker 6.0J/PPC

33
(d) Bond-Related TransactionsBond-related transactions as of September 30, 2003 and 2002 were as follows:
Millions of yen
As of September 30, 2003 As of September 30, 2002
Notional Notionalprincipal Market Unrealized principal Market Unrealizedamount value gain (loss) amount value loss
Bond futures (listed) ¥11,767 ¥(65) ¥(65) ¥01,850 ¥0(7) ¥0(7)Bond futures options (listed) 1,201 (0) 1 43,087 (54) (54)
Total ¥(66) ¥(64) ¥(61) ¥(61)
Derivatives included in the table above were marked to market and the unrealized gains and losses were reported in the consolidated interim statements ofincome. Derivatives for which hedge accounting was adopted were excluded from the table above.
Thousands of U.S. dollars
As of September 30, 2003
Notionalprincipal Market Unrealizedamount value gain (loss)
Bond futures (listed) $105,771 $(593) $(593)Bond futures options (listed) 10,800 (6) 9
Total $(599) $(584)
(e) Commodity Derivatives TransactionsThe Group has no outstanding positions arising from commodity derivatives transactions.
(f) Credit Derivatives TransactionsCredit derivatives transactions as of September 30, 2003 and 2002 were as follows:
Millions of yen
As of September 30, 2003 As of September 30, 2002
Notional Notionalprincipal Market Unrealized principal Market Unrealizedamount value gain amount value loss
Credit default option (over-the-counter) ¥218,965 ¥173 ¥173 ¥50,932 ¥(471) ¥(471)
Derivatives included in the table above were marked to market and the unrealized gains and losses were reported in the consolidated interim statements ofincome. Derivatives for which hedge accounting was adopted were excluded from the table above.
Thousands of U.S. dollars
As of September 30, 2003
Notionalprincipal Market Unrealizedamount value gain
Credit default option (over-the-counter) $1,968,231 $1,556 $1,556
29. Net Income per Common ShareA reconciliation of the differences between basic and diluted net income per common share (“EPS”) for the six months ended September 30, 2003 and2002, after giving effect to the 1-for-2 reverse common stock split consummated on July 29, 2003 was as follows:
WeightedNet income average shares EPS EPS
(Millions of yen) (Thousands) (Yen) (U.S. dollars)
For the six months ended September 30, 2003:Basic EPS
Net income available to common shareholders ¥32,101 1,358,537 ¥23.63 $ 0.21.Effect of dilutive securities
Preferred stock 1,936 669,128Diluted EPS
Net income for computation ¥34,038 2,027,666 16.79 0.15.
WeightedNet income average shares EPS
(Millions of yen) (Thousands) (Yen)
For the six months ended September 30, 2002:Basic EPS
Net income available to common shareholders ¥26,464 1,358,537 ¥19.48.Effect of dilutive securities
Preferred stock — 669,128Diluted EPS
Net income for computation ¥26,464 2,027,666 13.05.
30. Subsequent Events(a) In November 2003, the Bank received the consent of the DIC regarding certain claims on which the Bank claimed to exercise the cancellation right underthe “Warranty” clause. As a result, an adjustment of ¥9,434 million to reserve for credit losses will be recorded as a gain during the second half of the yearending March 31, 2004.(b) The following interim dividends were paid on December 19, 2003 upon resolution of the Board of Directors held on November 20, 2003 (NY time):
Millions of yen
Class A preferred stock (¥6.50 per share) ¥0,484Class B preferred stock (¥2.42 per share) 1,452Common stock (¥1.11 per share) 1,507
Total ¥3,444
Notes to Consolidated Interim Financial Statements (Unaudited)
ShinseiIR/P1-P20/03年-1 04.3.21, 1:39 PMPage 33 Adobe PageMaker 6.0J/PPC
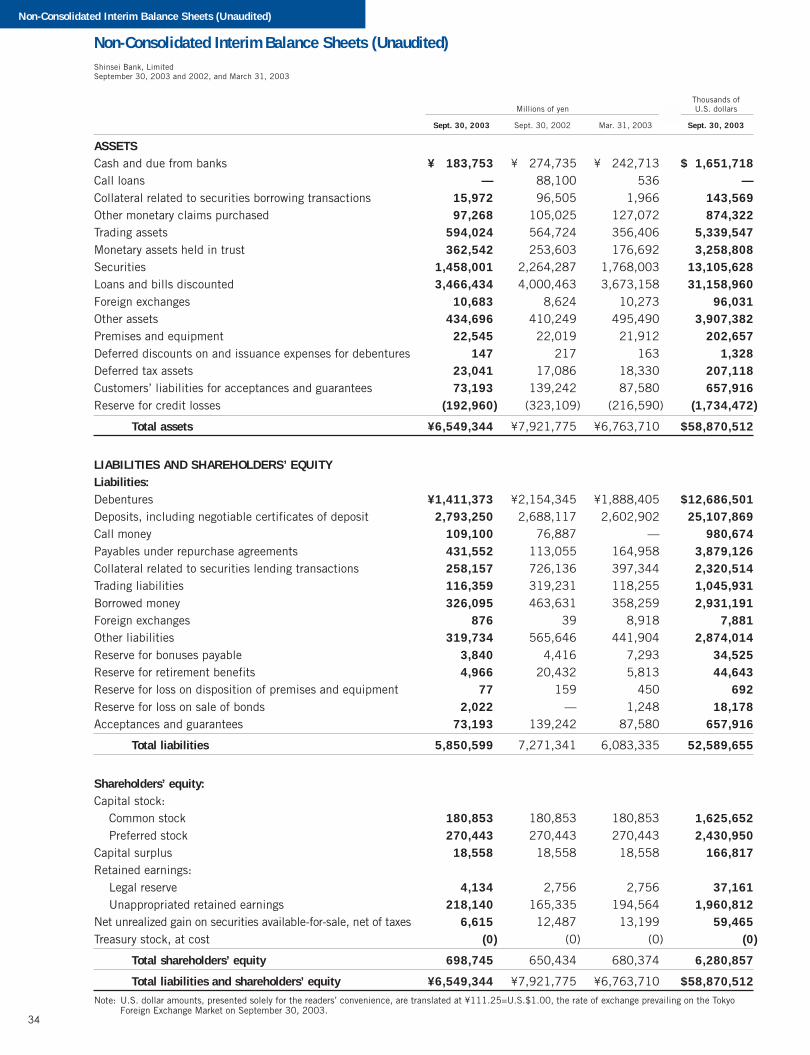
34
Thousands ofMillions of yen U.S. dollars
Sept. 30, 2003 Sept. 30, 2002 Mar. 31, 2003 Sept. 30, 2003
ASSETSCash and due from banks ¥0,183,753 ¥0,274,735 ¥0,242,713 $01,651,718Call loans — 88,100 536 —Collateral related to securities borrowing transactions 15,972 96,505 1,966 143,569Other monetary claims purchased 97,268 105,025 127,072 874,322Trading assets 594,024 564,724 356,406 5,339,547Monetary assets held in trust 362,542 253,603 176,692 3,258,808Securities 1,458,001 2,264,287 1,768,003 13,105,628Loans and bills discounted 3,466,434 4,000,463 3,673,158 31,158,960Foreign exchanges 10,683 8,624 10,273 96,031Other assets 434,696 410,249 495,490 3,907,382Premises and equipment 22,545 22,019 21,912 202,657Deferred discounts on and issuance expenses for debentures 147 217 163 1,328Deferred tax assets 23,041 17,086 18,330 207,118Customers’ liabilities for acceptances and guarantees 73,193 139,242 87,580 657,916Reserve for credit losses (192,960) (323,109) (216,590) (1,734,472)
Total assets ¥6,549,344 ¥7,921,775 ¥6,763,710 $58,870,512
LIABILITIES AND SHAREHOLDERS’ EQUITYLiabilities:Debentures ¥1,411,373 ¥2,154,345 ¥1,888,405 $12,686,501Deposits, including negotiable certificates of deposit 2,793,250 2,688,117 2,602,902 25,107,869Call money 109,100 76,887 — 980,674Payables under repurchase agreements 431,552 113,055 164,958 3,879,126Collateral related to securities lending transactions 258,157 726,136 397,344 2,320,514Trading liabilities 116,359 319,231 118,255 1,045,931Borrowed money 326,095 463,631 358,259 2,931,191Foreign exchanges 876 39 8,918 7,881Other liabilities 319,734 565,646 441,904 2,874,014Reserve for bonuses payable 3,840 4,416 7,293 34,525Reserve for retirement benefits 4,966 20,432 5,813 44,643Reserve for loss on disposition of premises and equipment 77 159 450 692Reserve for loss on sale of bonds 2,022 — 1,248 18,178Acceptances and guarantees 73,193 139,242 87,580 657,916
Total liabilities 5,850,599 7,271,341 6,083,335 52,589,655
Shareholders’ equity:Capital stock:
Common stock 180,853 180,853 180,853 1,625,652Preferred stock 270,443 270,443 270,443 2,430,950
Capital surplus 18,558 18,558 18,558 166,817Retained earnings:
Legal reserve 4,134 2,756 2,756 37,161Unappropriated retained earnings 218,140 165,335 194,564 1,960,812
Net unrealized gain on securities available-for-sale, net of taxes 6,615 12,487 13,199 59,465Treasury stock, at cost (0) (0) (0) (0)
Total shareholders’ equity 698,745 650,434 680,374 6,280,857
Total liabilities and shareholders’ equity ¥6,549,344 ¥7,921,775 ¥6,763,710 $58,870,512Note: U.S. dollar amounts, presented solely for the readers’ convenience, are translated at ¥111.25=U.S.$1.00, the rate of exchange prevailing on the Tokyo
Foreign Exchange Market on September 30, 2003.
Non-Consolidated Interim Balance Sheets (Unaudited)Shinsei Bank, LimitedSeptember 30, 2003 and 2002, and March 31, 2003
Non-Consolidated Interim Balance Sheets (Unaudited)
ShinseiIR/P1-P20/03年-1 04.3.21, 1:39 PMPage 34 Adobe PageMaker 6.0J/PPC
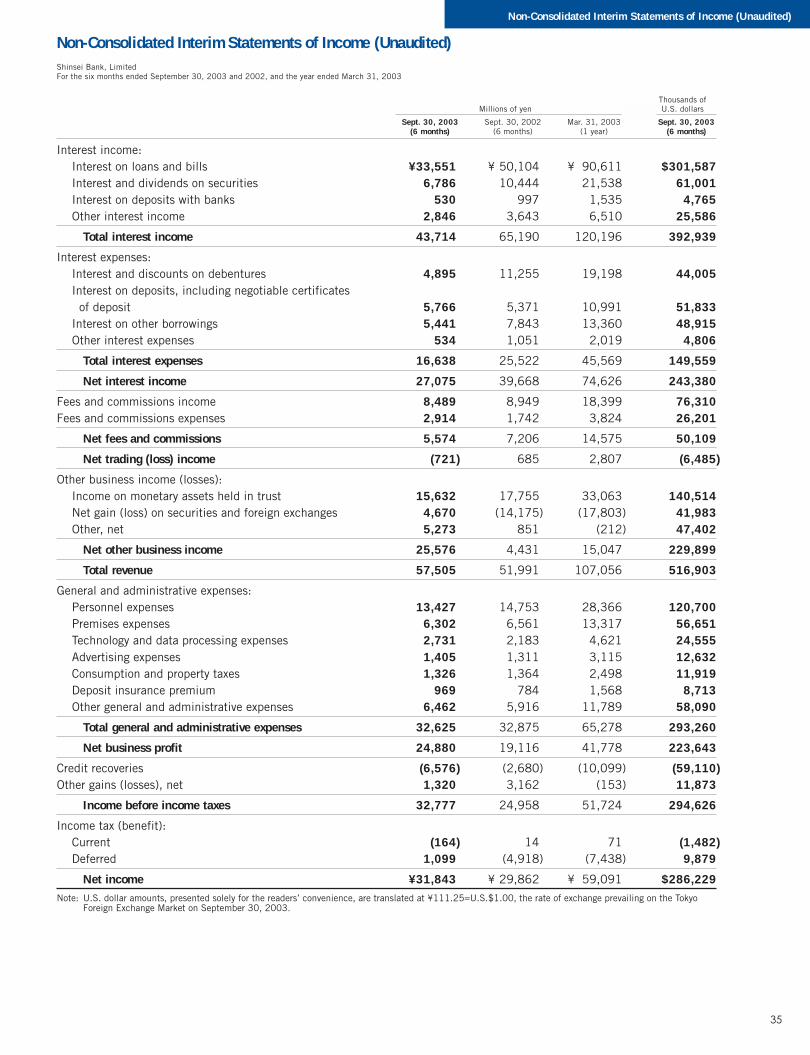
35
Thousands ofMillions of yen U.S. dollars
Sept. 30, 2003 Sept. 30, 2002 Mar. 31, 2003 Sept. 30, 2003(6 months) (6 months) (1 year) (6 months)
Interest income:Interest on loans and bills ¥33,551 ¥(50,104 ¥090,611 $301,587Interest and dividends on securities 6,786 10,444 21,538 61,001Interest on deposits with banks 530 997 1,535 4,765Other interest income 2,846 3,643 6,510 25,586
Total interest income 43,714 65,190 120,196 392,939
Interest expenses:Interest and discounts on debentures 4,895 11,255 19,198 44,005Interest on deposits, including negotiable certificates of deposit 5,766 5,371 10,991 51,833Interest on other borrowings 5,441 7,843 13,360 48,915Other interest expenses 534 1,051 2,019 4,806
Total interest expenses 16,638 25,522 45,569 149,559
Net interest income 27,075 39,668 74,626 243,380
Fees and commissions income 8,489 8,949 18,399 76,310Fees and commissions expenses 2,914 1,742 3,824 26,201
Net fees and commissions 5,574 7,206 14,575 50,109
Net trading (loss) income (721) 685 2,807 (6,485)
Other business income (losses):Income on monetary assets held in trust 15,632 17,755 33,063 140,514Net gain (loss) on securities and foreign exchanges 4,670 (14,175) (17,803) 41,983Other, net 5,273 851 (212) 47,402
Net other business income 25,576 4,431 15,047 229,899
Total revenue 57,505 51,991 107,056 516,903
General and administrative expenses:Personnel expenses 13,427 14,753 28,366 120,700Premises expenses 6,302 6,561 13,317 56,651Technology and data processing expenses 2,731 2,183 4,621 24,555Advertising expenses 1,405 1,311 3,115 12,632Consumption and property taxes 1,326 1,364 2,498 11,919Deposit insurance premium 969 784 1,568 8,713Other general and administrative expenses 6,462 5,916 11,789 58,090
Total general and administrative expenses 32,625 32,875 65,278 293,260
Net business profit 24,880 19,116 41,778 223,643
Credit recoveries (6,576) (2,680) (10,099) (59,110)Other gains (losses), net 1,320 3,162 (153) 11,873
Income before income taxes 32,777 24,958 51,724 294,626
Income tax (benefit):Current (164) 14 71 (1,482)Deferred 1,099 (4,918) (7,438) 9,879
Net income ¥31,843 ¥(29,862 ¥059,091 $286,229Note: U.S. dollar amounts, presented solely for the readers’ convenience, are translated at ¥111.25=U.S.$1.00, the rate of exchange prevailing on the Tokyo
Foreign Exchange Market on September 30, 2003.
Non-Consolidated Interim Statements of Income (Unaudited)Shinsei Bank, LimitedFor the six months ended September 30, 2003 and 2002, and the year ended March 31, 2003
Non-Consolidated Interim Statements of Income (Unaudited)
ShinseiIR/P1-P20/03年-1 04.3.21, 1:39 PMPage 35 Adobe PageMaker 6.0J/PPC

36
Corporate Information
Management
As of January 31, 2004
Board of Directors and Statutory Auditors
Chairman and President Masamoto Yashiro
Senior Managing Director Hidebumi MoriSenior Managing Director Teruaki Yamamoto
Director Tadashi IshikuroDirector Timothy C. Collins CEO, Ripplewood Holdings, LLCDirector J. Christopher Flowers Director, The Enstar Group, Inc.Director Akira Aoki Counselor, Japan Securities Finance Co., Ltd.Director Takashi Imai Senior Advisor, Honorary Chairman, Nippon Steel CorporationDirector Minoru Makihara Chairman, Mitsubishi CorporationDirector Nobuaki Ogawa LawyerDirector Michael J. Boskin Professor, Stanford UniversityDirector Emilio Botín Chairman, Banco Santander Central Hispano SADirector Donald B. Marron Chairman, UBS AmericaDirector Martin G. McGuinn Chairman and CEO, Mellon Financial CorporationDirector David Rockefeller
Standing Statutory Auditor Koji SaitoStatutory Auditor Akira Sudo Certified Public AccountantStatutory Auditor Makiko Yasuda Lawyer
Senior AdvisorsSenior Advisor Paul A. VolckerSenior Advisor Vernon E. Jordan, Jr. Senior Managing Director, Lazard Frères & Co. LLCSenior Advisor John S. Reed
Corporate Executive OfficersCEO Masamoto YashiroVice Chairman Thierry Porté(*1)
Senior Managing Director Hidebumi MoriSenior Managing Director, Institutional Banking Group Teruaki YamamotoDirector, Corporate Banking Business Sub-Group Tadashi IshikuroInstitutional Banking Group and Corporate Banking Business Sub-Group Clark Graninger(*2)
Retail Banking Group K. Sajeeve ThomasChief Financial Officer John E. MackBanking Infrastructure Group Dhananjaya DvivediRisk Management Group Janak RajRelationship Group Koichiro NakayaCorporate Business Solutions Sub-Group Junzo TomiiFinancial and Capital Markets Sub-Group Masazumi KatoRetail Sales Sub-Group Satoru KatayamaNotes: (*1) Appointed on November 21, 2003
(*2) Appointed on September 18, 2003
Employees
Consolidated Sept. 30, 2003 Mar. 31, 2003 Sept. 30, 2002
Number of Employees ............. 2,360 2,252 2,414(As of March 31, 2003, 2002 and 2001)
Non-Consolidated Sept. 30, 2003 Mar. 31, 2003 Sept. 30, 2002
Number of Employees ............. 2,117 2,055 2,226Male .................................. 1,220 1,177 1,267Female .............................. 0,897 0,878 0,959
Management/Employees
ShinseiIR/P1-P20/03年-1 04.3.21, 1:39 PMPage 36 Adobe PageMaker 6.0J/PPC
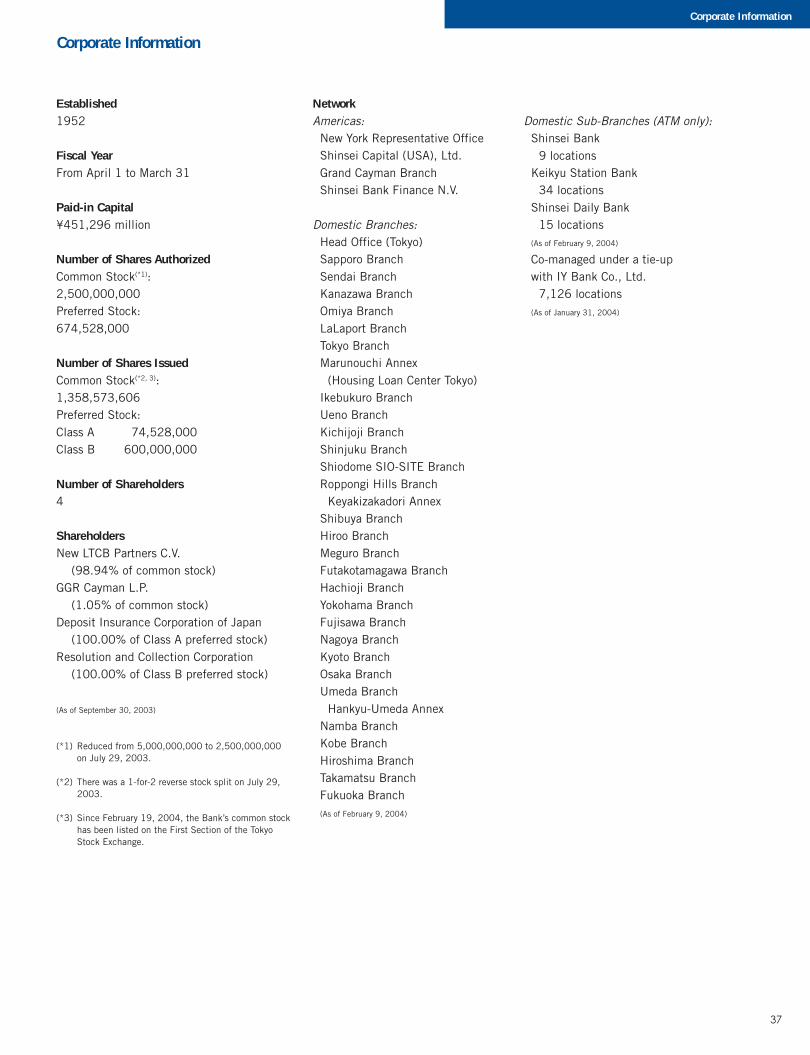
37
Corporate Information
Established1952
Fiscal YearFrom April 1 to March 31
Paid-in Capital¥451,296 million
Number of Shares AuthorizedCommon Stock(*1):2,500,000,000Preferred Stock:674,528,000
Number of Shares IssuedCommon Stock(*2, 3):1,358,573,606Preferred Stock:Class A 074,528,000Class B 600,000,000
Number of Shareholders4
ShareholdersNew LTCB Partners C.V.
(98.94% of common stock)GGR Cayman L.P.
(1.05% of common stock)Deposit Insurance Corporation of Japan
(100.00% of Class A preferred stock)Resolution and Collection Corporation
(100.00% of Class B preferred stock)
(As of September 30, 2003)
NetworkAmericas: New York Representative Office Shinsei Capital (USA), Ltd. Grand Cayman Branch Shinsei Bank Finance N.V.
Domestic Branches: Head Office (Tokyo) Sapporo Branch Sendai Branch Kanazawa Branch Omiya Branch LaLaport Branch Tokyo Branch Marunouchi Annex
(Housing Loan Center Tokyo) Ikebukuro Branch Ueno Branch Kichijoji Branch Shinjuku Branch Shiodome SIO-SITE Branch Roppongi Hills Branch
Keyakizakadori Annex Shibuya Branch Hiroo Branch Meguro Branch Futakotamagawa Branch Hachioji Branch Yokohama Branch Fujisawa Branch Nagoya Branch Kyoto Branch Osaka Branch Umeda Branch
Hankyu-Umeda Annex Namba Branch Kobe Branch Hiroshima Branch Takamatsu Branch Fukuoka Branch (As of February 9, 2004)
(*1) Reduced from 5,000,000,000 to 2,500,000,000on July 29, 2003.
(*2) There was a 1-for-2 reverse stock split on July 29,2003.
(*3) Since February 19, 2004, the Bank’s common stockhas been listed on the First Section of the TokyoStock Exchange.
Domestic Sub-Branches (ATM only): Shinsei Bank
9 locations Keikyu Station Bank
34 locations Shinsei Daily Bank
15 locations (As of February 9, 2004)
Co-managed under a tie-up with IY Bank Co., Ltd.
7,126 locations (As of January 31, 2004)
Corporate Information Corporate Information
ShinseiIR/P1-P20/03年-1 04.3.21, 1:39 PMPage 37 Adobe PageMaker 6.0J/PPC

C
Printed in Japan on recycled paper
For further information, please contact:Corporate Communications DivisionSHINSEI BANK, LIMITED1-8, UCHISAIWAICHO 2-CHOME,CHIYODA-KU, TOKYO 100-8501, JAPANTel: 81-3-5511-5111 Fax: 81-3-5511-5505URL: http://www.shinseibank.comE-mail: [email protected]
Interim
Rep
ort 20
03
SHIN
SEI BAN
K, LIM
ITED


![25jissen challenge shinsei - nihonseimei-zaidan.or.jp · Uz n]](https://img.dokumen.tips/doc/110x75/5c0376bc09d3f21e408c2417/25jissen-challenge-shinsei-nihonseimei-uz-n-.jpg)