Embed Size (px)
Citation preview

1
Shift of seed mass and fruit type spectra along longitudinal gradient: high 1
water availability and growth allometry 2
Shunli Yu1,Guoxun Wang1,Ofir Katz2,Danfeng Li1,Qibing Wang1,Ming Yue3, Canran Liu4 3
1 State Key Laboratory of Vegetation and Environmental Change, Institute of Botany, Chinese Academy of Sciences 4
2 Dead Sea and Arava Science Center, Israel 5
3 College of Life Sciences, Northwest University, China 6
4 Rylah Institute for Environmental Research, Heidelberg, Department of Environment, Land, Water and Planning, 7
Melbourne, VIC 3084, Australia. 8
Correspondence to: Shunli Yu ([email protected]) 9
10
Abstract. Propagule traits vary among communities along geographical gradients such as longitude, but the 11
mechanisms that underlie these variations remain unclear. This study aims to explore seed mass variation patterns of 12
different community types along a longitudinal gradient and their underlying variation mechanisms by involving an 13
in-depth analysis on the variation of seed mass, fruit type spectra, growth forms and dispersal mode spectra in Inner 14
Mongolia and northeastern China. Plant community characterization and seed collection were conducted in 26 sites 15
spreading over five vegetation types and covering 622 species belonging to 66 families and 298 genera. We found 16
there are significantly declining trend for mean seed mass, vertebrate-dispersed species richness and fleshy-fruited 17
species richness along a longitudinal gradient from forests to desert grasslands. However, we also found the lowest 18
average seed mass and the smallest proportion of species dispersed by vertebrates occurring at typical grasslands in the 19
five communities. The variations of average seed mass display high congruent with transition of growth forms. The 20
selection for these propagule attributes is driven mainly by climatic factors such as precipitation, temperature, soil 21
moisture and evaporation, as well as by internal biotic factors such as growth forms, canopy coverage and leaf area. A 22
hypothesis was provided that environmental factors and botanical traits that favor greater water availability lead to 23
emergence (or speciation) of species with large seeds or fleshy fruits with high water content. Due to greater water 24
https://doi.org/10.5194/bg-2019-479Preprint. Discussion started: 8 June 2020c© Author(s) 2020. CC BY 4.0 License.
2
availability and increasing leaf area, much more photosynthate and allometric growth then ultimately increase the 25
community average seed mass along rising longitude (or declining latitude or elevation). Phylogenetic signal or 26
diversity are not found to be involved into the effect on the patterns. A novel mechanistic framework and model are 27
provided to expound seed variation among species or communities. 28
29
1 Introduction 30
Seed traits have great impact on plants’ competitive ability, fitness, fecundity and reproduction. Therefore, studying 31
seed mass variations and their mechanism is crucial for understanding plant’s ecological strategy and resource 32
acquisition (Zanne et al., 2014) as well as deep-time origin and evolution of seed attributes. Being a relatively stable 33
biological trait, seed mass is controlled by an appointed gene (Adamskia et al., 2009; Wang et al., 2014), while 34
retaining a certain degree of plasticity being affected by the surrounding environment (Baker, 1972). Therefore, an 35
individual plant's seed size is a combined result of its taxonomic group's evolutionary history and of immediate 36
selective pressures of the local environment (Westoby et al., 2002; Moles et al., 2005a). Furthermore, as an important 37
aspect in the reproductive biology of plants, seed mass is evolutionarily associated with and corresponds to other plant 38
traits, relating to plant habits, life history such as growth forms (Moles et al., 2005a), stature and canopy sizes (Venable, 39
1992; Leishman and Westoby, 1994; Moles et al., 2005a), dispersal modes (Greene and Johnson, 1993), leaf area (Díaz 40
et al., 2016) and plant longevity (Telenius and Torstesson, 1991), as well as to anatomical traits of flowers and fruits 41
(Primack, 1987). 42
Numerous works show that seed mass varies along environmental gradients such as latitude, elevation and 43
longitude owing to environmental variations in temperature and precipitation and canopy coverage both among and 44
within communities (Moles et al., 2007) and several mechanisms are proposed to explain such seed mass variation 45
gradients or patterns, for example, temperature (Moles et al., 2014), light (or solar radiation) (Murray et al., 2004; 46
Demalach and Kadmon, 2018), soil resource availability (Demalach and Kadmon, 2018), growth forms (Moles et al., 47
2005b), dispersal modes (Moles and Westoby, 2003), soil pH (Tautenhahn et al., 2008) etc. However, a deep 48
understanding of the factors that underlie these major biogeographical variations is missing (Demalach and Kadmon, 49
https://doi.org/10.5194/bg-2019-479Preprint. Discussion started: 8 June 2020c© Author(s) 2020. CC BY 4.0 License.

3
2018), especially at a continental scale along longitude. Previous work suggested that community-level average seed 50
mass tends to decrease towards higher latitudes and elevations (Moles et al., 2007). These trends can be explained by 51
shifts in habitat type, plant growth form spectra, seed disperser assemblage (Moles and Westoby, 2003), solar radiation 52
and metabolic expenditure (Murray et al., 2003; 2004) and NPP (Bu et al., 2007; Guo et al., 2010) along latitudinal and 53
elevational gradients. Additionally, species that prefer shaded habitats and late successional stages generally tend to 54
have larger seeds than those in open arid habitats or earlier successional stages (Baker, 1972; Salisbury, 1974; Foster 55
and Janson, 1985; Hallett et al., 2011; Moles and Westoby, 2006), indicating a strong effect of high water availibility 56
on seed mass owing to low evaporation under close canopy coverage. Longitudinal variations of seed mass has been 57
discussed among species with a single genus (Murray et al., 2003; 2004); however, there are few studies that focus on 58
how community-level variations of seed mass (especially across species) correspond with other plant traits along 59
longitudinal gradients, because of the difficulty to predict variations of comprehensive environmental factors arising 60
from complex topography. Average seed mass is expected to decrease with declining longitude due to gradually less 61
rainfall from forests to desert ecosystems (Murray et al., 2003; 2004). Here we present a study of community-level 62
variations in seed mass in correspondence to position in the continent (relative to the sea) across Inner Mongolia and 63
northeastern China, to identify the longitudinal pattern and discuss the mechanisms that may underlie them. 64
Previous works emphasize the role of high light acquisition and allometric growth in shaping seed mass variation 65
through model prediction and experiment testing (Demalach and Kadmon, 2018; Demalach et al., 2019), and in this 66
article we emphasize the importance of high water availability and allometric growth for speciation and colonization of 67
species with large seeds due to environmental factors and biological traits. Allometry of biomass growth and 68
size-asymmetry of light competition became the drivers of seed mass variation owing to soil resource availability and 69
ultimate productivity heterogeneity along soil resource gradient (surely including water gradient). As we know, 70
primary production of communities increases across an increasing water gradient (Bai et al., 2008). This article 71
presents a novel mechanistic framework that integrates previous theory and hypotheses (related to climate, phylogeny, 72
water conduction systems and other traits related to water balance) to evaluate seed mass variation among species or 73
communities (Figure 1). 74
https://doi.org/10.5194/bg-2019-479Preprint. Discussion started: 8 June 2020c© Author(s) 2020. CC BY 4.0 License.

4
The objectives of this study are to explore seed mass variation patterns of different community types along a 75
longitudinal gradient and seed mass variation mechanisms. First, we test whether community-level seed mass declines 76
from forests to deserts and what drives the patterns by identifying correlations between average seed mass and 77
precipitation and temperature. Second, we test whether species richness and growth form display similar variations as 78
seed mass, because growth forms are the key determinant of seed mass (Moles et al., 2005b). Third, we test whether 79
seed mass variations are significantly associated with growth forms, fruit types and dispersal modes in order to know 80
whether woody species combine larger seed or fleshy-fruited species. Fourth, we expound whether these patterns can 81
be simply explained by phylogeny, latitude and elevation. Finally, we construct a general hypothesis for seed mass 82
evolution based on our results and conclusions. In addition, like most plant functional traits, seed size and fruit water 83
content are also considered to be related to phylogenetic history (Griffiths and Lawes, 2006; Norden et al., 2012). 84
These traits are often strongly phylogenetically conserved, so phylogenetic distances need to be considered when 85
examining trait variation patterns and their correspondence to environmental variables (Griffiths and Lawes, 2006; Yu 86
et al., 2017). Therefore, we also took into account the effect of phylogenetic signal or diversity on the seed mass 87
distribution patterns in our analysis. 88
89
2 Methods 90
2.1 Study sites and plant community characterization 91
The study area is located in continental arid Inner Mongolia plateau, where vegetation types shift from broad-leaved 92
deciduous forest to typical grassland and finally to desert (from east to west, respectively), due to a gradual increase in 93
sunshine duration and intensity and decrease in rainfall (from 780.6 to 29 mm) (Table 1). The study was carried out in 94
26 sites along this gradient, extending between longitude 100°E ~ 124°E (about 2864 km distance between the 95
westernmost and easternmost sites) and 41°N ~ 44° N in Inner Mongolia and northeastern China (Table 1). 96
Different sampling designs were used in different habitat types, owing to differences in vegetation structure and 97
density. Within each forest plot, 6 quadrats of 10×10 m² were selected at random in undisturbed or slightly disturbed 98
(at least in recent years) areas. For shrub communities and herbaceous communities, 3 quadrats of 5×5 m²and at least 99
https://doi.org/10.5194/bg-2019-479Preprint. Discussion started: 8 June 2020c© Author(s) 2020. CC BY 4.0 License.

5
8 quadrats 1×1 m²were investigated, respectively. Species composition (species number and number of individuals per 100
species) were recorded. The geographical positions (latitude, longitude and elevation) were measured by wireless GPS 101
logger (HOLUX Technology Inc., Taiwan). Other physiographic factors such as grade of slope, slope aspect and 102
micro-topography were recorded. The vegetation types were determined based on the dominant species and 103
information referenced from the classification system of Chinese vegetation (Editorial Committee for Vegetation of 104
China, 1980). Data of temperature and precipitation as well as other climatic factors were retrieved from the Wordclim 105
database using R raster package: average values per site were obtained from interpolations of observed data during the 106
period between 1950 and 2000. Two climatic variables, mean annual temperature (MAT) and mean annual 107
precipitation (MAP) were used to analyze the relationship between seed mass and the climate along the geographical 108
gradient (Table 1). 109
110
2.2 Seed collection and characterization 111
Mature seeds were collected for each species observed in each site at the start of natural dispersal season (from June to 112
October) during the years 2008-2014. Seeds of each species were collected from at least three mother individuals in 113
the same stand and mixed together to avoid bias caused by maternal effects. Seeds were allowed to air-dry to a 114
constant mass in the laboratory before being weighed. For each plant species, seed mass was calculated as the average 115
values of 5 to 100 (even to 1000) seeds, depending on seed size and availability, and at least three repeated 116
measurements were conducted for each species. Seed mass was measured to microgram precision on a PB303 balance 117
(Mettler, Toledo). Seeds that were likely to be inviable (unusually small seeds that contained abnormal looking 118
embryos or that appeared hollow) were subjectively excluded before the measurement. For some species with 119
caryopsis, achene and utricle, dry mass of entire propagules was weighed. Structures such as delicate wings and 120
pappus (or hairs) strictly associated with wind dispersal were removed and the spine was retained before weighing the 121
seeds. 122
Dispersal modes were assigned for all 622 species, based on ornamentation and appendages on fruits and seeds. 123
The dispersal modes of each species were obtained from the Kew Gardens (Howe and Smallwood, 1982) and literature 124
https://doi.org/10.5194/bg-2019-479Preprint. Discussion started: 8 June 2020c© Author(s) 2020. CC BY 4.0 License.

6
reference collection from northwest China (Liu et al., 2014). For some species, dispersal modes were confirmed with 125
empirical analysis according to morphological features of their diaspores, and the dispersal mode represents seeds from 126
the parent plant to the soil surface. Each species was treated as having a single dispersal mode, reflecting their 127
principal dispersal agents (PDA) (Leishman and Westoby 1994; Butler et al., 2007): wind-adapted (279 species, with 128
wings, hairs or a pappus), vertebrate-adapted (66 species, with an aril or fleshy fruits), ant-adapted (195 species, with 129
an elaiosome), unassisted (70 species, no obvious morphological structure) and adhesion-adapted (12 species, with 130
hooks, spines or bards). 131
132
2.3 Fruit types and other plant traits 133
Fruits were classified as fleshy if they were described in the flora as berries, drupes, pomes, rose hips, multiple fruits 134
and pepos or as possessing fleshy pericarp or succulent tissue in general (including arils) (Yu et al., 2017). Accordingly, 135
capsules, achenes, nuts, caryopses, legumes, follicles, pods, cremocarps, utricles, samaras and schizocarps were 136
classified as non-fleshy (dry) fruits. Some species (e.g., Vitex nengudo var. heterophylla) that were described to be 137
fleshy-fruited in related local flora were reclassified as dry-fruited owing to very low water content. 138
Species life-history information is drawn primarily from the Flora of China and based on our yearly field 139
observations. Species in the flora were grouped into the following five major growth-form categories: trees (12 140
species), shrubs (65 species), subshrubs (20 species), lianas (15 species), perennials (400 species) and annuals (110 141
species). 142
143
2.4 Soil moisture measurement 144
The soil moisture of top 10-cm depth was measured gravimetrically by oven-drying the samples at 105ºC for 24 hours 145
in 12 sites of typical grasslands and desert grasslands. Five soil samples were collected from each sites on July 10-17, 146
2014, 21days after rainfall. 147
148
2.5 Data analysis 149
https://doi.org/10.5194/bg-2019-479Preprint. Discussion started: 8 June 2020c© Author(s) 2020. CC BY 4.0 License.

7
Seed mass, longitude and precipitation were log-transformed before analysis to meet the normality and 150
homoscedasticity assumptions of linear regression models. In order to ensure that any observed seed mass variation 151
along the longitudinal gradient is independent of latitude and elevation, general linear models (GLM) were employed. 152
Seed mass and other plant traits were treated as the dependent variable in all analyses with latitude, longitude and 153
climatic variables entered into models as independent variables. 154
The proportions and species richness of plants with various seed mass and fruit types in different communities 155
were compared using analysis of variance (ANOVA). ANOVA was also used to compare average seed mass between 156
different growth forms, different community types, different fruit types and dispersal types. The GLM procedure was 157
used to examine the explanatory power of community types, dispersal types, longitude, precipitation and temperature 158
on seed mass. All analyses were performed with R-3.3.3 (R Core Team, 2018). By use of the function commonality in 159
the R package yhat (Nimon et al., 2013), we take the log-transformed seed size as dependent variable, life forms, 160
vegetation types, dispersal modes and latitude as independent variables, exploring predictive power of each variables. 161
For the 620 species (two gymnosperm species were excluded owing to their low relatedness with most of 162
angiosperm species), a supertree was constructed using the software Phylomatic (Webb et al., 2008). The phylogenetic 163
backbone was based on the APG III tree (R20120829, http://phylodiversity.net/phylomatic/). We quantified the 164
strength of phylogenetic conservatism and tested the phylogenetic signal in seed mass using Pagel’s λ (Pagel, 1999) 165
and Blomberg’s K (Blomberg et al., 2003) calculated using the ‘phylosig’ function in the package ‘phytools’ v0.2-1 (R 166
Foundation, Vienna, Austria) (Revell, 2012). A λ or K of 0 indicates no phylogenetic signal (Pagel, 1999; Panchen et 167
al., 2015). Regression analyses were conducted between phylogenetic signal and longitude across the sites in five 168
community types. Using the phylogenetic tree with branch length, we calculated the phylogenetic diversity using the 169
measure PD, which was defined as the minimum total length of all the phylogenetic branches required to span a given 170
set of taxa on the phylogenetic tree (Faith, 1992). Taking mean seed mass as dependent variable and longitude 171
(including both linear and quadratic terms) and the phylogenetic diversity measure PD as independent variables, we 172
built a linear model using R package stats (R Core Team, 2018). 173
We considered the relations between the number of species with fleshy fruits and longitude, the number of 174
https://doi.org/10.5194/bg-2019-479Preprint. Discussion started: 8 June 2020c© Author(s) 2020. CC BY 4.0 License.

8
families, number of genera, and the phylogenetic diversity PD. Since there are strong correlations between the latter 175
four variables (r > 0.67, p < 0.001), they cannot be used in the same model. Therefore, we built four models. Each took 176
one of the four variables as the independent variable and the number of species with fleshy fruits as dependent variable. 177
A generalized linear regression model with Poisson family was fitted using R package stats (R Core Team, 2017). In 178
the model, we also included log (number of species) as offset. 179
180
3 Results 181
3.1 Seed mass variations along the longitudinal gradient 182
Although the majority of species had medium-sized seeds (Figure 1), variations among all species were great. There 183
were considerable differences in average seed mass and seed spectra among the five community types (Figure 2). 184
Forests have the largest average seed mass (23.45±18.34 mg) and both typical grasslands (4.75±3.93 mg) and sparse 185
forests (4.45±1.18 mg) have the lowest average seed mass, being nearly 5-fold decline in average seed mass from 186
forests to typical grasslands. Average seed mass of forests is significantly greater than that of the sparse forests 187
(F=12.13, p=0.0253), and deserts are remarkably larger (20.12±8.26 mg) than desert grasslands (10.08±2.34 mg) 188
(F=6.914, p=0.0466), being nearly 4.2-fold decline in average seed mass from deserts to typical grasslands. The 189
average seed mass of typical grasslands is significantly smaller than that of desert grasslands (F=11.92, p=0.0025), 190
while there is no significant difference between average seed mass of typical grasslands and sparse grasslands 191
(F=0.019, p=0.892). 192
193
3.2 Seed mass relations to other plant traits 194
Average seed mass of trees was significantly larger than that of shrubs (F=12.2, p=0.000), shrubs had larger seeds than 195
perennials (F=59.57, p=0.000), and average seed mass of perennials was larger than that of annuals (F=4.932, 196
p=0.0268) (Figure 3). From forests to grasslands, wooden species richness displayed a declining trend along 197
decreasing longitude (Table 2). 198
Seeds that are dispersed by vertebrates (232.09 ± 823.98mg) were significantly larger than those dispersed by 199
https://doi.org/10.5194/bg-2019-479Preprint. Discussion started: 8 June 2020c© Author(s) 2020. CC BY 4.0 License.

9
wind (2.46±6.23 mg) (F=238.2, p<0.0001), ants (3.56±10.03 mg) (F=17.73, p<0.0001), and those with unassisted 200
dispersal (7.42±12.08 mg) (F=17.73, p=0.000) and adhesive dispersal (5.07±8.12 mg) (F=17.73, p<0.0001) (Table 3). 201
Seed mass is weakly negatively correlated with leaf area (R2 = 0.063, p = 0.005) and not significantly correlated 202
with SLA across all sampled species (R2 = 0.006, p = 0.195). SLA is significantly related with leave area (R2 = 0.160, 203
p < 0.001). 204
205
3.3 Seed mass relations to environmental variables 206
Average seed mass was minimum at approximately 112 degrees longitude where typical grasslands occur (Figure 4). 207
However, phylogenetic diversity (PD) was not a significant explanatory variable (p > 0.8) (Figure 4). Linear regression 208
model shows that there is no significant decreasing trend from forests to deserts along declining longitude (F = 2.289, 209
p = 0.143). If the westernmost sample site (Ejinaqi) is excluded, seed mass significantly decrease inland (R2 = 0.2434, 210
F = 7.398, p = 0.012). 211
Significant negative relationships were found between seed mass and MAT (R2 = 0.1752, p = 0.01915) and 212
elevation (R2 = 0.1221, p = 0.0449) across all sample sites, but no significant relationships were found between seed 213
mass and latitude (R2 = -0.028, p= 0.576) and MAP (R2 = -0.008, p = 0.380). Across 23 sample sites from desert 214
through desert grassland to typical grassland, average seed mass had significantly negative relationship with longitude 215
(R2 = 0.232, p = 0.012) and MAP (R2 = 0.48, p = 0.00015), while across 20 sample sites from typical steppe to forests 216
average seed mass had significantly positive relationship with longitude (R2 = 0.232, p = 0.012) and MAP (R2 = 0.48, p 217
= 0.00015). Average seed mass was found to just be weakly positive relationship with MAT both from desert through 218
desert grassland to typical grassland and from typical grassland to the forests (R2 = 0.09207, p = 0.08665). According 219
to above analysis, MAP should be crucial environmental drive factor for seed mass variation. 220
In addition, average seed mass is significantly related with soil moisture (p<0.05) and soil moisture significantly 221
decrease with declining longitude from typical to desert grasslands. 222
223
3.4 Species richness and proportion of fleshy fruited species 224
https://doi.org/10.5194/bg-2019-479Preprint. Discussion started: 8 June 2020c© Author(s) 2020. CC BY 4.0 License.

10
Average seed mass of species with fleshy fruits (40.15 ± 110.41 mg) were significantly greater than that with dry fruits 225
(26.58 ± 286.97 mg) (F = 18.61, p = 0.0125) for the whole species pool (622 species), for the five community types 226
(Figure 3, SP 1) and for each sites (SP 2) (Figure 4). 227
Among the five community types, forests have the highest number (7.44 ± 1.26) and proportion (28.05 ± 6.16) of 228
fleshy fruited species, while desert grasslands have the lowest number (0.06 ± 0.097) and typical grasslands the lowest 229
proportion (1.00±1.49) (Figure 6). Fleshy fruited species richness (F = 22.25, p = 0.00919) and proportion (F = 18.61, 230
p = 0.0125) in sparse forests are significantly smaller than those in forests. The desert has higher fleshy fruited species 231
richness (F = 6.081, p = 0.0239) and proportion (F = 24.9, p < 0.0001) than desert grasslands. Sparse forests have 232
remarkably higher fleshy fruited species richness (F = 281.3, p= 0.000) and proportion (F = 78.6, p = 0.0009) than 233
typical grasslands (Figure 6). 234
235
3.5 Fleshy fruited species relations to environmental factors 236
Fleshy fruited species richness was significantly associated with longitude (R2 = 0.1691, p = 0.02113) and MAP (R2 237
= 0.4749, p = 0.0000) across the 26 sample sites. Significantly positive correlation existed between the proportions of 238
species with fleshy fruits and MAT (R2 = 0.1172, p = 0.0486), while the correlation with elevation (R2 = 0.0938, p = 239
0.0703) and longitude (R2 = 0.0831, p = 0.0832) was weak. In addition, there were no significant relationships between 240
proportions of fleshy fruited species and latitude (R2 = -0.0396, p = 0.8272) as well as MAP (R2 =- 0.0389, p = 0.8009), 241
and no strong relationships between fleshy fruited species richness and latitude (R2 = 0.0408, p = 0.8899) as well as 242
MAT (R2 = 0.0414, p = 0.9416). 243
From desert through desert grassland to typical grassland, significantly positive correlations were found between 244
richness of fleshy fruited species and longitude (R=0.3466, p=0.0019) and MAP (R2 = 0.284, p = 0.0052), while there 245
were no significant correlations between proportion of fleshy fruited species and MAT (R2 = 0.1295, p = 0.0513). From 246
typical grassland to the forests, remarkable correlations occurred between proportion of fleshy fruited species and 247
longitude (R2 = 0.324, p= 0.00418) and MAP (R2 = 0.324, p= 0.00418), however no significant relationships were 248
found between MAT and proportion (R2=-0.0519, p=0.9065) and species richness (R2 = -0.0522, p = 0.93) of fleshy 249
https://doi.org/10.5194/bg-2019-479Preprint. Discussion started: 8 June 2020c© Author(s) 2020. CC BY 4.0 License.
11
fruited plants. The number of species with fleshy fruits increased with longitude (p = 0.022) and number of families (p 250
= 0.005), but correlations with number of genera and phylogenetic diversity were not significant (p = 0.056 and 0.058 251
respectively) (Figure 5, c-d). 252
253
3.6 Phylogenetic signals and their shift along longitudinal gradient 254
Most phylogenetic signals (k values) are weak (from 0.234 to 0.688, p > 0.05) for the five community types and for 255
most sample plots except Naimanqi (1.928, p < 0.05) in early-successional stage. No significant relationships are found 256
between phylogenetic signals (k values) and longitude across 26 sample sites (R = 0.0403, p = 0.8596). Both from 257
desert (to desert grasslands) to typical grasslands (R = 0.047, p = 0.9123) and from typical grasslands to the forests (R 258
= 0.0401, p = 0.6382), phylogenetic signals were not related to longitude for the five community types. Positive 259
relationships between longitude and number of families or species with fleshy fruits are significant (p = 0.022 and 260
0.005 respectively, Figure 5), and number of species and families with fleshy fruits increased as longitude increased. 261
However, relationships between number of genera or genetic diversity and longitude are not significant (p = 0.056 and 262
0.058), respectively (Figure 4). 263
264
4 Discussion 265
4.1 Variation of seed mass spectra and environmental factors 266
There is strong and consistent effect of community type (along a longitudinal gradient) on seed mass (Figure 2, Figure 267
4). The average seed mass display a significantly declining trend along decreasing longitude from forests to typical 268
grasslands and then to some sites in desert grasslands (Figure 4), however, mean seed masses increased from typical 269
grasslands to desert grasslands and desert ecosystems and then to forests (Figure 2), showing congruent distribution 270
patterns to plant growth forms (Table 2). MAT and MAP may be responsible for the results because of the significant 271
relationships between seed mass and MAT and MAP across 26 or 23 sample sites respectively (see results). This 272
indicates that climatic control of vegetation trait distribution in Inner Mongolia is not only by temperature but also by 273
precipitation (Moles et al., 2014). The combined effects of precipitation and temperature may be, to some extent, most 274
https://doi.org/10.5194/bg-2019-479Preprint. Discussion started: 8 June 2020c© Author(s) 2020. CC BY 4.0 License.

12
important to certain vegetation syndromes such as seed mass and fruit water content. High water availability 275
potentially can produce high assimilation products and high temperature (in normal range of plant growth) can increase 276
water availability. 277
General linear models (GLMs) revealed significant relationships between seed mass and each of the variables 278
predicted to influence the longitudinal gradient in seed mass: plant growth form (99.76%), vegetation types (99.01%) 279
and seed dispersal syndrome (99.88%). Such patterns have previously been attributed mostly to a correspondence of 280
seed mass to plant growth form and seed dispersal syndrome, which themselves are driven by climatic and 281
environmental variations (Moles et al. 2005a; Moles et al. 2007). In Inner Mongolia, typical grasslands are often 282
composed mainly of grasses (many of which are biennial and perennial) that are small-seeded (Figure 3), whereas trees 283
and lianas that dominate forests and shrubs that dominate deserts have the largest seeds (Figure 3). Large seeds were 284
proved to be often associated with woody growth forms (Salisbury, 1942; Baker, 1972; Silvertown, 1981; Mazer, 1989; 285
Jurado et al., 1991; Elenius and Torstensson 1991; Leishman and Westoby, 1994; Moles et al., 2005a; Moles et al., 286
2005b). This pattern is often attributed to woody plants’ better capability to take up (Schenk and Jackson, 2002; Li et 287
al., 2002; Qi et al., 2019) and store resources and to buffer effects of environmental variations on seed size (Weiner, 288
2004; Moles et al., 2005a), or to reduced evaporation for understory species (Yu et al., 2017). Surely, woody species, 289
on average, having larger leave, can produce more photosynthate to invest in seeds (Díaz et al., 2016). 290
It is possible that larger seeds are more common in drought-prone habitats most likely because they allow 291
seedlings to establish large root systems early, with a better chance of surviving drought (Baker, 1972; Salisbury, 1974). 292
In this study, desert grassland and desert ecosystems are found to be dominated by shrubs that often possess larger 293
seeds (Figure 3). These species are seldom exposed to strong interspecific competition or shading in Inner Mongolian 294
Plateau (Bai et al., 2008). In addition, relatively high species richness and the highest number of species occurred in 295
this typical steppe grassland (Table 2), and in contrast, desert steppe had very low species richness and number of 296
individuals (abundance) (Table 2). 297
With increasing MAP, richness of wind dispersed species decreased (S3, S4). The proportion of vertebrate 298
dispersed species in typical grasslands was the lowest in comparison to other communities (S4). The patterns of seed 299
https://doi.org/10.5194/bg-2019-479Preprint. Discussion started: 8 June 2020c© Author(s) 2020. CC BY 4.0 License.

13
dispersal syndromes observed in this study are congruent with previous findings in Australia’s subtropics (Butler et al., 300
2007). Biotic dispersal agents exert a strong selective pressure on angiosperm species with various seed size in Inner 301
Mongolian plateau, as evidenced by the evolution of a wide range of adaptations for animal dispersal. 302
303
4.2 Variation of fruit type spectrum and associations of seed mass with fruit types 304
Fleshy fruited species richness significantly corresponded to gradual changes of climate, especially for MAP (Table 1). 305
The smallest proportion of fleshy fruited species occurred in typical grasslands and desert grasslands (Figure 4), at the 306
middle zone of Inner Mongolia. Previous findings showed that fleshy fruited species were often associated with shaded 307
habitats, mature forests, tropical forests, regions with lower elevations and woody life form (summarized in Yu et al., 308
2017), indicating high canopy coverage and low evaporation (Fig.6) (Yu et al., 2017). The increasing prevalence of 309
fleshy-fruited species with increasing canopy coverage (Table 2) is probably related to the prominence of species with 310
larger seeds in such habitats. Previous hypotheses suggest that fleshy fruit evolution is related to water availability and 311
the ineffectiveness of wind-assisted dispersal beneath a dense canopy (Butler et al., 2007; Yu et al., 2017). The reduced 312
dispersal capability following from an increase in seed mass may be counterbalanced by evolution of traits mediating 313
seed dispersal by animals, such as fleshy fruits. Alternatively, increasing water availability may promote the evolution 314
of species with fleshy fruits (Yu et al., 2017) and large seeds. 315
316
4.3 Ecological and evolutionary drivers of seed mass variations 317
A consistent combination was found between possession of fleshy fruits and heavier seeds when comparing seed mass 318
among clades with fleshy and non-fleshy fruits (Figure 3, S1, S2). The results were largely in agreement with previous 319
findings (Eriksson et al., 2000; Butler et al., 2007; Bolmgren and Eriksson, 2010). A possible explanation may be that 320
woody species have larger internal water surpluses and photosynthate to invest in their seeds and fruits. Accordingly, 321
formation of seed mass may also be related to plant resource acquisition and allocation strategies or to allometric 322
growth of plant apparatus (Weiner, 2004; Price et al., 2007; Demalach and Kadmon, 2018). 323
As a result of evolution for high water availability, large seeds are often associated with low latitude (Moles et al., 324
https://doi.org/10.5194/bg-2019-479Preprint. Discussion started: 8 June 2020c© Author(s) 2020. CC BY 4.0 License.

14
2003) and low elevation (Bu et al., 2007), or with shaded habitats such as northern slopes (Csontos et al., 2004) and 325
closed vegetation (Mazer, 1989; Hammond and Brown, 1995) and with late successional stages (Hammond and Brown, 326
1995). All those phenomena indicate that seed mass may be related to low evaporation and high water availability in 327
plants (Fig.6). We suggest that, as an ecological strategy, the derivation and evolution of species with large seeds may 328
be due to improved water accommodation in plants by strong resource acquisition ability (such as having strong water 329
absorbing root system and advanced water conductive ability) or water retention ability (such as habituating shaded 330
environment or developing small, thick leaves and hair or waxiness on leaf to prevent water loss) (Baker, 1972; 331
Fonseca et al., 2000). Plant species have evolved various ecological strategies to match their environments (Laughlin, 332
2014). These strategies are manifested in many plant organs and traits. In the present study, seed mass is strongly 333
connected with other biological characteristics such as plant dispersal ability (SP 4, Table 3), fruit types and growth 334
forms. For example, there is rising trend in average leaf area (Wright et al., 2004) and water- conducting conduits 335
(Wheele et al., 2007; Zanne et al., 2014) along increasing longitude (or declining latitude and elevation). Seed mass 336
also is sure to be coordinated with conducting issues of plant apparatus (Wheele et al., 2007; Zanne et al., 2014). 337
Anatomical structures of lots of species indicated that the species with large seeds or fleshy fruits often have wide and 338
long vessel elements that can provide much more water (Carlquist, 1975; Zimmermann, 1983). As suggested before, 339
seed mass also is likely to be a result of co-evolution among various organs that determine plant responses to changing 340
abiotic factors (Díaz and Cabido, 1997; Sandel et al., 2010). 341
In light of growth allometry theory, average seeds mass variation should converge with community total biomass 342
(Demalach and Kadmon, 2018). Evidently, spatial distributions of community-level seed mass and NPP consistency 343
correspond (Moles and Westoby, 2003; Murray et al., 2003; Griffiths and Lawes, 2006; Chen et al., 2007; Chen et al., 344
2011). In Inner Mongolia ANPP (aboveground net primary production) and RUE (rain-use efficiency) increased indeed 345
in space across different communities or ecosystems with increasing MAP eastwards (Bai et al., 2008), showing 346
similar variation trend with average seed mass. Both soil moisture and soil nutrient (total N) was found to decrease 347
significantly in Inner Mongolia from east to west (Liu et al., 2017), showing similar variation trend with ANPP and 348
seed mass. Moreover, water retention of plants is becoming unfavorable with increase of evaporation westwards (Table 349
https://doi.org/10.5194/bg-2019-479Preprint. Discussion started: 8 June 2020c© Author(s) 2020. CC BY 4.0 License.
15
1). 350
In previous studies, soil moisture was found to not correlate with the relative abundance of fleshy-fruited species 351
due to low temperature on water availability constraints (Yu et al., 2017). As we know, seed plants employ two main 352
strategies to increase water use efficiency: one is to take up more water through root systems and the other is reducing 353
water loss through evapotranspiration. In our study, canopy coverage decreases from forests to sparse forests and then 354
to grasslands and desert grasslands (Table 2), leads to gradual reduction in fleshy-fruited or large-seeded species 355
richness (Fig.1, Table 2). However, since fleshy fruits have high water content and thus inquire higher plant internal 356
water content (Yu et al., 2017), we suggest the correspondence of seed size and fruit water content imply that some 357
species evolved to contain more water or photosynthate in multiple body parts. Furthermore, CO2 concentration is 358
generally the same everywhere although there is some small variation during growth seasons, its impact on seed mass 359
variation patterns should be expelled. Solar radiation is very similar along longitude especially among typical 360
grasslands, desert grasslands and deserts with similar elevation, its effect on seed mass variation should be partitioned 361
out. Therefore, combined with previous results of other studies, we deduce that drivers of seed mass spatial distribution 362
patterns include temperature, rainfall, solar radiation, soil moisture and nutrients, leaf area, canopy coverage and their 363
interactions, however, high water availability in plant body may be the most vital driving factor in shaping seed mass 364
spatial distribution. According to growth allometry, a fraction of photosynthate, coming from each increment of 365
temperature, rainfall, soil moisture and nutrients, leaf area, canopy coverage, is considered to be allocated to seeds. In 366
addition, biological structures (such as fair or waxiness on leaf to prevent water loss), that favor water retention in 367
plant body would also be useful in increasing seed mass or fruit water content. 368
Moreover, as suggested by previous works, transition between small and large seeds in response to environmental 369
variations should be genetically simple, involving suppression and re-expression of only a few genes (Wang et al., 370
2014; Zanne et al., 2014). On basis of the above all, we suggested that transition between dry fruits and fleshy fruits in 371
response to environmental variations may also be genetically simple, involving suppression and re-expression of only a 372
few genes. 373
Generally, seed mass is quite phylogenetically conservative (Lord et al., 1995). However, in this study, 374
https://doi.org/10.5194/bg-2019-479Preprint. Discussion started: 8 June 2020c© Author(s) 2020. CC BY 4.0 License.

16
phylogenetic signal is weak across the 26 sites (Table 1) and the five communities and found to be little involved in the 375
relationships between seed mass and longitude, MAP and MAT. This proves that the environment affects seed mass in 376
the community context independent of phylogenetic constraints. The five communities are in middle or late 377
successional stages in which the main construction process is competitive exclusion rather than environmental filtering 378
(Norden et al., 2012). 379
A simple mechanistic model is provided to explain average (or total) seed mass variation between communities 380
for one species as following: 381
( ), St ( ) 382
383
Sa is average seed mass of a community for one species (Fig.2), St is the total seed mass of all species in a community, 384
n is number of species in a community, Ci1 is the allometric growth coefficient (or allocation portion to seeds) that 385
differ among species. Bt is total biomass from photosynthate per species. Bid value is the biomass of photosynthate 386
related to water from conducting issues for one species, Bi0 is the biomass of photosynthate related to water from other 387
approach (for instances, lessening evaporation), Bl is the biomass of photosynthate related to leaf area (Fig.1). 388
In additions, abundant groundwater in the desert ecosystem (Heihe river runs through Ejinaqi, the westernmost 389
sample plot in this study, here Populus euphratica sparse forest even develops around the river) may be responsible for 390
the “strange” patterns about distribution of average seed mass and fleshy fruited species found in this study. In this 391
study, we just measure the soil moisture of top 10cm which mainly influence growth of herbs, but for the growth of 392
shrubs and trees, rich soil water below the depth of 10 cm in some area of Ejinaqi also is useful. Moreover, ecological 393
scale and environmental heterogeneity often affects results of functional traits along biogeographical gradients, so 394
further study may be necessary in larger scale (or large area) to identify the results of this article. 395
5 Conclusions 396
Mean seed mass, seed dispersal spectra, fruit type spectra and plant growth forms of five community types vary 397
significantly along a longitudinal gradient, with the lowest average seed mass and the smallest proportion of species 398
https://doi.org/10.5194/bg-2019-479Preprint. Discussion started: 8 June 2020c© Author(s) 2020. CC BY 4.0 License.

17
dispersed by vertebrates occurring at the middle longitude (typical grasslands). The selection for these propagule 399
attributes is most likely to be driven by environmental factors such as precipitation, temperature, soil moisture, soil 400
nutrient and underground water, as well as many biological factors such as canopy coverage, plant morphologies and 401
life-spans, dispersal syndromes, densities of competing plants, and growth forms, however, water availability 402
potentials and growth-allometry may be key drivers of seed-mass variation along climatic gradients or resource 403
gradients. Larger seeded species may have evolved due to high water availability and more photosynthate. Our 404
findings have important implications in understanding origin and evolution of species with large seeds or fleshy fruits. 405
Further studies are needed to better understand the combined effects of climate, soil and evolutionary history on seed 406
mass variations among plants. 407
408
Author contributions 409
S.L. Yu led data collection and analysis, conceived the idea and led manuscript writing. G.X. Wang and D.F. Li took 410
part in data collection and analysis. O. Katz assisted in manuscript writing. C.R. Liu carried out phylogenetic analysis. 411
QB Wang provided soil moisture data. M. Yue gave a critical revision suggestions on early draft. All authors 412
contributed critically to the drafts and gave final approval for publication. 413
414
Acknowledgements 415
This study was funded by the National Natural Science Foundation of China (No. 40771070,41171041) and Beijing 416
Natural Science Foundation (No. 5092015). 417
418
References 419
Ackerly, D. and Donoghue, M.: Leaf size, sapling allometry, and Corner's rules: phylogeny and correlated evolution in 420
maples (Acer). Am. Nat.,152, 767-791, 1998. 421
Adamskia, N. M. et al.: Local maternal control of seed size by KLUH/CYP78A5-dependent growth signaling. PNAS, 422
106, 20115-20120, 2009. 423
https://doi.org/10.5194/bg-2019-479Preprint. Discussion started: 8 June 2020c© Author(s) 2020. CC BY 4.0 License.

18
Bai, Y., Wu, J., Xing, Q., Pan, Q., Huang, J., Yang, D. and Han, X.: Primary production and rain use efficiency across a 424
precipitation gradient on the Mongolia plateau. Ecology, 89, 2140-2153, 2008. 425
Baker, H. G.: Seed weight in relation to environmental conditions in California. Ecology, 53, 997-1010, 1972. 426
Bolmgren, K. and Eriksson, O.: Fleshy fruits – origins, niche shifts, and diversification. Oikos, 109, 255-272, 2005. 427
Bolmgren, K. and Eriksson, O.: Seed mass and the evolution of fleshy fruits in angiosperms. Oikos, 119, 707-718, 428
2010. 429
Bu, H., Chen, X., Xu, X., Liu, K., Jia, P. and Du, G.: Seed mass and germination in an alpine meadow on the eastern 430
Tsinghai–Tibet plateau. Plan Ecol., 191, 127-149, 2007. 431
Butler, D., Green, R. J., Lamb, D., McDonald, W. and Forster, P.: Biogeography of seed-dispersal syndromes, 432
life-forms and seed sizes among woody rain-forest plants in Australia's subtropics. J. Biogeogr., 34,1736-1750, 433
2007. 434
Carlquist S. Ecological Strategies of Xylem Evolution. University of California Press: Berkeley and Los Angeles, 435
1975. 436
Chen, B., Wang, S. Q., Liu R. G. and Song, T.: Study on Modeling and Spatial Pattern of Net Primary Production in 437
China' s Terrestrial Ecosystem. Res. Sci., 29, 47-53, 2007. 438
Chen, F., Shen, Y. J., Li, Q., Guo Y. and Xu, L. M.: Spatio-temporal variation analysis of ecological systems NPP in 439
China in Past 30 years. Sci. Geo. Sin. 31,1409-1414, 2011. 440
Csontos, P., Tamás, J. and Padani, J.: Slope aspect affects seed mass spectrum of grassland vegetation. Seed Sci. Res., 441
14, 379-385, 2004. 442
Demalach, N. and Kadmon, R.: Seed mass diversity along resource gradients: the role of allometric growth rate and 443
size-asymmetric competition. Ecology, 99, 2196-2206, 2018. 444
Demalach, N., Ron, R. and Kadmon, R.: Mechanisms of seed mass variation along resource gradients. Ecol. Lett., 22, 445
181-189, 2019. 446
Díaz, S. and Cabido, M.: Plant functional types and ecosystem function in relation to global change. J. Veg. Sci., 8, 447
463-474, 1997. 448
https://doi.org/10.5194/bg-2019-479Preprint. Discussion started: 8 June 2020c© Author(s) 2020. CC BY 4.0 License.

19
Díaz, S. et al.: The global spectrum of plant form and function. Nature, 529: 167-171, 2016. 449
Editorial Committee of Chinese Flora.: Flora of China. Science Press: Beijing. [in Chinese], 2004. 450
Eriksson, O., Friis, E. M. and Löfgren, P.: Seed size, fruit size, and dispersal systems in angiosperms from the Early 451
Cretaceous to the Late Tertiary. Am. Nat., 156, 47-58, 2000. 452
Faith, D. P.: Conservation evaluation and phylogenetic diversity. Biol. Conser., 61, 1-10, 1992. 453
Fonseca, C. R., Overton, J. M., Collins, B. and Westoby, M.: Shifts in trait–combinations along rainfall and phosphorus 454
gradients. J. Ecol., 88, 964-977, 2000. 455
Foster, S. and Janson, C. H.: The relationship between seed size and establishment conditions in tropical woody plants. 456
Ecology, 66, 773-780, 1985. 457
Garnier, E.: Growth analysis of congeneric annual and perennial grass species. J. Ecol., 80, 665-675, 1992. 458
Greene, D. F. and Johnson, E. A.: Seed mass and dispersal capacity in wind-dispersed diaspores. Oikos, 76, 211-220, 459
1993. 460
Griffiths, M. E. and Lawes, M. J.: Biogeographic, environmental, and phylogenetic influences on reproductive traits in 461
subtropical forest trees, South Africa. Ecography, 29, 614-622, 2006. 462
Hallett, L. M., Standish, R. J. and Hobbs, R. J.: Seed mass and summer drought survival in a Mediterranean-climate 463
ecosystem. Plant Ecol., 212,1479-1489, 2011. 464
Hammond, D. and Brown, V.: Seed size of woody plants in relation to disturbance, dispersal, soil type in wet 465
neotropical forests. Ecology, 76, 2544-2561, 1995. 466
Herrera, C. M.: Seed dispersal by vertebrates. In Plant–animal interactions: An evolutionary approach (eds. Herrera C. 467
M. et al.) 185-208. Blackwell Publishing: Oxford, 2005. 468
Howe, H. F. and Smallwood, J.: Ecology of seed dispersal. Ann. Rev. Ecol. and Syst., 13, 201-228, 1982. 469
Hughes, L., Dunlop, M., French, K., Leishman, M. R. and Rice, B., Rodgerson, L. and Westoby, M.: Predicting 470
dispersal spectra: a minimal set of hypotheses based on plant attributes. J. Ecol., 82, 933-950, 1994. 471
Jurado, E., Westoby, M. and Nelson, D.: Diaspore weight, dispersal, growth form and perenniality of central Australian 472
plants. J. Ecol., 79, 811-828, 1991. 473
https://doi.org/10.5194/bg-2019-479Preprint. Discussion started: 8 June 2020c© Author(s) 2020. CC BY 4.0 License.

20
Laughlin, D. C.: The intrinsic dimensionality of plant traits and its relevance to community assembly. J. Ecol., 474
102,186-193, 2014. 475
Leishman, M. R. and Westoby, M.: Hypotheses on seed size: tests using the semiarid flora of western New South 476
Wales, Australia. Am. Nat., 143, 890-906, 1994. 477
Li, H. L. et al.: Study on the root distribution characteristic and biomass of Ulmus pumila in Hunshandake Sands. J. 478
Arid Land Res. Environ., 16, 99-105, 2002. 479
Liu, D. W. et al.: Abiotic versus biotic controls on soil nitrogen cycling in drylands along a 3200km transect. 480
Biogeosciences, 14, 989-1001, 2017. 481
Liu, H. L., Zhang, D. Y., Duan, S. M., Wang, X.Y. and Song, M. F.: The relationship between diaspore characteristics 482
with phylogeny, life history traits, and their ecological adaptation of 150 species from the cold Desert of 483
northwest China. Sci. World J., 16, 436, 2014. 484
Lord, J., Westoby, M. and Leishman, M.: Seed size and phylogeny in six temperate floras: constraints, niche 485
conservatism, and adaptation. Am. Nat., 146, 349-364, 1995. 486
Mazer, S. J.: Ecological, taxonomic, and life history correlates of seed mass among Indiana dune angiosperms. Ecol. 487
Monograp., 59, 153-175, 1989. 488
Moles, A. T., Ackerly, D. D., Webb, C. O., Tweddle, J. C., Dickie, J. B. and Westoby, M.: A brief history of seed size. 489
Science, 307, 576-580, 2005a. 490
Moles, A. T., Acherly, D. D., Webb, C. O., Tweddle, J. C., Dickie, J. B., Pitman, A. J., Westoby, M.:. Factors that shape 491
seed mass evolution. PNAS, 102, 10540-10544, 2005b. 492
Moles, A.T., Perkins, S. E., Laffan, S.W., Flores–Moreno, H., Awasthy, M., Tindall, M. L., Sack, L., Pitman, A., Kattge, 493
J. and Aarssen, L. W.: Which is a better predictor of plant traits: temperature or precipitation? J. Veg. Sci. 494
25:1167-1180, 2014. 495
Moles, A. T., Ackerly, D. D., Tweddle, J. C., Dickie, J. B., Smith R., Leishman, M. R., Pitman, M. M., Mayfield, A., 496
Wood, J. and Westoby, M.: Global patterns in seed size. Glob. Ecol. Biogeogr., 16, 109–116, 2007. 497
Murray, B. R., Brown, A. and Grace, J.: Geographic gradients in seed size among and within perennial Australian 498
https://doi.org/10.5194/bg-2019-479Preprint. Discussion started: 8 June 2020c© Author(s) 2020. CC BY 4.0 License.

21
Glycine species. Aus. J. Bot. 51, 47-56, 2003. 499
Murray, B. R., Brown, A., Dickman, C. and Crowther, M.: Geographical gradients in seed mass in relation to climate. J. 500
Biogeogr., 31, 379-388, 2004. 501
Nimon, K., Oswald, F. and Roberts, J. K.: yhat: Interpreting Regression Effects. R package version 2.0-0. 502
https://CRAN.R-project.org/package=yhat, 2013. 503
Norden, N., Letcher, S. G., Boukili, V., et al.: Demographic drivers of successional changes in phylogenetic structure 504
across life-history stages in plant communities. Ecology, 93, S70-S82, 2012. 505
Price, C. A., Enqist, B. J. and Savage, V. M.: A general model for allometric covariation in botanical form and function. 506
PNAS, 104, 13204–13209, 2007. 507
Primack, R. B.: Relationships among flowers, fruits and seeds. Ann. Rev. Ecol. Syst., 18, 409-430, 1987. 508
Qi, K. et al.: Root distribution characteristics of Ammopiptanthus mongolicus community in Ulan Buh Desert. 509
–Pratacultu.Sci., 36, 1706-1715, 2019. 510
R Core Team: R: A language and environment for statistical computing. R Foundation for Statistical Computing, 511
Vienna, Austria. URL https://www.R-project.org/, 2017. 512
Revell, L. J., Harmon, L. J.,Collar, D. C.: Phylogenetic signal, evolutionary process, and rate. Syst. Biol., 57, 591-601, 513
2008. 514
Salisbury, E. J.: The productive capacity of plants. London: G. Bell and Sons., 1942. 515
Salisbury, E. J.: Seed size and mass in relation to environment. Proc. Roy. Soc. London Seri. B. Biol. Sci. 186, 83-88, 516
1974. 517
Sandel, B., Goldstein, L. J., Kraft, N. J., Okie, J. G., Shuldman, M. I., Ackerly, D. D., Cleland, E. E. and Suding, K. N.: 518
Contrasting trait responses in plant communities to experimental and geographic variation in precipitation. New 519
Phytol., 188, 565-575, 2010. 520
Schenk, H. J. and Jackson, R. B.: Rooting depths, lateral root spreads and below-ground/above-ground allometries of 521
plants in water-limited ecosystems. J. Ecol., 90, 480-494, 2002. 522
Silvertown, J. W. : Seed size, life span, and germination date as coadapted features of plant life history. Am. Nat., 118, 523
https://doi.org/10.5194/bg-2019-479Preprint. Discussion started: 8 June 2020c© Author(s) 2020. CC BY 4.0 License.

22
860-864, 1981. 524
Tautenhahn, S., Heilmeier, H., Go tzenberger, L., Klotz, S., Wirth, C. and Ku hn I. On the biogeography of seed mass 525
in Germany - distribution patterns and environmental correlates. Ecography, 31, 457-468, 2008 526
Telenius, A. and Torstensson, P.: Seed wings in relation to seed size in the genus Spergularia. Oikos, 61, 216-222, 527
1991. 528
Venable, D. L.: Size-number trade-offs and the variation of seed size with plant resource status. Am. Nat., 140, 529
287-304, 1992. 530
Wang, L., He, L. L., Li, J., Zhao, J., Li, Z. C. and He, C. Y.: Regulatory change at Physalis Organ Size 1correlates to 531
natural variation in tomatillo reproductive organ size. Nat. Commun. 5, 1-12, 2014. 532
Webb, C. O., Ackerly, D. D. and Kembel, S. W.: Phylocom: software for the analysis of community phylogenetic 533
structure and character evolution. Available at: http://www.phylodiversity.net/phylocom, 2008. 534
Weiner J.: Allocation, plasticity and allometry in plants. Perspec. Plant Ecol. Evol. Syst., 6, 207-215, 2004. 535
Westoby, M., Falster, D. S., Moles, A. T., Vesk, P. A. and Wright, I. J.: Plant ecological strategies: some leading 536
dimensions of variation between species. Ann. Rev. Ecol. Sys., 33,125-159, 2002. 537
Wheele, E. A.,Baas P. and Rodgers S. Variations in dicot wood Anatomy: a global analysis based on the inside wood 538
database. IAWA J., 28, 229-258, 2007. 539
Wright, I. J., Reich, P. B., Westoby, M., et al.: The worldwide leaf economics spectrum. Nature, 428, 821-827, 2004. 540
Yu, S. L., Katz, O., Fang, W. W., Li, D. F., Sang, W. G. and Liu, C. R.: Shift of fleshy fruited species along elevation: 541
temperature, canopy coverage, phylogeny and origin. Sci. Rep., 7, 40417, 2017. 542
Zanne, A. E., Tank, D. C., Cornwell, W. K. et al.: Three keys to the radiation of angiosperms into freezing 543
environments. Nature, 506, 12872, 2014. 544
Zimmermann, M. Xylem Structure and the Ascent of Sap. Berlin: Springer-Verlag, 1983. 545
546
547
548
549
https://doi.org/10.5194/bg-2019-479Preprint. Discussion started: 8 June 2020c© Author(s) 2020. CC BY 4.0 License.
587
588
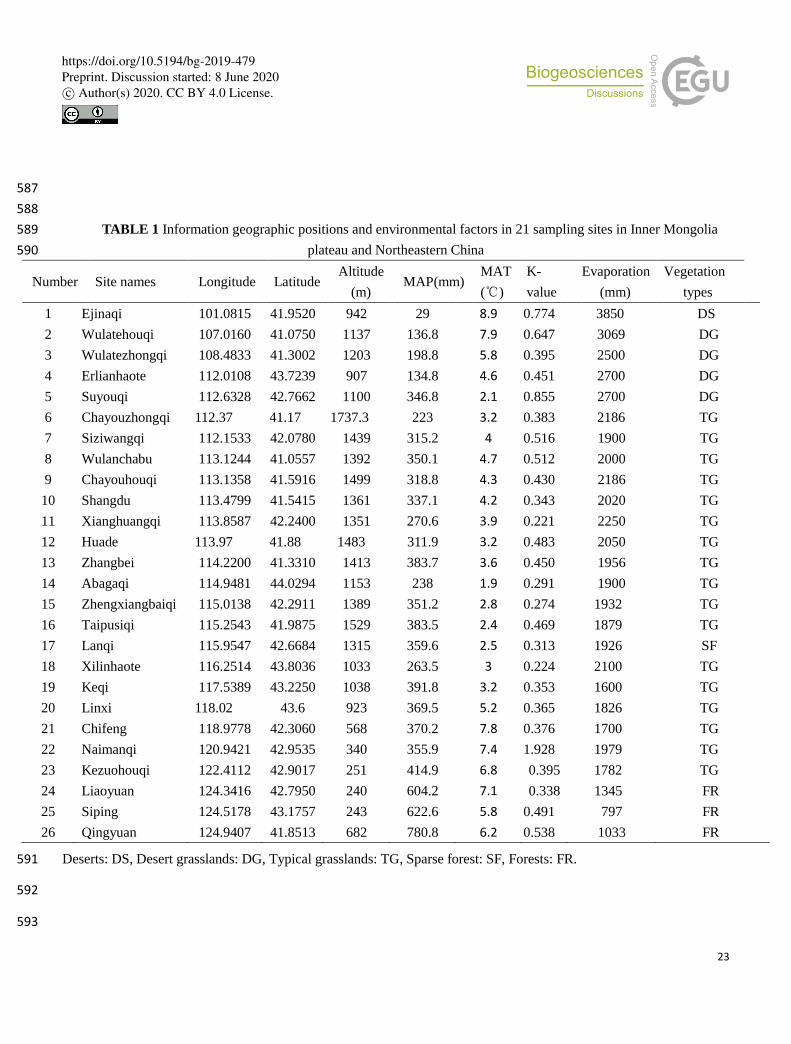
TABLE 1 Information geographic positions and environmental factors in 21 sampling sites in Inner Mongolia 589
plateau and Northeastern China 590
Number Site names Longitude Latitude Altitude
(m) MAP(mm)
MAT
(℃)
K-
value
Evaporation
(mm)
Vegetation
types
1 Ejinaqi 101.0815 41.9520 942 29 8.9 0.774 3850 DS
2 Wulatehouqi 107.0160 41.0750 1137 136.8 7.9 0.647 3069 DG
3 Wulatezhongqi 108.4833 41.3002 1203 198.8 5.8 0.395 2500 DG
4 Erlianhaote 112.0108 43.7239 907 134.8 4.6 0.451 2700 DG
5 Suyouqi 112.6328 42.7662 1100 346.8 2.1 0.855 2700 DG
6 Chayouzhongqi 112.37 41.17 1737.3 223 3.2 0.383 2186 TG
7 Siziwangqi 112.1533 42.0780 1439 315.2 4 0.516 1900 TG
8 Wulanchabu 113.1244 41.0557 1392 350.1 4.7 0.512 2000 TG
9 Chayouhouqi 113.1358 41.5916 1499 318.8 4.3 0.430 2186 TG
10 Shangdu 113.4799 41.5415 1361 337.1 4.2 0.343 2020 TG
11 Xianghuangqi 113.8587 42.2400 1351 270.6 3.9 0.221 2250 TG
12 Huade 113.97 41.88 1483 311.9 3.2 0.483 2050 TG
13 Zhangbei 114.2200 41.3310 1413 383.7 3.6 0.450 1956 TG
14 Abagaqi 114.9481 44.0294 1153 238 1.9 0.291 1900 TG
15 Zhengxiangbaiqi 115.0138 42.2911 1389 351.2 2.8 0.274 1932 TG
16 Taipusiqi 115.2543 41.9875 1529 383.5 2.4 0.469 1879 TG
17 Lanqi 115.9547 42.6684 1315 359.6 2.5 0.313 1926 SF
18 Xilinhaote 116.2514 43.8036 1033 263.5 3 0.224 2100 TG
19 Keqi 117.5389 43.2250 1038 391.8 3.2 0.353 1600 TG
20 Linxi 118.02 43.6 923 369.5 5.2 0.365 1826 TG
21 Chifeng 118.9778 42.3060 568 370.2 7.8 0.376 1700 TG
22 Naimanqi 120.9421 42.9535 340 355.9 7.4 1.928 1979 TG
23 Kezuohouqi 122.4112 42.9017 251 414.9 6.8 0.395 1782 TG
24 Liaoyuan 124.3416 42.7950 240 604.2 7.1 0.338 1345 FR
25 Siping 124.5178 43.1757 243 622.6 5.8 0.491 797 FR
26 Qingyuan 124.9407 41.8513 682 780.8 6.2 0.538 1033 FR
Deserts: DS, Desert grasslands: DG, Typical grasslands: TG, Sparse forest: SF, Forests: FR. 591
592
593
23
https://doi.org/10.5194/bg-2019-479Preprint. Discussion started: 8 June 2020c© Author(s) 2020. CC BY 4.0 License.

594
595
TABLE 2 Species richness (No./sample area) or percentages for woody plants and herbs as well as abundance 596
(individual/m2) in five ecosystem types 597
Ecosystem types Sites Woody
richness/percentage
Herbaceous
richness/percentage
Abundance
Canopy
coverages
(%)
Forests Qingyuan 11±2/40.0±4.5 16±1/60.0±4.5 30±9 80-90
Sparse forests
Typical steppe
Sanggendalai
Sanggendalai
5±2/18.0±5.2
1±1/6.67±4.44
24±2/82.0±5.2
19±5/93.3±4.4
126±8
458±54
20-40
5-10
Desert grasslands Erlianhaote 2±0/17.0±4.0 8±1/83.0±4.0 23±7 <5
Desert Ejina 2±0/55.7±10.4 2±1/44.3±10.4 3±4 <5
598
599
TABLE 3 Seed masses, species number and proportions of 5 dispersal types in the whole study area 600
Dispersal agent types Seed mass (mg) Species number Proportion in the whole (%)
Wind 2.46±6.23 279 44.86
Vertebrate 232.09 ± 823.98 66 10.61
Unassisted 7.42±12.08 70 11.25
Ants 3.56±10.03 195 31.35
Adhesive 5.07±8.12 12 1.93
Total 50.12±172.09 622 100
601
602
24
https://doi.org/10.5194/bg-2019-479Preprint. Discussion started: 8 June 2020c© Author(s) 2020. CC BY 4.0 License.

603
604
605
606
607
608
FIGURE 1 Mechanistic frameworks of large seed formation and then community average seed mass increment 609
process 610
High longitude
Shady slopes
or habitats
Low latitude
Low elevation
High coverage
canopy
Large leaf
area
Much plant
photosynthate
Allometric growth and
photosynthate allocation
Lower
evaporation
High water
availability
Species with
fleshy fruits
Large
seeded species
Woody
species
Having extensive roots
systems and large water-
conducting conduits
Average seed mass
increment of communities
seeded species
Other plant structures
that favor water utility
611
612
613
614
615
616
617
618 25
https://doi.org/10.5194/bg-2019-479Preprint. Discussion started: 8 June 2020c© Author(s) 2020. CC BY 4.0 License.
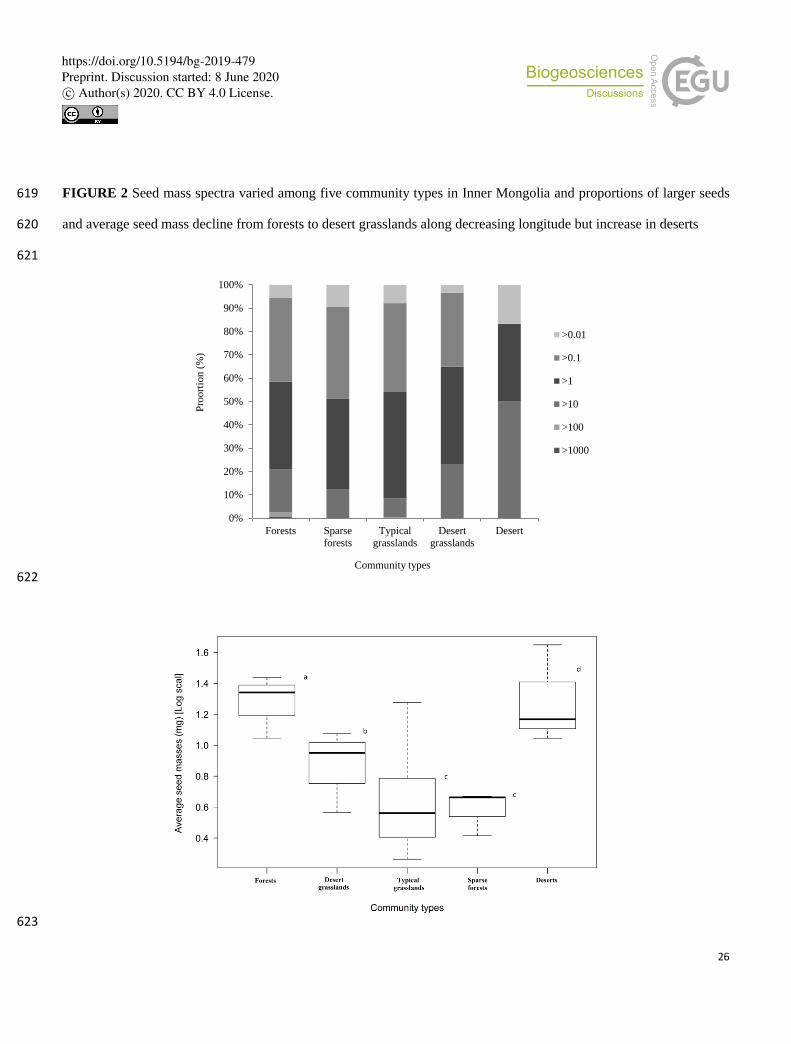
FIGURE 2 Seed mass spectra varied among five community types in Inner Mongolia and proportions of larger seeds 619
and average seed mass decline from forests to desert grasslands along decreasing longitude but increase in deserts 620
621
0%
10%
20%
30%
40%
50%
60%
70%
80%
90%
100%
Forests Sparse
forests
Typical
grasslands
Desert
grasslands
Desert
Pro
ort
ion
(%
)
Community types
>0.01
>0.1
>1
>10
>100
>1000
622
623
26
https://doi.org/10.5194/bg-2019-479Preprint. Discussion started: 8 June 2020c© Author(s) 2020. CC BY 4.0 License.

FIGURE 3 Trees (12 species) have largest average seed mass, followed by shrubs (65 species), lianas (15 species), 624
subshrubs (20 species), perennial herbs (396 species) and annuals (110 species). Average seed mass of fleshy fruits is 625
larger than that of dry fruits in each community type 626
627
628
a
b c
d e f
27
https://doi.org/10.5194/bg-2019-479Preprint. Discussion started: 8 June 2020c© Author(s) 2020. CC BY 4.0 License.

FIGURE 4 Average seed masses of communities in 26 sampling sites (except sites of deserts) decline along rising 629
longitude and no significant relationships occur between seed mass and phylogenetic diversity 630
631
632 28
https://doi.org/10.5194/bg-2019-479Preprint. Discussion started: 8 June 2020c© Author(s) 2020. CC BY 4.0 License.

FIGURE 5 Number of species with fleshy fruits rises in 23 sites (Ejinaqi, Wulatehouqi and Wulatezhongqi are not 633
included) rises along increasing longitude and no significant relationships are found with phylogenetic diversity 634
(families, genera and species) 635
636
(a) (b) 637
638
(c) (d) 639
640
641 29
https://doi.org/10.5194/bg-2019-479Preprint. Discussion started: 8 June 2020c© Author(s) 2020. CC BY 4.0 License.

FIGURE 6 Proportions and species richness of plants with fleshy fruits decline gradually from forests to desert 642
grasslands, but increase in deserts (DT: deserts, DTG: desert grasslands, TPG: Typical grassland, SFT: Sparse forests, 643
FT: forests) 644
645
646
30
https://doi.org/10.5194/bg-2019-479Preprint. Discussion started: 8 June 2020c© Author(s) 2020. CC BY 4.0 License.